Attached files
| file | filename |
|---|---|
| 8-K - 8-K - TE Connectivity Ltd. | a2199381z8-k.htm |
| EX-2.1 - EXHIBIT 2.1 - TE Connectivity Ltd. | a2199381zex-2_1.htm |
| EX-99.1 - EXHIBIT 99.1 - TE Connectivity Ltd. | a2199381zex-99_1.htm |
Exhibit 99.2
|
|
Tyco Electronics and ADC: Creating A Leading Global Provider of Broadband Connectivity July 13, 2010 |
|
|
Forward-Looking Statements / Non-GAAP Measures / Additional Information and Where To Find It Page 2 This presentation contains certain “forward-looking statements” within the meaning of the United States Private Securities Litigation Reform Act of 1995. These statements are based on management’s current expectations and are subject to risks, uncertainty and changes in circumstances, which may cause actual results, performance, financial condition or achievements to differ materially from anticipated results, performance, financial condition or achievements. All statements contained herein that are not clearly historical in nature are forward-looking and the words “anticipate,” “believe,” “expect,” “estimate,” “plan,” and similar expressions are generally intended to identify forward-looking statements. Tyco Electronics has no intention and is under no obligation to update or alter (and expressly disclaims any such intention or obligation to do so) its forward-looking statements whether as a result of new information, future events or otherwise, except to the extent required by law. The forward-looking statements in this presentation include statements addressing the transaction with ADC and our future financial condition and operating results. Examples of factors that could cause actual results to differ materially from those described in the forward-looking statements include, among others, business, economic, competitive and regulatory risks, such as developments in the credit markets; conditions affecting demand for products, particularly the automotive industry and the telecommunications, computer and consumer electronics industries; future goodwill impairment; competition and pricing pressure; fluctuations in foreign currency exchange rates and commodity prices; political, economic and military instability in countries in which we operate; compliance with current and future environmental and other laws and regulations; the possible effects on us of changes in tax laws, tax treaties and other legislation; the risk that the transaction may not be consummated; the risk that a regulatory approval that may be required for the transaction is not obtained or is obtained subject to conditions that are not anticipated; the risk that ADC will not be integrated successfully into Tyco Electronics; and the risk that revenue opportunities, cost savings and other anticipated synergies from the transaction may not be fully realized or may take longer to realize than expected. More detailed information about these and other factors is set forth in Tyco Electronics’ and ADC’s filings with the Securities and Exchange Commission (SEC), including Tyco Electronics’ and ADC’s most recent respective Annual Report on Form 10-K and subsequent Quarterly Reports on Form 10-Q, as well as the tender offer documents to be filed by Tyco Electronics and the solicitation/recommendation statement to be filed by ADC. Information about Tyco Electronics’ non-GAAP measures described in this presentation is included in the presentation and its Appendix. This presentation is for informational purposes only and does not constitute an offer to purchase or a solicitation of an offer to sell ADC common stock. The solicitation and offer to buy ADC common stock will only be made pursuant to an offer to purchase and related materials. Investors and security holders are urged to read these materials carefully when they become available since they will contain important information, including the terms and conditions of the offer. The offer to purchase and related materials will be filed by Tyco Electronics with the SEC and the solicitation/recommendation statement will be filed by ADC with the SEC, and investors and security holders may obtain a free copy of these materials (when available) and other documents filed by Tyco Electronics or ADC with the SEC at the website maintained by the SEC at www.sec.gov. The offer to purchase and related materials may also be obtained (when available) for free by contacting Keith Kolstrom, Senior Director, Investor Relations, Tyco Electronics at 610-893-9551. |
|
|
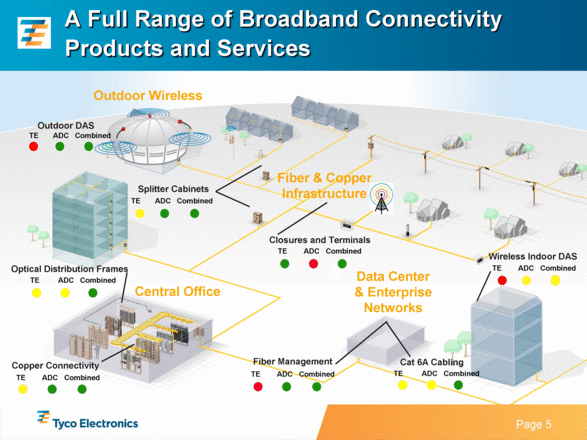
Acquisition of ADC Creates a World Leader in Broadband Connectivity The combination of Tyco Electronics and ADC creates a world leading product range in broadband network connectivity enabling every connection point in the network. Data traffic continues to grow, and is expected to quadruple over the next 4 years. This drives a need for more data centers, enterprise networks and upgrades to service provider networks. The addition of ADC’s Distributed Antenna System (DAS) products and technology significantly strengthens our wireless connectivity portfolio. Combined businesses will have strong positions in every major geographic market. Broadband connectivity revenues in excess of $3 billion for combined organization. Page 3 |
|
|
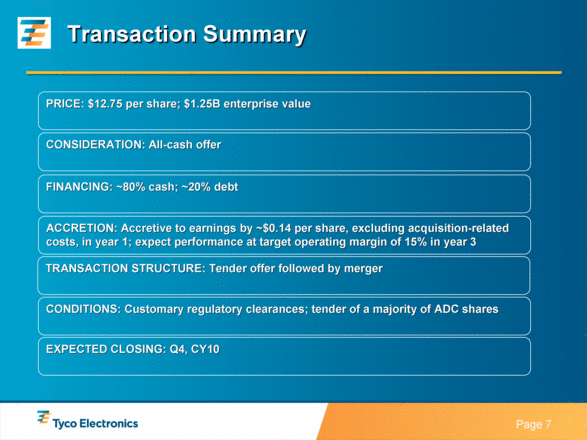
Acquisition Will Be a Significant Contributor to TE Earnings Growth Expected to be accretive to earnings by ~$0.14 per share in year 1, excluding acquisition-related costs Significant cost synergies Expect ADC to achieve company target operating margin of 15% in year 3 Continue to maintain a strong balance sheet with resources to pursue additional strategic opportunities and return capital to shareholders Page 4 |
|
|
A Full Range of Broadband Connectivity Products and Services Page 5 Data Center & Enterprise Networks Fiber & Copper Infrastructure Central Office Source: Company web-site, team analysis Copper Connectivity Fiber Management Cat 6A Cabling Shielded Unshielded Optical Distribution Frames NA ROW Splitter Cabinets Closures and Terminals Wireless Indoor DAS Outdoor Wireless Outdoor DAS TE ADC Combined TE ADC Combined TE ADC Combined TE ADC Combined TE ADC Combined TE ADC Combined TE ADC Combined TE ADC Combined |
|
|
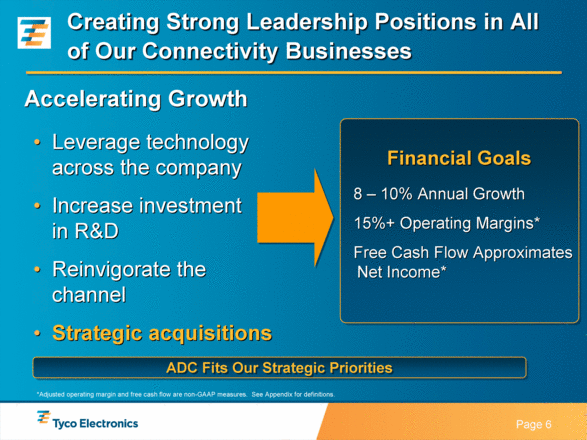
Creating Strong Leadership Positions in All of Our Connectivity Businesses Leverage technology across the company Increase investment in R&D Reinvigorate the channel Strategic acquisitions Page 6 Accelerating Growth 8 – 10% Annual Growth 15%+ Operating Margins* Free Cash Flow Approximates Net Income* Financial Goals *Adjusted operating margin and free cash flow are non-GAAP measures. See Appendix for definitions. ADC Fits Our Strategic Priorities |
|
|
Transaction Summary Page 7 PRICE: $12.75 per share; $1.25B enterprise value CONSIDERATION: All-cash offer TRANSACTION STRUCTURE: Tender offer followed by merger ACCRETION: Accretive to earnings by ~$0.14 per share, excluding acquisition-related costs, in year 1; expect performance at target operating margin of 15% in year 3 CONDITIONS: Customary regulatory clearances; tender of a majority of ADC shares EXPECTED CLOSING: Q4, CY10 FINANCING: ~80% cash; ~20% debt |
|
|
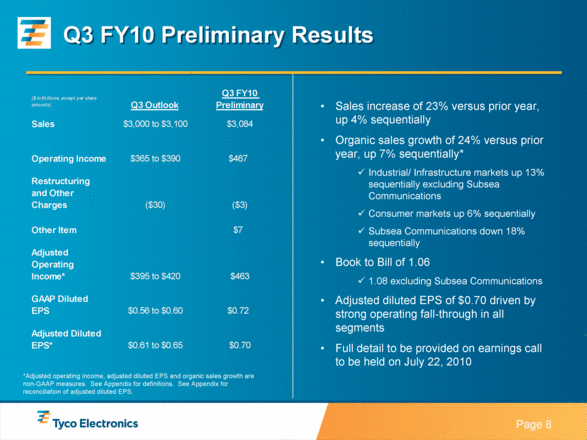
Q3 FY10 Preliminary Results Sales increase of 23% versus prior year, up 4% sequentially Organic sales growth of 24% versus prior year, up 7% sequentially* Industrial/ Infrastructure markets up 13% sequentially excluding Subsea Communications Consumer markets up 6% sequentially Subsea Communications down 18% sequentially Book to Bill of 1.06 1.08 excluding Subsea Communications Adjusted diluted EPS of $0.70 driven by strong operating fall-through in all segments Full detail to be provided on earnings call to be held on July 22, 2010 *Adjusted operating income, adjusted diluted EPS and organic sales growth are non-GAAP measures. See Appendix for definitions. See Appendix for reconciliation of adjusted diluted EPS. ($ in Millions, except per share amounts) Q3 Outlook Q3 FY10 Preliminary Sales $3,000 to $3,100 $3,084 Operating Income $365 to $390 $467 Restructuring and Other Charges ($30) ($3) Other Item $7 Adjusted Operating Income* $395 to $420 $463 GAAP Diluted EPS $0.56 to $0.60 $0.72 Adjusted Diluted EPS* $0.61 to $0.65 $0.70 |
|
|
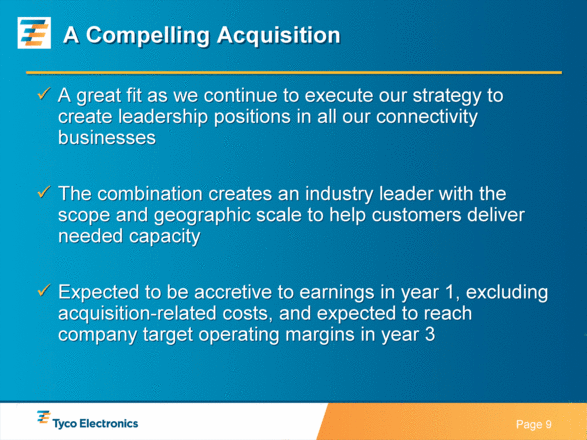
A Compelling Acquisition A great fit as we continue to execute our strategy to create leadership positions in all our connectivity businesses The combination creates an industry leader with the scope and geographic scale to help customers deliver needed capacity Expected to be accretive to earnings in year 1, excluding acquisition-related costs, and expected to reach company target operating margins in year 3 |
|
|
Q & A |
|
|
Appendix |
|
|
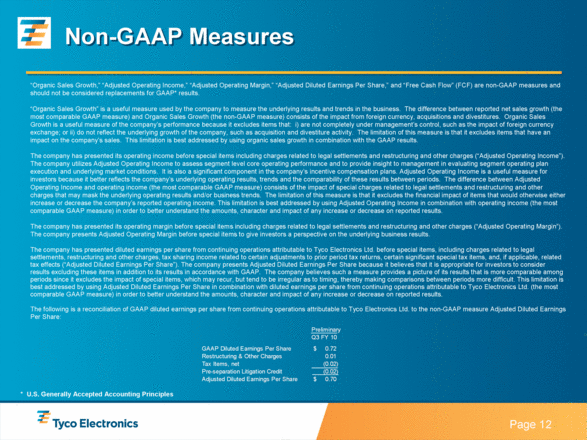
Non-GAAP Measures “Organic Sales Growth,” “Adjusted Operating Income,” “Adjusted Operating Margin,” “Adjusted Diluted Earnings Per Share,” and “Free Cash Flow” (FCF) are non-GAAP measures and should not be considered replacements for GAAP* results. “Organic Sales Growth” is a useful measure used by the company to measure the underlying results and trends in the business. The difference between reported net sales growth (the most comparable GAAP measure) and Organic Sales Growth (the non-GAAP measure) consists of the impact from foreign currency, acquisitions and divestitures. Organic Sales Growth is a useful measure of the company’s performance because it excludes items that: i) are not completely under management’s control, such as the impact of foreign currency exchange; or ii) do not reflect the underlying growth of the company, such as acquisition and divestiture activity. The limitation of this measure is that it excludes items that have an impact on the company’s sales. This limitation is best addressed by using organic sales growth in combination with the GAAP results. The company has presented its operating income before special items including charges related to legal settlements and restructuring and other charges (“Adjusted Operating Income”). The company utilizes Adjusted Operating Income to assess segment level core operating performance and to provide insight to management in evaluating segment operating plan execution and underlying market conditions. It is also a significant component in the company’s incentive compensation plans. Adjusted Operating Income is a useful measure for investors because it better reflects the company’s underlying operating results, trends and the comparability of these results between periods. The difference between Adjusted Operating Income and operating income (the most comparable GAAP measure) consists of the impact of special charges related to legal settlements and restructuring and other charges that may mask the underlying operating results and/or business trends. The limitation of this measure is that it excludes the financial impact of items that would otherwise either increase or decrease the company’s reported operating income. This limitation is best addressed by using Adjusted Operating Income in combination with operating income (the most comparable GAAP measure) in order to better understand the amounts, character and impact of any increase or decrease on reported results. The company has presented its operating margin before special items including charges related to legal settlements and restructuring and other charges (“Adjusted Operating Margin”). The company presents Adjusted Operating Margin before special items to give investors a perspective on the underlying business results. The company has presented diluted earnings per share from continuing operations attributable to Tyco Electronics Ltd. before special items, including charges related to legal settlements, restructuring and other charges, tax sharing income related to certain adjustments to prior period tax returns, certain significant special tax items, and, if applicable, related tax effects (“Adjusted Diluted Earnings Per Share”). The company presents Adjusted Diluted Earnings Per Share because it believes that it is appropriate for investors to consider results excluding these items in addition to its results in accordance with GAAP. The company believes such a measure provides a picture of its results that is more comparable among periods since it excludes the impact of special items, which may recur, but tend to be irregular as to timing, thereby making comparisons between periods more difficult. This limitation is best addressed by using Adjusted Diluted Earnings Per Share in combination with diluted earnings per share from continuing operations attributable to Tyco Electronics Ltd. (the most comparable GAAP measure) in order to better understand the amounts, character and impact of any increase or decrease on reported results. The following is a reconciliation of GAAP diluted earnings per share from continuing operations attributable to Tyco Electronics Ltd. to the non-GAAP measure Adjusted Diluted Earnings Per Share: * U.S. Generally Accepted Accounting Principles $ 0.70 Adjusted Diluted Earnings Per Share (0.02) Pre-separation Litigation Credit (0.02) Tax Items, net 0.01 Restructuring & Other Charges $ 0.72 GAAP Diluted Earnings Per Share Q3 FY 10 Preliminary |
|
|
Non-GAAP Measures (cont.) “Free Cash Flow” (FCF) is a useful measure of the company’s cash generation which is free from any significant existing obligation. The difference between cash flows from operating activities (the most comparable GAAP measure) and FCF (the non-GAAP measure) consists mainly of significant cash outflows that the company believes are useful to identify. FCF permits management and investors to gain insight into the amount that management employs to measure cash that is free from any significant existing obligation. The difference reflects the impact from: net capital expenditures, voluntary pension contributions, and cash impact of special items. Net capital expenditures are subtracted because they represent long-term commitments. Voluntary pension contributions are subtracted from the GAAP measure because this activity is driven by economic financing decisions rather than operating activity. The company forecasts its cash flow results excluding any voluntary pension contributions because it has not yet made a determination about the amount and timing of any future such contributions. In addition, the company’s forecast excludes the cash impact of special items because the company cannot predict the amount and timing of such items. The limitation associated with using FCF is that it subtracts cash items that are ultimately within management’s and the Board of Directors’ discretion to direct and that therefore may imply that there is less or more cash that is available for the company's programs than the most comparable GAAP measure. This limitation is best addressed by using FCF in combination with the GAAP cash flow results. FCF as presented herein may not be comparable to similarly-titled measures reported by other companies. The measure should be used in conjunction with other GAAP financial measures. Investors are urged to read the company’s financial statements as filed with the Securities and Exchange Commission. |

