Attached files
| file | filename |
|---|---|
| 8-K - FORM 8-K - Vantage Drilling CO | d8k.htm |
| EX-99.2 - PRESS RELEASE - Vantage Drilling CO | dex992.htm |
 July 2010
Investor Update: Mandarin
Acquisition
Exhibit 99.1 |
 Disclaimers
About this Presentation
This presentation does not constitute an offer to sell or the solicitation of an
offer to buy any securities. The information in this presentation is
current
only
as
of
the
date
on
its
cover.
For
any
time
after
the
cover
date
of
this
presentation,
the
information,
including
information
concerning
the
business, financial condition, results of operations and prospects of Vantage
Drilling Company (the “Company”), may have changed. The delivery of
this
presentation
shall
not,
under
any
circumstances,
create
any
implication
that
there
have
been
no
changes
in
the
Company’s
affairs
after
the
date
of this presentation.
The
Company
has
not
authorized
any
person
to
give
any
information
or
to
make
any
representations
about
the
Company
in
connection
with
this
presentation that is not contained in this presentation. If any information has
been or is given or any representations have been or are made to you outside
of this presentation, such information or representations should not be relied upon as having been authorized by the Company.
Industry and Market Data
The industry and market data contained in this presentation are based on and
derived from various public and, in some cases, non-public sources that
the Company believes to be reliable. However, certain industry and market data is subject to change and cannot always be verified with
complete certainty due to limits on the availability and reliability of raw data,
the voluntary nature of the data gathering process and other limitations and
uncertainties inherent in any statistical survey. Accordingly, you should be aware that the industry and market data contained in this
presentation, and estimates and beliefs based on such data, may not be reliable.
Although we believe such data and information to be accurate we have not
attempted to independently verify such information. Industry and market data involve risks and uncertainties and are subject to change
based on various factors.
Note
Regarding
Presentation
of
Non-GAAP
Financial
Measures
The
following
presentation
includes
certain
“non-GAAP
financial
measures”
as
defined
in
Regulation
G
under
the
Exchange
Act.
The
Appendix
at
the end of this presentation includes reconciliations of the non-GAAP financial
measures found in this presentation to the most directly comparable
financial measures calculated and presented in accordance with Generally Accepted
Accounting Principles in the United States. Our Form 8-K, dated July 7,
2010, provides further explanation and disclosure regarding our use of non-GAAP financial measures and should be read in
conjunction with these presentation slides. Our SEC filings, including that Form
8-K, can be found on the investor relations page of our website at
www.Vantagedrilling.com.
1 |
 Disclaimers (Cont’d)
2
Forward-Looking Statements
This presentation contains forward-looking statements within the meaning of Section 27A of the
Securities Act of 1933, as amended, and Section 21E of the Securities Exchange Act of 1934, as
amended (the “Exchange Act”). All statements, other than statements of historical facts, included herein are “forward-looking
statements.” Forward-looking statements may be identified by words such as
“expects,” “anticipates,” “intends,” “plans,” “believes,” “seeks,” “estimates,” “will” or
words of similar meaning and include, but are not limited to, statements about the expected
acquisition of the remaining interest in Mandarin Drilling Company and our future business,
financial condition and results of operations resulting from and following the proposed acquisition, including as set forth in the slide captioned
“Run-Rate Financial Potential of Vantage Owned Assets.” These statements are based
on the current expectations of our management and are inherently subject to uncertainties and
changes in circumstances. You are cautioned not to place undue reliance on these statements, the estimates, projections and other forward-
looking information in this presentation as they are based on current expectations and general
assumptions and are subject to various risks, uncertainties and other factors, including
factors relating to the fulfillment of certain closing conditions to the proposed transaction, effects of new rigs and new technology on the
market; effects on restrictions on offshore drilling, availability of capital and changes in global,
political, general economic, business, competitive and market conditions and those factors set
forth in our Form 10-K for the year ended December 31, 2009, and our Form 10-Q for the quarter ended March 31, 2010, and in
other documents we file with the SEC, many of which are beyond our control and which may cause actual
results to differ materially from the views, beliefs and estimates expressed herein. We
do not undertake any responsibility to revise or update any forward-looking statements contained herein.
All of the information set forth in the slide captioned “Run-Rate Financial Potential of
Vantage Owned Assets” is for illustrative purposes only and should not be relied upon as
(and is not) an indication of future performance. Our underlying assumptions may prove to be incorrect. Actual results will almost certainly differ,
and the variations between actual results and these assumptions may be material. We may achieve
materially lower dayrates, incur substantially more operating expenses and maintenance capital
expenditures and our asset utilization/efficiency could be materially lower. Due to the
variability of spot dayrates, we believe it is helpful to understand the effect on our run-rate financial potential that various jackup spot dayrates may
have. We do not, as a matter of course, make public projections as to future earnings or other
results. However, management has prepared the information set forth under
“Run-Rate Financial Potential of Vantage Owned Assets—Illustrative Range of Run-Rate Financial Potential” as an indicative analysis for the purpose
of illustrating the variability of our possible run-rate financial potential based on a range of
single jackup spot dayrates. The indicative analysis set forth in the slide captioned
“Run-Rate Financial Potential of Vantage Owned Assets” is not a financial forecast and does not comply
with the guidelines established by the American Institute of Certified Public Accountants with respect
to prospective financial information. However, we believe that our calculations were
prepared on a reasonable basis. THE ASSUMPTIONS AND ESTIMATES UNDERLYING THE INDICATIVE ANALYSIS ARE
INHERENTLY UNCERTAIN ALTHOUGH THEY ARE CONSIDERED REASONABLE BY OUR MANAGEMENT AS OF THE DATE
HEREOF. As the indicative analysis demonstrates, our possible results are subject to
great variability and are not predictable with any meaningful level of precision. Investors and potential
investors should recognize that actual performance could be materially worse than is illustrated in
the indicative analysis. Such adverse results could be driven by changes in the factors
and assumptions considered in the indicative analysis, and many of these factors and assumptions are beyond our control. |
 Transaction Overview
3 |
 Transaction Overview
Vantage Drilling Company (Ticker: VTG) ("Vantage" or the
"Company") is an international offshore drilling company operating
a fleet of high-specification drilling units Contracts
drilling
units,
related
equipment
and
work
crews
primarily
on
a
dayrate
basis
Additionally provides construction supervision services as well as management and
operations of drilling units owned by others
Total fleet of four jackups, two drillships, and two semisubmersibles
Five owned (four jackups, one drillship)
Three managed (one drillship, two semisubmersibles)
The
Company
currently
owns
a
45%
interest
in
Mandarin
Drilling
Company
(“Mandarin”),
which
owns the construction contract for a drillship, the Platinum Explorer, that
is to be delivered in November 2010
Vantage
has
an
agreement
to
purchase
the
remaining
55%
ownership
interest
in
Mandarin
from
F3 Capital
Vantage intends to finance the purchase of F3 Capital’s 55% ownership
interest in Mandarin and the remaining construction related payments on the
Platinum Explorer through a combination of notes, term loans, equity,
equity-linked securities and/or cash on hand, which may also include
refinancing some of its existing debt facilities 4
|
 Transaction Overview
($Millions)
Preliminary Sources & Uses of Funds and Pro Forma Capitalization
(1)
Conversion feature on Note is subject to shareholder approval.
(2)
Adjustment to common equity in pro forma column reflects equity and/or cash.
5
As of
Pro Forma
3/31/10
3/31/10
Cash
30
$
30
$
Restricted / Escrowed Cash
38
706
Issuer Debt:
Existing Credit Facilities
152
$
-
$
Debt Financing: Term Loan
-
300
Debt Financing: Notes
-
500
Total Issuer Debt
152
$
800
$
P2021 Notes
131
131
Aquamarine Note
103
103
Total Debt
386
$
1,034
$
Convertible Note and/or Cash to F3 Capital
(1)
-
60
Common Equity
(2)
746
806
Total Capitalization
1,132
$
1,900
$
Sources of Funds
Uses of Funds
Debt Financing: Term Loan
300
$
Platinum Shipyard, Equipment and Oversight
650
$
Debt Financing: Notes
500
Retire Outstanding Debt
152
Convertible Note and/or Cash to F3 Capital
(1)
60
Payment to F3 Capital for Mandarin
70
Equity and/or Cash
60
Interest Reserve / Working Capital
18
Estimated Fees & Expenses
30
Total Sources of Funds
920
$
Total Uses of Funds
920
$
|
 Transaction Overview
Owned Assets
($Millions)
Emerald Driller
Sapphire Driller
Aquamarine Driller
Topaz Driller
Platinum Explorer
Estimate of
Fair
Market
Value
(2)
$725 –
$775
$170 –
$190
$170 –
$190
$170 –
$190
$170 –
$190
$1,125
–
$1,215
FMV of Assets to be Included in Contemplated Financing
Ownership:
100%
(1)
100%
100%
100%
100%
(1)
Pro forma for the acquisition of remaining 55% of Mandarin.
(2)
Based on independent third party appraisals.
(3)
Management’s approximate estimated fair market value of capital spares, which
include extra riser equipment, thrusters and major BOP components.
Capital
Spares
(3)
:
$60
6 |
 Transaction Overview
Run-Rate Financial Potential of Vantage Owned Assets
($Millions, except per day figures)
Illustrative Range of Run-Rate Financial Potential (10)
7
Illustrative
Calculation
(1)
Single Jackup:
Spot Dayrate
(2)
140,000
$
Utilization / Efficiency (3)
90.0%
Annual Revenue
46.0
$
Operating Expenses per Day (4)
58,000
$
Annual Operating Expenses
21.2
Annual Jackup EBITDA
24.8
$
Annual Maintenance Capital Expenditures (5)
0.8
Annual Jackup EBITDA less Maint. Capex
24.1
$
Drillship:
Annual Contracted Dayrate
(6)
585,000
$
Utilization / Efficiency (7)
97.0%
Annual Revenue
207.1
$
Operating Expenses per Day (8)
156,000
$
Annual Operating Expenses
56.9
Annual Drillship EBITDA
150.2
$
Annual Maintenance Capital Expenditures (5)
3.7
Annual Drillship EBITDA less Maint. Capex
146.5
$
Assets in Contemplated Financing (2 Jackups, 1 Drillship) (9):
EBITDA
199.8
$
EBITDA less Maint. Capex
194.7
All Company Assets (4 Jackups, 1 Drillship) (9):
EBITDA
249.5
$
EBITDA less Maint. Capex
242.8
(1)
All annual calculations assume a 365-day year.
(2)
Management's estimate of current market potential based on the
approximate average dayrate for ultra-premium jackups in Q2 2010. Management believes this is a reasonable estimate of current market
potential because the fixtures on which the average is based represent
the most recently published leading edge dayrates for fixtures of comparable jackups.
(3)
Management's assumption of industry standard productive times on
high-specification jackups. Vantage’s fleet achieved approximately 97% productive time for Q1 2010 and approximately 99% productive
time in Vantage’s first 17 months of operation.
(4)
Vantage’s approximate average operating expense per day on its
jackup fleet for Q1 2010. Operating expenses include an assumed allocation for a portion of Vantage’s Singapore operations base.
(5)
Single jackup figure reflects management’s budgeted estimate for
2010. Drillship figure reflects management’s budgeted estimate for first year of the drillship’s operations based on $10,000 per day, which
management believes is a reasonable assumption for a newbuild drillship.
(6)
Actual contracted dayrate, excluding portion of dayrate attributable to
mobilization fee. (7)
Utilization assumption based on newbuild vessel fully under contract,
less assumed 3% reduction in utilization / efficiency. Management believes this is a reasonable assumption for a newbuild vessel in its first
full year of operations.
(8)
Assumed operating expenses per day based on management’s internally
generated projections for 2011. Operating expenses include an assumed allocation for a portion of Vantage’s Singapore operations base.
(9)
EBITDA and EBITDA less Maint. Capex figures exclude income from
management fees related to construction management contracts and unallocated corporate SG&A (estimated at $17-$20 million per year
based on management’s internally generated projections for 2011).
(10)
For purposes of this chart, the company used the methodology set forth
in the Illustrative Calculation. The only calculation parameter that varies from the Illustrative Calculation is the single jackup spot dayrate.
Range of dayrates in this chart reflects approximate historical range
for similar assets over the last two years. |
       8
?
Premium high-specification drilling units, including four jackup rigs, two
drillships and two semisubmersibles
?
Vantage’s rigs are capable of drilling to deeper depths and possess enhanced
operational efficiency and technical capabilities, resulting in higher
utilization, dayrates and margins ?
Management estimates fair market value of $360 million for two jackups and $810
million for the Platinum Explorer
?
Successful track
record
of
managing,
constructing,
marketing
and
operating
offshore
drilling
units
?
In-house team of engineers and construction personnel overseeing complex
construction projects ?
All jackups delivered on budget and on time
?
Jackup fleet has experienced approx. 99% of productive time for Vantage’s
first 17 months in operation Level of efficiency is exceptional for
newly-constructed jackup rigs upon commencement of contract ?
Significant cash flow visibility
?
Owned fleet contract backlog of approximately $1.3 billion and managed fleet
contract backlog of approximately $2.5 billion as of March 31, 2010
Owned fleet counterparties include Pearl Energy, VAALCO Energy, Foxtrot
International, ENI, Nido Petroleum,
Phu
Quy
(1)
and
ONGC
Managed deepwater rigs counterparties include PEMEX and Petrobras
Company Highlights
Premium Fleet and
Strong Collateral
Coverage
Premium Fleet and
Strong Collateral
Coverage
Proven Operational
Track
Record
Proven Operational
Track
Record
Significant
Contract Coverage
with
High Quality
Counterparties
Significant
Contract Coverage
with
High Quality
Counterparties
(1)
PVEP Phu Quy Petroleum Operating Co. Ltd. is a joint venture interest
between PetroVietnam Exploration Production Corp. and Total E&P Vietnam. |
 Company Highlights (Cont’d)
Three construction management arrangements for one ultra-deepwater drillship
(DragonQuest) and two 6th generation semisubmersibles
Approximately $5.0 million of annual cash flow per contract during the
construction phase Management of drillship and semisubmersible operations
once in service Approximately $13.0 to $15.0 million per year per contract
for the duration of each contract Management team with extensive experience;
average of 28 years in the drilling industry Includes international and
domestic public company experience with industry-leading peers involving
numerous acquisitions and debt and equity financings
Experienced operating personnel already hired and crew member training ongoing for
Platinum Explorer
9
Construction
Supervision and
Management
Arrangements
Experienced
Management and
Operational Team |
 Company Overview
10 |
 Company Overview
11
Founded in September 2006 and completed its IPO in May
2007
Trades under ticker VTG with a current total
enterprise value of approximately $694 million
Current trading value reflects significant discount to asset value
Contracts offshore drilling units, related equipment and work crews on a dayrate
basis
Provides offshore rig construction supervision and
operations management services
Owns four newbuild
ultra-premium
high-specification jackups and pro forma
100% interest in the newbuild
drillship, the Platinum Explorer
Four jackups have been delivered on time and within budget
Provides construction and operating management
services
Three ultra-deepwater rigs: one drillship and two semisubmersibles
Approximately $5.0 million of annual cash flow per contract during the
construction phase Approximately $13.0 – $15.0 million of annual cash flow per rig
during the operating phase
Structured as a combination of a fixed daily fee and a variable fee based on dayrate and annual cash
flow |
 Premium Newbuild
Fleet
Owned Fleet:
Four newbuild
ultra-premium high-specification Baker Marine Pacific Class 375
jackups Platinum
Explorer
–
ultra-deepwater
12,000
ft.
drillship
(equipped
for
first
contract
at
10,000
ft.)
•
The drillship is currently being constructed by Daewoo Shipbuilding & Marine
Engineering Co. Ltd. (“DSME”) Managed Fleet:
One ultra-deepwater 12,000 ft. drillship (under construction at DSME
Shipyard) Two
Moss
Maritime
CS50
MkII
6th
generation
10,000
ft.
semisubmersibles
(under
construction
at
Jurong
Shipyard)
Fleet Construction Cost ~ $4.5 Billion
Drillships
–
One Owned, One Managed
Semisubmersibles
–
Two
Managed
Jackups
–
Four Owned
12 |
 Worldwide Operations
Vantage Offices
Owned Rigs
Managed Rigs
Contract: PEMEX
Semi I
Mexico GOM
Contract: Petrobras
DragonQuest
U.S. GOM
Contract: ONGC
Platinum Explorer
India
Houston
Singapore
Dubai
Contract: Pearl
Emerald Driller
Thailand
Contract: Foxtrot
Sapphire Driller
Ivory Coast
Contract: VAALCO
Sapphire Driller
Gabon
Contract: Nido
Aquamarine Driller
Philippines
Contract: Phu
Quy
(1)
Topaz Driller
Vietnam
Country of Operation
13
(1) PVEP Phu Quy Petroleum Operating Co. Ltd. is a
joint venture interest between PetroVietnam Exploration Production Corp. and Total E&P Vietnam.
|
 Ultra-Premium Newbuild
Jackups
4 ultra-premium newbuild
jackups
100% owned by the Company
Total investment for each jackup
of approximately $230 million
Baker Marine Pacific Class 375 design
Drilling depth of 30,000 feet
Operate in up to 375 feet of water
All jackups
constructed at industry-leading PPL Shipyard in Singapore under
turnkey construction contracts
Emerald
Driller:
Delivered
and
operating
in
Southeast
Asia
Sapphire
Driller:
Delivered
and
operating
in
West
Africa
Aquamarine
Driller:
Delivered
and
operating
in
Southeast
Asia
Topaz
Driller:
Delivered
and
operating
in
Southeast
Asia
14 |
 Advantages of Ultra-Premium Jackups
The Baker Marine Pacific Class jackup
is capable of drilling in up to 375 feet of water and has a maximum
drilling depth of 30,000 feet
Dimensions
236’
x 224’
x 28’
208’
x 178’
x 23’
Water Depth (Max/Min)
375’
300’
Drilling Depth -
Ft
30,000
25,000
Cantilever Reach
75’
45’
Leg Length
506’
418’
Spudcan Diameter
55.5’
48’
Variable Deck Load (Operating)
7,497 kips
4,000 kips
Accommodations (Persons)
120
66
•
Faster drilling times
•
Faster moving times
•
Increased volumes of consumable liquids
and drilling fluids
•
Reduced boat runs and non-productive
time
•
Improved pipe handling and offline
capability
•
Fast preloading time for all tanks
•
75’
x 30’
cantilever reach substantially
greater than the industry average
•
Pipe decks allow increased storage capacity
•
Premium drilling package:
•
3 x 2200HP mud pumps
•
Integrated diverter system
•
18 ¾
BOP handling system and 4 rams
•
High-capacity,
high
efficiency
–
5
x
CAT
3516 B Diesel engines
Baker Marine Pacific Class 375
Standard 300’
Comparison of Vantage Ultra-Premium Jackup to Standard Jackup
Increased Operational Efficiency and Improved Technical Capability
15 |
 Ultra-Premium Jackup
Fleet
Emerald Driller
Sapphire Driller
Aquamarine Driller
Topaz Driller
Shipyard Delivery
December 2008
July 2009
September 2009
December 2009
Contract Details
Counterparty
Pearl Energy
VAALCO Energy; Foxtrot
International
Nido
Petroleum Limited
Phu
Quy
(2)
Commencement
Q1 2009
Q1 2010; Q3 2010
Q2 2010
Q1 2010
Length
2 years
5 months; 8 months
2 years
(1)
7 months
Average Drilling
Revenue per Day
$171,000
$115,500; $120,000
$120,000
$107,200
Gross Contract
Value
$126.5 million
$17.2 million; $28.4 million
$86.4 million
(1)
$22.5 million
(1)
The
contract
is
for
drilling
two
wells
plus
extended
well
tests.
Estimated
drilling
time
is
one
month
per
well
and
extended
well
tests
could
range
from
a
few
months
to
up
to
one
year
per
well.
The
first
extended
well
tests
period
has
been
contracted
through
April
2011.
(2)
PVEP
Phu
Quy
Petroleum
Operating
Co.
Ltd.
is
a
joint
venture
interest
between
PetroVietnam
Exploration
Production
Corp.
and
Total
E&P
Vietnam.
16 |
 Ultra-Deepwater Drillships
•
Ultra-deepwater drillships
Platinum Explorer
(100% pro forma ownership):
delivery Nov-10
DragonQuest
(managed):
delivery
Q3
2011
•
DSME proprietary hull design
Drilling depth of 40,000 feet
Designed to operate in up to 12,000 feet of water
Equipped to operate in up to 10,000 feet of water
•
Construction ongoing at DSME shipyard
Construction oversight ongoing at shipyard
•
Platinum
Explorer
contracted
for
5
years
to
ONGC
•
DragonQuest
contracted
for
8
years
to
Petrobras
17 |
 Platinum Explorer
General Specifications
Shipyard Delivery
November 2010
Design
DSME Ultra Deepwater Drillship
Dimensions
781’ x 137’ x 62‘
Water Depth
12,000 ft design / 10,000 ft equipped
Max. Drilling Depth
40,000 ft
Max. Wave Height
Normal Drilling: 15 ft, Max Operating: 24 ft
Drilling Equipment
Derrick
AKMH Pyramid Dynamic Derrick, 46 ft x 52 ft base x 210 ft
clear working height
Capacity
2 Million lbs Static Hook Load
Capacities
Diesel Fuel Oil
21,385 bbls
Heavy Fuel Oil
19,498 bbls
Drillwater
15,096 bbls
Fresh Water
8,176 bbls
Liquid Mud
20,127 bbls
Bulk Storage
31,783 ft³
Other
Accommodations
180 Persons
Shipyard: DSME, Okpo, Koje
Island, Korea
Total shipyard construction price: $630 million
Estimated additional $110 million of non-shipyard capital
expenditures to equip and commission the drillship for service
(includes approximately $60 million of major capital spare
components)
Vantage to become responsible for all construction costs following
acquisition of remaining 55% of Mandarin
18 |
 Platinum
Explorer
Construction
Status
Platinum
Explorer
as
of
May
2010
Overall Construction Progress (May 2010)
Source: DSME.
19 |
 Semisubmersibles
•
Two 6th generation semisubmersibles
•
Moss Maritime CS50 MkII
Drilling depth of 40,000 feet
Operate in up to 10,000 feet of water
•
Construction
ongoing
at
Jurong
Shipyard
Pte
Ltd,
Singapore
Semi
I
Delivery
Q4
2010
(PEMEX
/
five
years)
Semi
II
Delivery
Q3
2011
(Currently
marketing)
•
Construction
Management
Contracts:
Approximately
$5.0
million
of
annual
cash
flow per contract during the construction phase
•
Operating Management Contracts:
Approximately
$13.0
–
$15.0
million
of
annual
cash
flow
per
rig
Structured as a combination of a fixed daily fee and a variable fee based on
dayrate
and annual cash flow
20
:
: |
 Fleet Status –
Average Drilling Revenue /
Day
(1)
2 years at $171,000
6 months at $132,500
(2)
5 years at $590,500
5 years at $503,000
21
Ownership
2010
2011
2012
Rig
%
Q1
Q2
Q3
Q4
Q1
Q2
Q3
Q4
Q1
Q2
Q3
Q4
Jackups
Emerald Driller
100%
2 yrs. at $171K
Sapphire Driller
100%
5 mos. at $115.5K
8 mos. at $120K
Aquamarine Driller
100%
5 mos. at $154.2K
2 yrs. at $120K
(2)
Repriced
to Market Rate
Topaz Driller
100%
7 mos. at $107.2K
Drillships
Platinum Explorer
100%
(3)
5 yrs. at $590.5K
DragonQuest
Managed
8 yrs. at $551.3K
(4)
Semisubmersibles
Semi I
Managed
5 yrs. at $503K
Semi II
Managed
Construction
Commissioning/
Working
Operating
Option
Extended
Management
Mobilization
(Owned Rigs)
(Management
Contract
Well Test
Contract
Contract)
Option
(1)
Average drilling revenue per day is based on the total estimated revenue divided by the minimum number
of days committed in a contract. Unless otherwise noted, the total revenue includes any
mobilization and demobilization fees and other contractual revenues associated with the drilling
services. (2)
The contract is for drilling two wells plus extended well tests. Estimated drilling time is one month
per well and extended well tests could range from a few months to up to one year per well. The first
extended well tests period has been contracted through April 2011.
(3)
Pro forma for the acquisition of remaining 55% of Mandarin.
(4)
The drilling revenue per day includes the achievement of the 12.5% bonus opportunity, but excludes
mobilization revenues and revenue escalations included in the contract. |
 Contract Overview and Customer Credit
Profile
Vessel Name
Owned/
Managed
Contract Party
Contract Party
Credit Rating
(S&P/Moody’s)
Contract
Length
Average Drilling
Revenue Per
Day
(1)
Contract Value
(Gross)
Construction
Management
Fee
Operating
Management
Fee
Emerald
Driller
Owned
AA / Aa3
2 Years
$171,000
$126.5 million
N/A
N/A
Sapphire
Driller
Owned
N/A
A-
/ BBB+
(2)
1) 5 months
2) 8 months
1) $115,500
2) $120,000
1) $17.2 million
2) $28.4 million
N/A
N/A
Aquamarine
Driller
Owned
N/A
2 years
(3)
$120,000
$86.4 million
(3)
N/A
N/A
Topaz Driller
Owned
Phu
Quy
(4)
N/A
7 months
$107,200
$22.5 million
N/A
N/A
Platinum
Explorer
Owned
N/A / A2
5 years
$590,500
$1.1 billion
N/A
N/A
DragonQuest
Managed
BBB-
/ A3
8 years
$551,300
$1.6 billion
$5.0 million
annually
$13.0-15.0
million
annually
Semi I
Managed
BBB / Baa1
5 years
$503,000
$0.9 billion
$5.0 million
annually
$13.0-15.0
million
annually
Semi II
Managed
$5.0 million
annually
N/A
22
(1)
Average drilling revenue per day is based on the total estimated revenue divided by the minimum number
of days committed in a contract. Unless otherwise noted, the total revenue includes
any mobilization and demobilization fees and other contractual revenues associated with the drilling services.
(2)
Foxtrot International is owned by Bouygues Group, which has an A- rating from S&P and
BBB+ rating per Fitch. (3)
The contract is for drilling two wells plus extended well tests. Estimated drilling time is one month
per well and extended well tests could range from a few months to up to one year per well. The
first extended well tests period has been contracted through April 2011. (4)
PVEP Phu Quy Petroleum Operating Co. Ltd. is a joint venture interest between PetroVietnam Exploration
Production Corp. and Total E&P Vietnam. |
 Oil
and Natural Gas Corporation Founded
in
1956
and
based
in
Dehradun,
India,
ONGC
engages
in
the
exploration,
production, refining, marketing, and transportation of oil and natural gas in
India and internationally
Contributes over 80% of India’s oil and gas production
Market capitalization: $60 billion as of June 30, 2010
Rating: A2 (Moody’s)
Rig fleet: 31 jackups, 6 deepwater
Indian government owns a 74% stake in ONGC
2009-2010
E&P
spend
in
India
is
expected
to
reach
$8.6
billion,
and
expected
to
grow
18% for 2010-2011
(1)
(1)
Source: Offshore®.
23 |
 Business Strategy
•
Customer demand for new high-specification units supported by:
Need for rigs well-suited for drilling through deep and complex formations and
drilling horizontally Enhanced efficiency providing faster drilling and
moving times Improved safety features and lower downtime for
maintenance •
Technological developments have made deepwater exploration more feasible and
cost-effective in recent years •
Water-depth capability and equipping of Vantage's ultra-deepwater drilling
units is attractive for customers Expect to provide significant advantages
in obtaining long-term deepwater drilling contracts in the future
•
International markets in the oil and gas industry exhibit less cyclicality than
the U.S. Gulf of Mexico market •
Internationally diverse platform reduces exposure to a single market
•
Through continued growth of presence in Asia and West Africa, intend to capitalize
on existing infrastructure to better serve customers and increase contract
backlog •
Focused on expanding relationships with national oil companies, major oil
companies, large independents and super-regionals
•
Expect to lead to longer-term contracts to build backlog
•
Strong
existing
relationships
have
contributed
to
large
existing
backlog
•
Growth through acquisitions of assets and other offshore drilling companies
•
Current construction management contracts provide potential acquisition
targets 24
Capitalize on Customer
Demand for High-Specification
Units
Focus on International Markets
Expand Deepwater Exposure
Expand Key Industry
Relationships
Pursue Acquisition
Opportunities |
 Industry Overview
25 |
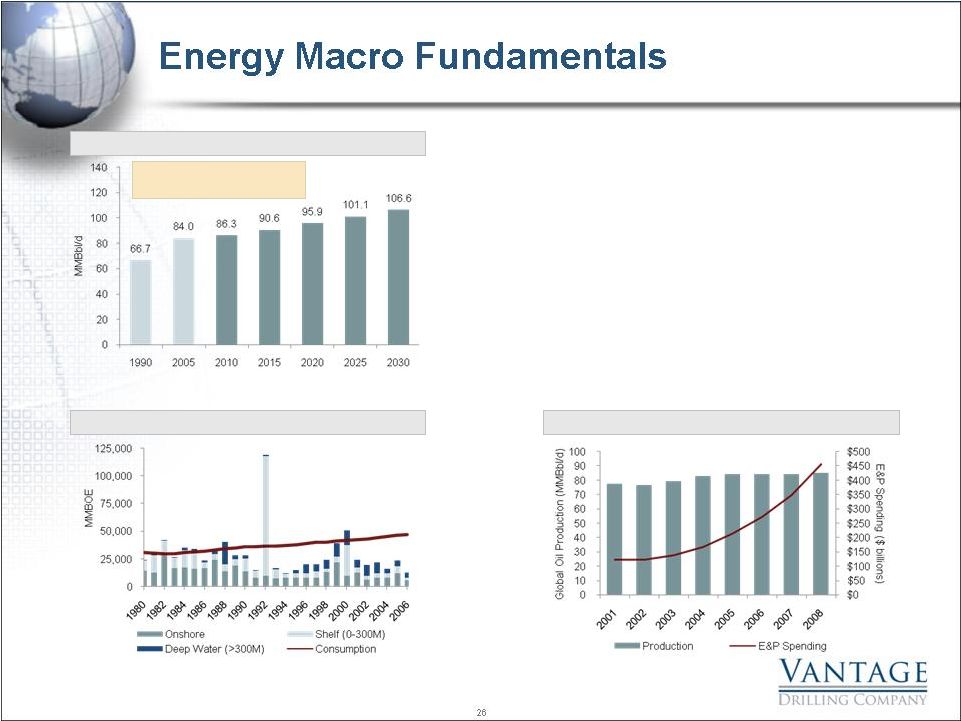 Gross Reserve Additions & Consumption
Global
Oil
Production
vs.
E&P
Spending
•
Despite the recent global economic slowdown, the rapid
development of some of the world’s most populous countries
will continue to drive long-term increase in global energy
demand
–
The EIA estimates long-term global demand for oil and
natural gas to grow at a CAGR of 0.9% and 1.6%,
respectively
•
While E&P spending has increased substantially, global oil
production has remained relatively constant over the past
decade
–
Since 1990, annual oil and gas reserve additions have fallen
short of global consumption in all but 2 years
•
Thus, significant capital expenditures will be required in the
future to replenish declining reserves
Demand is forecasted to
grow by 1.1% per year (2010
to 2030)
Worldwide Oil Demand
26
Source:
Barclays
Capital
E&P
Spending
Survey;
EIA;
ODS-PetroData. |
 Premium Asset Advantage
•
Premium
jackups
(350’
+
IC
rigs)
and ultra-deepwater
floater have
historically maintained
significantly higher utilization
levels, particularly during
downturns in the energy industry
–
Operators demand newer, higher
specification rigs due to superior
operating performance, resulting in
lower maintenance downtimes,
improved safety and higher efficiency
•
A higher utilization level in the
international drilling market
continues to reflect a more
stable rig supply and demand
environment than the Gulf of
Mexico
•
Operators are willing to pay a
substantial
dayrate
premium
for
high-specification rigs
Global Jackup
Utilization
International vs. GOM Jackup
Utilization
Source: Riglogix; ODS-PetroData.
Historical
Floater
Dayrates
($Thousands)
Historical Floater Utilization
27 |
 Premium Asset Advantage
International Jack-Up
Availability (Next 90 Days)
International Jack-Up Availability
(Next 90 Days) As % of Total Supply
Source: Riglogix.
After peaking at 35% of total supply in July 2009, the availability over the next
90 days for 350+ ft. IC jackups
located internationally has declined to approximately 25% currently
28 |
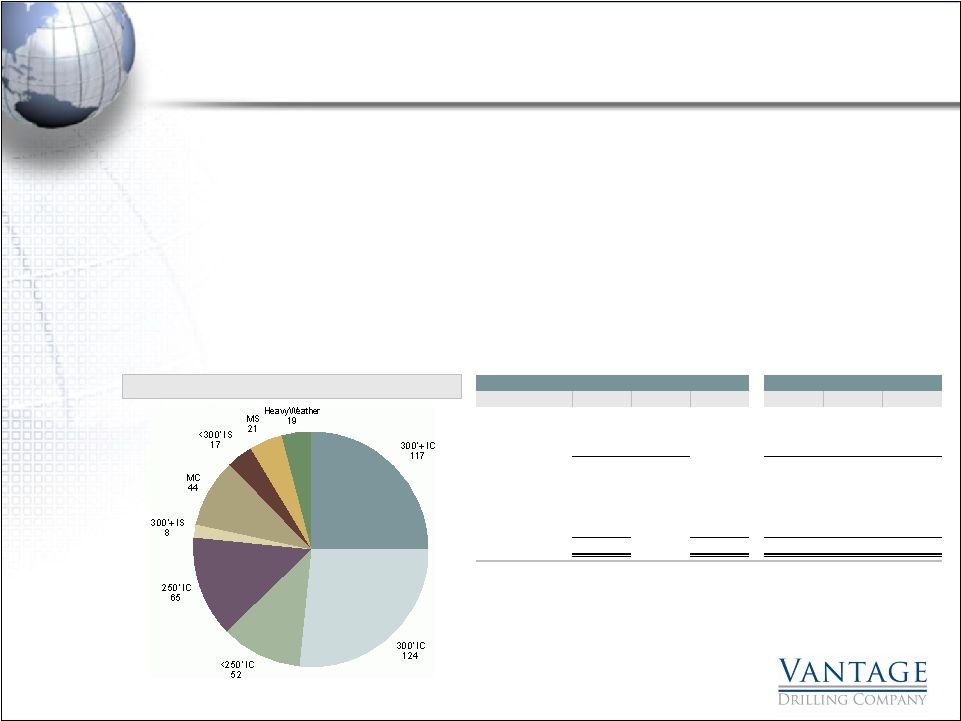 Profile of Global Jackup
Fleet
•
Capabilities
and
age
–
The
current
worldwide
fleet
is
comprised
mostly
of
older,
inefficient
rigs
–
27% of today’s jackups
are mat-supported and/or have less than 200ft of water depth capability
–
71% of today’s jackups
are 25 years or older
–
As of July 2010 a total of 127 rigs were either ready stacked, cold stacked, or in
an accommodation mode without contract –
How many will not return to service?
•
Setting
up
cyclical
recovery
–
Reduction
in
the
overall
fleet
should
result
in
pricing
power
and
high
utilization levels early on during the recovery
•
Age
is
a
factor
–
Demand
is
increasing
for
high-specification
jackups.
Many
customers
are
implementing age restrictions and new high-specification characteristics
Source: Riglogix.
Global Jackup
Fleet Distribution
29
Age
of
Jackup
Fleet
Water Depth (feet)
Age
Rigs
%
%
300+
200-299
<200
25 years or older
333
71%
64%
146
132
55
5 to 24 years
54
12%
10%
49
2
3
0 to 4 years
80
17%
15%
74
4
2
467
100%
269
138
60
2010 Deliveries
20
4%
14
4
2
2011 Deliveries
16
3%
16
0
0
2012 Deliveries
17
3%
16
1
0
520
100%
315
143
62 |
 Profile of Global Ultra-Deepwater Fleet
•
The ultra-deepwater rig market maintains the most favorable long-term
outlook driven by recent discoveries in Brazil, West Africa, and the U.S.
Gulf of Mexico •
Ultra-deepwater rigs are capable of working in any water depth where operators
are currently likely to drill •
Can compete for any available work, while lower water depth drilling rigs have a
more limited market •
Projections
indicate
a
shortage
of
rigs
designed
for
the
4,000
–
6,000’
water
depth
range
which
will
likely
be filled by ultra-deepwater units
Floater Rig Supply By Type (# of Rigs)
Ultra-Deepwater Floaters By Operator
(1)
Source: Riglogix.
(1)
Ultra-Deepwater
(>7,500
ft)
drillships
and
semisubmersibles
currently
in
operation.
(2)
Other
operators
with
1
rig
each
include:
Det
Norske
Oljeselskap,
Murphy,
Taylor,
Woodside,
PEMEX,
Tullow,
ExxonMobil,
Husky,
Repsol,
Cairn
Energy
and
ONGC
for
a
total
of
11
rigs.
(3)
Other operators with 2 rigs each include: BHP Billiton, Noble Energy, Marathon,
Nexen, ENI and Devon Energy for a total of 12 rigs. 30
Midwater
111
Deepwater
55
Ultra-
Deepwater
76
Petrobras
16
Total
8
BP
7
Chevron
6
Anadarko
6
Statoil
4
Shell
Reliance
3
Others
(2 Rigs)
12
Others
(1 Rig)
11
3 |
 Premium Jackup Fixtures
Source: Riglogix.
Highlight signifies PPL built, Baker Marine Pacific Class 375 design rigs.
Fixture Date
Manager
Rig Name
Rig Water
Depth (ft)
Operator
Region
Dayrate
Prior Dayrate
Contract Description
(At Delivery)
Start Date
Vessel Age
(Yrs)
Delivery
Date
17-Jun-10
Atwood
Atwood Beacon
400
Murphy
S America
115,000
$
115,000
$
10
months
4 wells
Sep-10
7.1
May-03
14-Jun-10
Atwood
Atwood Beacon
400
Edison
W Africa
115,000
110,000
2
months
1 well
Jul-10
7.1
May-03
9-Jun-10
PV Drilling
PV Drilling II
375
Hong Long POC
SE Asia
135,000
135,000
2
months
1 well
Aug-10
0.8
Sep-09
1-Jun-10
COSL
COSLBoss
400
Kangean Energy
SE Asia
158,000
198,000
8
months
5 wells + 2 options
Oct-10
2.4
Feb-08
25-May-10
Scorpion Offshore
Offshore Vigilant
350
Repsol YPF
S America
158,333
110,500
8
months
2 wells + 2x1 well options
Jul-10
1.8
Sep-08
25-May-10
Rowan
Rowan Gorilla V
400
Total
NW Europe
180,000
150,000
12
months
2 wells
May-11
11.6
Nov-98
24-May-10
Maersk Contractors
Maersk Convincer
375
Hoang Long JOC
SE Asia
137,000
175,000
3
months
1 well
Jun-10
1.8
Sep-08
17-May-10
Diamond Offshore
Ocean Scepter
350
OGX Petroleo
S America
130,000
100,000
12
months
1 year + 1-year option
Dec-10
2.1
May-08
16-Apr-10
Ensco
ENSCO 105
375
BG
Med/Black Sea
150,000
200,000
4
months
4 months
Oct-10
7.7
Oct-02
5-Apr-10
Aban Offshore
Deep Driller 1
375
GSPC
Indian Ocean
112,000
194,000
12
months
1 year + 2x6 month options
May-11
4.1
May-06
25-Mar-10
Scorpion Offshore
Offshore Resolute
350
Hoan Vu
SE Asia
135,000
146,250
2
months
1 well + 1 option
Jun-10
2.2
Apr-08
11-Mar-10
Egyptian Drilling
Sneferu
375
Maersk Oil
Middle East
80,000
NA
12
months
1 year + option(s)
Jun-10
0.5
Dec-09
1-Mar-10
Rowan
Gilbert Rowe
350
Maersk Oil
Middle East
75,000
75,000
12
months
1 year + 1 year option
May-11
28.7
Nov-81
1-Mar-10
Rowan
Rowan Paris
350
Maersk Oil
Middle East
75,000
75,000
12
months
1 year + 1 year option
Mar-11
29.7
Oct-80
17-Feb-10
Rowan
Rowan Gorilla VII
400
Apache
NW Europe
180,000
332,000
18
months
18 months + 2x6-month options
Mar-11
8.5
Jan-02
15-Feb-10
Transocean
GSF Constellation II
400
Pharaonic Petroleum
Med/Black Sea
109,000
109,000
12
months
4 wells + 3x1 well options
Apr-12
6.2
Apr-04
8-Feb-10
Seadrill
West Callisto
400
Premier
SE Asia
95,600
NA
9
months
8 wells + 5x1 well options
Mar-11
0.0
Jul-10
5-Feb-10
Diamond Offshore
Ocean Shield
350
Petronas Carigali
SE Asia
135,000
265,000
2
months
1 well
Apr-11
2.2
Apr-08
2-Feb-10
Seadrill
West Triton
375
Anadarko
SE Asia
139,500
116,000
2
months
1 well
Apr-10
2.5
Jan-08
2-Feb-10
Seadrill
West Triton
375
Twinza Oil
Indian Ocean
116,000
175,000
3
months
2 wells
Aug-10
2.5
Jan-08
1-Feb-10
Rowan
Rowan Gorilla V
400
Total
NW Europe
150,000
180,000
9
months
1 well
Jun-10
11.6
Nov-98
29-Jan-10
Scorpion Offshore
Offshore Mischief
350
Anadarko
S America
117,500
NA
7
months
3 wells + 3x1-well options
Feb-11
0.2
Apr-10
5-Jan-10
Vantage Drilling
Topaz Driller
375
PQPOC
SE Asia
119,000
115,000
7
months
3 wells + 1-well option
May-12
0.5
Dec-09
5-Jan-10
Diamond Offshore
Ocean Shield
350
Apache
Aus/NZ
100,000
265,000
12
months
1 year + 1-year option
Jan-11
2.2
Apr-08
4-Jan-10
PV Drilling
PV Drilling II
375
Lamson
SE Asia
125,000
NA
2
months
1 well
Jun-10
0.8
Sep-09
4-Jan-10
Vantage Drilling
Aquamarine Driller
375
Nido Petroleum
SE Asia
120,000
115,000
2
months
60 days + 10 mo. option + 12 mo. option
Oct-10
0.8
Sep-09
25-Nov-09
Ensco
ENSCO 101
400
Maersk Oil
NW Europe
170,000
279,000
4
months
2 wells + 1-well option
Apr-10
10.4
Feb-00
16-Nov-09
Ensco
ENSCO 100
350
GDF SUEZ
NW Europe
112,500
207,500
6
months
6 months + 6 months unpriced option
Nov-11
23.4
Feb-87
6-Nov-09
PV Drilling
PV Drilling II
375
KNOC
SE Asia
134,000
150,000
3
months
2 wells
Oct-10
0.8
Sep-09
23-Oct-09
Scorpion Offshore
Offshore Vigilant
350
EOG
C America
110,500
207,990
5
months
95-135 days
Jul-10
1.8
Sep-08
20-Oct-09
Vantage Drilling
Aquamarine Driller
375
Eni
Indian Ocean
115,000
NA
3
months
1 well
May-10
0.8
Sep-09
9-Oct-09
Noble
Noble Al White
360
Total
NW Europe
112,000
208,000
18
months
18 months + 1x6 month option
May-10
27.6
Dec-82
6-Oct-09
Seadrill
West Prospero
400
Red Sea Petroleum
Middle East
180,000
130,000
6
months
2 wells
Dec-09
3.0
Jun-07
1-Oct-09
ENSCO
ENSCO 106
400
Newfield
SE Asia
90,000
265,000
12
months
1 year + 1 year option
Oct-09
5.5
Jan-05
30-Sep-09
Atwood
Atwood Beacon
400
Hess
W Africa
110,000
113,000
9
months
6 wells + 6 x 1 well options
Oct-09
7.1
May-03
22-Sep-09
Rowan
Rowan Gorilla V
400
Total
NW Europe
180,000
180,000
12
months
1 year
Sep-09
11.6
Nov-98
2-Sep-09
Vantage Drilling
Sapphire Driller
375
Vaalco
W Africa
105,000
NA
5
months
4 wells + 2 x 1-well options
Dec-09
1.1
Jun-09
1-Sep-09
Transocean
GSF Constellation I
400
BP
C America
110,000
110,000
4
months
4 months
Sep-09
7.0
Jul-03
11-Aug-09
Transocean
GSF Adriatic IX
350
Afren Energy
W Africa
97,000
188,000
8
months
250 days + 425-day option
Sep-09
29.0
Jul-81
29-May-09
Vantage Drilling
Sapphire Driller
375
Foxtrot
W Africa
132,000
156,000
6
months
6 months + 6 months options
Jan-11
1.1
Jun-09
29-May-09
Vantage Drilling
Sapphire Driller
375
Foxtrot
W Africa
156,000
NA
3
months
Fixed portion of dayrate $5 mil effective
dayrate range $130k if option exercised
Aug-09
1.1
Jun-09
22-May-09
Scorpion Offshore
Offshore Resolute
350
Thang Long JOC
SE Asia
146,250
189,000
6
months
6 months
Aug-09
2.2
Apr-08
15-Apr-09
ENSCO
ENSCO 102
400
ConocoPhillips
NW Europe
198,000
150,000
14
months
14 months + rolling options
Sep-09
8.0
Jul-02
Median
120,000
$
153,000
$
7
months
Mean
128,376
$
166,368
$
7
months
Duration
31 |
 Financial Overview
32 |
 Financial Overview
(1)
Adjusted
for
share-based
compensation
expense.
See
“Reconciliation
from
Net
Income
(Loss)
to
Adjusted
EBITDA”
in
the
Appendix
to
this
presentation
for
detail.
Historical Financial Information
($Millions)
Fiscal Quarter Ended,
3/31/2009
6/30/2009
9/30/2009
12/31/2009
3/31/2010
Owned Rigs at Period End
1
1
2
3
4
Revenue
14.3
$
22.2
$
36.4
$
38.6
$
58.3
$
% Quarterly Growth
NA
55.2%
64.2%
5.8%
51.1%
EBITDA
5.3
$
8.3
$
13.0
$
3.4
$
23.1
$
% Margin
37.1%
37.3%
35.6%
8.9%
39.7%
Adjusted EBITDA
(1)
6.4
$
9.5
$
14.2
$
4.8
$
24.7
$
% Margin
45.1%
43.0%
39.0%
12.5%
42.3%
33 |
 Financial Overview
Preliminary Pro Forma Capitalization
($Millions)
(1)
Adjustment to common equity in pro forma column reflects cash and/or equity.
34
As of
Pro Forma
3/31/10
3/31/10
Cash
30
$
30
$
Restricted / Escrowed Cash
38
706
Issuer Debt:
Existing Credit Facilities
152
$
-
$
Debt Financing: Term Loan
-
300
Debt Financing: Notes
-
500
Total Issuer Debt
152
$
800
$
P2021 Notes
131
131
Aquamarine Note
103
103
Total Debt
386
$
1,034
$
Convertible Note Issued to F3 Capital
-
60
Common Equity
(1)
746
806
Total Capitalization
1,132
$
1,900
$ |
 Financial Overview
Run-Rate Financial Potential of Vantage Owned Assets
($Millions, except per day figures)
Illustrative Range of Run-Rate Financial Potential (10)
35
Illustrative
Calculation (1)
Single Jackup:
Spot Dayrate
(2)
140,000
$
Utilization / Efficiency (3)
90.0%
Annual Revenue
46.0
$
Operating Expenses per Day (4)
58,000
$
Annual Operating Expenses
21.2
Annual Jackup EBITDA
24.8
$
Annual Maintenance Capital Expenditures (5)
0.8
Annual Jackup EBITDA less Maint. Capex
24.1
$
Drillship:
Annual Contracted Dayrate
(6)
585,000
$
Utilization / Efficiency (7)
97.0%
Annual Revenue
207.1
$
Operating Expenses per Day (8)
156,000
$
Annual Operating Expenses
56.9
Annual Drillship EBITDA
150.2
$
Annual Maintenance Capital Expenditures (5)
3.7
Annual Drillship EBITDA less Maint. Capex
146.5
$
Assets in Contemplated Financing (2 Jackups, 1 Drillship) (9):
EBITDA
199.8
$
EBITDA less Maint. Capex
194.7
All Company Assets (4 Jackups, 1 Drillship) (9):
EBITDA
249.5
$
EBITDA less Maint. Capex
242.8
(1)
All annual calculations assume a 365-day year.
(2)
Management's estimate of current market potential based on the
approximate average dayrate for ultra-premium jackups in Q2 2010. Management believes this is a reasonable estimate of current market
potential because the fixtures on which the average is based represent
the most recently published leading edge dayrates for fixtures of comparable jackups.
(3)
Management's assumption of industry standard productive times on
high-specification jackups. Vantage’s fleet achieved approximately 97% productive time for Q1 2010 and approximately 99% productive
time in Vantage’s first 17 months of operation.
(4)
Vantage’s approximate average operating expense per day on its
jackup fleet for Q1 2010. Operating expenses include an assumed allocation for a portion of Vantage’s Singapore operations base.
(5)
Single jackup figure reflects management’s budgeted estimate for
2010. Drillship figure reflects management’s budgeted estimate for first year of the drillship’s operations based on $10,000 per day, which
management believes is a reasonable assumption for a newbuild drillship.
(6)
Actual contracted dayrate, excluding portion of dayrate attributable to
mobilization fee. (7)
Utilization assumption based on newbuild vessel fully under contract,
less assumed 3% reduction in utilization / efficiency. Management believes this is a reasonable assumption for a newbuild vessel in its first
full year of operations.
(8)
Assumed operating expenses per day based on management’s internally
generated projections for 2011. Operating expenses include an assumed allocation for a portion of Vantage’s Singapore operations base.
(9)
EBITDA and EBITDA less Maint. Capex figures exclude income from
management fees related to construction management contracts and unallocated corporate SG&A (estimated at $17-$20 million per year
based on management’s internally generated projections for 2011).
(10)
For purposes of this chart, the company used the methodology set forth
in the Illustrative Calculation. The only calculation parameter that varies from the Illustrative Calculation is the single jackup spot dayrate.
Range of dayrates in this chart reflects approximate historical range
for similar assets over the last two years. |
 Appendix
Reconciliation of Net Income (Loss) to Adjusted EBITDA
($Millions)
Fiscal Quarter Ended,
3/31/2009
6/30/2009
9/30/2009
12/31/2009
3/31/2010
Net Income (Loss)
2.4
$
4.0
$
6.8
$
(4.3)
$
6.0
$
Interest Expense, Net
0.7
1.3
1.9
4.0
7.4
Income Tax Provision (Benefit)
0.6
0.9
1.1
(0.6)
2.3
Depreciation
1.7
2.1
3.2
4.3
7.5
EBITDA
5.3
$
8.3
$
13.0
$
3.4
$
23.1
$
Share-Based Compensation Expense
1.1
1.2
1.2
1.4
1.5
Adjusted EBITDA
6.4
$
9.5
$
14.2
$
4.8
$
24.7
$
36 |