Attached files
| file | filename |
|---|---|
| 8-K - CENTRAL EUROPEAN MEDIA 8-K 6-30-2010 - CENTRAL EUROPEAN MEDIA ENTERPRISES LTD | form8k.htm |
Exhibit 99.1

2
Safe Harbour Statement
This presentation contains written or oral forward-looking statements, including those related to our capital needs, business strategies,
expectations and commitments. Statements that include the words “may”, “expect”, “intend”, “plan”, “target”, “prospect”, “forecast”,
“believe”, “project”, “anticipate”, “estimate”, “continue” and similar statements of a future or forward-looking nature identify forward-looking
statements. For these statements and all other forward-looking statements, we claim the protection of the safe harbor for forward-looking
statements contained in the Private Securities Litigation Reform Act of 1995. Forward-looking statements are inherently subject to risks
and uncertainties, many of which cannot be predicted with accuracy or are otherwise beyond our control and some of which might not even
be anticipated. Future events and actual results affecting our strategic plan as well as our financial position, results of operations and cash
flows, could differ materially from those described in or contemplated by the forward-looking statements. Important factors that contribute
to such risks include, but are not limited to, the effect of the credit crisis and economic downturn in our markets; decreases in television
advertising spending and the rate of development of the advertising markets and the pace of any related recovery in the countries in which
we operate; the successful integration of Media Pro Entertainment and the bTV group in Bulgaria; our ability to make future investments in
television broadcast operations; our ability to develop and implement strategies regarding sales and multi-channel distribution; changes in
the political and regulatory environments where we operate and application of relevant laws and regulations; the timely renewal of
broadcasting licenses and our ability to obtain additional frequencies and licenses; and our ability to acquire necessary programming and
attract audiences.
For a more detailed description of these uncertainties and other features, please see the “Risk Factors” section in our most recent
Quarterly Report on Form 10-Q filed with the U.S. Securities and Exchange Commission. Forward-looking statements speak only as of the
date on when they were made and we undertake no obligation to publicly update or revise any forward-looking statements, whether as a
result of new information, future developments of otherwise.

Headlines
3
Recoveries are starting in some markets but are slower and
more fragile than expected.
more fragile than expected.
We still expect overall growth in the second half of the year.
We are successfully integrating the newly acquired bTV in
Bulgaria into CME.
Bulgaria into CME.
Inventory is selling out; we are prepared to increase prices in
the fall.
the fall.
Depreciation of EUR against US$ is affecting our results.

Questions?
4

In Czech Republic and Slovenia GDP and
TV Ad market grew in Q2. Prices will
follow.
TV Ad market grew in Q2. Prices will
follow.
ING June 28: "With better debt and budget
deficit figures than most of the Eurozone,
and cheaper labour costs, emerging Europe
should clearly outperform the Eurozone in
2011. “ (Charles Robertson, Chief
Economist , ING)
deficit figures than most of the Eurozone,
and cheaper labour costs, emerging Europe
should clearly outperform the Eurozone in
2011. “ (Charles Robertson, Chief
Economist , ING)
5
CEE recovery is slow and mixed
Good news
Credit ratings of Greece, Spain and Portugal cut
Romania and Bulgaria announce austerity measures
to reduce public spending
to reduce public spending
Hungary announces potential default
US$ has strengthened against EUR by 10% since
our last earnings call
our last earnings call
Romania, Bulgaria and Croatia expected to remain
in recession in 2010
in recession in 2010
Retail and consumer confidence has not recovered
from its low point in 2009
from its low point in 2009
TV ad spending in our markets continued to decline
in Q2
in Q2
Bad news

Q1 macros: Q1 was the lowest point
6
Source: European Commission, Eurostat
Source: CME Internal Estimates (April 29th, 2010)
Source: Eurostat
Consumer Confidence Index
TV Ad Market
Annual Change Rate, %
Final consumption expenditure of households
Annual Change Rate, %
Consumer confidence fell
sharply last year. Signs of
improvement are varied.
sharply last year. Signs of
improvement are varied.
Real GDP Growth

Macroeconomic estimates
7
Real GDP
TV Ad Spend
0.4%
(5.4%)
Q2 2010
Source: CME estimates based on average economist consensus reports issued in April, May & June 2010 (ING, BNP, JPM, Bloomberg), TV ad spend - CME estimates
FY 2010
1%
(1%)
8
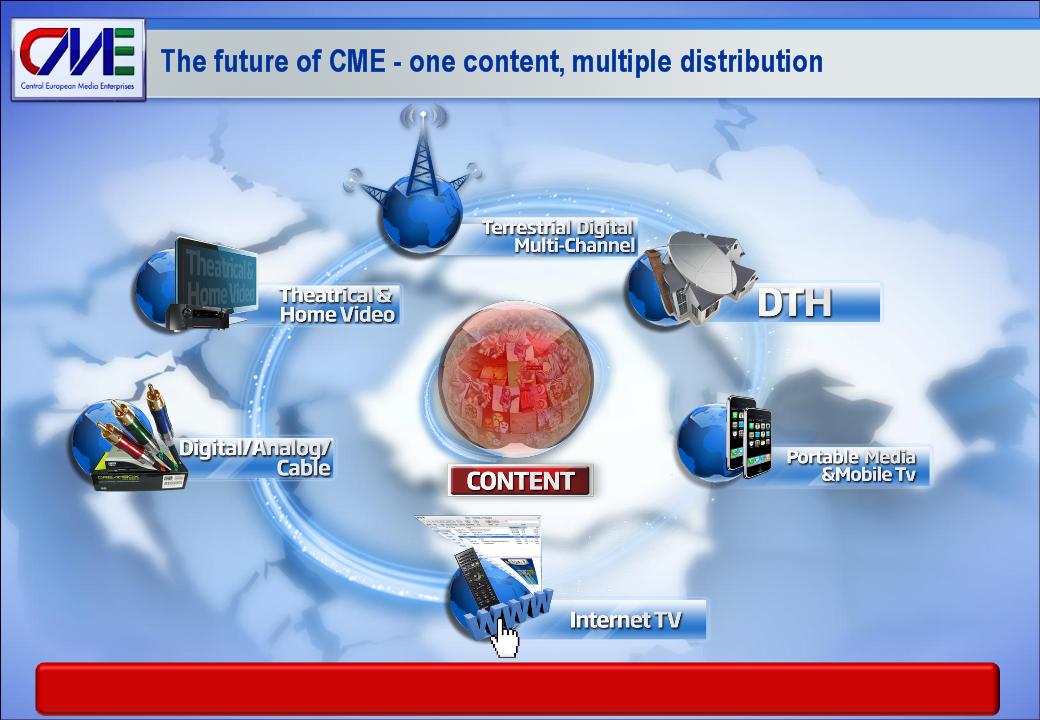
CME today: vertically integrated media and entertainment company
§ We are leaders in audience
in all our 6 markets
in all our 6 markets
New Media
§ We launched over 40 online
products and services with
2.0 million daily unique
users
products and services with
2.0 million daily unique
users
Content
§ We are integrating Mediapro
and became a leading
producer and distributor of
television fiction in the region
and became a leading
producer and distributor of
television fiction in the region
Broadcast
We are the winner of the region. Some
players left, some players are prepared to
leave ….
players left, some players are prepared to
leave ….
Our Goal by 2014 is to be one of the largest media companies in Europe
Our Goal by 2014 is to be one of the largest media companies in Europe
9

Key indicators of sustainable upturn: convergence
Source: Group M and CME estimates
Western Europe includes Austria, Belgium, Denmark, Finland, France, Germany, Greece, Ireland, Italy, The Netherlands, Norway, Portugal, Spain, Sweden, Switzerland and UK
Ad intensity is advertising spend per capita as a percentage of GDP per capita.
Total Ad spend per capita 2009
10
CME markets
Western
European
markets
European
markets
$12,000
$39,000
9%
4%
2009 GDP per
capita
capita
2004 to 2009
GDP CAGR
GDP CAGR
$44
$248
0.37%
0.63%
2009 Total Ad
spend per
capita
spend per
capita
2009 Ad
intensity
intensity
US$ 14.46
US$ 14.61
Avg. Product
prices
prices

11
Key indicators of sustainable upturn: our audience leadership
Sources: ATO Mediaresearch, TNS-AGB INTL, PMT/TNS SK, TNS Bulgaria
Leadership charts for four of our markets: May 10 - May 16 2010

12
Key indicators of sustainable upturn: our market leadership
Audience Share
Market Share
Power Ratio
=
/
2.0x
1.7x
2.5x
1.8x
2009 All Day Audience Share and Market Share
#2
#1
#1
#1
2.1x
#1
Sources: Audience share data: Croatia, AGB Nielsen Media Research; Czech Republic, ATO Mediaresearch; Slovak Republic, PMT/TNS SK; Slovenia,
Peoplemeters AGB Media Services; Romania and Peoplemeters Taylor Nelson Sofres, CME estimates
Peoplemeters AGB Media Services; Romania and Peoplemeters Taylor Nelson Sofres, CME estimates
1 Unaudited pro forma data for the combined operations of bTV group and Pro.BG group. The bTV group was acquired in April 2010.
1.6x
#1
1

TV and Internet will be the winners from advertising spend growth
TV continues to have the broadest reach and capture the highest share of advertisers’ marketing budgets
13
Source: Zenith Optimedia

We have a history of outperforming our markets
Between 2006 - 2008 TV ad spend in our markets grew at an
average rate of 15% per year.
average rate of 15% per year.
In the same period our revenues* grew 35% per year on
average.
average.
Average EBITDA* margin 2006 - 2008: 41%
CME remains an attractive media investment
* Czech Republic, Romania, Slovak Republic, Slovenia and Croatia
Our vertically integrated operational model provides for diversified revenues and will be more resilient to the
future challenges in our industry.
future challenges in our industry.
We are building leadership in content and internet with low investments.
We are uniquely positioned to take advantage of recovery in CEE.