Attached files
Table of Contents
UNITED STATES
SECURITIES AND EXCHANGE COMMISSION
WASHINGTON, D.C. 20549
FORM 10-K
(Mark One)
| x | ANNUAL REPORT PURSUANT TO SECTION 13 OR 15(d) OF THE SECURITIES EXCHANGE ACT OF 1934 |
For the fiscal year ended March 31, 2010
OR
| ¨ | TRANSITION REPORT PURSUANT TO SECTION 13 OR 15(d) OF THE SECURITIES EXCHANGE ACT OF 1934 |
For the transition period from to
Commission file number 1-33312
SALARY.COM, INC.
(Exact Name of Registrant as Specified in its Charter)
| Delaware | 04-3465241 | |
| (State of Incorporation) | (I.R.S. Employer Identification No.) | |
| 160 Gould Street Needham, Massachusetts |
02494 | |
| (Address of Principal Executive Offices) | (Zip Code) | |
(781) 851-8000
(Registrant’s Telephone Number, Including Area Code)
Securities registered pursuant to Section 12(b) of the Act:
| Title of Each Class |
Name of Exchange on Which Registered | |
| Common Stock, $0.0001 par value |
The Nasdaq Stock Market LLC | |
| (Nasdaq Capital Market) | ||
| Preferred Stock Purchase Rights |
The Nasdaq Stock Market LLC | |
| (Nasdaq Capital Market) |
Securities registered pursuant to Section 12(g) of the Act: None
Indicate by check mark if the registrant is a well-known seasoned issuer, as defined in Rule 405 of the Securities Act. Yes ¨ No x
Indicate by check mark if the registrant is not required to file reports pursuant to Section 13 or Section 15(d) of the Act. Yes ¨ No x
Indicate by check mark whether the registrant: (1) has filed all reports required to be filed by Section 13 or 15(d) of the Securities Exchange Act of 1934 during the preceding 12 months (or for such shorter period that the registrant was required to file such reports), and (2) has been subject to such filing requirements for the past 90 days. Yes x No ¨
Indicate by check mark whether the registrant has submitted electronically and posted on its corporate Web site, if any, every Interactive Data File required to be submitted and posted pursuant to Rule 405 of Regulation S-T (§232.405 of this chapter) during the preceding 12 months (or for such shorter period that the registrant was required to submit and post such files). ¨ Yes ¨ No
Indicate by check mark if disclosure of delinquent filers pursuant to Item 405 of Regulation S-K is not contained herein, and will not be contained, to the best of the registrant’s knowledge, in definitive proxy or information statements incorporated by reference in Part III of this Form 10-K or any amendment to this Form 10-K. ¨
Indicate by check mark whether the registrant is a large accelerated filer, an accelerated filer, a non-accelerated filer or a smaller reporting company. See the definitions of “large accelerated filer,” “accelerated filer” and “smaller reporting company” in Rule 12b-2 of the Exchange Act.
| Large Accelerated Filer ¨ |
Accelerated Filer ¨ | |||
| Non-Accelerated Filer ¨ (Do not check if a smaller reporting company) |
Smaller reporting company x | |||
Indicate by check mark whether the registrant is a shell company (as defined in Rule 12b-2 of the Exchange Act).Yes ¨ No x
As of September 30, 2009 (the last business day of the registrant’s most recently completed second fiscal quarter), there were outstanding 16,322,464 shares of common stock, $.0001 par value per share. The aggregate market value of shares of common stock held by non-affiliates of the registrant, based upon the last sale price for such stock on that date as reported by the Nasdaq Global Market, was approximately $23,105,184. The number of the registrant’s shares of common stock, $.0001 par value per share, outstanding as of June 22, 2010 was 17,279,433.
Documents Incorporated by Reference
Portions of the registrant’s definitive proxy statement for the 2010 Annual Meeting of Stockholders, to be filed within 120 days after the end of the fiscal year covered by this Form 10-K, are incorporated by reference into Part III of this Form 10-K.
Table of Contents
| Page | ||||
| PART I | ||||
| Item 1. |
1 | |||
| Item 1A. |
18 | |||
| Item 2. |
37 | |||
| Item 3. |
37 | |||
| Item 4. |
37 | |||
| PART II | ||||
| Item 5. |
Market for Registrant’s Common Equity, Related Stockholder Matters and Issuer |
38 | ||
| Item 6. |
43 | |||
| Item 7. |
Management’s Discussion and Analysis of Financial Condition and Results of |
45 | ||
| Item 7A. |
63 | |||
| Item 8. |
63 | |||
| Item 9. |
Changes in and Disagreements with Accountants on Accounting and Financial |
63 | ||
| Item 9A(T). |
63 | |||
| PART III | ||||
| Item 10. |
65 | |||
| Item 11. |
65 | |||
| Item 12. |
Security Ownership of Certain Beneficial Owners and Management and Related |
65 | ||
| Item 13. |
Certain Relationships and Related Transactions, and Director Independence |
65 | ||
| Item 14. |
65 | |||
| PART IV | ||||
| Item 15. |
66 | |||
Table of Contents
PART I
| ITEM 1. | BUSINESS |
Overview
We are a leading provider of on-demand compensation and talent management solutions in the human capital software-as-a-service (SaaS) market. Incorporated in 1999 as a Delaware corporation, we offer software and services that are tightly integrated with our proprietary data sets to help businesses and individuals manage pay and performance. Companies of all sizes turn to us to compensate, promote and manage their employees effectively and efficiently. With our help, companies can put the right talent in the right roles to deliver business objectives and individuals at all levels can determine their worth.
Our highly configurable software applications and proprietary content help executives, line managers and compensation professionals automate, streamline and optimize critical talent management processes, such as market pricing, compensation planning, performance management, competency management (a competency is a set of demonstrated behaviors, skills and proficiencies that determine performance in a given role) and succession planning. Built with compensation and competency data at the core, Salary.com solutions provide businesses of all sizes with the most productive and cost-effective way to manage and inspire their most important asset—their people.
We integrate our comprehensive SaaS applications with our proprietary content to automate the essential elements of our customers’ compensation and talent management processes. Our approach links pay to performance and aligns employees with corporate goals to drive business results. As a result, our solutions can significantly improve the effectiveness of our customers’ compensation spending and help them become more productive in managing their employees. We enable employers of all sizes to replace or supplement inefficient and expensive traditional approaches to compensation management, including paper-based surveys, consultants, internally developed software applications and spreadsheets. Our customers report that after using our solutions, they experience gains in productivity, reduction in personnel hours to administer pay and performance programs, and improvements in employee retention.
Our data sets contain base, bonus and incentive pay data for positions held by employees and top executives in thousands of public companies. Our flagship offering is CompAnalyst, an integrated suite of on-demand compensation benchmarking and pay analytics tools that integrate our data, third-party survey data and a customer’s own pay data with a complete analytics offering. We continue to build our IPAS global compensation technology survey with coverage of technology jobs in more than 90 countries.
Salary.com’s Talent Manager Suite, our on-demand talent management solution, offers managers and talent planners solutions to proactively plan for their personnel needs, based on business conditions and employees’ profiles, performance results and competencies. TalentManager also helps businesses automate performance reviews, streamline compensation planning and link employee pay to performance. TalentManager helps employers gain visibility into their performance cycle and drive employee engagement in the process through a configurable, easy-to-use interface that can be personalized by users. Using TalentManager, employers can improve their talent management systems and model the critical jobs skills they need to achieve their business goals.
With our fiscal 2009 acquisition of InfoBasis Limited, which during fiscal 2010 changed its legal name to Salary.com Limited, we now provide customers with competency-based skills management software for skills gap analysis and assessment. This acquisition follows earlier acquisitions of the assets of ITG Competency Group and Schoonover & Associates in 2008. These acquisitions have helped us offer one of the largest libraries of leadership and job-specific competencies and a leading competency model to manage competencies by position. These acquisitions also support our full talent management suite, which integrates compensation,
1
Table of Contents
performance and succession functions around job-based competency content. Our on-demand system helps line managers improve their ability to engage, develop and deploy their talent with learning references, coaching tips and progress journals.
We primarily sell our enterprise solutions through our direct sales group in annual or multi-year subscriptions. Over the past fiscal year, our subscriber base, which is mainly comprised of companies that spend from $2,000 to more than $100,000 annually, has grown from approximately 3,500 as of March 31, 2009 to approximately 3,750 customers as of March 31, 2010. We draw our customers from a broad range of industries, including such companies as ACCO Brands Corporation,, Avery Dennison, Beazer General Services, Inc., Boston Medical Center, Caraco Pharmaceutical Laboratories, Ltd., Casio America, Inc., The Cooper Health System, CVS Caremark Corp., Eaton Corporation, Elliot Health Systems, Emergint Technologies Inc., First Citizens Banc Corporation, Great Lakes Synergy Corporation, In-n-Out Burger, Ipswitch, Inc., Kent State University, MDU Resource Group, News Corporation, Pinnacle Airlines, Sallie Mae, Inc., St. John’s Riverside Hospital, Tween Brands, Inc., and Vectron International.
In addition to our on-demand enterprise software offerings, we also provide a selection of on-demand human resource (HR) offerings on the Salary.com website. The web applications deliver salary management comparison and analysis tools to individuals and small businesses on a cost effective, real-time basis. We offer a professional edition of our CompAnalyst product suite for smaller companies with less than 500 full-time employees in either report format or through subscription services. We market to individual consumers providing career services, financial information and premium compensation reports personalized to a consumer’s unique background. Our network of websites, including syndicated partners, generated approximately 2.75 million unique monthly visitors during the fiscal year ended March 31, 2010.
From a market perspective, we continue to believe that the on-demand human resource categories are high growth markets. We believe that on-demand software and data is superior to legacy software and services offerings. Given the lower up-front cost and total cost of ownership, we believe that more companies will switch to on-demand human resource solutions, and that Salary.com is leading the way with its on-demand human resource offerings.
Our Solutions
Our software applications, which are tightly integrated with our proprietary data sets, provide extensive features and broad functionality that address critical human relations functions, including compensation analysis and planning, goal setting, performance management and succession planning. By automating and integrating essential elements of compensation and talent management, our solutions enable our customers to increase productivity, promote employee retention, and ensure the right talent for the right roles to meet the business strategies of the future.
We combine content with on-demand software to manage the lifecycle of compensation and talent management. Our compensation management suite addresses the various stages of the compensation management lifecycle—ranging from benchmarking jobs for establishing the market price of equivalent jobs, to managing the compensation review and goal setting process between operating managers and front-line employees. We deliver our compensation management solutions to customers through our CompAnalyst suite of on-demand software applications. Customers can subscribe to our software complete with market data as well as import their own compensation surveys with our survey management module.
In addition to our compensation management solutions, we offer TalentManager, our on-demand talent management solutions, which helps businesses automate performance reviews, streamline compensation planning and link employee pay to performance. TalentManager includes multi-language and currency support for global organizations.
2
Table of Contents
Our acquisition of ICR Limited, L.C. and ICR International Ltd. (ICR) in May 2007 expanded our compensation product offering with the addition of two new services: IPAS, one of the largest single sources of international technology compensation data and software, including all relevant job titles in more than 90 countries, and ICR Specialty Consumer Goods, a leading source of U.S. compensation data for apparel, footwear, luxury goods and specialty retail jobs.
Our comprehensive software applications and data offerings provide the following key benefits:
Reduces costs. We believe that our solutions are more cost-effective than other available offerings. Our on-demand model significantly reduces or eliminates the installation and maintenance costs associated with on-premises solutions. Our intuitive user interfaces enable our customers to find the right data, manage its application and configure overall HR plans with little or no technical assistance. Furthermore, by integrating our software with our proprietary data sets, we provide our customers with a significantly less expensive compensation management solution than the traditional approach of separately purchasing combinations of consulting services, surveys and software applications.
Enables rapid deployment and scalability. Our on-demand software can be deployed rapidly and provisioned easily, without our customers having to make a large and risky upfront investment in software, hardware, implementation services or dedicated IT staff. The delivery platform for our software enables the solution to scale to suit customers’ needs. Additional users with defined privileges can be granted access with minimal implementation time, and new applications, such as analytics, can be deployed quickly and transparently to existing customers.
Facilitates more effective compensation spending. Our compensation management solutions enable companies to deliver more effective and consistent compensation programs by reducing the risk of high turnover caused by underpaying employees and the risk of reduced profitability caused by overpaying employees. By making better compensation decisions, our customers are able to better attract, motivate and retain their employees, which we believe can lead to improved business execution and financial performance.
Enables human resource professionals to be more strategic. Our compensation management solutions incorporate features and best practices that automate compensation management to reduce or eliminate manual, paper-based and discrete business activities. As a result, our solutions help maximize the effectiveness of HR departments by enabling compensation professionals to focus on more strategic, high-value corporate-wide initiatives.
Provides access to proprietary market-driven compensation intelligence. Companies have traditionally made compensation decisions based on a limited number of surveys that are updated only once a year. By contrast, our proprietary data sets provide market-driven compensation information derived from numerous sources which are updated monthly. We believe our data sets provide our customers with significant advantages as they set their compensation levels. To build and update our data sets, our compensation professionals apply proprietary comparative algorithms and sophisticated statistical analysis to the data to provide up-to-date, comprehensive and useful information to our customers.
Provides ability to price technology jobs around the world using the same methodology and participants. Appropriately pricing technology jobs across countries has traditionally been a challenging process complicated by multiple surveys, different job titles, inconsistent job matching, different participants per country and no centralized source to compare across countries. Through our IPAS product, we offer a uniform set of job benchmarks in a single source of comprehensive data that enables consistent benchmarking capabilities across all countries in the survey. Customers participate in a single, web-based survey and receive access to every job from clerk to chief executive officer for more than 90 countries. For example, a customer can determine what an accountant makes across all countries in the survey, with the same source, same methodology, same participants, and same currency.
3
Table of Contents
Reduces turnover and improves identification and development of top performers. Our on-demand software can be configured to an organization’s talent philosophies to uniformly identify top performers across the organization.
Aligns everyone with organizational goals. Our goal management module enables management to ensure that individual and group goals are aligned with organizational goals to keep employees focused on priorities and to monitor the execution of the business strategy.
Aligns pay with performance. The integrated pay and performance modules enable management to ensure that top performers are rewarded for their contribution as well as to ensure that all employees are paid equitably according to the organization’s pay-for-performance philosophy. This is critical for retention of top performers while also maintaining compliance and budget control. By integrating goal setting and performance reviews, the performance suite helps employees track their accomplishments throughout the year and compare capabilities with current or future job requirements. Employees can see which of their activities align with organizational goals and how they are adding value. This motivates employees to focus on their performance and development as a vital part of building their career.
Streamlines annual and date-scheduled performance review cycle. The talent management suite streamlines the annual performance review process by automatically generating review forms with appropriate competencies for every job. Employee goal achievement is automatically added to the review form so that managers can accurately rate performance. Reviews also can be performed by multiple raters or may be scheduled based on anniversaries or any other date trigger to remind managers and employees to communicate more frequently about performance.
Improves visibility and management of high-potential talent. The succession planning module also improves the visibility of key talent or high-potential employees across the organization through performance reviews, detailed employee profile tracking, and comparison of talented employees to the requirements of positions before they become vacant. By comparing all employees against job requirements and highlighting their achievements, talented employees—who might otherwise go unnoticed or leave the company—may be identified.
Builds strong pipeline of future leaders. The succession planning module also enables organizations to plan their resources by positions or jobs, and to compare current employee competencies to those needed by the organization in the future. Specific successors may be identified for any number of positions based on their criticality, so candidates may undertake development to ensure a ready pipeline of future leaders.
Increases effectiveness of learning and development. Our proprietary competency models help employees and managers understand the competencies needed to perform their jobs, and to create learning and development goals appropriate for their gaps or career directions. This ensures learning and development activities that will directly impact employee performance and profitability. Customers can utilize their own competency or learning content as well to facilitate development.
4
Table of Contents
Content
Our proprietary content, available separately or integrated with our solutions, is a primary core differentiator. By providing comprehensive content that is easily embedded within our applications, we are able to assist corporate customers in achieving their compensation and talent management objectives faster and more efficiently. The following diagram illustrates how we gather and process data and make it available to our enterprise customers through our software applications:
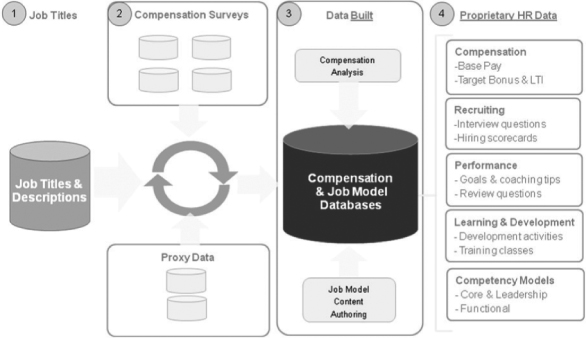
Our Market Pricing Data Processes
For our proprietary market pricing data sets, we use both standard and proprietary algorithms, which provide our customers with complete and consistent data that is representative of nearly all relevant markets and reasonable combinations of jobs, industries, locations and organization sizes. The completeness and consistency of our data sets provides our enterprise and consumer customers with market-driven compensation intelligence that we believe they could not procure or easily derive from alternate sources. In addition, our market pricing data processes and data sets also reduce the problems corporate compensation departments face from their lack of standardized processes for analyzing and combining multiple survey sources and maintaining the consistency of those sources year-over-year.
Enterprise and Consumer Compensation Data Sets
Our proprietary data set for enterprise and consumer customers is comprised of data from hundreds of commercially available, top-tier surveys. These surveys are derived of 100 percent employer-reported information and are updated on a monthly basis. Salary.com Certified Compensation Professionals collect, analyze and compile this information to deliver Salary.com’s copyrighted market pricing database. We adhere to standards in the selection and use of compensation surveys as prescribed by WorldatWork, a global human resources organization focused on compensation, benefits, work-life and integrated total rewards. Each survey is reviewed year-over-year for data integrity. Our lower-priced and free consumer products offer national-average market prices with a geographic differential that is applied across the board to all job families. These products are designed to provide a reasonably accurate estimate of the compensation pay levels for thousands of jobs in various types of organizations throughout the United States and Canada. The purpose of Salary.com’s consumer
5
Table of Contents
tools is to educate the individual employee regarding the compensation decision-making process and to provide a reasonable approximation of the market for that individual’s job. We believe the best way for an employee and employer to have a productive conversation regarding compensation and pay for performance is for both to be educated about the process and current market values.
Our enterprise data is fully scoped to reflect pay practices that are specific to a selected industry, organization size, and geography and contains base, bonus and incentive pay data for more than 3,900 positions. We also acquire additional employer-reported surveys to benefit our enterprise customers. These surveys include national data, local surveys, and more information on specific industries. These surveys create a data set for our enterprise customers that is more robust than our consumer data and provides the additional granularity required by HR professionals. Our enterprise customers may also incorporate data sources that they have independently acquired, which are then available for their exclusive use. In addition, our software allows enterprise customers to store their own employee records to match to preferred market sources and compare actual compensation, target compensation and market compensation. Using our proprietary method, we analyze the information from these sources and publish a Salary.com market price for each job, much like a compensation consultant would do for a client.
SEC Compensation Data Set
In addition to our proprietary market pricing data sets described above, we also maintain a complete data set of executive compensation and related data for more than 12,000 U.S. publicly traded companies. The compensation data included in this data set is obtained directly from filings made by these companies with the SEC. Our SEC data set also contains data on the compensation of directors from thousands of the largest publicly traded companies. Our SEC data set is updated daily to reflect new public filings and we maintain the historical data in our SEC data set to facilitate comparisons.
We also include basic financial data on public companies in our SEC data set, which we purchase from Standard & Poor’s. This data is used to enable our customers to place compensation data in the context of a company’s financial performance.
Competency Content and Job Competency Models
In fiscal year 2008, we acquired the Schoonover competency content library with more than 1,800 leadership competencies and the ITG Competency Group with more than 1,200 job-specific competencies. We help customers build competency libraries as well as help them design competency models that can be deployed across the organization. Customers can also purchase our competency content to build or augment their existing competency content. We offer customers six different types of competency content: business (general business knowledge and skills), individual, (knowledge, abilities and behaviors that drive personal effectiveness), functional, (technical skills and abilities associated with specific jobs), core (general competencies defined for all employees), management (competencies specific to managers and supervisors’ job tasks), and leadership (competencies specific to executive and leadership roles). Our off-the-shelf job-competency content is organized by industry and job family including hundreds for insurance, banking / financial services, retail, manufacturing, information technology, general corporate functions, leadership, healthcare, real estate, customer relationship management, high tech hardware and high tech software. Each model contains a job description, key responsibilities, competencies with 21 behavioral indicators for each proficiency level, learning references, interview questions, development statements, coaching tips, and writing assistance.
Products
We offer a suite of enterprise compensation management applications for enterprise customers that helps companies determine how much to pay new and existing employees and manage overall compensation programs. We also offer a suite of talent management applications to assist customers in establishing and tracking
6
Table of Contents
performance goals throughout their organizations, linking each employee’s pay to performance against these goals, and planning for talent needs and future succession. We offer these products both separately and as a bundled package.
Along with our application suites, we provide our customers with implementation and data configuration services as well as assistance with the configuration of our compensation and talent management solutions to their organization’s unique business needs. In addition to our enterprise offerings, we also provide a series of consumer and e-commerce solutions through our website to provide compensation information and tools designed for the consumer. We provide these solutions on a subscription, transaction or ad-sponsored basis. Our solutions consist of the following:
| Product Category |
Product Name |
Principal Revenue Type | ||
| Enterprise Solutions—Compensation Management Solutions |
CompAnalyst Suite U.S. Market Data Canadian Market Data Survey Center Reporting & Analytics Salary Structures Merit Modeling Executive |
Subscription Subscription Subscription Subscription Subscription Subscription Subscription Subscription | ||
| Small Business—Compensation Solutions |
CompAnalyst Professional Edition | Subscription | ||
| Salary.com Professional Edition | Subscription | |||
| Compensation Surveys—All Sizes |
Salary.com Compensation Market Studies | Transaction | ||
| Salary.com Consumer Surveys | Transaction | |||
| Salary.com IPAS Survey | Transaction | |||
| Enterprise Solutions—Talent Management Solutions |
TalentManager Suite Performance Management Compensation Planning Incentive Management Succession Planning Salary.com Skills Manager Competency Manager Job Models and Competency Libraries Competency Consulting |
Subscription Subscription Subscription Subscription Subscription Subscription Subscription Transaction Transaction | ||
| Consumer & E-Commerce Services |
www.salary.com | Subscription/Ad-sponsored | ||
| Salary Wizard | Subscription/Ad-sponsored | |||
| Syndicated Product | Subscription/Ad-sponsored | |||
| Personal Salary Report | Transaction | |||
Enterprise Solutions
Compensation Management Solutions
CompAnalyst is a suite of on-demand compensation management solutions for use by compensation professionals in large and small organizations. CompAnalyst is built around a core data set of accurate,
7
Table of Contents
employer-reported market data that is benchmarked and mapped for jobs held by a majority of U.S. employees. Customers get immediate access to a complete source of data to value jobs, participate in surveys and analyze pay competitiveness including the following applications:
CompAnalyst Market Data: Provides customers of all sizes easy access to a single source of accurate and trusted compensation data for more than 3,900 benchmark jobs in companies of various sizes, industries, categories and U.S. geographies. Customers can also quickly find the market price for any benchmark job or create and price a “hybrid job” by mixing multiple jobs together.
CompAnalyst Survey Center: Provides customers with a centralized, online repository for managing and performing market pricing with third-party surveys that they acquire and own themselves. The solution also simplifies the customers’ participation in multiple surveys. Our easy-to-use tools enable customers to age, weigh, adjust and combine data from multiple sources to produce market rates for use in compensation program design and analysis activities. Customers can use this functionality when they have specific data sources and weightings they choose to employ in determining market pricing. The Survey Center module also simplifies and speeds up the customer’s survey participation process by leveraging data already stored within the module—including employee pay and demographic data as well as the company’s job matches to survey vendor jobs—and exporting survey participation files in the specific survey vendor’s preferred format.
CompAnalyst Reporting & Analysis: Enables organizations to assess external competitiveness against internal equity by comparing actual pay practices to market data developed in CompAnalyst Market Data or Survey Center. Customers may analyze trends by year, compare pay practices across groups of employees (e.g., by region, business unit, Equal Employment Opportunity Commission protected class) and create custom queries to meet their analysis needs. Customers can also store data and use it to conduct historical comparisons.
CompAnalyst Salary Structures: Facilitates streamlined analysis of cost scenarios related to internal salary structures and distribution of merit budgets. Provides customers with visibility into internal equity and helps customers assess salary structures against market rates. Customers can analyze current pay structures and model the budget impact and cost of new structures and proposed changes. The salary structures module enables customers to assess the alignment of pay practices with the external market and internal targets, and to perform “what if” analysis to support recommendations for changes in compensation program design. Customers can seamlessly integrate with the merit modeling module and link to the performance module to verify where an employee fits within the salary structure when determining appropriate pay for performance.
CompAnalyst Merit Modeling: Models the cost of performance-based merit increase programs. Customers can build merit matrices to meet budgets based on parameters for performance and range placement or market index. Customers can model with historical data or expected performance distributions and compare the cost of multiple scenarios for the determination of appropriate merit budgets. This module provides quick and easy tools to measure the impact of merit increases for financial and strategic planning purposes, and integrates with compensation planning and talent management.
CompAnalyst Executive: Allows CEOs, CFOs, executive compensation specialists, board members and consultants to analyze and review compensation information that is disclosed in filings with the SEC for more than 12,000 U.S. public companies. The data available with this product, which is updated daily, includes pay, incentive compensation, Black-Scholes values, benefits, director compensation, financial and stock performance data and more. CompAnalyst Executive’s functionality includes the ability to build and analyze peer groups by industry, size and location, as well as company financial performance measures and executive and director pay measures.
CompAnalyst Professional Edition: Targeted to smaller businesses with less than 350 full-time equivalents, or FTEs; provides market content and software, similar to CompAnalyst market content, except with less data and functionality.
8
Table of Contents
Salary.com Professional Edition: Targeted to businesses with less than 100 FTEs and offered via the web in a self-service subscription model. This data product is similar to CompAnalyst Professional Edition, but contains data only on small companies.
Salary.com Job Valuation Reports: This report is designed for use by HR departments to price a single job. It allows users to view a report on the appropriate market compensation data for that job and, if they desire, recommend adjustments to reflect the particular experience, education and other factors specific to an employee currently in the job. The job valuation report also includes basic explanations of how to use the data and how to explain market pricing practices to an employee. We sell this application to employers through our website and our partners’ websites.
Salary.com Compensation Market Studies: These survey-like reports aggregate the data, generally for 50 to 200 related job titles within an industry group, typically within the same job family (for example, finance and accounting) or the same level (for example, executives).
Salary.com IPAS Global Survey: Provides global compensation software, which is tightly integrated with our proprietary data sets, to value jobs and total compensation factors for companies in the high technology industry through our IPAS survey software. Customers must participate in compensation surveys and subscribe to the on-demand software to access compensation information. Customers can access a single source of compensation content in more than 90 countries.
Salary.com Consumer Surveys: Provides industry-specific compensation content and reports to value jobs in the consumer retail industry. Customers must participate in the compensation surveys and purchase the reports to access the compensation data for the four consumer goods markets including specialty retail, luxury goods, footwear and apparel.
Talent Management Solutions
TalentManager is a suite of on-demand talent management solutions that provides the essential workflow to link pay to performance, improve performance management interactions, and develop a strong pipeline of future leaders across the enterprise. TalentManager enables an organization to manage goal setting, performance reviews and incentive plans, and to link these critical activities to the relevant compensation programs to administer the organization’s pay-for-performance program—all within a single integrated application. Our TalentManager suite includes the following modules:
Performance Management: Enables the communication and setting of goals and targets by employees and managers as well as the tracking of performance against those goals. The system enables organizations to establish corporate level goals and to cascade those goals throughout the organization to ensure alignment and results. The system automatically brings employee goals to the employee’s performance review along with their accomplishments to date to streamline the review process and facilitate better employee-manager interactions. Performance management is fully integrated with compensation planning, succession planning and incentives. We can link any goal or other component of performance to a variety of pay programs to reflect the organization’s pay-for-performance philosophy.
Compensation Planning: Enables organizations to automate and control the process of allocating salary increases, budget pools, lump sum adjustments and basic bonus plans. Within TalentManager, HR and finance departments can set rules or guidelines that dictate the limits and the approval process for any component of the compensation decision-making process. By setting all of the rules in one system, which programmatically enforces the process, the entire organization can easily and efficiently adhere to policies and control procedures while ensuring equitable pay-for-performance.
Incentive Management: A configurable and customizable application capable of managing complex formulaic incentive plans. Incentive plans vary significantly among and within organizations and can have complex rules and payout structures. This module is used when organizations have multiple incentive plans with
9
Table of Contents
similar structures typically based on corporate key performance indicators (KPIs), as well as individual goals and targets that tailor the incentive compensation for the individual. Although the standard compensation planning module includes features to address basic variable compensation, many organizations need the additional sophisticated algorithm and payout administration available in the incentive management module.
Succession Planning: Enables companies to plan resources, create succession plans and easily identify backup candidates with the necessary skills, competency ratings and performance history. The system also allows resource planners to determine and manage gaps in skills or competencies needed for jobs or position that will be required to execute the business strategy. Customers can assess candidates and create appropriate development plans to build sufficient bench strength and ensure a consistent pool of high potential employees for critical roles across the organization. Managers and executives can streamline planning for vacancies to minimize risk and quickly fill key leadership roles to manage transitions to minimize impact on the business. Identifying succession candidates early enables organizations to implement employee development plans, close skills gaps, and ensure that effective leaders are fully ready to assume critical roles when the time comes.
Competency Management: Provides robust tools for creating, customizing and managing job descriptions, competencies and performance management content for organizations of all sizes. This product is built to support data from any source including our proprietary library of detailed job and competency data for more than 1,500 industry-specific jobs. We believe it is the first stand-alone product designed to specifically address the complex challenges of developing, aligning, and deploying a consistent set of job and competency definitions for use across the organization. The application enables data to be easily modified and exported for use in any talent management process, including our TalentManager and Salary.com SkillsManager. Collaboration tools including working groups, discussion boards, voting, validation and approval workflows helps organizations to author and align competencies and job models with buy-in from all stakeholders.
Salary.com SkillsManager: Allows organizations to use off-the-shelf skill and competency models—including business, individual, management and leadership competencies from Salary.com—to create a company inventory of employee skills, conduct employee skill assessments, and analyze skills gaps at the individual, department and organizational levels. The workforce analytics in Salary.com SkillsManager allow organizations to identify and assign employees who have the requisite skills for a project and create targeted, skill-based learning programs that are in line with their business strategy. Salary.com SkillsManager provides easy-to-use tools to build job profiles, map skills, and design learning paths. Salary.com SkillsManager is designed to help organizations reduce costs by targeting only key training needs and maximize the utilization of employee skills rather than hire contractors with redundant skills. Salary.com SkillsManager also helps organizations mitigate operational risks by identifying potential key skill losses from attrition, and for some key industries, reduces the risk of non-compliance by proactively identifying skill gaps and shortages.
Professional Services
Our CompAnalyst professional services teams handle new customer implementations, training and general help desk services for the CompAnalyst product line and all data products. The TalentManager professional services team handles new customer implementations, configurations, training, and general help desk services for TalentManager. For implementations that are not strictly “plug and play,” our product-specific implementation teams provide initialization, configuration, training and general help-desk services. We also train our customers so that they can be more self- sufficient for future implementations. TalentManager customers generally require more professional services than CompAnalyst customers. Professional services in most cases are included as part of our subscription agreements and, to a lesser extent, are offered on an as-needed basis.
Our competency consulting practice helps organizations deploy competency-driven talent management systems to drive performance management and leadership development. We help organizations design their talent systems around job-based competency content that they can deploy rapidly, manage internally and deliver consistently across the entire organization. Our team of industry experts helps senior executives identify the key
10
Table of Contents
competencies that reinforce a company’s goals and culture; author and map competencies to jobs and job profiles, build competency models to drive identification and development of key internal leaders and build a curriculum to develop future leaders to drive business growth and results.
Consumer and E-Commerce Solutions
Our consumer and e-commerce solutions consist of free-to-user applications that are ad-sponsored, as well as certain premium products that are sold directly to individuals visiting our website. We also generate indirect revenue from these products through advertisers that pay for space on our website and our partners’ websites.
Our consumer and e-commerce solutions include:
www.salary.com: Our destination website and marketing face of the company is an advertising and online subscription sales channel. Our internet media traffic averaged approximately 2.2 million unique monthly visitors during the fiscal year ended March 31, 2010. Approximately 23,000 external sites directly link consumers to our website for career information, salary negotiation and ways to determine their worth. The site includes calculators, memberships, newsletters and content around the topic of career and pay management for individuals, as well as related business content for small business and enterprise audiences.
Salary Wizard: Salary Wizard is an ad-sponsored salary calculator designed to provide non-scoped, national average base pay and total annual cash compensation ranges for the positions we track. Users may adjust the national average information to their desired location by selecting a metropolitan area or zip code, and the results will be adjusted using a geographic adjustment factor to estimate the pay level for that location. Salary Wizard also attracts visitors to our website and our syndicated partner network of sites and serves as an entry point for consumers and employers to purchase a report or subscription product from us. The product was used approximately 2.8 million times per month in fiscal 2010 by both individuals and businesses.
Syndicated Product: Our syndicated product is a fully functional set of applications that we deploy onto our partners’ websites to power the compensation section of their websites in a co-branded manner. For example, Monster’s Salary & Benefits area is populated with Salary.com tools and the content is hosted and managed by Salary.com. The syndicated Salary Center product typically includes advertising inventory and e-commerce reports for which partners share revenue with us. Our partners include Monster.com, The New York Times, Beyond.com, Dice, Automatic Data Processing Inc. and more than 400 other companies.
Personal Salary Report Subscription: This application is a premium report providing individuals with an HR-quality assessment of their worth in the job market. The report also educates the subscriber about how employers determine compensation and advises the subscriber on how to negotiate salary for a win-win outcome.
Advertising Offering: We also sell space for third-party advertisers to deliver their messages to users of our website. Advertisers will pay for targeted inventory space adjacent to content that will be viewed by certain types of consumers. We believe our advertising inventory is attractive to advertisers because we provide a large volume of exposure opportunities and we can link those opportunities to a variety of consumer demographic factors, such as job title, location and income. Advertisers that purchase this inventory include job boards, recruiters, colleges and universities, financial services firms and retailers.
Compensation Team
We believe that one of the most significant differentiators between us and our software competitors is our compensation team. In addition to hiring experienced compensation professionals from industry, many of whom are certified compensation professionals, we train our technology personnel about compensation and our compensation personnel about technology, so that each group possesses both the HR and the technological expertise essential to our products. We believe that this combined expertise enables us to design our software and
11
Table of Contents
data sets in a sophisticated and useful manner for our customers. We also try to ensure that employees with compensation experience are deployed throughout our organization. Historically, we have moved compensation professionals into roles within sales, product management, and professional services. In this way we are able to embed compensation knowledge, skills and abilities in all aspects of what we do, and we believe this enables us to position our domain expertise as a true competitive advantage.
Research & Development
Our research and development efforts are focused on improving and enhancing our existing on-demand service offerings as well as developing new products, features and functionality. Expansion of our solutions into new areas often involves a multiple-year commitment to enter a new business, and we seek new product opportunities related to compensation, performance and talent management. When we extend an existing application or data set, our development costs are relatively low. When we innovate in an area requiring the development of a new data set, our development costs increase due to the high initial fixed costs of entering the new area and also building original software functionality. Once the initial investment in a new area has been made, however, the ongoing costs to maintain a data set and extend a product are often significantly less than the costs of maintaining the typical installed software product. Research and development expense for the fiscal years ended March 31, 2010, 2009, and 2008 was $9.7 million, $8.8 million and $4.9 million, respectively.
Technology
We pioneered hosted, multi-tenant, on-demand software when we launched our first product in 2000. Our on-demand software is a highly scalable, multi-tenant application platform written in CSS, XML, DHTML, Visual Basic, C, C++, Java, ASP and C# for the .NET framework and COM+ and MSMQ for the Windows operating systems. We use commercially available hardware and a combination of proprietary and commercially available software, including Microsoft SQL Server, Microsoft IIS Server and Microsoft Windows.
Our on-demand software treats our customers as separate tenants in central applications and data sets. As a result, we are able to spread the cost of delivering our service across our user base. In addition, because we do not have to manage thousands of distinct applications with their own business logic and database schemas, we believe that we can scale our business faster than traditional software vendors, even those that have modified their products to be accessible over the Internet.
Our compensation management and talent management products are built on our proprietary, highly scalable Salary.com FlexTenant platform, which enables us to customize the business logic, data flow, workflow and user interfaces of our enterprise applications for clients and yet continue to operate in the same multi-tenant application shared by our other customers.
Operations
We serve all of our customers from our third-party networks operations facility located in Watertown, Massachusetts. This facility, operated by AT&T, provides around-the-clock security personnel, photo ID/access cards, and sophisticated fire systems. The overall security of the data center (inside and outside) and network operations center are monitored by digital video surveillance cameras 24 hours a day, seven days a week. In addition, redundant bandwidth, on-site electrical generators and environmental control devices are used to keep servers up and running. We continuously monitor the performance of our services. We have a comprehensive security infrastructure, including firewalls, intrusion detection systems and encryption for transmissions over the Internet. We monitor and test this security infrastructure on a regular basis. Our site operations team provides system management, maintenance, monitoring and back-up. We run tests regularly to ensure adequate response from our sites and conduct production environment reviews for hosting capacity, expansion and upgrade planning. We also monitor site availability and latency. We own or lease and operate all of the hardware on which our applications run in the network operations facility.
12
Table of Contents
To facilitate high availability of our solutions and loss recovery, we operate a multi-tiered system configuration with redundant bandwidth, load balanced web server pools, replicated and clustered database servers and fault tolerant storage devices. Data sets are restored to hot standby database servers using transaction logs shipped from primary production database servers. This solution is designed to provide near real-time failover service in the event of a malfunction with a primary clustered database or server. Full backups of all data sets take place nightly and are archived to tapes. These tapes are rotated offsite to a separate facility managed by Iron Mountain. We also maintain a fully redundant site, located within our headquarters, which would serve as our primary site in the event that a disaster was to render the network operations facility inoperable. Our real-time backups are stored on servers in our corporate headquarters. Although we have not experienced a failure of our third-party network operations facility, we believe that if such facility became inoperable, most of our products would be available to our customers with minimal interruption in service.
The Company maintains a Statement on Auditing Standards No. 70 (SAS 70) Type II Certification, for our compensation and talent management operations. The SAS 70 is an internationally recognized auditing standard developed by the American Institute of Certified Public Accountants (AICPA). It defines the professional standards used by auditors to assess the internal controls of a service organization. The SAS 70 audit reports on the internal controls and safeguards service organizations have in place to process data belonging to its customers. The audit, conducted by an independent service auditor, focused on six key areas: information technology organization and access security, applications system development, implementation and maintenance and computer operations.
Sales and Marketing
Our marketing program is anchored by an integrated communications strategy that supports the core of our brand and value proposition. Our marketing programs are segmented into two groups: lead generation and branding. Lead generation programs are used to deliver qualified leads to the sales team. Lead generation activities include email campaigns, newsletters, search engine marketing, trade shows, industry conferences, webinars and regional events. We build our brand through our website, blog, syndication, public and industry analyst relations, all of which are intended to increase market awareness of us as a top-tier provider of on-demand compensation and talent management solutions, as well as a leading website for free information about compensation. We have also established a thought leadership program, in which our own subject-matter experts and other industry experts are featured in best practice webinars and comment in our emailed newsletter. Furthermore, our thought leaders are frequently sought as expert commentators by major media, including television, radio, newspapers and mainstream and trade magazines. We believe that this is a critical component of our branding program and well positions our expertise in compensation and talent management.
We sell our enterprise solutions primarily through our direct sales organization and to a lesser extent through indirect channels. We employ business development representatives to call potential enterprise customers to book initial demonstrations and to qualify customer leads. Once a lead is qualified, our account executives assess customer needs, complete demonstrations and close sales, primarily by telephone and via web-based product demonstrations. We also employ account managers who maintain on-going or post-sale relationships with subscribers, manage renewals and generate interest from existing customers to purchase additional products. In addition, our sales engineers and compensation professionals assist with sales to customers with particularly complex needs and provide post-sales customer support. Most of our sales personnel are located in our headquarters in Needham, Massachusetts. We also have an advertising and syndication sales team, which works in much the same way as our enterprise product sales team, but focuses its efforts on selling and marketing advertising on our website and syndication of our consumer offerings to other websites. Although we have relationships with many partners, including websites and consulting firms, these partners accounted for less than 10% in the aggregate of our total revenue in the fiscal years ended March 31, 2010, 2009 and 2008.
13
Table of Contents
Customers
As of March 31, 2010, we had approximately 3,750 subscribers, in various industries, who typically spend from $2,000 to more than $100,000 annually. No single customer accounted for more than 3% of our revenue in the fiscal years ended March 31, 2010, 2009 or 2008. Refer to Note 15. “Segment and Related Information” in our consolidated financial statements for a summary of our revenues by geographic location for the fiscal years ended March 31, 2010, 2009 and 2008.
Competition
The markets for on-demand compensation and talent management are fragmented, competitive and rapidly evolving, and there are low barriers to entry to some segments of these markets. Within our markets, the most common applications in use today are generic desktop software tools and solutions that are not specifically designed for compensation and talent management. We also compete with software vendors that offer solutions through either traditional on-premise delivery methods or to a lesser extent, on-demand solutions, and established consulting firms that continue to offer a diversity of services and software products. We also expect to encounter new and evolving competition as the market for on-demand compensation management software and services consolidates and matures and as organizations become increasingly aware of the advantages and efficiencies that can be attained from the use of compensation management software and data solutions.
Any of our competitors may also seek to expand into other areas in which we offer solutions—so that our competitors in the compensation management market may seek to expand into the talent management market or vice versa. In addition, our existing competitors or new competitors may seek to offer a bundled package of services that competes with our bundled solutions or to develop an integrated product suite that incorporates compensation and talent management.
We believe the principal factors that generally determine a company’s competitive advantage in the compensation management and talent management markets include the following:
| • | a large installed customer base; |
| • | a well-known and respected brand; |
| • | breadth and depth of proprietary content; |
| • | the ability to offer both powerful software and technology and accurate compensation data in a single offering; |
| • | experienced sales and distribution capabilities; |
| • | ease of deployment; |
| • | low cost of ownership; |
| • | a suite of products (rather than individual point solutions); and |
| • | an integrated platform. |
We face competition in our compensation management and talent management markets primarily from five sources:
| • | generic desktop software and in-house or custom-developed solutions; |
| • | established software vendors offering products specifically designed for compensation and talent management; |
| • | established compensation and HR consulting firms; |
| • | other websites and advertising venues; and |
| • | existing and future start-up companies offering software, data, and e-commerce compensation solutions. |
14
Table of Contents
Compensation and Talent Management
Generic desktop software and in-house or custom-developed solutions: Perhaps the most common applications in use today are generic desktop software tools such as Microsoft Excel and Microsoft Access, as well as other commercially available software solutions not specifically designed for compensation or talent management. Compensation professionals at organizations of all sizes routinely use these generic software tools to develop in-house or home-grown solutions. Although we believe our CompAnalyst and TalentManager offerings are superior to these home-grown, partially automated solutions, some potential customers may be reluctant to switch both because of the cost of our solution and because of the perceived risk they face in giving up direct control over their sources of data.
Established software vendors: Established HR software vendors compete with both our compensation and talent management solutions. In addition, the market for our TalentManager solution is extremely competitive and includes several companies that are more established and have greater financial, technological and marketing resources than we do. As a result, we expect to face intense ongoing competition in this segment of our business, which could affect our ability to increase or maintain market share in the talent management arena. Competitive software vendors in the compensation and talent management space include, without limitation, Peopleclick Authoria, Inc., Economic Research Institute, Inc., Equilar, Inc., Halogen Software Inc., Lawson Software, Inc., MarketPay Associates LLC, Oracle Corporation, Payscale, Inc., Plateau Software, SAP AG, SuccessFactors, Inc., Taleo Corporation, Workscape, Inc. and Workstream Inc.
We also expect that new competitors, such as enterprise software vendors that have traditionally focused on enterprise resource planning, or ERP, or back office applications, will enter, or greatly expand their offerings in, the on-demand compensation and talent management software market as it develops and matures. In addition, there are a number of companies that have products in the broader talent management market, which includes not only compensation and talent management, but also learning and recruitment management. We expect over time that certain of these companies may also seek to offer compensation and talent management products in competition with us. These large, traditional players in the HR space could focus their considerable financial, technical, marketing and sales resources on various segments of our business, either by developing their own products in-house or purchasing another company. To the extent such efforts are successful, it is possible that these new competitors could rapidly acquire significant market share.
Established compensation and HR consulting firms: The market for compensation management data and services has traditionally been dominated by large consulting firms, such as Mercer LLC and Towers Watson, Inc., many of which have greater financial, sales and marketing, management, service, support and other resources than we have. Such firms have traditionally offered an expensive but fully customized compensation management solution to the nation’s largest enterprises. In addition, several of these firms have invested in software-based compensation management tools. Therefore, we face two types of competition from established consulting firms:
| • | First, their customized consulting services represent an alternative to our CompAnalyst suite, particularly in larger organizations, which frequently have long-standing and well-entrenched relationships with compensation and HR consulting firms. |
| • | Second, some established HR consulting firms offer software that competes directly with certain modules of both our CompAnalyst and TalentManager solutions lines. Although we believe that our software products compete favorably with those offered by consulting firms, some of these firms have far greater resources than we do and as a result may compete successfully with our compensation and talent management solutions. |
Other websites and advertising venues: Our advertising-sponsored offerings (Salary Wizard, www.salary.com, and our syndicated product) compete with a wide variety of other websites and online media for advertising dollars. To the extent these competitors are able to offer advertisers more effective or cost-efficient means of marketing their product and services, we may be unable to grow, or face reduced revenues from some or all of our advertising-based products.
15
Table of Contents
Existing and future start-up software, data, and e-commerce companies: A number of smaller, early-stage companies offer products that compete directly with one or more of our product lines. Although many of these young companies may have fewer resources than we do, to the extent they are successful in their efforts, we may face more effective competition from them in the future, and our financial performance may suffer as a result. In addition, because the market for compensation and talent management software and services, as well as e-commerce compensation products, is nascent and rapidly evolving, we expect additional, as yet unformed, companies to enter our markets in the future. To the extent this occurs, some or all of our product lines will face greater competition in the future, which may materially adversely affect our financial performance.
Intellectual Property and Proprietary Content
We rely on a combination of patent, trademark, copyright and trade secret laws in the United States and other jurisdictions as well as confidentiality procedures and contractual provisions to protect our proprietary technology and our brand. We have two U.S. issued patents (one for our proprietary methods for calculating market pricing across our data sets and one for our Salary Wizard product), each of which expires in 2022, and three pending U.S. patent applications, as well as related patents and patent applications in other jurisdictions. We also enter into confidentiality and proprietary rights agreements with our employees, consultants and other third parties and control access to software, documentation, data and other proprietary information.
We pursue the registration of our trademarks. Currently, our CompPlanner, Salary Wizard, CompAnalyst, CompAnalyst Executive, IPAS, Makana, Makana Motivator, Payscore, Planning to Payment, Salary.com, Survey Center, TalentManager and PeopleComeFirst trademarks are federally registered in the U.S, while our Infobasis Capability Manager, Infobasis Total Capability Management, Empowered by Infobasis, Infobasis Employee Lifecycle, Infobasis Enterprise Skills Manager, Infobasis Readiness Manager, Infobasis Your People, Your Business, Infobasis, and Infobasis Enterprise Skills Infrastructure are registered in Great Britian and Northern Ireland.
We currently license some of the content used to build our compensation data sets from numerous providers pursuant to data reseller, data distribution, and license agreements with these providers. Our data sets are generally derived from market data as collected in salary surveys. This information is used as one of several inputs to our data set calculation methodology. Most of the licenses for this content are non-exclusive. We cannot ensure that the data we require for our data sets will be available from such sources in the future or that the cost of such data will not increase. Because we have content from numerous providers, we believe that the loss of any one license would not substantially affect the quality of our data sets. In addition, if a third party successfully asserted a claim that our use of data has violated our agreement with them or infringed upon their copyright, we may be required to remove the applicable data from our data sets and regenerate our data sets without such data.
Although the protection afforded by patent, trademark, copyright and trade secret laws may provide some advantages, we believe that our ability to maintain our competitive position is largely determined by such factors as the technical skills of our personnel, the breadth and depth of our proprietary data sets, new product developments and product enhancements.
Substantial litigation regarding intellectual property rights exists in the software industry. From time to time, in the ordinary course of business, we may be subject to claims relating to our intellectual property rights or those of others, and we expect that third parties may commence legal proceedings or otherwise assert intellectual property claims against us in the future, particularly as we expand the complexity and scope of our business, the number of similar products increases and the functionality of these products further overlap. If a claim is asserted that we have infringed the intellectual property of a third party, we may be required to seek licenses to that technology. In addition, we license third-party technologies, primarily from Microsoft, that are incorporated into some elements of our services. Although we do not believe that any one license is material to our operations, licenses from third parties may not continue to be available to us at a reasonable cost, or at all. In addition, the our intellectual property rights may not be adequate. Third parties may infringe or misappropriate our proprietary rights. Competitors may also independently develop technologies that are substantially equivalent or superior to the technologies we employ in our services.
16
Table of Contents
Seasonality
We experience some seasonality in our business cycle, resulting in cash flows from operating activities typically being lower in our fiscal first and second quarters and higher in our fiscal third and fourth quarters.
Employees
At March 31, 2010, we had 528 full-time and part-time employees. Our employees are not represented by any collective bargaining agreement, and we have never experienced a work stoppage. We believe we have good relations with our employees.
Facilities
The Company’s four principal facilities incorporate development, sales and marketing, and administration functions. Our facilities consist of:
| • | a leased 36,288 square foot facility in Needham, Massachusetts, which is our corporate headquarters, |
| • | a leased 31,240 square foot facility in Shanghai, China, |
| • | a leased 30,698 square foot facility in Methuen, Massachusetts, and |
| • | a leased 6,409 square foot facility in Oxford, United Kingdom. |
In June 2010, we shut down our Montego Bay, Jamaica telesales operation and terminated the office lease for the property. We believe that our existing facilities are adequate for our current needs. As additional space is needed in the future, we believe that suitable space will be available in the required locations at commercially reasonable terms. See Note 7 to the notes to our consolidated financial statements and “Management’s Discussion and Analysis of Financial Condition and Results of Operations—Contractual Obligations” for information regarding our lease obligations.
Discontinued Operations
In May 2010, we approved plans to divest our payroll reporting unit. The payroll reporting unit primarily consists of our enterprise payroll and human resource management software sold by our Genesys subsidiary and our small business payroll products. The decision to divest this business was based on our determination that our current product offerings are too broad and our decision to focus our resources in the areas where we believe we have the greatest potential for profitable growth: our compensation, talent management and consumer businesses. As a result, we will begin reporting our payroll reporting unit as a discontinued operation beginning in the first quarter of fiscal 2011.
Within the payroll reporting unit we offered our customers a comprehensive range of HR information, payroll processing, tax and benefits administration products and services to staff, manage, and pay their employees. We provided payroll services that included the preparation of client employee paychecks and electronic direct deposits, summaries and management reports. We also supplied the quarterly and annual social security, Medicare and federal, state and local income tax withholding reports required to be filed by employers. Our HRMS services provided solutions from pre-hire to retire, including talent acquisition through employee HR recordkeeping and compliance management. Our benefit services business provides benefits administration, including management of the open enrollment of benefits, COBRA and FSA administration.
Internet Address
Our internet address is www.salary.com. We make available, free of charge, on or through our website, our Annual Reports on Form 10-K, Quarterly Reports on Form 10-Q and Current Reports on Form 8-K and amendments to such reports filed or furnished pursuant to Section 13(a) or 15(d) of the Securities Exchange Act of 1934, as amended as soon as reasonably practical after such reports are electronically filed with the SEC. Our website is not incorporated by reference into this Annual Report on Form 10-K.
17
Table of Contents
| ITEM 1A. | RISK FACTORS |
CAUTIONARY STATEMENT REGARDING FORWARD LOOKING STATEMENTS
This Annual Report on Form 10-K contains or incorporates a number of forward-looking statements within the meaning of Section 27A of the Securities Act of 1933 and Section 21E of the Securities Exchange Act of 1934. Forward-looking statements relate to future events or our future financial performance. We generally identify forward-looking statements by terminology such as “may,” “will,” “should,” “expects,” “plans,” “anticipates,” “could,” “intends,” “target,” “projects,” “contemplates,” “believes,” “estimates,” “predicts,” “potential” or “continue” or the negative of these terms or other similar words. These statements are only predictions. We have based these forward-looking statements largely on our current expectations and projections about future events and financial trends that we believe may affect our business, financial condition and results of operations. The outcome of the events described in these forward-looking statements is subject to risks, uncertainties and other factors described in “Risk Factors,” “Management’s Discussion and Analysis of Financial Condition and Results of Operations” and elsewhere in this report. Accordingly, you should not rely upon forward-looking statements as predictions of future events. We cannot assure you that the events and circumstances reflected in the forward-looking statements will be achieved or occur, and actual results could differ materially from those projected in the forward-looking statements. We have identified below some important factors that could cause our forward-looking statements to differ materially from actual results, performance or financial condition:
| • | our ability to become profitable; |
| • | our ability to sell our products in a challenging economic environment; |
| • | the ability of our solutions to achieve market acceptance; |
| • | a highly competitive market for compensation management; |
| • | failure of our customers to renew their subscriptions for our products; |
| • | our inability to adequately grow our operations and attain sufficient operating scale; |
| • | our inability to effectively protect our intellectual property and not infringe on the intellectual property of others; |
| • | our inability to raise sufficient capital when necessary or at satisfactory valuations; |
| • | the loss of key personnel; and |
| • | other factors discussed elsewhere in this report. |
The risks and uncertainties described in this Annual Report on Form 10-K are not the only ones we face. Additional risks and uncertainties, including those not presently known to us or that we currently deem immaterial, may also impair our business. The forward-looking statements made in this Annual Report on Form 10-K relate only to events as of the date of this report. Except as required by law, we assume no obligation to update any forward-looking statements after the date of this report.
This Annual Report on Form 10-K also contains market data related to our business and industry. This market data includes projections that are based on a number of assumptions. If these assumptions turn out to be incorrect, actual results may differ from the projections based on these assumptions. As a result, our markets may not grow at the rates projected by these data, or at all. The failure of these markets to grow at these projected rates may have a material adverse effect on our business, financial condition and results of operations and the market price of our common stock.
We have incurred operating losses in the past and expect to incur operating losses in the future.
We have incurred operating losses in the past and we expect to incur operating losses in the future. As of March 31, 2010, our accumulated deficit is approximately $92.7 million. Our recent operating losses were
18
Table of Contents
$26.0 million for the fiscal year ended March 31, 2010, $26.5 million for the fiscal year ended March 31, 2009 and $12.3 million for the fiscal year ended March 31, 2008. We have not been profitable since our inception, and we may not become profitable. In addition, although we have recently reduced our operating expenses and have adjusted our strategic direction going forward to focus on compensation and talent management, our operating expenses may still exceed our expectations as well as our expected revenues. If our operating expenses exceed our expectations, our financial performance could be adversely affected. If our revenue does not grow to offset these increased expenses, we may not become profitable. You should not consider recent revenue growth as indicative of our future performance, particularly since we have exited our payroll business. In fact, in future periods, we may not have any revenue growth, or our revenue could decline.
We operate in an emerging and rapidly evolving market which makes it difficult to evaluate our business and future prospects and may increase the risk of your investment.
We derive, and expect to continue to derive for the foreseeable future, the vast majority of our revenues from our on-demand compensation and talent management solutions, which are relatively new and emerging markets, making our business and future prospects difficult to evaluate. Many companies have invested substantial personnel and financial resources in their human resource, or HR, departments or have engaged outside consulting firms or HR Business Process Outsourcers, or HR BPOs, and payroll providers to obtain corporate compensation and talent management data and solutions, and may be reluctant or unwilling to migrate to on-demand software designed to address their compensation and talent management needs. The market for on-demand software solutions is at an early stage of development, and it is uncertain whether an on-demand model such as ours will achieve and sustain the high level of market acceptance that is critical to the success of our business. Our success will depend to a substantial extent on the willingness of companies to increase their use of on-demand software in general and on-demand compensation and talent management in particular. If businesses do not perceive the benefits of on-demand software, then the market may not develop further, or it may develop more slowly than we expect, either of which would adversely affect our business, financial condition and results of operations. You must consider our business and future prospects in light of the challenges, risks and difficulties we encounter in the new and rapidly evolving market for on-demand compensation management. These challenges, risks and difficulties include the following:
| • | generating sufficient revenue to achieve and maintain profitability; |
| • | Our ability to successfully execute on our strategic plan to divest our payroll business and focus on our core compensation and talent management business; |
| • | developing new products and enhancing the functionality and features of existing applications; |
| • | attracting and retaining new customers and expanding the revenue generated from existing customers; |
| • | managing growth in our operations; and |
| • | attracting and retaining key personnel, including the hiring of a new Chief Executive Officer. |
We may not be able to successfully address any of these challenges, risks and difficulties, including the other risks related to our business and industry described below. Failure to adequately do so could adversely affect our business, results of operations or financial condition.
Our solutions are primarily sold pursuant to subscription agreements, and if our existing customers elect either not to renew these agreements or renew these agreements for fewer applications or at a lower price, our business, financial condition and results of operations will be adversely affected.
Our solutions are primarily sold pursuant to annual or multi-year subscription agreements and our customers have no obligation to renew these agreements. As a result, we are not able to consistently and accurately predict future renewal rates. Our customers’ renewal rates may decline or fluctuate or our customers may renew for fewer applications or at a lower price as a result of a number of factors, including their level of satisfaction with our solutions, budgetary concerns or the availability and pricing of competing products. Additionally, we may
19
Table of Contents
lose customers due to the high turnover rate in their HR departments. If large numbers of existing customers do not renew these agreements, or renew these agreements on terms less favorable to us, and if we cannot replace or supplement those non-renewals with new subscription agreements generating the same or greater level of revenue, our business, financial condition and results of operations will be adversely affected.
We may not be successful in our recent decision to exit the HRMS/payroll solutions business.
We recently decided to exit the HRMS/payroll solutions business. We did this in part because we believe that focusing on our compensation and talent management products provides the best prospects for the future. This belief is based on a number of assumptions that may vary materially from actual future results. In order to exit the HRMS/payroll business, we expect to sell the underlying assets associated with this business and to stop further product development. We may be unable to sell these businesses or receive sufficient consideration if we are able to complete the sales. Furthermore, we may incur various expenses and record additional charges associated with the shut down of these businesses. In addition, our core compensation and talent management businesses may not perform as well as we expect on a standalone basis. As a result, any exit of the HRMS/payroll businesses may have an adverse effect on our future business, financial condition and results of operations.
Our credit facility contains certain financial and negative covenants, the breach of which may adversely affect our financial condition.
We have a credit facility with Silicon Valley Bank under which we had drawn down $2.5 million as of March 31, 2010. Our agreement with Silicon Valley Bank contains a financial covenant that requires us to maintain a ratio of assets to liabilities (net of deferred revenue) that is not less than 1.4 to 1. If we are not in compliance with this covenant, the amounts drawn on the facility may become immediately due and payable. Any requirement to immediately pay outstanding amounts under a credit facility may negatively impact our financial condition and we may be forced by our creditor into actions, which may not be in our best interests. As of March 31, 2010, we were not in compliance with our debt covenant; however, we had sufficient available cash to pay in full the outstanding amounts due on the facility without material consequence to us. We have received a waiver from Silicon Valley Bank for the months of March, April and May 2010 and are currently negotiating an amendment to our existing credit facility. We anticipate that the amendment will be completed during the second quarter of fiscal 2011 and that we would be in compliance with the covenants of such arrangement.
We might require additional capital to support business growth, and this capital might not be available.
We intend to continue to make investments to support our business growth and may require additional funds to respond to business challenges, including the need to develop new software or enhance our existing compensation and talent management solutions, enhance our operating infrastructure and acquire complementary businesses and technologies. Accordingly, we may need to complete additional equity or debt financings to secure additional funds. We cannot assure you that further equity or debt financing will be available on acceptable terms. If we raise additional funds through further issuances of equity or convertible debt securities, our existing stockholders could suffer significant dilution, and any new equity securities we issue could have rights, preferences and privileges superior to those of holders of our common stock.
Our quarterly results of operations may fluctuate in the future. As a result, we may fail to meet or exceed the expectations of investors or securities analysts which could cause our stock price to decline.
Our quarterly revenue and results of operations may fluctuate as a result of a variety of factors, many of which are outside of our control. If our quarterly revenue or results of operations fall below the expectations of investors or securities analysts, the price of our common stock could decline substantially. Fluctuations in our results of operations may be due to a number of factors, including, but not limited to, those listed below and identified throughout this “Risk Factors” section in this Annual Report on Form 10-K:
| • | our ability to retain and increase sales to existing customers and attract new customers; |
| • | the amount and timing of revenue recognized in a particular quarter as a result of changes in the volume and mix of products and services sold in that quarter and prior quarters; |
20
Table of Contents
| • | our ability to execute on our revised strategy to focus on our core compensation and talent management businesses; |
| • | seasonality of our business cycle, given that our cash flows from operating activities are typically lower in our fiscal first and second quarters and higher in our fiscal third and fourth quarters; |
| • | our policy of expensing sales commissions in each year of our customer subscriptions; |
| • | the timing and success of new product introductions or upgrades by us or our competitors; |
| • | the performance of our acquisitions; |
| • | changes in our pricing policies or those of our competitors; |
| • | competition, including entry into the market by new competitors and new product offerings by existing competitors; |
| • | the amount and timing of expenditures related to expanding our operations, research and development, or introducing new products; |
| • | changes in the payment terms for our products and services; and |
| • | the purchasing and budgeting cycles of our customers. |
Because our on-demand software is sold pursuant to annual or multi-year subscription agreements and generally we recognize revenue from these subscriptions over the term of the agreement, downturns or upturns in sales may not be immediately reflected in our operating results. Most of our expenses, such as salaries and third party hosting co-location costs, are relatively fixed in the short-term, and our expense levels are based in part on our expectations regarding future revenue levels. As a result, if revenue for a particular quarter is below our expectations, we may not be able to proportionally reduce operating expenses for that quarter, causing a disproportionate effect on our expected results of operations for that quarter.
Due to the foregoing factors, and the other risks discussed in this Annual Report on Form 10-K, you should not rely on quarter-to-quarter comparisons of our results of operations as an indication of our future performance.
If the economy worsens or labor market conditions deteriorate materially, our business may be harmed.
To the extent that the economy or labor market conditions materially deteriorate, our existing and potential clients may no longer consider investment in their compensation and talent management systems a necessity, or may elect to defer purchases or reduce budgets in these areas. Either of these developments could have an adverse effect on our business, financial condition and results of operations.
Reductions in information technology spending could limit our ability to grow our business.
Our operating results may vary based on changes in the information technology, or IT, spending of our clients. The revenue growth and profitability of our business depend on the overall demand for enterprise application software and services. We sell our solutions primarily to large organizations whose businesses fluctuate with general economic and business conditions. As a result, decreased demand for enterprise application software and services, and in particular on-demand compensation management and talent management solutions, caused by a weakening global economy or otherwise may cause a decline in our revenue. Historically, economic downturns have resulted in overall reductions in corporate IT spending. In particular, compensation management software may be viewed by some of our existing and potential clients as a lower priority and may be among the first expenditures reduced as a result of unfavorable economic conditions. In the future, potential clients may decide to reduce their IT budgets by deferring or reconsidering product purchases, which would negatively affect our operating results.
21
Table of Contents
We will likely experience longer sales cycles and increased pricing pressure as a result of unfavorable economic conditions.
If general economic conditions worsen or fail to improve, we will likely experience an increase in delays in our sales cycles and an increase in pressure from prospective customers to offer discounts on products higher than our historical practices. We may also experience increased pressure from existing customers to renew expiring software subscriptions agreements at lower rates. In addition, certain of our customers may attempt to negotiate lower software subscription fees for existing arrangements because of downturns in their businesses. If we choose to accept certain request for higher discounts or lower fees, our business may be adversely affected and our revenues may decline. We also believe certain of our competitors may offer lower fees for their products and services as a result of the current economic environment, which may put further downward pressure on our fees. Additionally, certain of our customers may become bankrupt or insolvent as a result of the recent economic downturn, and we may lose all revenue from such customers.
Because we recognize revenue over the term of the applicable subscription agreement, the lack of subscription renewals or new subscription agreements may not be immediately reflected in our operating results.
We recognize revenue from our customers over the term of their subscription agreements with us or, if applicable, over the remaining term once configuration and acceptance of application services has occurred. The substantial majority of our quarterly revenue usually represents deferred revenue from subscriptions sold during previous quarters. As a result, a decline in new or renewed subscription agreements in any one quarter will not necessarily be fully reflected in the revenue for the corresponding quarter but will negatively affect our revenue in future quarters. Additionally, the effect of significant downturns in sales and market acceptance of our solutions may not be fully reflected in our results of operations until future periods. Our business model also makes it difficult for us to reflect any rapid increase in our customer base and the resulting effect of this increase in our revenue in any one period because revenue from new customers will be recognized over the applicable subscription agreement term.
If our efforts to attract new customers or to sell additional solutions to our existing customers are not successful, our revenue growth will be adversely affected.
To grow our revenue, we must continually add new customers and sell additional solutions to existing customers. If our existing and prospective customers do not perceive our solutions to be of sufficiently high value and quality, we may not be able to attract new customers or to increase sales to existing customers. Our ability to attract new customers and to sell new solutions to existing customers will depend in large part on the success of our sales and marketing efforts. However, our existing and prospective customers may not be familiar with some of our solutions or may have traditionally used other products and services for some of their compensation management and talent management requirements. In addition, prospective customers may have invested substantial personnel and financial resources in their HR departments or have engaged outside consulting firms or HR BPOs to obtain corporate compensation data and solutions, and may be reluctant or unwilling to migrate to our on-demand compensation management and talent management solutions to address their compensation management needs. Existing customers and prospective customers may also decline to purchase our compensation management and talent management solutions due to budgetary concerns or the availability and pricing of competing products. If we fail to generate additional business from our existing customers and new customers, our revenue could grow at a slower rate or decrease, which could adversely affect our business, financial condition and results of operations.
If we fail to successfully develop new applications or features, the growth of our business, revenues and results of operations will be materially adversely affected.
We have developed new applications over time that have contributed to the growth of our business to date. For example, we initially launched CompAnalyst Market Data (formerly known as Job Analyzer) in 2000 and have since added CompAnalyst Survey Management, CompAnalyst Pay Analytics, which includes Reporting &
22
Table of Contents
Analysis, Merit Modeling and Salary Structures, and CompAnalyst Executive modules to create our CompAnalyst suite. Products in the on-demand compensation management market typically take years to develop widespread market acceptance. We expect to rely on newly introduced applications of features for a substantial portion of our growth for the foreseeable future. If we are unable to continue to develop and launch new applications or if our new applications are not able to achieve market acceptance, our business, financial condition and results of operations will be materially adversely affected.
If we do not continue to innovate and provide HR solutions that are useful to users, we may not remain competitive, and our revenues and operating results could suffer.
Our success depends on providing HR solutions that HR decision makers may use to make compensation and performance management decisions. Our competitors are constantly developing innovations in HR solutions. Additionally, the market for our on-demand software is characterized by changes in customer requirements, changes in protocols and evolving industry standards. As a result, we must continue to invest significant resources in research and development in order to improve and enhance the responsiveness, functionality and features of our existing applications and develop new applications so that we may offer a complete product suite of solutions that are easy to use and effective. In particular, we will need to expand our offering to more comprehensively address our customers’ compensation management needs. If our innovations are not responsive to the needs of our users, our current and potential clients may elect to purchase our competitors’ products and services, which would significantly impair our revenue growth, operating results and reputation. In addition, if we are unable to predict user preferences or industry changes, or if we are unable to modify our offerings on a timely basis, we may lose customers. Our operating results would also suffer if our innovations are not appropriately timed with market opportunities or are not effectively brought to market.
Our growth could strain our personnel and infrastructure resources, and if we are unable to implement appropriate controls and procedures to manage our growth, we may not be able to successfully implement our business plan.
Rapid growth in our headcount and operations may place a significant strain on our management, administrative, operational and financial infrastructure. Between March 31, 2004 and March 31, 2010, the number of our full time equivalent employees increased from 68 to 528. Subsequent to our fiscal year end, we have initiated a worldwide workforce reduction which we expect will bring our headcount to approximately 415 by June 30, 2010.
Our success will depend in part upon the ability of our senior management to manage the growth we have experienced effectively. However, the growth we have experienced may place greater strains on our resources. For instance, as discussed above, in response to current and anticipated macro-economic uncertainties, our work force is expected to be reduced by approximately 21% by June 30, 2010. As a result, we have fewer personnel to manage our growth and if we are not successful in retaining our existing employees, we may not be able to handle any increase in the volume of our business and our business may be harmed. In addition, if we continue to grow, we may need to hire, train, manage and integrate additional employees, which will require us to expend additional financial resources. We may also outgrow our current space in Needham, Massachusetts, Methuen, Massachusetts, Shanghai, China and Abingdon, United Kingdom or desire to open additional offices domestically and internationally, which could make it more difficult to manage employees not located at our principal headquarters and maintain uniform standards, controls, procedures and policies across locations. If we determine that it is necessary or desirable to open additional offices, whether domestically or internationally, management resources will be allocated to integrating new offices, handling cultural and language issues arising from international operations and managing costs associated with a multi-office organization. Such focus could divert management’s attention from managing ongoing business operations.
23
Table of Contents
Failure to effectively develop our sales and marketing capabilities could harm our ability to increase our customer base and achieve broader market acceptance of our solutions.
During fiscal 2007 and 2008, we significantly expanded our direct sales force in our Needham, Massachusetts office and expanded our regional sales force, including sales people dedicated to building out our competency, international, small business and strategic sales teams to penetrate new buying groups and new geographic markets. We also invested significant financial resources in marketing to extend our compensation brand globally and build awareness among a new set of buyers in organizational and leadership development.
These initiatives may not yield the desired results to grow and expand our business or brand awareness, and/or we may be unable to manage the resulting growth in headcount or marketing spend in an efficient and cost effective manner. New sales personnel are often not profitable during their first year with us. Our business will be seriously harmed if the expansion of the direct sales force does not generate a corresponding significant increase in revenue. We may not achieve anticipated revenue growth from expanding our direct sales force if our new direct sales personnel are unable to achieve desired productivity levels in a reasonable period of time. In addition, the workforce reduction we implemented in the first quarter of fiscal 2011 may adversely affect the investments we have made in building our sales and marketing infrastructure. As a result, our ability to increase our customer base and achieve broader market acceptance of our solutions could be jeopardized.
Our sales force currently consists primarily of direct sales personnel who sell our products over the telephone. As we expand our offerings and our customer base, it may be necessary for our sales personnel to increase the frequency of in-person meetings with our customers in order to sell our products, which will increase the costs incurred in the sales process, and may require us to hire additional sales personnel and extend the length of our typical sales cycle.
If we fail to develop or maintain our brand cost-effectively, our business may suffer.
We believe that developing and maintaining awareness of our brand in a cost-effective manner is critical to achieving widespread acceptance of our existing and future applications and is an important element in attracting new customers and increasing business with existing customers. Successful promotion of our brand will depend largely on the effectiveness of our marketing efforts and on our ability to provide reliable and useful solutions. Brand promotion activities may not yield increased revenue, and even if they do, any increased revenue may not offset the expenses we incur in building our brand. To date, we have developed our brand at a low cost primarily by partnering with large Internet companies who drive traffic to our web site. Our strategy of partnering with large Internet companies may not continue to build awareness of our brand at the rate we expect. If we are unable to rely on the low cost distribution strategy of partnering with these Internet companies, we would incur costs to replace this distribution which would adversely affect our results of operations. If we fail to successfully promote and maintain our brand, or incur substantial expenses in an unsuccessful attempt to promote and maintain our brand, we may fail to attract new customers or retain our existing customers to the extent necessary to realize a sufficient return on our brand-building efforts, and our business could suffer.
We are dependent on our executive officers and are searching for a new Chief Executive Officer, and the loss of any of our existing officers or delay or inability in finding a Chief Executive Officer may prevent us from implementing our business plan in a timely manner if at all.
Our success depends largely upon the continued services of our executive officers and other key personnel. We are also substantially dependent on the continued service of our existing development personnel because of the complexity of our products and technologies, as well as on our existing personnel with both compensation management and technical experience because of the difficulty we have had hiring individuals who have experience in both of these fields. In addition, Paul Daoust is currently serving as our interim Chief Executive Officer as we continue our search for a new Chief Executive Officer. The loss of one or more of our key employees or a delay or inability to hire a new Chief Executive Officer could seriously harm our business.
24
Table of Contents
We may not be able to attract and retain the highly skilled employees we need to support our planned growth.
To execute our business strategy, we must attract and retain highly qualified personnel. Competition for these personnel is intense, especially for senior direct sales personnel with compensation management experience and engineers with high levels of experience in designing and developing on-demand software. We have from time to time in the past experienced, and we expect to continue to experience in the future, difficulty in hiring and retaining highly skilled employees with appropriate qualifications. Many of the companies with which we compete for experienced personnel have greater resources than we do. In addition, in making employment decisions, particularly in the Internet and high-technology industries, job candidates often consider the value of the stock options or restricted stock they are to receive in connection with their employment. Significant volatility in the price of our stock may, therefore, adversely affect our ability to attract or retain key employees. If we fail to attract new personnel or fail to retain and motivate our current personnel, our business and future growth prospects could be severely harmed.
Our data is obtained from a variety of sources, some of which may not be available to us in the future.
Our proprietary compensation data sets are comprised of extensive data. We obtain our data from a variety of sources, including major consulting firms and our partners, the SEC and other U.S. government agencies and other third party providers, and through our own research efforts. We generally obtain data on a non-exclusive basis and in a summary form. While we do not generally have an ability to resell such data in its entirety, we use such data internally in generating our proprietary data sets. We cannot assure you that the data we require for our proprietary data sets will be available from these sources in the future or that the cost of such data will not increase. From time to time in the past, third parties have sent us letters asserting that our use of data may have violated our agreement with them or infringed upon their copyright. Although we believe that our purchase and use of all third party surveys complies with copyright law and any applicable license agreements, we cannot assure you that we will prevail in any such claims asserted against us and any litigation, regardless of its validity, may involve significant costs and could divert our management’s time and attention from developing our business.
If any third party successfully asserts a claim that we have violated their copyrights or our license agreements with them, we may be required to remove the applicable data from our data sets and regenerate our data sets without such data. Additionally, we may no longer be able to obtain data from the provider or other providers on reasonable terms, if at all. Any inability to obtain data may have a material adverse effect on our business, financial condition and results of operations.
Further, as we expand our customer base to include customers outside of the United States, we may not be able to obtain sufficient international data on reasonable terms to support our data sets. We plan to obtain data which we believe is sufficient to build proprietary data sets in order to support the development of an international business. We expect to incur substantial expense to build proprietary data sets for international markets. We cannot assure you that we will be able to successfully obtain sufficient data to develop proprietary data sets for international markets.
We may expand through acquisitions of, investments in or through business relationships with other organizations, all of which may divert our management’s attention, result in additional dilution to our stockholders, consume resources that are necessary to sustain our business and may not result in the realization of the goals underlying the acquisition, investment or business relationship.
One of our business strategies is to selectively pursue the acquisition of companies that would either expand the functionality of our compensation management and talent management solutions or provide access to new customers or markets, or both. We also may enter into business relationships with other organizations in the future in order to expand our offerings, which could involve preferred or exclusive licenses, additional channels of distribution or discount pricing or investments in other organizations. An acquisition, investment or business
25
Table of Contents
relationship may result in unforeseen operating difficulties and expenditures. In particular, we may encounter difficulties assimilating or integrating the acquired organizations, technologies, products, personnel or operations of the acquired organizations, particularly if the key personnel of the acquired company choose not to work for us, and we may have difficulty retaining the customers of any acquired business due to changes in management and ownership. Acquisitions may also disrupt our ongoing business, divert our resources and require significant management attention that would otherwise be available for ongoing development of our business. We also may experience lower rates of renewal from customers obtained through acquisitions than we do from existing customers. Additionally, to the extent we expand into new facilities, we may have difficulty maintaining uniform standards, controls, procedures and policies across locations. Moreover, we cannot assure you that the anticipated benefits of any acquisition, investment or business relationship would be realized or that we would not be exposed to unknown liabilities. For example, we have decided to exit the businesses we acquired in the Genesys transaction, as well as our small business payroll and our sales compensation businesses as we have made the decision to focus on our core compensation and talent management businesses. In connection with one or more potential future transactions, we may:
| • | issue additional equity securities that would dilute our existing stockholders’ ownership; |
| • | use cash that we may need in the future to operate our business; |
| • | incur debt on terms unfavorable to us or that we are unable to repay; |
| • | incur large charges or substantial liabilities; |
| • | encounter difficulties retaining key employees of an acquired company or integrating diverse business cultures; and |
| • | become subject to adverse tax and accounting consequences. |
Although we periodically engage in preliminary discussions with respect to acquisitions, we are not currently a party to any agreement or commitment, and we have no understandings with respect to any acquisition.
If we determine that any of our goodwill or intangible assets, including technology purchased in acquisitions, are impaired, we would be required to take a charge to earnings, which could have a material adverse effect on our results of operations.
We have a significant amount of goodwill and other intangible assets, such as product and core technology, related to our acquisitions. We recorded significant additional goodwill and other intangible asset amounts in connection with the acquisition of Genesys and Salary.com Limited in fiscal 2009 and Schoonover and ICR in fiscal 2008. We do not amortize goodwill and intangible assets that are deemed to have indefinite lives. However, we do amortize certain product related technologies, trademarks, patents and other intangibles and we periodically evaluate them for impairment. We review goodwill for impairment annually, or sooner if events or changes in circumstances indicate that the carrying amount could exceed fair value, at the reporting unit level (operating segment). Fair values are based on discounted cash flows using a discount rate determined by our management to be consistent with industry discount rates and the risks inherent in our current business model. Due to uncertain market conditions and potential changes in our strategy and product portfolio, it is possible that the forecasts we use to support our goodwill and other intangible assets could change in the future, which could result in non-cash charges that would adversely affect our results of operations and financial condition.
Furthermore, impairment testing requires significant judgment, including the identification of reporting units based on our internal reporting structure that reflects the way we manage our business and operations and to which our goodwill and intangible assets would be assigned. Significant judgments are required to estimate the fair value of our goodwill and intangible assets, including estimating future cash flows, determining appropriate discount rates, estimating the applicable tax rates, foreign exchange rates and interest rates, projecting the future industry trends and market conditions, and making other assumptions. Changes in these estimates and assumptions, including changes in our reporting structure, could materially affect our determinations of fair value.
26
Table of Contents
We have recorded approximately $38.0 million of goodwill and intangible assets in connection with our acquisitions. If the actual revenues and operating profit attributable to acquired intangible assets are less than the projections we used to initially value these intangible assets when we acquired them, then these intangible assets may be deemed to be impaired. If we determine that any of the goodwill or other intangible assets associated with our recent acquisitions are impaired, as was the case with Genesys in fiscal 2010, then we would be required to reduce the value of those assets or to write them off completely by taking a related charge to earnings. If we are required to write down or write off all or a portion of those assets, or if financial analysts or investors believe we may need to take such action in the future, our stock price and operating results could be materially adversely affected.
In February 2010, as a result of our strategic realignment subsequent to the resignation of its Chief Executive Officer, we identified a triggering event related to the goodwill and intangible assets of our payroll/HRMS reporting unit acquired as part of the Genesys transaction. This event led us to revise our expectations of future invoicing, revenues and operating profit margins for the payroll/HRMS reporting unit. As a result, the Company determined it was necessary to assess the recoverability of the reporting unit’s intangible assets and goodwill. Based on the impairment testing performed, we incurred non-cash charges of $3.5 million and $2.1 million related to the write-down of intangible assets and goodwill, respectively, for our payroll/HRMS reporting unit. As of March 31, 2010, we had $15.0 million of consolidated goodwill, after we recorded the aforementioned impairment charge.
At March 31, 2010, we had $0.9 million of unamortized intangibles, which include trade names we purchased in acquisitions. These intangibles are primarily associated with on-demand compensation management products. Our customers or prospective customers may not purchase or widely accept our new products. If we fail to complete the development of our anticipated future product and service offerings, including product offerings acquired through our acquisitions, if we fail to complete them in a timely manner, or if we are unsuccessful in selling any new lines of products and services, we could determine that the value of the purchased technology is impaired in whole or in part and take a charge to earnings. We could also incur additional charges in later periods to reflect costs associated with completing those projects that could not be completed in a timely manner. An impairment charge could have a material adverse effect on our results of operations. If the actual revenues and operating profit attributable to acquired product and core technologies are less than the projections we used to initially value product and core technologies when we acquired it, such intangible assets may be deemed to be impaired. If we determine that any of our intangible assets are impaired, we would be required to take a related charge to earnings that could have a material adverse effect on our results of operations.
We face competition from a variety of sources, and our failure to compete successfully could make it difficult for us to add new customers and retain existing customers and could reduce or impede the growth of our business.
The markets for on-demand compensation management and talent management solutions are fragmented, competitive and rapidly evolving, and there are low barriers to entry to some segments of these markets. We expect the intensity of competition to increase in the future as existing competitors develop their capabilities and as new companies enter our markets. Additionally, as we expand our suite of compensation management and talent management solutions and create new types of applications, we may face additional competition. Increased competition could result in pricing pressure, reduced sales, lower margins or the failure of our solutions to achieve or maintain broad market acceptance. If we are unable to compete effectively, it will be difficult for us to maintain our pricing rates and add and retain customers, and our business, financial condition and results of operations will be seriously harmed. We face competition primarily from:
| • | generic desktop software and in-house or custom-developed solutions; |
| • | established software vendors offering products specifically designed for compensation management or talent management; |
| • | established compensation and HR consulting firms; |
27
Table of Contents
| • | other websites and advertising venues; and |
| • | existing and future start-up companies offering software, data and interactive HR solutions. |
Many of our current and potential competitors have longer operating histories, a larger presence in the general corporate compensation and talent management market, access to larger customer bases and substantially greater financial, technical, sales and marketing, management, service, support and other resources than we have. As a result, our competitors may be able to respond more quickly than we can to new or changing opportunities, technologies, standards or customer requirements or devote greater resources to the promotion and sale of their products and services than we can. To the extent our competitors have an existing relationship with a potential customer, that customer may be unwilling to switch vendors due to existing commitments with such competitors.
We also expect that new competitors, including companies currently operating in the HR market, enterprise software vendors and online service providers that have traditionally focused on enterprise resource planning or back office applications will enter the on-demand compensation management market with competing products as this market develops and matures. Many of these potential competitors have established or may establish business, financial or strategic relationships among themselves or with existing or potential customers, alliance partners or other third parties or may combine and consolidate to become more formidable competitors with better resources. It is possible that these new competitors could rapidly acquire significant market share.
Mergers or other strategic transactions involving our competitors could weaken our competitive position or reduce our revenue.
We believe that our industry is highly fragmented and that there is likely to be consolidation, which could lead to increased price competition and other forms of competition. Increased competition may cause pricing pressure and loss of market share, either of which could have a material adverse effect on our business, financial condition and results of operations. Our competitors may establish or strengthen cooperative relationships with HR BPO vendors, systems integrators, third party consulting firms or other parties. Established companies may not only develop their own products but may also merge with or acquire our current competitors. In addition, we may face competition in the future from large established companies, as well as from emerging companies that have not previously entered the markets for compensation management or talent management solutions or that currently do not have products that directly compete with our solutions. It is also possible that new competitors or alliances among competitors may emerge and rapidly acquire significant market share. In addition, our competitors may announce new products, services or enhancements that better meet the price or performance needs of clients or changing industry standards.
If there are interruptions or delays in our on-demand services due to third-party error, our own error or the occurrence of unforeseeable events, delivery of our solutions and the use of our service could become impaired, which could harm our relationships with customers and subject us to liability.
All of our solutions reside on hardware that we own or lease and operate and which is currently located at third party operations facilities maintained and operated by AT&T. We do not maintain long-term supply contracts with AT&T, and AT&T does not guarantee that our customers’ access to our solutions will be uninterrupted, error-free or secure. Our operations depend on AT&T’s ability to protect their and our systems in their facilities against damage or interruption from natural disasters, power or telecommunications failures, computer viruses or other attempts to harm our systems, criminal acts and similar events. In the event that our operations facility arrangement with AT&T are terminated, or there is a lapse of service or damage to the facility, we could experience interruptions in our service as well as delays and additional expense in arranging new facilities and services.
Our disaster recovery computer hardware and systems located at our headquarters in Needham, Massachusetts have not been tested under actual disaster conditions and may not have sufficient capacity to recover all data and services in the event of an outage occurring at our operations facility. In the event of a disaster in which our operations facility was irreparably damaged or destroyed, we could experience lengthy
28
Table of Contents
interruptions in our service. Moreover, our disaster recovery computer hardware and systems are located approximately fifteen miles from our operations facility and may be equally or more affected by any disaster affecting our operations facility. Any or all of these events could cause our customers to lose access to our on-demand software.
Our on-demand compensation management and talent management solutions are accessed by a large number of customers at the same time. As we continue to expand the number of our customers and applications available to our existing clients, we may not be able to scale our technology to accommodate the increased capacity requirements, which may result in interruptions or delays in services. In addition, the failure by the AT&T facility to meet our capacity requirements could result in interruptions or delays in our service or impede our ability to scale our operations.
We design the system infrastructure and procure and own or lease the computer hardware used for our on-demand services. Design and mechanical errors, spikes in usage volume and failure to follow system protocols and procedures could cause our systems to fail, resulting in interruptions in our service. While we have not experienced extended system failures in the past, any interruptions or delays in our service, whether as a result of third-party error, our own error, natural disasters or security breaches, whether accidental or willful, could harm our relationships with customers and our reputation. Also, in the event of damage or interruption, our insurance policies may not adequately compensate us for any losses that we may incur. These factors in turn could damage our brand and reputation, divert our employees’ attention, reduce our revenue, subject us to liability, cause us to issue credits or cause customers to fail to renew their subscriptions, any of which could adversely affect our business, financial condition and results of operations.
Material defects or errors in our on-demand software could affect our reputation, result in significant costs to us and impair our ability to sell our solutions, which would harm our business.
The software applications forming part of our solutions may contain material defects or errors, which could materially and adversely affect our reputation, result in significant costs to us and impair our ability to sell our solutions in the future. After the release of our products, defects or errors may also be identified from time to time by our internal team and by our clients. The costs incurred in correcting any material product defects or errors may be substantial and would adversely affect our operating results. Such defects or errors may occur in the future.
Because our customers use our solutions for important aspects of their business, any errors or defects in, or other performance problems with, our solutions could hurt our reputation and may damage our customers’ businesses. If that occurs, we could lose future sales or our existing customers could elect not to renew their agreements with us. Software performance problems could result in loss of market share, failure to achieve, or a delay in achieving, market acceptance of our solutions and the diversion of development resources. If one or more of our solutions fail to perform or contain a technical defect, a customer may assert a claim against us for substantial damages, whether or not we are responsible for our solutions’ failure or defect. We do not currently maintain any warranty reserves.
Product liability claims could require us to spend significant time and money in litigation or arbitration/dispute resolution or to pay significant settlements or damages. Although we maintain general liability insurance, including coverage for errors and omissions, this coverage may be inadequate, or may not be available in the future on reasonable terms, or at all. Defending a lawsuit, regardless of its merit, could be costly and divert management’s attention and could cause our business to suffer.
We may be liable to our customers and may lose customers if we provide poor service, if our solutions do not comply with our agreements or if there is a loss of data.
The information used in our proprietary data sets may not be complete or may contain inaccuracies that our customers regard as significant. Our ability to collect and report data may be interrupted by a number of factors, including the termination of agreements with third-party data providers, our inability to access the Internet, the
29
Table of Contents
failure of our network or software systems or failure by our operations facility to meet our capacity requirements. In addition, computer viruses and intentional or unintentional acts of our employees may harm our systems, causing us to lose data we maintain and supply to our customers or data that our customers input and maintain on our systems, and the transmission of computer viruses could expose us to litigation. Our subscription agreements generally give our customers the right to terminate their agreements for cause if we materially breach our obligations. Any failures in the services that we supply or the loss of any of our customers’ data that we cannot rectify in a reasonable time period may give our customers the right to terminate their agreements with us and could subject us to liability. As a result, we may also be required to spend substantial amounts to defend lawsuits and pay any resulting damage awards. In addition to potential liability, if we supply inaccurate data or experience interruptions in our ability to supply data, our reputation could be harmed and we could lose customers. Although we maintain general liability insurance, including coverage for errors and omissions, this coverage may be inadequate, or may not be available in the future on reasonable terms, or at all. In addition, we cannot assure you that this policy will cover any claim against us for loss of data or other indirect or consequential damages and defending a lawsuit, regardless of its merit, could be costly and divert management’s attention.
Because our products collect and analyze applicants’ and employees’ stored personal information, concerns that our products do not adequately protect the privacy of applicants and employees could result in liability to us and inhibit sales of our products.
Some of the features of our compensation management and talent management applications depend on the ability to develop and maintain profiles of applicants and employees for use by our clients. Our software applications augment these profiles over time by capturing additional data and collecting usage data. Although our applications are designed to protect user privacy, privacy concerns nevertheless may cause individuals and businesses to resist providing the personal data necessary to support our products. Any inability to adequately address privacy concerns, even if unfounded, or comply with applicable privacy laws and regulations, could result in liability to us, damage our reputation, inhibit sales of our products and seriously harm our business, financial condition and operating results.
As we continue to extend our operations outside of the United States, we may become subject to various data protection regulations such as those adopted by the European Union related to the confidentiality of personal data.
If our security measures are breached and unauthorized access is obtained to client data, clients may curtail or stop their use of our solutions, which would harm our business, financial condition and results of operations.
Our solutions involve the storage and transmission of confidential information of clients and their existing and potential employees, and security breaches could expose us to a risk of loss of, or unauthorized access to, this information, resulting in possible litigation and possible liability. If our security measures were ever breached as a result of third-party action, employee error, malfeasance or otherwise, and, as a result, an unauthorized party obtained access to this confidential data, our reputation could be damaged, our business could suffer and we could incur significant liability. Techniques used to obtain unauthorized access or to sabotage systems change frequently and generally are not discovered until launched against a target. As a result, we may be unable to anticipate these techniques or to implement adequate preventative measures. If an actual or perceived breach of our security occurs, the market perception of our security measures could be harmed and we could lose sales and clients.
We may increase our sales and marketing efforts to clients outside the United States and open additional offices outside the United States, which would expose us to additional risks associated with international operations.
As a part of our business strategy we have increased our operations outside the United States. In December 2006, we established a wholly foreign owned enterprise in Shanghai, China primarily for software development. In March 2008, we released our first international dataset within the existing CompAnalyst market pricing suite
30
Table of Contents
in Canada and completed our first sales to customers. In August 2008, we acquired Salary.com Limited, a wholly owned subsidiary in the United Kingdom. While we have no additional specific plans or commitments with respect to any further international expansion, we may open additional offices outside of the United States in the future. We may not be successful in our efforts to establish our Chinese operations or to expand our sales into Canada and other international markets and open additional international offices. International operations and sales subject us to risks and challenges that we would otherwise not face if we conducted our business only in the United States including:
| • | legal and regulatory restrictions; |
| • | challenges caused by distance, language and cultural differences and in doing business with foreign agencies and governments; |
| • | difficulties obtaining additional data sources that cover international job markets at a reasonable cost; |
| • | difficulties obtaining the data necessary to support international customers on reasonable terms, if at all; |
| • | difficulties developing algorithms that can be used to generate and analyze data on international job markets; |
| • | difficulties in developing products and services in different languages and for different cultures; |
| • | difficulties in managing and staffing international operations; |
| • | challenges in protecting data and intellectual property; |
| • | longer payment cycles in some countries; |
| • | credit risk and higher levels of payment fraud; |
| • | currency exchange rate fluctuations; |
| • | political and economic instability and export restrictions; |
| • | potentially adverse tax consequences, including the complexities of foreign value added tax systems and restrictions on the repatriation of earnings; and |
| • | higher costs associated with doing business internationally. |
Our limited experience with conducting business internationally increases our risk of operating internationally and requires management to focus additional attention and resources on our international operations. These risks could harm our international expansion efforts or other aspects of our business, which would in turn harm our business, financial condition and results of operations.
Evolving regulation of the Internet may increase our expenditures related to compliance efforts, which may adversely affect our financial condition.
As Internet commerce continues to evolve, increasing regulation by federal, state or foreign agencies becomes more likely. We are particularly sensitive to these risks because the Internet is a critical component of our on-demand business model. For example, we believe that increased regulation is likely in the area of data privacy, and laws and regulations applying to the solicitation, collection, processing or use of personal or consumer information could affect our clients’ ability to use and share data, potentially reducing demand for solutions accessed via the Internet and restricting our ability to store, process and share data with our clients via the Internet. In addition, taxation of services provided over the Internet or other charges imposed by government agencies or by private organizations for accessing the Internet may also be imposed. Any regulation imposing greater fees for Internet use or restricting information exchange over the Internet could result in a decline in the use of the Internet and the viability of Internet-based services, which could harm our business.
31
Table of Contents
The success of our business depends on the continued growth and acceptance of the Internet as a business and communications tool, and the related expansion of the Internet infrastructure.
The future success of our business depends upon the continued and widespread use of the Internet as a primary medium for commerce, communication and business applications. Our business growth would be impeded if the performance or perception of the Internet was harmed by security problems such as “viruses,” “worms” and other malicious programs, reliability issues arising from outages and damage to Internet infrastructure, delays in development or adoption of new standards and protocols to handle increased demands of Internet activity, increased costs, decreased accessibility and quality of service or increased government taxation of Internet activity.
The Internet has experienced, and is expected to continue to experience, significant user and traffic growth, which has, at times, caused user frustration with slow access and download times. If Internet activity grows faster than Internet infrastructure or if the Internet infrastructure is otherwise unable to support the demands placed on it, or if hosting capacity becomes scarce, our business growth may be adversely affected.
If we are unable to protect our proprietary technology and other intellectual property rights, it will reduce our ability to compete for business and we may lose valuable assets, experience reduced revenue and incur costly litigation to protect our rights.
Our intellectual property rights are important to our business, and our success is dependent, in part, on protecting our proprietary technology and our brand, marks and domain names. In particular, the processes we use when working with the data we obtain, including the use of algorithms and other analytical tools, are critical to the accuracy of our data sets and the success of our business. We rely on a combination of patent, copyright, trademark and trade secret laws, as well as licensing agreements, third-party nondisclosure agreements and other contractual provisions and technical measures, to protect our intellectual property rights. These protections may not be adequate to prevent our competitors from copying our solutions or otherwise infringing on our intellectual property rights. Existing copyright laws afford only limited protection for our intellectual property rights and may not protect such rights in the event competitors independently develop solutions similar or superior to ours. In addition, the laws of some countries in which our solutions are or may be licensed may not protect our solutions and intellectual property rights to the same extent as do the laws of the United States.
To protect our proprietary methods, we have two U.S. issued patents and corresponding foreign equivalents, and currently have three U.S. patent applications pending and corresponding foreign equivalents. We cannot assure you that the U.S. Patent and Trademark Office (or its foreign equivalents) will grant these patents, or that the patents granted will give us the protection that we seek.
To protect our trade secrets and other proprietary information, we require employees, consultants, advisors and collaborators to enter into non-disclosure agreements. These agreements may not provide meaningful protection for our trade secrets, know-how or other proprietary information in the event of any unauthorized use, misappropriation or disclosure of such trade secrets, know-how or other proprietary information.
We will not be able to protect our intellectual property if we do not detect unauthorized use of our intellectual property. If we discover that a third party is infringing upon our intellectual property rights, we may need to undertake costly and time-consuming litigation to enforce our intellectual property rights. We cannot be sure we will prevail in any litigation filed to protect our intellectual property, and even if we are successful in protecting our intellectual property rights, we may incur significant legal costs and management’s attention may be diverted from the ongoing development of our business, which could adversely affect our business. If we are unable to protect our intellectual property, our competitors could use our intellectual property to market products similar to ours, which could decrease demand for our solutions.
32
Table of Contents
If a third party asserts that we are infringing its intellectual property, whether successful or not, it could subject us to costly and time-consuming litigation or expensive licenses, and our business may be harmed.
The software and Internet industries are characterized by the existence of a large number of patents, trademarks and copyrights and by frequent litigation based on allegations of infringement or other violations of intellectual property rights. Third parties may assert patent and other intellectual property infringement claims against us in the form of lawsuits, letters, or other forms of communication. If a third party successfully asserts a claim that we are infringing their proprietary rights, royalty or licensing agreements might not be available on terms we find acceptable or at all. As currently pending patent applications are not publicly available, we cannot anticipate all such claims or know with certainty whether our technology infringes the intellectual property rights of third parties.
Any litigation, with or without merit, could be time consuming and expensive to litigate or settle and could divert management’s attention from our business. Any license agreement we enter into with the patent holder could have unfavorable terms, including royalty payments, which could adversely affect our business.
In order to obtain certain of the necessary data that serves as the backbone of our compensation management solutions, we enter into agreements with major consulting firms and other third-party providers. We generally receive data in a summary form. We do not generally have an ability to resell such data in its entirety, but we can use such data internally to generate our proprietary data sets. If a third party successfully asserts a claim that our use of its data has violated our agreement with such provider or infringed upon their copyright, we may be required to remove the applicable data from our data sets and regenerate our data sets without such data. Additionally, we may no longer be able to obtain data from the provider or other providers on reasonable terms, if at all.
We expect that the number of infringement and breach of contract claims in our market will increase as the number of solutions and competitors in our industry grows. These claims, whether or not successful, could:
| • | require significant management time and attention; |
| • | result in costly and time-consuming litigation, and the payment of substantial damages; |
| • | require us to enter into royalty or licensing agreements, which may not be available on terms acceptable to us, if at all; |
| • | require us to remove data from our compensation management data sets and regenerate our data sets without such data; |
| • | require us to expend additional development resources to redesign our solutions to avoid infringement or discontinue the sale of our solutions; |
| • | create negative publicity that adversely affects our reputation and brand and the demand for our solutions; or |
| • | require us to indemnify our clients. |
As a result, any third-party intellectual property infringement claims or breach of contract claims against us could increase our expenses and adversely affect our business. In addition, many of our customer agreements require us to indemnify our customers for third-party intellectual property infringement claims, which would increase the cost to us resulting from an adverse ruling in any such claim. Even if we have not infringed any third parties’ intellectual property rights, we cannot be sure our legal defenses will be successful, and even if we are successful in defending against such claims, our legal defense could require significant financial resources and management’s time, which could adversely affect our business.
Our reported financial results may be adversely affected by changes in accounting principles generally accepted in the United States.
Generally accepted accounting principles in the United States are subject to interpretation by the Financial Accounting Standards Board, or FASB, the American Institute of Certified Public Accountants, the Securities and
33
Table of Contents
Exchange Commission, or SEC, and various bodies formed to promulgate and interpret appropriate accounting principles. A change in these principles or interpretations could have a significant effect on our reported financial results, and could affect the reporting of transactions completed before the announcement of a change.
Our ability to use net operating loss carryforwards in the United States may be limited.
As of March 31, 2010, we had net operating loss carryforwards of approximately $41.9 million for federal tax purposes. These loss carryforwards expire at various dates through 2030. To the extent available, we intend to use these net operating loss carryforwards to reduce the U.S. corporate income tax liability associated with our operations. Section 382 of the U.S. Internal Revenue Code of 1986 generally imposes an annual limitation on the amount of net operating loss carryforwards that may be used to offset taxable income when a corporation has undergone significant changes in stock ownership. Our ability to utilize net operating loss carryforwards may be limited by the issuance of common stock in our initial public offering. To the extent our use of net operating loss carryforwards is significantly limited, our income could be subject to U.S. corporate income tax earlier than it would if we were able to use net operating loss carryforwards, which could result in lower profits.
Being a public company has increased and will continue to increase our administrative costs.
As a public company, we have incurred and will continue to incur significant legal, accounting and other expenses that we did not incur as a private company. Sarbanes-Oxley, as well as new rules subsequently implemented by the SEC and the NASDAQ Capital Market, have required changes in corporate governance practices of public companies. These new rules and regulations have increased our legal and financial compliance costs, and have made some activities more time consuming and/or costly. For example, we have migrated our core financial systems to our new accounting system, adopted additional internal controls and disclosure controls and procedures and adopted corporate governance policies. We also are subject to Section 404(a) of Sarbanes-Oxley which requires us to complete a formal evaluation, documentation and analysis of our internal controls, and remedy any deficiencies, significant deficiencies or material weaknesses that we may identify. In addition, as a public company we have all of the internal and external costs of preparing and distributing periodic public reports in compliance with our obligations under the securities laws. These new rules and regulations could also make it more difficult for us to attract and retain qualified members of our board of directors, particularly to serve on our audit committee, and qualified executive officers.
An active trading market for our common stock may not be available on a consistent basis to provide stockholders with adequate liquidity. Our stock price may be extremely volatile, and our stockholders could lose a significant part of their investment.
An active trading market for shares of our common stock may not be sustained on a consistent basis. The public trading price for our common stock will be affected by a number of factors, including:
| • | quarterly variations in our operating results; |
| • | seasonality of our business cycle; |
| • | interest rate changes; |
| • | changes in the market’s expectations about our operating results; |
| • | our operating results failing to meet the expectation of securities analysts or investors in a particular period or failure of securities analysts to publish reports about us or our business; |
| • | changes in financial estimates and recommendations by securities analysts concerning our company or the on-demand software industry in general; |
| • | operating and stock price performance of other companies that investors deem comparable to us; |
| • | news reports relating to trends in our markets; |
34
Table of Contents
| • | announcements by us or our competitors of acquisitions, changes in strategy, new offerings or improvements, significant contracts, commercial relationships or capital commitments; |
| • | our ability to market new and enhanced offerings on a timely basis; |
| • | changes in laws and regulations affecting our business; |
| • | commencement of, or involvement in, litigation; |
| • | the volume of shares of our common stock available for public sale; |
| • | any major change in our board or management; |
| • | sales of substantial amounts of common stock by our directors, executive officers or significant stockholders or the perception that such sales could occur; |
| • | general economic and political conditions such as recessions and acts of war or terrorism; and |
| • | the other factors described elsewhere in these “Risk Factors.” |
As a result of these factors, our stockholders may not be able to resell their shares at, or above, their purchase price.
In addition, we currently receive very limited analyst coverage. The trading market for our common stock relies in part on the research and reports that industry or financial analysts publish about us or our business. We do not control these analysts. There are many large, well-established publicly-traded companies active in our industry and market, which may mean it will be less likely that we receive widespread analyst coverage. Furthermore, if one or more of the analysts who do cover us downgrade our stock, our stock price would likely decline rapidly. If one or more of these analysts cease coverage of us, we could lose visibility in the market, which in turn could cause our stock price to decline and may also impair our ability to expand our business with existing customers and attract new customers.
Given the volatility of our stock and trends in the stock market in general, at any given time we might not meet the continued listing requirements of The NASDAQ Capital Market. If we are not able to maintain the requirements for continued listing on The NASDAQ Capital Market, we could be de-listed, which could have a materially adverse effect on the price and liquidity of our common stock.
As a result of our failure to meet certain minimum listing requirements on the NASDAQ Global Market, we recently transferred the listing of our common stock from the NASDAQ Global Market to the NASDAQ Capital Market. Like the NASDAQ Global Market, the NASDAQ Capital Market has certain compliance requirements for continued listing of common stock. Among other requirements, the NASDAQ Capital Market requires the minimum bid price of a company’s registered shares to be $1.00. In the fiscal year ended March 31, 2010, the closing bid price of our stock was as low as $1.42. If our minimum closing bid price per share falls below $1.00 for a period of 30 consecutive trading days in the future, we will be subject to delisting procedures. We also must meet additional continued listing requirements, which requires, among other things, that we have a minimum of $2,500,000 in stockholders’ equity, $35,000,000 market value of listed securities or $500,000 of net income from continuing operations in the most recently completed fiscal year (or two of the three most recently completed fiscal years).
As of the close of business on June 22, 2010, we were in compliance with the continued listing requirements of the NASDAQ Capital Market. There can be no assurances that we will continue to meet these continued listing requirements. Delisting could reduce the ability of our stockholders to purchase or sell shares as quickly and as inexpensively as they have done historically. For instance, failure to obtain listing on another market or exchange may make it more difficult for traders to sell our securities. Broker-dealers may be less willing or able to sell or make a market in our common stock. Not maintaining our NASDAQ Capital Market listing may result in a decrease in the trading price of our common stock, lessen interest by institutions and individuals in investing in our common stock, make it more difficult to obtain analyst coverage, and make it more difficult for us to raise capital in the future.
35
Table of Contents
The concentration of our capital stock ownership with insiders will likely limit your ability to influence corporate matters.
Our executive officers, directors and affiliated entities together beneficially own approximately 35% of our common stock. As a result, these stockholders, acting together, will have control over most matters that require approval by our stockholders, including the election of directors and approval of significant corporate transactions. Corporate action might be taken even if other stockholders oppose them. This concentration of ownership might also have the effect of delaying or preventing a change of control of our company that other stockholders may view as beneficial. In addition, Kent Plunkett, our Chairman of our Board of Directors, directly and indirectly owns approximately 20% of our common stock. Mr. Plunkett’s significant ownership interest could adversely affect investors’ perception of our corporate governance or delay, prevent or cause a change in control of our company, any of which could adversely affect the market price of our common stock.
Future sales, or the availability for sale, of our common stock may cause our stock price to decline.
Sales of substantial amounts of our common stock in the public market, or the perception that such sales could occur, could adversely affect the market price of our common stock and could materially impair our future ability to raise capital through offerings of our common stock.
Our Shareholder Rights Plan or provisions in our amended and restated certificate of incorporation and bylaws or Delaware law might discourage, delay or prevent a change of control of our company or changes in our management and, therefore, depress the trading price of our stock.
We have adopted a Shareholder Rights Plan, under which the rights become exercisable if a person becomes an “acquiring person” by acquiring 20% or more of the outstanding shares of common stock or if a person commences a tender offer that would result in that person owning 20% or more of the common stock. If a person becomes an “acquiring person,” each holder of a right (other than the acquiring person) would be entitled to purchase, at the then-current exercise price, such number of shares of our preferred stock which are equivalent to shares of common stock having twice the exercise price of the right. If we are acquired in a merger or other business combination transaction after any such event, each holder of a right would then be entitled to purchase, at the then-current exercise price, shares of the acquiring company’s common stock having a value of twice the exercise price of the right. The Shareholder Rights Plan could make it more difficult for a third party to acquire, or could discourage a third party from acquiring, us or a large block of our common stock.
In addition to our Shareholder Rights Plan, our amended and restated certificate of incorporation and bylaws contain provisions that could depress the trading price of our common stock by acting to discourage, delay or prevent a change in control of our company or changes in our management that the stockholders of our company may deem advantageous. These provisions include:
| • | our board of directors is divided into three classes serving staggered three-year terms; |
| • | only our board of directors may call special meetings of our stockholders; |
| • | our stockholders may take action only at a meeting of our stockholders and not by written consent; |
| • | we have authorized undesignated “blank check” preferred stock, the terms of which may be established and shares of which may be issued without stockholder approval; |
| • | stockholder approval of amendments of our certificate of incorporation requires a vote of a majority of our outstanding shares and, in some cases, a vote of 75% of our outstanding shares; |
| • | stockholder approval of amendments of our by-laws requires a vote of a majority of our outstanding shares or, if the amendment is not recommended by our board of directors, a vote of 75% of our outstanding shares; |
| • | vacancies on the board of directors may be filled only by the directors; |
36
Table of Contents
| • | stockholders may remove our directors only for cause and with the affirmative vote of the holders of 75% of the votes that all stockholders would be entitled to cast in the election of directors; and |
| • | we require advance notice for stockholder proposals. |
In addition, Section 203 of the Delaware General Corporation Law may discourage, delay or prevent a change in control of our company.
We do not intend to pay dividends on our common stock in the foreseeable future.
We have not declared or paid any cash dividends on our common stock. We currently intend to retain any future earnings and do not expect to pay any dividend in the foreseeable future. As a result, you may only receive a return on your investment in our common stock if the market price of our common stock increases.
| ITEM 2. | PROPERTIES |
Information regarding our principal properties at March 31, 2010 is set forth below:
| Location |
Principal Use | Sq. Footage | Ownership | |||
| Needham, Massachusetts |
Corporate Headquarters | 36,288 | Leased | |||
| Shanghai, China |
Research and development | 31,240 | Leased | |||
| Methuen, Massachusetts |
Professional services and development |
30,698 | Leased | |||
| Oxford, United Kingdom |
Sales administration and professional services |
6,409 | Leased | |||
| Montego Bay, Jamaica |
Sales administration and customer support |
5,502 | Leased |
In June 2010, we shut down our Montego Bay, Jamaica telesales operation and terminated the office lease for the property described above for no additional costs or penalties. We believe that our existing facilities are adequate for our current needs. As additional space is needed in the future, we believe that suitable space will be available in the required locations at commercially reasonable terms.
| ITEM 3. | LEGAL PROCEEDINGS |
We are not currently subject to any material legal proceedings. From time to time, however, we may be named as a defendant in legal actions arising from our normal business activities. These claims, even those that lack merit, could result in the expenditure of significant financial and managerial resources.
| ITEM 4. | REMOVED AND RESERVED |
37
Table of Contents
PART II
| ITEM 5. | MARKET FOR REGISTRANT’S COMMON EQUITY, RELATED COMMON STOCKHOLDER MATTERS AND ISSUER PURCHASES OF EQUITY SECURITIES |
Price Range of Common Stock and Dividend Policy
Our common stock was traded on the Nasdaq Global Market under the symbol “SLRY” from February 15, 2007 through, and including, June 16, 2010. Effective June 17, 2010, our common stock began trading on the Nasdaq Capital Market. The following table presents the high and low sale prices of our common stock as reported by the Nasdaq Global Market, for the period indicated.
| Fiscal year ended March 31, 2009 |
High | Low | ||||
| First quarter |
$ | 6.45 | $ | 3.98 | ||
| Second quarter |
$ | 5.13 | $ | 3.73 | ||
| Third quarter |
$ | 3.98 | $ | 1.50 | ||
| Fourth quarter |
$ | 3.05 | $ | 1.36 | ||
| Fiscal year ended March 31, 2010 |
High | Low | ||||
| First quarter |
$ | 3.31 | $ | 1.42 | ||
| Second quarter |
$ | 3.20 | $ | 2.65 | ||
| Third quarter |
$ | 3.23 | $ | 2.21 | ||
| Fourth quarter |
$ | 2.99 | $ | 2.20 | ||
The last sale price of the common stock on June 22, 2010, as reported by Nasdaq Capital Market, was $2.69 per share. As of June 22, 2010, there were 114 holders of record of our common stock.
We have never declared or paid any cash dividends on our common stock and currently expect to retain future earnings for use in our business for the foreseeable future.
38
Table of Contents
Performance Graph
The following line graph compares cumulative total stockholder returns for the period from February 15, 2007, the date of our initial public offering, through March 31, 2010 for: (1) our common stock; (2) the Nasdaq Composite Index; and (3) the Nasdaq Computers Index. The graph assumes an investment of $100 on February 15, 2007, which was the first day on which our stock was listed on the Nasdaq Composite Index. The calculations of cumulative stockholder return on the Nasdaq National Index and the Nasdaq Computers Index include reinvestment of dividends, but the calculation of cumulative stockholder return on our common stock does not include reinvestment of dividends because we did not pay dividends during the measurement period. The performance shown is not necessarily indicative of future performance.
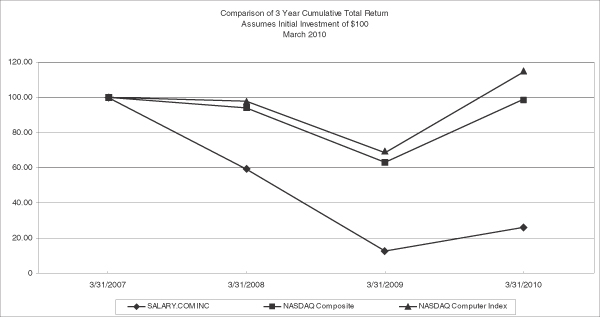
| March 31, | ||||||
| 2008 | 2009 | 2010 | ||||
| Salary.com, Inc. |
59.21 | 12.58 | 26.06 | |||
| Nasdaq Composite |
94.11 | 63.12 | 99.02 | |||
| Nasdaq Computer Index |
97.89 | 68.50 | 114.47 | |||
39
Table of Contents
Equity Compensation Plan Information
The following table sets forth certain information as of March 31, 2010 with respect to compensation plans under which our equity securities are authorized for issuance:
| (a) Number of securities to be issued upon exercise of outstanding options, warrants and rights |
(b) Weighted-average exercise price of outstanding options, warrants and rights |
(c) Number of securities remaining available for future issuance under equity compensation plans (excluding securities reflected in column (a)) |
||||||
| Equity compensation plans approved by security holders (1): |
1,141,227 | $ | 7.00 | 4,556,575 | (2) | |||
| Equity compensation plans not approved by security holders (3): |
159,607 | 0.70 | — | |||||
| Total |
1,300,834 | $ | 6.23 | 4,556,575 | ||||
| (1) | Please see Note 9 of our Notes to Consolidated Financial Statements for description of our equity compensation plans. |
| (2) | Includes 319,813 shares that remain available for purchase under the Salary.com Employee Stock Purchase Plan, 370,075 shares for stock options that have been exercised but have not vested as of March 31, 2010 and 1,603,856 shares for restricted stock unit awards that have not vested as of March 31, 2010. |
| (3) | Consists of the following plans assumed in our acquisition of Genesys Software Systems, Inc. (Genesys) in December 2008: (i) the Genesys Software Systems, Inc. Incentive Stock Option Plan Dated November 16, 1990, amended and restated through December 10, 2008; (ii) the Genesys Software Systems, Inc. Directors and Consultants Stock Option Plan Dated March 10, 1998, amended and restated through December 10, 2008; (iii) and the Genesys Software Systems, Inc. Stock Option Plan of November 17, 2000, amended and restated through December 10, 2008. |
Plans Assumed In the Genesys Acquisition
In connection with our acquisition of Genesys in December 2008, we assumed the Genesys Incentive Stock Option Plan, the Genesys Directors and Consultants Stock Option Plan and the Genesys Stock Option Plan, each which was previously adopted and approved by the board of directors and stockholders of Genesys. Under the terms of these plans, Genesys was authorized to grant incentive and non-qualified stock options and restricted stock to its employees, directors and advisors. Following our acquisition of Genesys, we assumed all of the outstanding options under these plans, and all of the options issued under these plans were converted into the right to receive 519,492 shares of our common stock. Incentive and non-qualified stock options issued under these plans generally vested immediately upon the closing of the acquisition and expire ten years from the date of the acquisition. All options are exercisable upon vesting.
Unregistered Sales of Securities
On January 18, 2010, we issued 32,921 shares of our common stock to the former owner of ITG Competency Group, LLC. We acquired the assets of ITG in August 2007, and under the terms of the asset purchase agreement, the former owner of ITG was eligible to earn up to $1.1 million in additional consideration based on meeting certain performance targets. As of March 31, 2010, $1.1 million had been paid to the former owner of ITG in cash and shares. The 32,921 shares were issued in respect of the final $0.1 million of consideration.
During the fiscal year ended March 31, 2010, we issued 5,779 shares of our common stock upon the exercise of outstanding warrants to purchase common stock at a weighted average exercise price of $0.12 per share.
40
Table of Contents
No underwriters were involved in these transactions, and there were no underwriting discounts or commissions. The issuance of securities described above were deemed to be exempt from registration under the Securities Act of 1933 in reliance on Section 4(2) of the Securities Act of 1933. The recipients of securities in each such transaction represented their intention to acquire the securities for investment only and not with a view to or for sale in connection with any distribution thereof and appropriate legends were affixed to the share certificates and other instruments issued in such transactions. The sales of these securities were made without general solicitation or advertising.
Use of Proceeds from Registered Securities
On February 21, 2007, we issued and sold 4,898,443 shares of our common stock that we registered under a Registration Statement on Form S-1 (File No. 333-138646), which was declared effective by the SEC on February 14, 2007, in an initial public offering at an offering price of $10.50 per share, less underwriting discounts and commissions. On February 27, 2007, the underwriters exercised the option to purchase an additional 349,757 shares of common stock from us at the offering price of $10.50 per share less underwriting discounts and commissions. The offering of the common stock (including the exercise by the underwriters of their over-allotment option) resulted in gross proceeds of $55.1 million and net proceeds of approximately $48.0 million to us after deducting underwriting discounts and commissions of approximately $3.9 million and related offering costs of an estimated $3.2 million. The foregoing proceeds do not include proceeds to selling stockholders from their sale of an aggregate of 1,306,800 shares of our common stock. The book-running manager for the offering was Thomas Weisel Partners LLC, the co-lead manager was William Blair & Company, L.L.C. and Needham & Company, LLC, Wachovia Capital Markets, LLC and Pacific Crest Securities Inc. acted as representatives of the underwriters. No payments were made to directors, officers or persons owning ten percent or more of our common stock or to their associates, or to our affiliates, other than proceeds from the offering to those selling stockholders who are officers of the company in respect of their shares sold in the offering, and payments in the ordinary course of business to officers for salaries and to non-employee directors as compensation for board or board committee service.
As of June 22, 2010, $6.0 million of the net proceeds remained available and were primarily invested in money market accounts or marketable securities. Pending any use, as described below, we have invested the net proceeds in investment-grade, short-term, interest-bearing securities.
Since the initial public offering through June 1, 2010, we have used approximately $10.3 million for our acquisition of ICR, approximately $2.2 million for our acquisition of ITG (including payments of contingent consideration), approximately $2.2 million for our acquisition of Schoonover, approximately $5.4 million for our acquisition of Infobasis Limited, which during fiscal 2010 changed its legal name to Salary.com Limited, approximately $10.0 million to pay down our line of credit in May 2009 which was used to fund the acquisition of Genesys and repurchase our common stock, approximately $0.5 million for the purchase of domain names, approximately $2.4 million for data purchases, and approximately $9.0 million to fund our worldwide operations. There has been no material change in the planned use of proceeds from our initial public offering as described in our final prospectus filed with the Securities and Exchange Commission pursuant to Rule 424(b).
41
Table of Contents
Issuer Purchases of Equity Securities
Pursuant to the terms of our 2000 Stock Option Plan and our 2004 Stock Option Plan (collectively referred to as our Stock Plans), options may typically be exercised prior to vesting. We have the right to repurchase unvested shares from employees upon their termination, and it is generally our policy to do so. In addition, in December 2008, our Board of Directors authorized an ongoing stock repurchase program with a total repurchase authority granted to us of $2.5 million. The objective of the stock repurchase program is to improve stockholders’ returns. On April 17, 2009, our Board of Directors increased the size of our share repurchase program to $7.5 million. At March 31, 2010, approximately $4.7 million was available to repurchase common stock pursuant to the stock repurchase program. All shares repurchased by us were retired as of March 31, 2010. Our credit facility with Silicon Valley Bank currently limits repurchases under our $7.5 million stock repurchase program to $2.5 million over a rolling twelve month period. The following table provides information with respect to purchases made by us of shares of our common stock during the three month period ended March 31, 2010:
| Period |
Total Number of Shares Purchased(1)(2) |
Average Price Paid per Share |
Total Number of Shares Purchased as Part of Publicly Announced Plans or Programs |
Maximum Number (or Approximate Dollar Value) of Shares that May Yet Be Purchased Under the Plans or Programs | |||||
| January 1, 2010 through January 31, 2010 |
— | — | — | $ | 4,707,467 | ||||
| February 1, 2010 through February 28, 2010 |
32,538 | 1.97 | — | $ | 4,707,467 | ||||
| March 1, 2010 through March 31, 2010 |
82,940 | 2.48 | — | $ | 4,707,467 | ||||
| Total |
115,478 | 2.34 | — | $ | 4,707,467 | ||||
| (1) | Includes shares originally purchased from us by employees pursuant to exercises of unvested stock options. During the months listed above, we routinely repurchased the shares from our employees upon their termination of employment pursuant to our right to repurchase unvested shares at the original exercise price under the terms of our Stock Plans and the related stock option agreements. |
| (2) | Includes shares reacquired in connection with the surrender of shares to cover the minimum taxes on vesting of restricted stock. |
42
Table of Contents
| ITEM 6. | SELECTED FINANCIAL DATA |
The following table summarizes the financial data for our business and is derived from the Company’s historical consolidated financial statements. You should read the selected financial data in conjunction with our historical consolidated financial statements and related notes and the section of this Annual Report on Form 10-K entitled “Management’s Discussion and Analysis of Financial Condition and Results of Operations.”
The selected condensed financial data set forth below should be read in conjunction with “Management’s Discussion and Analysis of Financial Condition and Results of Operations” set forth below in Item 7 and our financial statements and related notes included elsewhere in this Annual Report on Form 10-K. The historical financial results are not necessarily indicative of the financial results to be expected in any future period.
| Years ended March 31, | ||||||||||||||||||||
| (in thousands, except per share data) | ||||||||||||||||||||
| 2010 | 2009 | 2008 | 2007 | 2006 | ||||||||||||||||
| Statement of Operations: |
||||||||||||||||||||
| Revenue: |
||||||||||||||||||||
| Subscription revenues |
$ | 42,685 | $ | 39,630 | $ | 31,552 | $ | 20,503 | $ | 13,037 | ||||||||||
| Advertising revenues |
3,065 | 2,825 | 2,955 | 2,531 | 2,262 | |||||||||||||||
| Total revenues |
45,750 | 42,455 | 34,507 | 23,034 | 15,299 | |||||||||||||||
| Cost of revenues (1) |
14,458 | 13,157 | 8,229 | 5,334 | 3,108 | |||||||||||||||
| Gross profit |
31,292 | 29,298 | 26,278 | 17,700 | 12,191 | |||||||||||||||
| Operating expenses: |
||||||||||||||||||||
| Research and development (1) |
9,696 | 8,846 | 4,941 | 4,116 | 2,238 | |||||||||||||||
| Sales and marketing (1) |
21,788 | 26,139 | 18,963 | 12,792 | 8,573 | |||||||||||||||
| General and administrative (1) |
15,208 | 15,723 | 13,499 | 8,922 | 4,337 | |||||||||||||||
| Amortization of intangible assets |
3,007 | 1,988 | 1,126 | 126 | — | |||||||||||||||
| Restructuring charges |
2,039 | 3,081 | — | — | — | |||||||||||||||
| Impairement charges |
5,599 | — | — | — | — | |||||||||||||||
| Total operating expenses |
57,337 | 55,777 | 38,529 | 25,956 | 15,148 | |||||||||||||||
| Loss from operations |
(26,045 | ) | (26,479 | ) | (12,251 | ) | (8,256 | ) | (2,957 | ) | ||||||||||
| Other income (expense) |
(94 | ) | 229 | 1,858 | 174 | (173 | ) | |||||||||||||
| Loss before provision for income taxes |
(26,139 | ) | (26,250 | ) | (10,393 | ) | (8,082 | ) | (3,130 | ) | ||||||||||
| Provision for income taxes |
97 | 208 | 205 | — | — | |||||||||||||||
| Net loss attributable to common stockholders |
$ | (26,236 | ) | $ | (26,458 | ) | $ | (10,598 | ) | $ | (8,082 | ) | $ | (3,130 | ) | |||||
| Net loss attributable to common stockholders per share—basic and diluted |
$ | (1.59 | ) | $ | (1.62 | ) | $ | (0.69 | ) | $ | (1.42 | ) | $ | (0.89 | ) | |||||
| (1) | Net loss includes stock-based compensation expense, as follows: |
| Years ended March 31, | |||||||||||||||
| (in thousands) | |||||||||||||||
| 2010 | 2009 | 2008 | 2007 | 2006 | |||||||||||
| Stock-based compensation: |
|||||||||||||||
| Cost of revenues |
$ | 783 | $ | 1,255 | $ | 800 | $ | 437 | $ | 186 | |||||
| Research and development |
1,063 | 1,376 | 459 | 505 | 180 | ||||||||||
| Sales and marketing |
2,098 | 2,702 | 1,778 | 986 | 401 | ||||||||||
| General and administrative |
2,072 | 2,616 | 2,092 | 2,437 | 311 | ||||||||||
| Restructuring charges |
629 | 1,813 | — | — | — | ||||||||||
| $ | 6,645 | $ | 9,762 | $ | 5,129 | $ | 4,365 | $ | 1,078 | ||||||
43
Table of Contents
| As of March 31, | ||||||||||||||||
| (in thousands) | ||||||||||||||||
| 2010 | 2009 | 2008 | 2007 | 2006 | ||||||||||||
| Balance Sheet Data: |
||||||||||||||||
| Cash |
$ | 8,773 | $ | 21,085 | $ | 37,727 | $ | 49,016 | $ | 1,814 | ||||||
| Total assets |
60,006 | 78,701 | 66,209 | 58,675 | 7,028 | |||||||||||
| Total debt |
2,525 | 8,125 | — | — | 800 | |||||||||||
| Total deferred revenue |
32,168 | 28,285 | 22,033 | 16,388 | 10,548 | |||||||||||
| Redeemable convertible preferred stock |
— | — | — | — | 10,538 | |||||||||||
| Total stockholders’ equity (deficit) |
818 | 21,942 | 36,168 | 37,983 | (17,914 | ) | ||||||||||
44
Table of Contents
| ITEM 7. | MANAGEMENT’S DISCUSSION AND ANALYSIS OF FINANCIAL CONDITION AND RESULTS OF OPERATIONS |
The following discussion and analysis of our financial condition and results of operations should be read in conjunction with our consolidated financial statements and related notes that appear elsewhere in this report. In addition to historical consolidated financial information, the following discussion contains forward-looking statements that reflect our plans, estimates and beliefs. Our actual results could differ materially from those discussed in the forward-looking statements. Factors that could cause or contribute to these differences include those discussed below and elsewhere in this report, particularly in “Risk Factors” in Item 1A.
Overview
We are a leading provider of on-demand compensation and talent management solutions in the human capital software-as-a-service (SaaS) market. Incorporated in 1999 as a Delaware corporation, we offer software and services that are tightly integrated with our proprietary data sets to help businesses and individuals manage pay and performance. Companies of all sizes turn to us to compensate, promote and manage their employees effectively and efficiently. With our help, companies can put the right talent in the right roles to deliver business objectives and individuals at all levels can determine their worth.
Our highly configurable software applications and proprietary content help executives, line managers and compensation professionals automate, streamline and optimize critical talent management processes, such as market pricing, compensation planning, performance management, competency management (a competency is a set of demonstrated behaviors, skills and proficiencies that determine performance in a given role) and succession planning. Built with compensation and competency data at the core, our solutions provide businesses of all sizes with the most productive and cost-effective way to manage and inspire their most important asset—their people.
We integrate our comprehensive SaaS applications with our proprietary content to automate the essential elements of our customers’ compensation and talent management processes. Our approach links pay to performance and aligns employees with corporate goals to drive business results. As a result, our solutions can significantly improve the effectiveness of our customers’ compensation spending and help them become more productive in managing their employees. We enable employers of all sizes to replace or supplement inefficient and expensive traditional approaches to compensation management, including paper-based surveys, consultants, internally developed software applications and spreadsheets. Our customers report that after using our solutions, they experience gains in productivity, reduction in personnel hours to administer pay and performance programs, and improvements in employee retention.
Our data sets contain base, bonus and incentive pay data for positions held by employees and top executives in thousands of public companies. Our flagship offering is CompAnalyst, an integrated suite of on-demand compensation benchmarking and pay analytics tools that integrate our data, third-party survey data and a customer’s own pay data with a complete analytics offering. We continue to build our IPAS global compensation technology survey with coverage of technology jobs in more than 90 countries.
Our on-demand talent management solutions offer managers and talent planners solutions so they can proactively respond to business conditions in planning the organization’s personnel needs, based on employees’ profiles, performance results and competencies. Salary.com’s TalentManager suite helps businesses automate performance reviews, streamline compensation planning and link employee pay to performance. TalentManager helps employers gain visibility into their performance cycle and drive employee engagement in the process through a configurable, easy-to-use interface that can be personalized by users. Using TalentManager, employers can improve their talent management systems and model the critical jobs skills they need to achieve their business goals.
45
Table of Contents
With our fiscal 2009 acquisition of InfoBasis Limited, which during fiscal 2010 changed its legal name to Salary.com Limited, we now provide customers with competency-based skills management software for skills gap analysis and assessment. This acquisition, further built on our acquisitions of the assets of ITG Competency Group and Schoonover & Associates in 2008. These acquisitions have helped us offer one of the largest libraries of leadership and job-specific competencies and a leading job-competency model to manage competencies by position and launch our full talent management suite, which integrates compensation, performance and succession functions around job-based competency content. Our on-demand system helps line managers improve their ability to engage, develop and deploy their talent with learning references, coaching tips and progress journals.
In addition to our on-demand enterprise software offerings, we also provide a selection of applications on the Salary.com website. The web applications deliver salary management comparison and analysis tools to individuals and small businesses on a cost effective, real-time basis. We offer a professional edition of our CompAnalyst product suite for smaller companies with less than 500 full-time employees in either report format or through subscription services. We market to individual consumers providing career services, financial information and premium compensation reports personalized to a consumer’s unique background. Our network of websites, including syndicated partners, generated approximately 2.75 million unique monthly visitors during the fiscal year ended March 31, 2010.
From a market perspective, we continue to believe that the on-demand human resource categories are high growth markets. We believe that on-demand software and data is superior to legacy software and services offerings. Given the lower up-front cost and total cost of ownership, we believe that more companies will switch to on-demand human resource solutions, and that Salary.com is leading the way with its on-demand human resource offerings.
In May 2010, we approved plans to divest our payroll reporting unit. The payroll reporting unit primarily consists of our enterprise payroll and human resource management software sold by our Genesys subsidiary and our small business payroll products. The decision to divest this business was based on our determination that our current product offerings are too broad and our decision to focus our resources in the areas where we believe we have the greatest potential for profitable growth, our compensation, talent management and consumer businesses. As a result, we will begin reporting our payroll reporting unit as a discontinued operation beginning in the first quarter of fiscal 2011.
Strategic Initiatives
During our planning for fiscal 2011, we conducted a comprehensive review of our business. Over the past few years, we have pursued top line growth, but this growth has come at the expense of cash flow. We have determined that our current product offerings are too broad for a company with our resources and that by focusing our resources on our compensation, talent management and consumer businesses in the human capital software marketplace, we believe that we can accelerate our return to positive cash flow. We believe that our go-forward strategy leverages our past successes and magnifies them by concentrating our resources in the areas where we believe we have the greatest potential for profitable growth. There are two principal components to our strategy:
First is to renew our focus on key strengths where we hold leadership positions that have demonstrated a track record of generating positive cash flow for us in the past. Second is to significantly reduce our cost structure by removing the components of our business that we do not believe we have the ability to contribute to cash flow in the very near future, even though that may come at the expense of top-line growth, and to reallocate certain resources as an investment in our continuing core businesses.
46
Table of Contents
To achieve this strategy, the following is a detailed description of our initiatives for fiscal 2011:
| • | In terms of businesses and products where we expect to cease certain activities: |
| • | We intend to sell our enterprise and small business payroll operations and have already commenced the process of selling these product lines. We believe that if we can complete the sale of these businesses, it will provide us with additional working capital to invest in areas of growth. |
| • | We plan to sell or shut down our sales compensation business in order to focus on our HR customers, and have commenced the sale process. |
| • | We have ceased development efforts in longer-term projects such as learning and HRMS database development. |
| • | We have exited lower-margin compensation consulting activities by outsourcing it to third party partners. |
| • | We have shut down our Jamaica telesales operation. |
| • | We expect to moderate our activities in the development of competency data and software included in our talent management suite. |
| • | We expect to continue our development work on our CompAnalyst Executive suite of products, our IPAS survey business, and our core talent management suite. |
| • | We expect to shift some resources to reinforce our CompAnalyst suite in order to accelerate growth and build on our leadership position in compensation management and to increase activity to enhance our consumer website business by investing in optimizing website traffic. |
Sources of Revenues
We derive our revenues primarily from subscription fees and, to a lesser extent, through advertising on our website. For the years ended March 31, 2010, 2009 and 2008, subscription revenues accounted for 93%, 93% and 91%, respectively, of our total revenues and for the years ended March 31, 2010, 2009 and 2008, advertising revenues accounted for 7%, 7% and 9%, respectively, of our total revenues. We expect our subscription revenues will continue to account for an increasing percentage of our revenues as we continue to focus on subscription-based compensation management and performance management products.
Subscription revenues are comprised primarily of subscription fees from enterprise and small business customers who pay a bundled fee for our on-demand software applications and data products and implementation services related to our subscription products, sales of payroll perpetual licenses, maintenance and hosting services including related implementation and consulting services, as well as syndication fees from our website partners and premium membership subscriptions sold primarily to individuals. Subscription revenues are primarily recognized ratably over the contract period as they are earned. Our subscription agreements for our enterprise subscription customer base are typically one to five years in length, and as of March 31, 2010, approximately 54% of our contracts were more than one year in length. We generally invoice our customers annually in advance of their subscription (for both new sales and renewals), with the majority of the payments typically due upon receipt of invoice. Deferred revenue consists primarily of billings or payments received in advance of revenue recognition from our subscription agreements and is recognized over time as the revenue recognition criteria are met. Deferred revenue does not include the unbilled portion of multi-year customer contracts, which is held off the balance sheet. Changes in deferred revenue generally indicate the trend for subscription revenues over the following year as the current portion of deferred revenue is expected to be recognized as revenue within 12 months. To a lesser extent, subscription revenues also include fees for professional services which are not bundled with our subscription products, revenues from sales of job competency models and related implementation services and revenue from the sale of our Compensation Market Study and Salary.com Survey products, which are not sold on a subscription basis.
47
Table of Contents
Advertising revenues are comprised of revenues that we generate through agreements to display third party advertising on our website for a fixed period of time or fixed number of impressions. Advertising revenues are recognized as the advertising is displayed on the website.
Cost of Revenues and Operating Expenses
Cost of Revenues. Cost of revenues consists primarily of costs for data acquisition and data development, fees paid to our network provider for the hosting and managing of our servers, related bandwidth costs, compensation costs for the support and implementation of our products, compensation costs related to our consulting and professional services business and amortization of capitalized software costs. We continue to implement and support our existing compensation and talent management products and to expand our data sets and, as a result, we expect to incur additional costs of revenues over the next few years. However, with our recent reductions in workforce and our strategic plan to divest our payroll business, we expect that costs of revenues will decrease as a percentage of revenue and on an absolute dollar basis in fiscal 2011.
Research and Development. Research and development expenses consist primarily of compensation for our software and data application development personnel. We have historically focused our research and development efforts on improving and enhancing our existing on-demand software and data offerings as well as developing new features, functionality and products. However, with our recent reductions in workforce and our strategic plan to divest our payroll business and focus on existing products, we expect that research and development will decrease as a percentage of revenue and on an absolute dollar basis in fiscal 2011.
Sales and Marketing. Sales and marketing expenses consist primarily of compensation for our sales and marketing personnel, including sales commissions, as well as the costs of our marketing programs. The direct sales commissions for our subscription sales are capitalized at the time a subscription agreement is executed by a customer and we recognize the initial year sales commission expense ratably over one year. In the case of multi-year agreements, upon billing the customer for each additional year, we incur a subsequent sales commission and recognize the expense for such commission over the applicable year. Typically, a majority of the sales commission is recognized in the initial year of the subscription term. As a result of our reduction in workforce in the fourth quarter of fiscal 2009, we experienced a significant decrease in sales and marketing expenses during fiscal 2010. Consistent with fiscal 2010, we expect our sales and marketing expenses will decrease in fiscal 2011 as a result of our recent workforce reductions.
General and Administrative. General and administrative expenses consist of compensation expenses for executive, finance, accounting, human resources, administrative and management information systems personnel, professional fees and other corporate expenses, including rent and depreciation expense.
Results of Operations
The following table sets forth our total deferred revenue and net cash (used in) provided by operating activities for each of the periods indicated.
| Year Ended March 31, | |||||||||||
| (in thousands) | 2010 | 2009 | 2008 | ||||||||
| Total deferred revenue |
$ | 32,168 | $ | 28,285 | $ | 22,033 | |||||
| Net cash (used in) provided by operating activities |
$ | (1,953 | ) | $ | (8,222 | ) | $ | 8,428 | |||
Fiscal Year Ended March 31, 2010 Compared to Fiscal Year Ended March 31, 2009
Revenues. Revenues for fiscal 2010 were $45.8 million, an increase of $3.3 million, or 8%, compared to revenues of $42.5 million for fiscal 2009. Subscription revenues were $42.7 million for fiscal 2010, an increase of $3.1 million, or 8%, compared to subscription revenues of $39.6 million for fiscal 2009. The growth in subscription revenues was due principally to an increase of $5.9 million attributable to the full year impact of our fiscal 2009 acquisitions of Genesys and Salary.com Limited and a $0.2 million increase related to our core
48
Table of Contents
compensation and talent management products, partially offset by a decrease of $2.1 million in revenues associated with our competency and human capital management products and services and a $0.9 million decrease in our non-advertising consumer business. Advertising revenues were $3.1 million for fiscal 2010 compared to advertising revenues of $2.8 million for fiscal 2009. Total deferred revenue as of March 31, 2010 was $32.2 million, representing an increase of $3.9 million, or 14%, compared to total deferred revenue of $28.3 million as of March 31, 2009.
Cost of Revenues. Cost of revenues for fiscal 2010 was $14.5 million, an increase of $1.3 million, or 10%, compared to cost of revenues of $13.2 million for fiscal 2009. The increase in cost of revenues was primarily due to a $1.4 million increase in payroll and benefit related costs due to the full year impact of our prior year acquisition of Genesys and Salary.com Limited in addition to increased headcount within our compensation and professional service teams in fiscal 2010 compared to fiscal 2009, a net $0.5 million increase in consulting costs related to our payroll related products, an increase of $0.5 million in operational expenses related to our payroll products primarily consisting of rent and technology costs. These increases were partially offset by decreases of $0.5 million in external data and consulting costs related to our compensation and competency products, a $0.5 million decrease in stock-based compensation due to the reduction in workforce implemented in the fourth quarter of fiscal 2009 and a $0.1 million decrease in travel costs. As a percent of total revenues, cost of revenues remained relatively consistent increased to 32% in fiscal 2010 compared to 31% in fiscal 2009. The increase was primarily the result of the increased consulting component and implementation services attributable to talent management and HRMS products.
Research and Development Expenses. Research and development expenses for fiscal 2010 were $9.7 million, an increase of $0.9 million, or 10%, compared to research and development expenses of $8.8 million for fiscal 2009. The increase in research and development expenses was primarily due to increases of $0.6 million and $0.3 million in payroll and related benefits and travel costs, respectively, attributable to the addition of research and development personnel within our Shanghai facility and the acquisition of Genesys, an increase of $0.2 million in operational expenses related to our payroll products primarily consisting of rent and technology costs and a $0.1 million increase in technology related service costs partially offset by a $0.3 million decrease in stock-based compensation as a result of the reduction in workforce implemented in the fourth quarter of fiscal 2009. Research and development expenses remained constant at 21% for the fiscal years ended 2010 and 2009.
Sales and Marketing Expenses. Sales and marketing expenses for fiscal 2010 were $21.8 million, a decrease of $4.3 million, or 17%, compared to sales and marketing expenses of $26.1 million for fiscal 2009. The decrease was primarily due to decreases of $1.5 million and $0.6 million in payroll and benefit related costs and stock-based compensation, respectively, due to the reduction in workforce implemented in the fourth quarter of fiscal 2009 and further reductions in headcount among sales personnel during fiscal 2010, a $1.1 million decrease in advertising and tradeshow expenses, and an additional $1.0 million related to outside service costs primarily consisting of marketing consultants. Sales and marketing expenses decreased from 62% of total revenues in fiscal 2009 to 48% of total revenues in fiscal 2010. The decrease was directly related to the impact of the fiscal 2009 fourth quarter workforce reduction and our significant investments in sales and marketing during the first half of fiscal 2009.
General and Administrative Expenses. General and administrative expenses for fiscal 2010 were $15.2 million, a decrease of $0.5 million, or 3%, compared to general and administrative expenses of $15.7 million for fiscal 2009. The decrease in general and administrative expenses was primarily due to a $0.6 million reduction in rent expense and related costs primarily related to the relocation of our corporate headquarters, a $0.5 million decrease in stock-based compensation expense as a result of the reduction in workforce implanted in the fourth quarter of fiscal 2009, a $0.1 million decrease in recruiting and a $0.1 million decrease attributable to the impact of foreign currencies. The decrease in general and administrative expenses was partially offset by increases in technology/telephony expenses of $0.4 million, depreciation of $0.3 million and legal expenses of $0.2 million. General and administrative expenses decreased to 33% of total revenues in fiscal 2010 compared to 37% of total revenue in fiscal 2009.
49
Table of Contents
Restructuring Charges. Restructuring charges for fiscal 2010 were $2.0 million primarily as a result of the resignation of our former Chief Executive Officer as well as employee terminations throughout the fiscal year. As a result of the former executive’s resignation, we recorded restructuring charges of approximately $1.6 million during the fourth quarter of fiscal 2010 consisting of $0.2 million of severance and payroll related costs, $0.6 million in stock compensation charges associated with the accelerated vesting of unvested awards, and $0.7 million in various other costs primarily consisting of legal fees. Additionally, we recorded restructuring charges of approximately $0.5 million related to severance payments to forty employees terminated during fiscal 2010.
Impairment Charges. Impairment charges for fiscal 2010 were $5.6 million as a result of certain triggering events noted by management and the results of our annual impairment testing of goodwill performed in the fourth quarter of fiscal 2010. The impairment consisted of non-cash charges of $3.5 million and $2.1 million related to the write-down of intangible assets and goodwill, respectively, for our payroll/HRMS reporting unit.
Amortization of Intangible Assets. Amortization of intangible assets for fiscal 2010 was $3.0 million, an increase of $1.0 million, compared to amortization of intangible assets of $2.0 million in fiscal 2009. The increase in amortization was primarily due to the amortization of intangible assets acquired as part of the acquisition of Salary.com Limited in August 2008 and Genesys in December 2008.
Other Income/Expense. Other expense for fiscal 2010 was $94,000 compared to other income of $229,000 in fiscal 2009. The increase in expense consisted primarily of a decrease in interest income due to a decrease in invested cash balances and a decrease in interest rates associated with invested balances.
Fiscal Year Ended March 31, 2009 Compared to Fiscal Year Ended March 31, 2008
Revenues. Revenues for fiscal 2009 were $42.5 million, an increase of $8.0 million, or 23%, compared to revenues of $34.5 million for fiscal 2008. Subscription revenues were $39.6 million for fiscal 2009, an increase of $8.0 million, or 25%, compared to subscription revenues of $31.6 million for fiscal 2008. The growth in subscription revenues was due principally to an increase of $2.7 million in renewal revenues to existing subscription customers, an increase of $0.7 million in revenues to new subscription customers and an increase of $2.6 million in revenues from additional products sold to existing customers in fiscal 2009 compared to fiscal 2008. Our fiscal 2008 acquisitions of ITG, Schoonover, and ICR contributed $2.6 million to our revenue growth. Included in the growth of subscription revenues was the incremental revenue contribution of $2.9 million from acquisitions during fiscal year 2009. Also contributing to the increase in total revenues was the result of our hiring of additional sales personnel throughout the first half of the fiscal year who focused on retaining existing customers, adding new customers and selling additional products to existing customers. Advertising revenues were $2.8 million for fiscal 2009 compared to advertising revenues of $3.0 million for fiscal 2008. Total deferred revenue as of March 31, 2009 was $28.3 million, representing an increase of $6.3 million, or 29%, compared to total deferred revenue of $22.0 million as of March 31, 2008.
Cost of Revenues. Cost of revenues for fiscal 2009 was $13.2 million, an increase of $5.0 million, or 61%, compared to cost of revenues of $8.2 million for fiscal 2008. The increase in cost of revenues was primarily due to a $1.2 million increase in payroll and benefit-related costs due to the addition of personnel to our compensation and professional service teams in fiscal 2009 compared to fiscal 2008, a $0.8 million increase in amortization of intangible assets primarily from acquired data acquisition costs, a $0.5 million increase in stock-based compensation expense, a $2.1 million increase of costs attributable to the recent acquisitions of Salary.com Limited and Genesys, an increase of $0.2 million in outside technology costs, and an increase of $0.2 million in travel costs. As a percent of total revenues, cost of revenues increased to 31% in fiscal 2009 compared to 24% in fiscal 2008. The percentage increase was primarily the result of an increase in professional services personnel needed to support our changing business mix which now includes a more substantial consulting component and implementation services attributable to talent management and HRMS products.
Research and Development Expenses. Research and development expenses for fiscal 2009 were $8.8 million, an increase of $3.9 million, or 80%, compared to research and development expenses of $4.9 million for
50
Table of Contents
fiscal 2008. The increase in research and development expenses was primarily due to a $0.9 million increase in payroll and related expenses due to the addition of research and development personnel during fiscal year 2009, $0.9 million increase in stock-based compensation expense, a $0.7 million increase in equipment expenses to support the increased headcount, an increase of $0.2 million in travel costs, an increase of $0.2 million rent and facility related costs, and an increase of $0.7 million of costs attributable to the recent acquisitions of Salary.com Limited and Genesys. Research and development expenses increased to 21% of total revenues in fiscal 2009 compared to 14% of total revenues in fiscal 2008, primarily as a result of our hiring additional personnel throughout the first half of fiscal 2009 to support planned product introductions.
Sales and Marketing Expenses. Sales and marketing expenses for fiscal 2009 were $26.1 million, an increase of $7.1 million, or 37%, compared to sales and marketing expenses of $19.0 million for fiscal 2008. The increase was primarily due to a $3.0 million increase in payroll and benefit related costs due to the addition of sales and marketing personnel through the first half of fiscal 2009, a $1.1 million increase in outside service costs primarily related to marketing consultants, a $0.9 million increase in marketing, advertising and trade show expenses, a $0.9 million increase in stock-based compensation expense, an increase of $0.8 million of costs attributable to the recent acquisitions of Salary.com Limited and Genesys, and a $0.5 million increase in travel expenses. Sales and marketing expenses increased to 62% of total revenues in fiscal 2009 compared to 55% of total revenues in fiscal 2008. Because the increase in sales and marketing expenses was largely attributable to our significant investments in sales and marketing during the first half of fiscal 2009, we expect that these expenses will decrease as we realize the full benefits of the restructuring initiatives and expense reduction measures implemented as part of our strategic initiatives.
General and Administrative Expenses. General and administrative expenses for fiscal 2009 were $15.7 million, an increase of $2.2 million, or 16%, compared to general and administrative expenses of $13.5 million for fiscal 2008. The increase in general and administrative expenses was primarily due to a $0.5 million increase in stock-based compensation expense, an increase of $0.5 million in directors fees, an increase of $0.5 million in general office expenses, an incremental $0.8 million of administrative expenses related to the current fiscal year acquisitions, an increase of $0.3 million in travel and seminar expenses, an increase of $0.3 million in outside service fees, an increase of $0.1 million of payroll and benefit related costs, and bad debt expense of $0.1 million. The increase in general and administrative expenses was somewhat offset by decreases in legal expenses of $0.6 million and accounting fees of $0.5 million. General and administrative expenses decreased to 37% of total revenues in fiscal 2009 compared to 39% of total revenue in fiscal 2008.
Restructuring Charges. Restructuring charges for fiscal 2009 were $3.1 million as a result of the workforce reduction implemented and completed on January 7, 2009. These charges were comprised of $1.8 million in stock compensation charges associated with the accelerated vesting of unvested awards, $1.2 million in severance payments, and $0.1 million in various other costs.
Amortization of Intangible Assets. Amortization of intangible assets for fiscal 2009 was $2.0 million, an increase of $0.9 million, compared to amortization of intangible assets of $1.1 million in fiscal 2008. The increase in amortization was primarily due to the amortization of intangible assets acquired as part of the acquisition of ITG in August 2007, Schoonover Associates, Inc. in December 2007, Salary.com Limited in August 2008 and Genesys in December 2008.
Interest Income. Interest income for fiscal 2009 was $0.5 million compared to $1.9 million in fiscal 2008. The decrease in interest income was due to a decrease in invested cash balances as well as a decrease in interest rates in fiscal 2009 compared to fiscal 2008.
Other Expense. Other expense was $0.3 million in fiscal 2009 consisting primarily of franchise and other taxes of $0.1 million and interest expenses of $0.1 million due to borrowings against the our line of credit used to fund the acquisition of Genesys in December 2008.
51
Table of Contents
Acquisition of Businesses
Genesys Software Systems, Inc.
On December 17, 2008, we acquired all issued and outstanding shares of Genesys, a provider of on-demand and licensed human resources management systems and payroll solutions. Under the terms of the agreement, we paid the former owners of Genesys $6.0 million, net of cash acquired and converted approximately $1.1 million of options to purchase Genesys common stock into options to purchase approximately 519,492 shares of our common stock. In addition, the former Genesys security holders are eligible to earn additional consideration of up to $2.0 million which would be paid in cash or shares of our common stock, at our option, based on Genesys meeting certain performance targets during the eighteen months after the closing of the acquisition. As of March 31, 2010, the $2.0 million of additional consideration had been earned and recorded as additional goodwill. Such amounts were due to be settled in June 2010; however, we have filed an indemnification claim against the former owners of Genesys and are currently finalizing the settlement and payment of the contingent consideration. The purchase price allocated for financial accounting purposes was approximately $9.4 million, which includes $1.1 million of options to purchase our common stock and approximately $1.9 million of net liabilities assumed. Accordingly, the purchase price was allocated based upon the fair value of assets acquired and liabilities assumed. We allocated $4.1 million of the purchase price to goodwill based upon the estimated fair value of the assets acquired in the acquisition. Goodwill from the acquisition resulted from our belief that the products and services offered by Genesys will be complementary to our on-demand software suites. The results of operations include the impact of this acquisition since December 17, 2008. During fiscal 2010, we incurred impairment charges of approximately $5.6 million associated with the goodwill and intangible assets of Genesys.
Salary.com Limited
On August 21, 2008, we acquired the share capital of Salary.com Limited. Salary.com Limited, located in the United Kingdom, is a provider of competency-based skills management software. Under the terms of the agreement, we paid the former owners of Salary.com Limited $5.2 million in cash. The former employee owners of Salary.com Limited will also be eligible to earn additional consideration based on meeting certain performance targets during each of the five twelve-month periods ending August 31, 2009, 2010, 2011, 2012 and 2013. The additional consideration, if earned, consists of cash payments of a maximum of $200,000 per year for five years, allocated proportionately amongst the employee owners. As of March 31, 2010, no additional consideration had been earned. The total cash paid for the acquisition was approximately $5.4 million, which includes approximately $0.2 million of direct acquisition costs plus approximately $1.3 million of net liabilities assumed. Accordingly, the purchase price was allocated based upon the fair value of assets acquired and liabilities assumed. We allocated $3.3 million of the purchase price to goodwill based upon the estimated fair value of the assets acquired in the acquisition. Goodwill from the acquisition resulted from our belief that the products and services offered by Salary.com Limited will be complementary to our existing competency business and on-demand software suites. The results of operations include the impact of this acquisition since August 21, 2008.
Schoonover Associates
On December 21, 2007, we acquired the assets of Schoonover Associates, Inc. (Schoonover). Schoonover was a provider of competency management data and consulting services with over 20 years of experience helping clients maximize their human capital. Under the terms of the agreement, we paid the owner of Schoonover $4.4 million in cash of which $0.4 million reflects payments made by us in connection with a pre-existing license agreement by and between the parties. Schoonover will also be eligible to earn additional consideration based on meeting certain performance targets during the first five fiscal years beginning on April 1, 2008. The additional consideration, if earned, consists of cash payments of a maximum of $100,000 per year for 5 years and 112,646 shares of common stock valued at $1.5 million, which are eligible to vest ratably over such five-year period. Under the terms of the agreement, the number of shares issued was calculated as the $1.5 million of additional consideration divided by the average of the closing bid prices of our common stock as reported on the NASDAQ
52
Table of Contents
Global Market over the last ten trading days prior to the closing of the agreement. The total cost of the acquisition was approximately $4.4 million and as of March 31, 2010, 20% of the issued shares had vested and $200,000 of the additional consideration has been earned and recorded as compensation expense. Accordingly, the purchase price was allocated based upon the fair value of assets acquired and liabilities assumed. We allocated $2.6 million of the purchase price to goodwill based upon the estimated fair value of the assets acquired in the acquisition. Goodwill from the acquisition resulted from our belief that the products and services offered by Schoonover will be complementary to our existing competency business and on-demand software suites. The results of operations include the impact of this acquisition since December 21, 2007.
ITG Competency Group
On August 3, 2007, we acquired the assets of ITG Competency Group, LLC (“ITG”). ITG is a provider of off-the-shelf competency models and related implementation services used in a wide range of industries. Under the terms of the agreement, we paid the owner of ITG $2.1 million in cash and shares of our common stock valued at $0.5 million. ITG was also eligible to earn up to $1.0 million in additional consideration based on meeting certain performance targets during the first two years after the closing of the acquisition, and can earn additional consideration if these targets are exceeded. The additional consideration would be paid 50% in cash and 50% in common stock. As of March 31, 2010, all $1.1 million of the additional consideration had been earned and recorded as goodwill. Of the additional consideration earned, $0.9 million was paid to the owner of ITG in cash and shares during fiscal 2009, an additional $0.1 million was paid in cash in October 2009 and the final $0.1 million was paid in stock in January 2010. The total cost of the acquisition was approximately $3.0 million. Accordingly, the purchase price was allocated based upon the fair value of assets acquired and liabilities assumed. We allocated $1.4 million of the purchase price to goodwill based upon the estimated fair value of the assets acquired in the acquisition and the value of the contingent consideration earned. Goodwill from the acquisition resulted from our belief that the products developed by ITG will be complementary to our on-demand software suites. The results of operations include the impact of this acquisition since August 3, 2007.
ICR
On May 15, 2007, we acquired all of the membership interests of ICR Limited, L.C. and all of the outstanding share capital of ICR International Ltd. (collectively, ICR), a leading provider of industry-specific market intelligence for employee pay and benefits for the global technology and specialty consumer goods markets. Pursuant to the terms of the purchase agreements, we paid $10.3 million to the owners of ICR The total cost of the acquisition, including legal fees of $20,000, was approximately $10.3 million. Accordingly, the purchase price was allocated based upon the fair value of assets acquired and liabilities assumed. We allocated $5.8 million of the purchase price to goodwill based upon the estimated fair value of the assets acquired in the acquisition. Goodwill from the acquisition resulted from our belief that the products developed by ICR will be complementary to our on-demand software suites. Our results of operations include the impact of this acquisition since May 15, 2007.
Liquidity and Capital Resources
At March 31, 2010, our principal sources of liquidity were cash and cash equivalents totaling $8.8 million and accounts receivable, net of allowance for doubtful accounts of $7.7 million compared to cash and cash equivalents of $21.1 million and accounts receivable, net of allowance for doubtful accounts of $6.0 million at March 31, 2009. Our working capital as of March 31, 2010 was a negative $23.3 million compared to working capital of $11.6 million as of March 31, 2009. The reduction in our working capital was primarily due to cash outflows and contingent consideration payable related to our fiscal 2009 acquisition of Genesys, an increase in the current portion of deferred revenues of $2.8 million, and payments related to our stock repurchase program of $2.5 million. During fiscal 2010, we borrowed against our revolving credit facility and, as of March 31, 2010, we had an outstanding balance of $2.5 million against our line.
53
Table of Contents
Cash used by operating activities for the fiscal year ended March 31, 2010 was $2.0 million. This amount resulted from a net loss of $26.2 million, adjusted for non-cash charges of $19.0 million, and a $5.3 million net increase in operating assets and liabilities since the beginning of fiscal 2010. Non-cash items primarily consisted of $1.7 million of depreciation and amortization of property, equipment and software, $4.7 million of amortization of intangible assets, $6.6 million of stock-based compensation and $5.6 million of impairment charges. The net increase in operating assets and liabilities since the beginning of fiscal 2010 of $5.3 million was primarily comprised of increases in accounts payable and accrued expenses and other current liabilities since the beginning of fiscal 2010 of $2.1 million and $1.4 million, respectively, deferred revenue of $3.8 million and $1.7 million in accounts receivable. The increase in accounts payable and accrued expenses and other current liabilities was primarily due to the timing of accrued payroll benefits in addition to payments to vendors. The increase in deferred revenue since the beginning of fiscal 2010 is primarily the result of increased invoicing offset by reductions as we recognized revenue recognition from our subscription customers for the fiscal year ended March 31, 2010. The growth in invoicing, which also led to the increase in accounts receivable, was primarily due to the impact of our prior year acquisitions and increased subscription renewals and increased sales to existing customers. Currently, payment for the majority of our subscription agreements is due upon invoicing. Because revenue is generally recognized ratably over the subscription period, payments received at the beginning of the subscription period result in an increase to deferred revenue. Changes in deferred revenue generally indicate the trend for subscription revenues over the following year as the current portion of deferred revenue is expected to be recognized within 12 months.
Cash used in investing activities was $1.1 million and consisted primarily of $0.4 million paid for purchases of intangible assets, $0.4 million paid for purchases of data sets and property, equipment and software, $0.3 million paid for software development costs and $0.1 million paid for the acquisition of businesses which represented contingent payments earned during the fiscal year. We intend to continue to invest in our content data sets, software development and network infrastructure to ensure our continued ability to enhance our existing software, expand our data sets, introduce new products, and maintain the reliability of our network.
Cash used in financing activities was $8.8 million, which consisted primarily of $5.8 million of repayments of our revolving line of credit net of current fiscal year borrowings, $3.3 million of repurchases of our stock, partially offset by $0.3 million received from the proceeds from the exercise of common stock and warrants.
On December 30, 2006, we entered into an agreement with a vendor to obtain additional data sets that runs for an initial one year term following the date of the initial delivery. The fee for the initial term was $1.5 million. On June 30, 2009, we terminated the agreement.
On August 3, 2007, we acquired the assets of ITG. Under the terms of the agreement, the former owners of ITG are eligible to earn up to $1.0 million in additional consideration based on meeting certain performance targets during the first two years after the closing of the acquisition, and can earn additional consideration if these targets are exceeded. As of March 31, 2010, all $1.1 million of the additional consideration has been earned and recorded as additional goodwill. Of the additional consideration earned, $0.9 million was paid to the owner of ITG in cash and shares during fiscal 2009, an additional $0.1 million was paid in cash in October 2009 and the final $0.1 million was paid in stock in January 2010.
On December 21, 2007, we acquired the assets of Schoonover Associates, Inc. Schoonover will be eligible to earn additional consideration based on meeting certain performance targets during the first five fiscal years after March 31, 2008. The additional consideration, if earned, consists of cash payments of no more than $100,000 per year for 5 years and vesting on the 112,646 shares of common stock issued at the closing of the acquisition, which were valued at $1.5 million, and which are eligible to vest ratably over such five-year period. As of December 31, 2009, 20% of the issued shares had vested and $200,000 of the additional consideration has been earned. Of the additional consideration earned, $0.1 million was paid in cash in January 2010 and the remaining $0.1 million is expected to be paid in fiscal 2011.
54
Table of Contents
On June 27, 2007, we entered into a master equipment lease agreement (Leaseline #1) with a maximum commitment of $300,000. The lease term began on September 1, 2007 and runs for a term of 36 months. On August 13, 2007, we increased the maximum commitment of Leaseline #1 to $600,000. As of March 31, 2010, we had leased approximately $381,000 of equipment under the terms of Leaseline #1. On September 13, 2007, we entered into an additional lease commitment (Leaseline #2) with the same lender with a maximum commitment of $350,000. On December 4, 2007, we increased the maximum commitment of Leaseline #2 to $400,000. The lease term began on January 1, 2008 and runs for a term of 36 months. As of March 31, 2010, we had leased approximately $391,000 of equipment under the terms of Leaseline #2. On January 17, 2008, we entered into a third lease commitment (Leaseline #3) with the same lender with a maximum commitment of $350,000. The lease term began on April 1, 2008 and runs for a term of 36 months. As of March 31, 2010, we had leased approximately $250,000 of equipment under the terms of Leaseline #3. On April 17, 2008, we entered into an additional lease commitment (Leaseline #4) with a maximum commitment of $350,000. The lease term begins on July 1, 2008 and runs for a term of 36 months. As of March 31, 2010, we had leased approximately $173,000 of equipment under the terms of this leaseline. On July 24, 2008, we entered into a leaseline agreement (Leaseline #5) with a maximum available commitment of $200,000. The lease term began on October 1, 2008 and runs for a term of 36 months. As of March 31, 2010, we had not leased any equipment under the terms of this leaseline. In addition, we have approximately $1.1 million, in a restricted cash account as collateral for equipment with a value of approximately $1.1 million in accordance with all of our master lease agreements.
In June 2008, we entered into an agreement with a vendor to finance the purchase of perpetual software licenses in the amount of approximately $738,000. We will make quarterly payments of approximately $64,000 for a term of 36 months.
On August 8, 2008, we entered into a modification of our existing credit facility with Silicon Valley Bank to modify certain of the financial covenants and extend the term of the agreement to September 23, 2008. On September 17, 2008, we entered into a second modification of our credit facility to extend the term of the agreement to October 8, 2008. On October 8, 2008, we entered into a third modification of our credit facility to extend the term of this credit facility for two years to October 8, 2010 and increased the line of credit from $5,000,000 to $10,000,000. On March 16, 2009, we entered into a fourth modification of our agreement, which added Genesys as a guarantor to our obligations under the credit facility. On June 29, 2009, we entered into a fifth modification to our credit facility which increased the interest rate and certain fees payable, amended certain financial covenants, and increased the amount of stock we can repurchase under our repurchase plans. On October 15, 2009, we entered into a sixth modification to our credit facility decreasing the line of credit to $5.0 million, modifying the interest rate and amending certain financial covenants. Following the sixth modification, up to $5 million is available under this credit facility and the facility is collateralized by substantially all of our assets and expires on October 8, 2010. The line of credit may be used to secure letters of credit and cash management services and may be used in connection with foreign exchange forward contracts. The line of credit is subject to a financial covenant that requires us to maintain a ratio of assets to liabilities (net of deferred revenue) that is not less than 1.4 to 1. As of March 31, 2010, there was $2.5 million outstanding under the credit facility. As of this date, we were not in compliance with our debt covenant; however, we had sufficient available cash to pay in full the outstanding amounts due on the facility without material consequence to us. We have received a waiver from Silicon Valley Bank for the months of March, April and May 2010 and are currently negotiating an amendment to our existing credit facility. We anticipate that the amendment will be completed during the second quarter of fiscal 2011 and that we would be in compliance with the covenants of such arrangement.
On August 21, 2008, we acquired the share capital of Salary.com Limited. Under the terms of the agreement, the former employee owners of Salary.com Limited will be eligible to earn additional consideration based on meeting certain performance targets during each of the five twelve month periods ending August 31, 2009, 2010, 2011, 2012 and 2013. The additional consideration, if earned, consists of cash payments of a maximum of $200,000 per year for 5 years, allocated proportionately amongst the former employee owners. As of March 31, 2010, no additional consideration had been earned.
55
Table of Contents
In October 2008, we entered into a new office lease for our subsidiary in Shanghai, China. The lease is for approximately 2,900 square meters and has an initial term of three years, commencing in January 2009. We can extend the lease for an additional three years at the end of the initial term. Rental payments under the lease are 180,000 Chinese Yuan RMB per month (approximately $26,000 per month).
On December 15, 2008, the Board of Directors authorized the repurchase by us of up to $2.5 million of our common stock from time to time at prevailing prices in the open market or in negotiated transactions off the market. On April 17, 2009, our Board of Directors increased the size of its share repurchase program from $2.5 million to $7.5 million. As of March 31, 2010, we had repurchased and retired 1,348,140 shares with a total value of approximately $2.8 million pursuant to this repurchase program.
On December 17, 2008, we acquired all issued and outstanding shares of Genesys. Under the terms of the agreement, the Genesys shareholders and optionholders are eligible to earn additional consideration of up to $2.0 million which would be paid in June 2010 in cash or shares of our common stock, at our option, based on Genesys meeting certain performance targets during the first year after the closing of the merger. As of March 31, 2010, the $2.0 million of additional consideration had been earned and recorded as goodwill. Such amounts were due to be settled in June 2010; however, we have filed an indemnification claim against the former owners of Genesys and are currently finalizing the settlement and payment of the contingent consideration.
During the fiscal year ended March 31, 2010, we recorded restructuring charges of approximately $0.5 million related to severance payments to forty employees terminated by us and expects to incur an additional $0.5 million of severance related costs in fiscal 2011 as part of our strategic realignment.
In February 2009, we entered into a new office lease for our wholly foreign owned enterprise in Montego Bay, Jamaica. The lease is for approximately 511 square meters and has an initial term of two years, commencing in November 2008. In June 2010, we shut down our Jamaica telesales operation and terminated our office lease for no additional costs or penalties.
In April 2009, we entered into a new office sublease for our corporate offices in Needham, Massachusetts. The lease is for approximately 36,288 square feet and has an initial term of twenty-one months, commencing in May 2009. Rental payments under the lease are $54,000 per month.
On February 20, 2010, our President and Chief Executive Officer resigned from his positions at the Company. As a result of the former executive’s resignation, we recorded restructuring charges of approximately $1.6 million during the fourth quarter or fiscal 2010. These charges were comprised of $0.2 million of severance and payroll related costs, $0.6 million in stock compensation charges associated with the accelerated vesting of unvested awards, and $0.7 million in various other costs primarily consisting of legal fees. We also expect to incur an additional $1.2 million of charges in fiscal 2011 related to the transition process which primarily consists of $1.0 million of severance and compensation related charges as well as $0.2 million of external consultant fees to assist with the process. The future severance payments will commence in August 2010 and be paid and expensed over an eighteen month period consistent with the non-compete agreement executed with the former executive.
Given our current cash and accounts receivable, we believe that we will have sufficient liquidity to fund our business and meet our contractual obligations for at least the next 12 months. However, we may need to raise additional funds in the future in the event that we pursue acquisitions or investments in complementary businesses or technologies or experience operating losses that exceed our expectations. If we raise additional funds through the issuance of equity or convertible securities, our stockholders may experience dilution. In the event that additional financing is required, we may not be able to obtain it on acceptable terms or at all.
During the last four fiscal years, inflation and changing prices have not had a material effect on our business and we do not expect that inflation or changing prices will materially affect our business in the foreseeable future.
56
Table of Contents
Contractual Obligations and Off-Balance-Sheet Arrangements
Contractual Obligations
As of March 31, 2010, we did not have any material purchase obligations, capital leases, or other material long-term commitments reflected on our balance sheet. The following table summarizes our contractual cash obligations at March 31, 2010 and the effect such obligations are expected to have on our liquidity and cash flow in future periods:
| Payments Due by Period | |||||||||||||||
| Contractual obligations |
Total | Less than 1 Year |
1-3 Years |
3-5 Years |
More than 5 Years | ||||||||||
| (in thousands) | |||||||||||||||
| Operating leases |
$ | 3,717 | $ | 1,968 | $ | 1,033 | $ | 716 | $ | — | |||||
| Revolving credit facility |
2,525 | 2,525 | — | — | — | ||||||||||
| Contractual commitments |
2,232 | 1,342 | 890 | — | — | ||||||||||
| Total |
$ | 8,474 | $ | 5,835 | $ | 1,923 | $ | 716 | $ | — | |||||
The contractual commitment amounts in the table above are associated with agreements that are enforceable and legally binding and that specify all significant terms, including: fixed or minimum services to be used; fixed, minimum or variable price provisions; and the approximate timing of the transaction. Obligations under agreements that we can cancel without a significant penalty are not included in the table above.
Off-Balance Sheet Arrangements
Under generally accepted accounting principles in the United States (GAAP), certain obligations and commitments are not required to be included in the consolidated balance sheet. These obligations and commitments, while entered into in the normal course of business, may have a material impact on liquidity. We do not have any relationships with unconsolidated entities or financial partnerships, such as entities often referred to as structured finance or special purpose entities, which would have been established for the purpose of facilitating off-balance sheet arrangements or other contractually narrow or limited purposes. As such, we are not exposed to any financing, liquidity, market, or credit risk that could arise if we had engaged in such relationships.
Summary of Critical Accounting Policies; Significant Judgments and Estimates
Our financial statements are prepared in accordance with GAAP. The preparation of these financial statements requires us to make estimates and assumptions that affect the reported amounts of assets, liabilities, revenues, costs and expenses and related disclosures. On an ongoing basis, we evaluate our estimates and assumptions. Our actual results may differ from these estimates under different assumptions or conditions.
We believe that of our significant accounting policies, which are described in the notes to our financial statements, the following accounting policies involve a greater degree of judgment, complexity and effect on materiality. A critical accounting policy is one that is both material to the presentation of our financial statements and requires us to make difficult, subjective or complex judgments for uncertain matters that could have a material effect on our financial condition and results of operations. Accordingly, these are the policies we believe are the most critical to aid in fully understanding and evaluating our financial condition and results of operations.
Revenue Recognition. In accordance with ASC 605-20, “Services” (“ASC 605-20”), we recognize revenues from subscription agreements for our on-demand software and related services when there is persuasive evidence of an arrangement, the service has been provided to the customer, the collection of the fee is probable and the amount of the fees to be paid by the customer is fixed or determinable. Amounts that have been invoiced are recorded in accounts receivable and deferred revenue. Our subscription agreements generally contain
57
Table of Contents
multiple service elements and deliverables. These elements include access to our software and often specify initial services including implementation and training. Except under limited circumstances, our subscription agreements do not provide customers the right to take possession of the software at any time.
In accordance with ASC 605-25, “Multiple-Element Arrangements” (“ASC 605-25”) and ASC 985-605, “Software Revenue Recognition” (“ASC 985-605”), we define all elements in our multiple element subscription agreements as a single unit of accounting, and accordingly, recognize all associated revenue over the subscription period, which is typically one to five years in length. In the event professional services relating to implementation are required, we generally do not recognize revenue until such implementation is complete. In applying the guidance in ASC 605-25 and ASC 985-605, we determined that we do not have objective and reliable evidence of the fair value of the subscription to our on-demand software after delivery of specified initial services. We therefore account for our subscription arrangements and our related service fees as a single unit. Additionally, we license software under non-cancelable license agreements and provide services including implementation, consulting, training services and postcontract customer support (PCS). On certain software license arrangements, we have established vendor-specific objective evidence (VSOE) for postcontract customer support, using the substantive renewal rate method. For arrangements for which we have established VSOE, we allocate revenue using VSOE for the postcontract customer support (PCS) and the residual method for the other elements and accounts for other elements as a single unit of accounting. The revenue related to the postcontract customer support for which we have established VSOE is recognized ratably from the delivery date of the license through the contract period. If we are not able to establish VSOE on postcontract customer support, and postcontract customer support is the only undelivered element, then all revenue from the arrangement is recognized ratably over the contract period. However, if VSOE is not established but PCS has been delivered, then all revenue from the arrangement is recognized ratably over the contract period once the last element is delivered.
Income Taxes. We account for income taxes in accordance with ASC 740, “Income Taxes” (“ASC 740”), which requires that deferred tax assets and liabilities be recognized using enacted tax rates for the effect of temporary differences between the book and tax basis of recorded assets and liabilities. ASC 740 also requires that deferred tax assets be reduced by a valuation allowance if it is more likely than not that some portion of all of the deferred tax asset will not be realized. The realization of the deferred tax assets is evaluated quarterly by assessing the valuation allowance and by adjusting the amount of the allowance, if necessary. As of March 31, 2010, we have a valuation allowance of $23.4 million against our deferred tax assets.
ASC 740-10 clarifies the accounting for uncertainty in income taxes by prescribing the minimum recognition threshold and measurement requirements a tax position must meet before recognized a benefit in the financial statements. ASC 740-10 also provides guidance on derecognition, measurement, classification, interest and penalties, accounting for interim periods and disclosures for uncertain tax positions.
Software Development Costs. We capitalize certain internal software development costs under the provisions of ASC 350, “Internal Use Software” (“ASC 350”). ASC350 requires computer software costs associated with internal use software to be charged to operations as incurred until certain capitalization criteria are met. Costs incurred during the preliminary project stage and the post-implementation stages are expensed as incurred. Certain qualifying costs incurred during the application development stage are capitalized as property, equipment and software. These costs generally consist of internal labor during configuration, coding, and testing activities. Capitalization begins when the preliminary project stage is complete, management with the relevant authority authorizes and commits to the funding of the software project, and it is probable that the project will be completed and the software will be used to perform the function intended. These costs are amortized using the straight-line method over the estimated useful life of the software, generally three years.
Allowance for Doubtful Accounts. We maintain an allowance for doubtful accounts for estimated losses resulting from our customers’ inability to pay us. The provision is based on our historical experience and for specific customers that, in our opinion, are likely to default on our receivables from them. In order to identify
58
Table of Contents
these customers, we perform ongoing reviews of all customers that have breached their payment terms, as well as those that have filed for bankruptcy or for whom information has become available indicating a significant risk of non-recoverability. In addition, we have experienced significant growth in the number of our customers, and we have less payment history to rely upon with these customers. We rely on historical trends of bad debt as a percentage of total revenue and apply these percentages to the accounts receivable associated with new customers and evaluate these customers over time. To the extent that our future collections differ from our assumptions based on historical experience, the amount of our bad debt and allowance recorded may be different.
Stock-Based Compensation. We follow the provisions of ASC 718, “Stock Compensation” (“ASC 718”), which requires that all stock-based compensation be recognized as an expense in the financial statements over the service period and that such expense be measured at the fair value of the award.
Determining the appropriate fair value model and calculating the fair value of stock-based payment awards requires the use of highly subjective assumptions, including the expected life of the stock-based payment awards and stock price volatility. Beginning in fiscal year 2006, we have used the Black-Scholes option-pricing model to value our option grants and determine the related compensation expense. The assumptions used in calculating the fair value of stock-based payment awards represent management’s best estimates, but the estimates involve inherent uncertainties and the application of management judgment. As a result, if factors change and we use different assumptions, our stock-based compensation expense could be materially different in the future.
We have historically estimated our expected volatility based on that of our publicly traded peer companies as we determined that we did not have adequate historical data from our traded share price. Until February 2007, we were a private company and therefore lack sufficient company-specific historical and implied volatility information. We did not grant any new stock options during the fiscal years ended March 31, 2010 and 2009; however, previously granted stock option awards were modified in connection with our workforce reduction on January 7, 2009 and the resignation of our Chief Executive Officer on February 20, 2010. The modification of the awards consisted of acceleration of the respective awards’ vesting schedule. For the modified awards issued during the years ended March 31, 2010 and 2009, we determined we have adequate historical data from our traded share price, as such, expected volatilities utilized in the model are based on the historic volatility of our stock price.
The stock price volatility and expected terms utilized in the calculation of fair values involve management’s best estimates at that time, both of which impact the fair value of the option calculated under the Black-Scholes methodology and, ultimately, the expense that will be recognized over the vesting period of the option. ASC 718 also requires that we recognize compensation expense for only the portion of options that are expected to vest. Therefore, we have estimated expected forfeitures of stock options with the adoption of ASC 718. In developing a forfeiture rate estimate, we have considered our historical experience, our growing employee base and the historical limited liquidity of our common stock. If the actual number of forfeitures differs from those estimated by management, additional adjustments to compensation expense may be required in future periods.
Valuation of Goodwill and Indefinite Lived Intangible Assets. We follow the guidance of ASC 350, “Intangibles—Goodwill and Other” (“ASC 350”). In accordance with ASC 350, goodwill and certain indefinite lived intangible assets are no longer amortized, but instead evaluated for impairment at least annually and whenever events or changes in circumstances indicate that the carrying value of the goodwill or intangible asset is greater than its fair value. Factors we consider important that could trigger an impairment review include significant underperformance relative to historically or projected future operating results, identification of other impaired assets within a reporting unit, the disposition of a significant portion of a reporting unit, significant adverse changes in business climate or regulations, significant changes in senior management, significant changes in the manner of our use of the acquired assets or the strategy for our overall business, significant negative industry or economic trends, a significant decline in our stock price for a sustained period, a decline in our credit rating, or a reduction of our market capitalization relative to net book value. Determining whether a triggering event has occurred includes significant judgment from management.
Our annual impairment review is based on a combination of the income approach, which estimates the fair value of our reporting units based on a discounted cash flow approach, and the market approach, which estimates
59
Table of Contents
the fair value of our reporting units based on comparable market multiples. The determination of the fair value of the reporting units requires us to make significant estimates and assumptions. These estimates and assumptions primarily include but are not limited to; the selection of appropriate peer group companies, control premiums appropriate for acquisitions in the industries in which we compete, the discount rate, terminal growth rates, forecasts of revenue and expense growth rates, changes in working capital, depreciation and amortization, and capital expenditures. Due to the inherent uncertainty involved in making these estimates, actual financial results could differ from those estimates. Changes in assumptions concerning future financial results or other underlying assumptions would have a significant impact on either the fair value of the reporting unit or the amount of the goodwill impairment charge.
As of March 31, 2010, we had two reporting units, the Salary.com reporting unit and the payroll/HRMS reporting unit which had goodwill balances of approximately $12.9 million and $4.1 million, respectively, prior to our annual impairment assessment. We performed our annual goodwill impairment assessment as of March 31, 2010 using the two-step process required by ASC 350. We used a combination of an income approach and a market approach to determine the fair value of the reporting units. We then performed “Step 1” and compared the weighted average fair value of the each reporting unit of accounting to its carrying value as of March 31, 2010 which resulted in the carrying value of the payroll/HRMS reporting unit exceeding its fair value. Our Salary.com reporting unit’s fair value significantly exceeded its carrying value as of March 31, 2010.
Accordingly, we performed “Step 2” only in relation to the payroll/HRMS reporting unit. The second step determines the implied fair value of goodwill by comparing the fair value of the payroll/HRMS reporting unit to the aggregate fair value of all the assets and liabilities of this reporting unit. In the “Step 2” impairment analysis, we compared the implied fair value of goodwill in the payroll/HRMS reporting unit to its carrying value. We determined the implied fair value of goodwill was approximately $2.0 million. As a result, we recorded a non-cash impairment charge to goodwill of approximately $2.1 million.
The process of evaluating goodwill for impairment requires several judgments and assumptions to be made to determine the fair value of the reporting unit, including the method used to determine fair value, discount rates, expected levels of cash flows, revenues and earnings, and the selection of comparable companies used to develop market based assumptions. We employed an eight year discounted cash flow methodology to arrive at the fair value of the payroll/HRMS reporting unit. In calculating the reporting unit’s fair value, we derived the projected eight year cash flows for the reporting unit. This process starts with the projected cash flows of the reporting unit and then the cash flows are discounted to present value. We also employed a guideline company method which indicates value for the reporting unit by comparison to similar publicly traded companies. We identified a set of comparable companies to derive market multiples for the latest twelve months and next fiscal year revenue. The revenue multiples for the reporting unit were based on size, profitability, and comparability of the reporting unit’s products and services relative to those of the selected guideline companies. From the enterprise values determined using these revenue multiples, we applied a control premium of 10% in order to estimate the equity value of the payroll/HRMS reporting unit. Since the data underlying the guideline company analysis was based on indications of the value on a minority interest basis, we applied the control premium which was based on the analysis of control premiums with the entity’s industry.
The discounted cash flows used to estimate the reporting unit’s fair value was based on assumptions regarding the reporting unit’s estimated projected future cash flows and estimated weighted-average cost of capital that a market participant would use in evaluating the payroll/HRMS reporting unit in a purchase transaction. The estimated weighted-average cost of capital was based on the risk-free interest rate and other factors such as equity risk premiums and the ratio of total debt to equity capital. In performing the impairment test, we took steps to ensure appropriate and reasonable cash flow projections and assumptions were used in our analysis. The rate used to discount the estimated future cash flows for the payroll/HRMS reporting unit was approximately 29%. Our projections for the next eight years included revenue and operating expenses, in line with our expectations over the period based on current market and economic conditions and our historical and expected knowledge of the reporting unit. The failure of the reporting unit to execute as forecasted could have an adverse affect on our impairment test. Future adverse changes in market conditions or poor operating results of the reporting unit could result in losses or an inability to recover the carrying value of the investments in the reporting unit, thereby possibly requiring additional impairment charges in the future.
60
Table of Contents
Valuation of Long-Lived Assets. We assess the recoverability of our long-lived assets that are held for use, such as property, equipment and software and amortizable intangible assets in accordance with ASC 360, “Property, Plant and Equipment” (“ASC 360”) when events or changes in circumstances indicate that the carrying amount of an asset or asset group may not be recoverable. Recoverability of assets or an asset group to be held and used is measured by a comparison of the carrying amount of an asset or asset group to estimated undiscounted future cash flows expected to be generated by the asset or the asset group. Future undiscounted cash flows include estimates of future revenues, driven by market growth rates, and estimated future costs. Cash flow projections are based on trends of historical performance and our estimate of future performance. If the carrying amount of the asset or asset group exceeds the estimated future cash flows, an impairment charge is recognized by the amount by which the carrying amount of the asset or asset group exceeds its estimated fair value.
In February 2010, as a result of our strategic realignment subsequent to the resignation of our Chief Executive Officer, we identified a triggering event under ASC 360 related to the long-lived assets of the payroll/HRMS reporting unit. This event led us to revise our expectations of future invoicing, revenues and operating profit margins for the payroll/HRMS reporting unit. As a result of the factors described above, in accordance with ASC 360, we determined it was necessary to assess the recoverability of the reporting units long lived assets, which are primarily amortizable intangible assets.
As required by ASC 360, we, with the assistance of a third-party independent appraiser, performed our assessment at the asset group level which represented the lowest level of cash flows that are largely independent of cash flows of other assets and liabilities. We used an income approach to determine if the sum of the undiscounted cash flows expected to result from the use and eventual disposition of the assets exceeded the carrying values of those assets. As a result of this assessment, the carrying value for each asset group level exceeded the undiscounted cash flows. Accordingly, we then utilized a relief from royalty method and an excess earnings income approach in order to determine fair value of our amortizable intangible assets in order to compare to the carrying values of those assets. This analysis resulted in non-cash impairment charges of $2.3 million to developed technology, $0.8 million to customer relationships and $0.4 million to trade names recorded in the fourth quarter of fiscal 2010. See Note 5 of the consolidated financial statements for further information on the Company’s assessment of its long-lived assets.
These methods require several judgments and assumptions to be made to determine the fair value of the assets, including royalty rates, discount rates and expected levels of cash flows, earnings and revenues. The Company used royalty rates ranging from 1.5% to 10% based on independent research of comparable royalty agreements. Consistent with our projections of revenue and operating expenses used to assess goodwill, our estimates are based on current market and economic conditions and our historical and expected knowledge of the reporting unit and its intangible assets. The discounted cash flows used to estimate the assets’ fair value was based on assumptions regarding the assets’ estimated projected future tax affected relief from royalty and estimated weighted-average cost of capital that a market participant would use in evaluating the intangible assets in a purchase transaction. The estimated weighted-average cost of capital was based on the risk-free interest rate and other factors such as equity risk premiums and the ratio of total debt to equity capital. The rate used to discount the estimated future cash flows for the payroll/HRMS reporting unit’s amortizable intangible assets was approximately 29%. The failure of the reporting unit, or intangible assets, to execute as forecasted could have an adverse affect on our impairment test. Future adverse changes in market conditions or poor operating results could result in losses or an inability to recover the carrying value of the respective intangible asset, thereby possibly requiring additional impairment charges in the future.
Recent Accounting Pronouncements
In February 2010, the the Financial Accounting Standards Board (“FASB”) issued Accounting Standard Update 2010-09, “Subsequent Events (Topic 855)—Amendments to Certain Recognition and Disclosure Requirements” (“ASU 2010-09’), in accordance with and as required by ASC 855. ASU 2010-09 was issued in
61
Table of Contents
response to a number of constituents informing the Board that the requirements to disclose the date that the financial statements are issued potentially conflict with some of the SEC guidance. This update provides that an entity that is an SEC filer is not required to disclose the date through which subsequent events have been evaluated. This change alleviates potential conflicts between Subtopic 855-10 and the SEC’s requirements. The adoption of this new guidance has been applied to our Consolidated Financial Statements and we have evaluated subsequent events through the date of issuance of these financial statements.
In September 2009, the FASB issued Accounting Standards Update 2009-13, “Revenue Recognition (Topic 605)—Multiple Deliverable Revenue Arrangements” (“ASU 2009-13’), which addresses the accounting for multiple-deliverable arrangements to enable vendors to account for products or services (deliverables) separately rather than as a combined unit. The new guidance will be effective prospectively for revenue arrangements entered into or materially modified beginning in fiscal years on or after June 15, 2010. We expect this guidance may have a significant impact on our revenue recognition policy and financial statements, however, we have not determined the impact as of March 31, 2010.
In September 2009, the FASB issued Accounting Standards Update 2009-14, “Software (Topic 985)—Certain Revenue Arrangements That Include Software Elements” (“ASU 2009-14’), which addresses the accounting for revenue transactions involving software. ASU 2009-14 amends ASC 985-605 to exclude from its scope tangible products that contain both software and non-software components that function together to deliver a product’s essential functionality. The new guidance will be effective prospectively for revenue arrangements entered into or materially modified beginning in fiscal years on or after June 15, 2010. We expect this guidance may have a significant impact on our revenue recognition policy and financial statements, however, we have not determined the impact as of March 31, 2010.
62
Table of Contents
| ITEM 7A. | QUANTITATIVE AND QUALITATIVE DISCLOSURES ABOUT MARKET RISK |
Foreign Currency Exchange Risk. Substantially all sales to customers and arrangements with vendors provide for pricing and payment in United States dollars, thereby reducing the impact of foreign exchange rate fluctuations on our results. A small percentage of our consolidated revenues and operational expenses consist of international revenues and operational expenses which are denominated in foreign currencies. Exchange rate volatility could negatively or positively impact those revenues and operating costs. For the fiscal years ended March 31, 2010 and 2009, the Company incurred foreign exchange losses of $0.1 million and $0.2 million, respectively. Fluctuations in currency exchange rates could have a greater effect on our business in the future to the extent our expenses increasingly become denominated in foreign currencies.
Interest Rate Sensitivity. Interest income and expense are sensitive to changes in the general level of U.S. interest rates. However, based on the nature and current level of our investments, which are primarily cash and debt obligations, we believe that there is no material risk of exposure.
| ITEM 8. | FINANCIAL STATEMENTS AND SUPPLEMENTARY DATA |
The information required by Item 8 is contained on pages F-1 through F-36 of this Annual Report on Form 10-K.
| ITEM 9. | CHANGES IN AND DISAGREEMENTS WITH ACCOUNTANTS ON ACCOUNTING AND FINANCIAL DISCLOSURE |
There have been no changes in or disagreements with our independent registered public accountants on accounting or financial disclosure matters during our two most recent fiscal years.
| ITEM 9A(T). | CONTROLS AND PROCEDURES |
| (a) | Evaluation of Disclosure Controls and Procedures |
As required by Rules 13a-15 and 15d-15 under the Securities Exchange Act of 1934 (Exchange Act), we have evaluated, with the participation of our management, including our Chief Executive Officer and Chief Financial Officer (who serve as our principal executive officer and principal financial officer, respectively), the effectiveness of our disclosure controls and procedures as of the end of the period covered by this report. Our disclosure controls and procedures are designed to provide reasonable assurance that information required to be disclosed by us in the reports that we file or submit under the Exchange Act is recorded, processed, summarized and reported within the time periods specified in the SEC’s rules and forms, and our management necessarily was required to apply its judgment in evaluating and implementing our disclosure controls and procedures. Based upon the evaluation described above, our Chief Executive Officer and Chief Financial Officer have concluded that, as of the end of the period covered by this report, our disclosure controls and procedures were effective in ensuring that information required to be disclosed by us in the reports that we file or submit under the Exchange Act is recorded, processed, summarized and reported within the time periods specified in the SEC’s rules and forms, including ensuring that such information is accumulated and communicated to our management, including our Chief Executive Officer and Chief Financial Officer, as appropriate to allow timely decisions regarding required disclosure.
| (b) | Management’s Annual Report on Internal Control Over Financial Reporting |
Our management is responsible for establishing and maintaining an adequate system of internal control over financial reporting. Internal control over financial reporting is a process designed to provide reasonable assurance regarding the reliability of financial reporting and the preparation of financial statements for external purposes in accordance with generally accepted accounting principles.
63
Table of Contents
A company’s internal control over financial reporting includes those policies and procedures that: (i) pertain to the maintenance of records that, in reasonable detail, accurately and fairly reflect the transactions and dispositions of the assets of the company; (ii) provide reasonable assurance that transactions are recorded as necessary to permit preparation of consolidated financial statements in accordance with generally accepted accounting principles, and that receipts and expenditures of the company are being made only in accordance with authorizations of management and directors of the company; and (iii) provide reasonable assurance regarding prevention or timely detection of unauthorized acquisition, use, or disposition of the company’s assets that could have a material effect on the consolidated financial statements.
Because of its inherent limitations, internal control over financial reporting may not prevent or detect misstatements. Also, projections of any evaluation of effectiveness to future periods are subject to the risk that controls may become inadequate because of changes in conditions, or that the degree of compliance with the policies or procedures may deteriorate.
Our management conducted an evaluation of the effectiveness of our internal control over financial reporting as of March 31, 2010 based on the Internal Control—Integrated Framework issued by the Committee of Sponsoring Organizations of the Treadway Commission (COSO). Based on that evaluation, our management concluded that our internal control over financial reporting was effective as of March 31, 2010.
This annual report does not include an attestation report of our independent registered public accounting firm regarding internal control over financial reporting. Management’s report was not subject to attestation by our independent registered public accounting firm pursuant to temporary rules of the SEC that permit us to provide only management’s report in this annual report.
| (c) | Changes in Internal Control Over Financial Reporting |
There were no changes in our internal control over financial reporting during the quarter ended March 31, 2010 that have materially affected, or are reasonably likely to materially affect, our internal control over financial reporting.
64
Table of Contents
PART III
| ITEM 10. | DIRECTORS , EXECUTIVE OFFICERS AND CORPORATE GOVERNANCE |
The information required by this item is incorporated by reference to our Proxy Statement for the 2010 Annual Meeting of Stockholders to be filed with the SEC within 120 days after the end of our fiscal year ended March 31, 2010.
| ITEM 11. | EXECUTIVE COMPENSATION |
The information required by this item is incorporated by reference to our Proxy Statement for the 2010 Annual Meeting of Stockholders to be filed with the SEC within 120 days after the end of our fiscal year ended March 31, 2010.
| ITEM 12. | SECURITY OWNERSHIP OF CERTAIN BENEFICIAL OWNERS AND MANAGEMENT AND RELATED STOCKHOLDER MATTERS |
The information required by this item is incorporated by reference to our Proxy Statement for the 2010 Annual Meeting of Stockholders to be filed with the SEC within 120 days after the end of our fiscal year ended March 31, 2010.
| ITEM 13. | CERTAIN RELATIONSHIPS AND RELATED TRANSACTIONS, AND DIRECTOR INDEPENDENCE |
The information required by this item is incorporated by reference to our Proxy Statement for the 2010 Annual Meeting of Stockholders to be filed with the SEC within 120 days after the end of our fiscal year ended March 31, 2010.
| ITEM 14. | PRINCIPAL ACCOUNTANT FEES AND SERVICES |
The information required by this item is incorporated by reference to our Proxy Statement for the 2010 Annual Meeting of Stockholders to be filed with the SEC within 120 days after the end of our fiscal year ended March 31, 2010.
65
Table of Contents
PART IV
| ITEM 15. | EXHIBITS AND FINANCIAL STATEMENT SCHEDULES |
| Page Number in this Form 10-K | ||
| The Financial Statements required to be filed by Item 8 of Form 10-K, and filed herewith, are as follows: |
||
| F-1 | ||
| F-2 | ||
| Consolidated Statements of Operations for the three years ended March 31, 2010, 2009 and 2008 |
F-3 | |
| F-4 | ||
| Consolidated Statements of Cash Flows for the three years ended March 31, 2010, 2009 and 2008 |
F-5 | |
| F-6 | ||
| (a)(2) INDEX TO FINANCIAL STATEMENT SCHEDULE |
||
| S-1 | ||
Schedules not listed above have been omitted because the information requested to be set forth therein is either not applicable or the required information is included in the consolidated financial statements or related notes.
(a)(3) INDEX TO EXHIBITS
See attached Exhibit Index of this Annual Report on Form 10-K.
(b) Exhibits
The Company hereby files as part of this Annual Report on Form 10-K the Exhibits listed in Item 15 (a) (3) above. Exhibits which are incorporated herein by reference can be inspected and copied at the public reference facilities maintained by the Securities and Exchange Commission (the “Commission”), 450 Fifth Street, Room 1024, N.W., Washington, D.C. 20549. Copies of such material can also be obtained from the Public Reference Section of the Commission, 450 Fifth Street, N.W., Washington, D.C. 20549, at prescribed rates.
(c) FINANCIAL STATEMENT SCHEDULES
The Company hereby files as part of this Annual Report on Form 10-K the consolidated financial statements schedule listed in Item 15 (a)(2) above, which is attached hereto.
66
Table of Contents
SIGNATURES
Pursuant to the requirements of Section 13 or 15(d) of the Securities Exchange Act of 1934, the registrant has duly caused this report to be signed on its behalf by the undersigned, thereunto duly authorized on June 29, 2010.
| SALARY.COM, INC. | ||
| By: | /S/ PAUL R. DAOUST | |
| Paul R. Daoust | ||
| President and Chief Executive Officer | ||
Power of Attorney
Each person whose signature appears below constitutes and appoints Paul R. Daoust and Bryce Chicoyne, and each of them, his true and lawful attorneys-in-fact and agents, with full power of substitution in each of them, for him and in his name, place, and stead, and in any and all capacities, to sign this Annual Report on Form 10-K of Salary.com, Inc. and any amendments thereto, and to file the same, with all exhibits thereto and any other documents in connection therewith, with the Securities and Exchange Commission, granting unto said attorneys-in-fact and agents, and each of them, full power and authority to do and perform each and every act and thing requisite or necessary to be done in and about the premises, as fully and to all intents and purposes as he might or could do in person, hereby ratifying and confirming all that said attorneys-in-fact and agents or any of them or their or his substitute or substitutes may lawfully do or cause to be done by virtue hereof.
Pursuant to the requirements of the Securities Exchange Act of 1934, this report has been signed below by the following persons on behalf of the registrant and in the capacities and on the dates indicated.
| Signature |
Title |
Date | ||
| /s/ PAUL R. DAOUST Paul R. Daoust |
President and Chief Executive Officer (Principal Executive Officer) |
June 29, 2010 | ||
| /s/ BRYCE CHICOYNE Bryce Chicoyne |
Senior Vice President, Chief Financial Officer, Treasurer and Director (Principal Financial and Accounting Officer) |
June 29, 2010 | ||
| /s/ YONG ZHANG Yong Zhang |
Executive Vice President, Chief Operating Officer and Director |
June 29, 2010 | ||
|
G. Kent Plunkett |
Chairman of the Board |
|||
| /s/ JOHN F. GREGG John F. Gregg |
Director |
June 29, 2010 | ||
| /s/ WILLIAM C. MARTIN William C. Martin |
Director |
June 29, 2010 | ||
| /s/ EDWARD F. MCCAULEY Edward F. McCauley |
Director |
June 29, 2010 | ||
67
Table of Contents
| Signature |
Title |
Date | ||
|
John R. Sumser |
Director | |||
| /s/ TERRY TEMESCU Terry Temescu |
Director | June 29, 2010 | ||
| /s/ ROBERT A. TREVISANI Robert A. Trevisani |
Director | June 29, 2010 | ||
68
Table of Contents
EXHIBIT INDEX
| Exhibit |
Description | |
| 2.1 | Membership Interest Purchase Agreement dated as of May 15, 2007 by and among Salary.com, Inc., ICR Limited, L.C., Joseph Duggan and Roger Sturtevant, Jr. (incorporated by reference to Exhibit 2.1 filed with the Company’s Current Report on Form 8-K dated May 15, 2007, SEC File No. 001-33312). | |
| 2.2 | Share Purchase Agreement dated as of May 15, 2007, by and among Salary.com, Inc., John Cunnell and Valerie Cunnell (incorporated by reference to Exhibit 2.2 filed with the Company’s Current Report on Form 8-K dated May 15, 2007, SEC File No. 001-33312). | |
| 2.3 | Asset Purchase Agreement dated as of July 31, 2007 by and among Salary.com, Inc., ITG Competency Group, LLC and Douglas W. Crisman (incorporated by reference to Exhibit 2.1 to the Company’s Current Report on Form 8-K filed July 31, 2007, SEC File No. 001-33312). | |
| 2.4 | Asset Purchase Agreement, dated as of December 21, 2007, by and among Salary.com, Inc., Stephen C. Schoonover, Schoonover Associates, Inc. and Helen Schoonover (incorporated by reference to Exhibit 2.1 to the Company’s Current Report on Form 8-K filed December 28, 2007, SEC File No. 001-33312). | |
| 2.5 | Agreement and Plan of Merger, dated as of December 9, 2008, by and among Salary.com, Inc., Genesys Software Systems, Inc., Cobalt Acquisition Corp. and Lawrence J. Munini (incorporated by reference to Exhibit 2.1 to the Company’s Current Report on Form 8-K filed December 10, 2008, SEC File No. 001-33312). | |
| 2.6 | Share Purchase Agreement, dated as of August 21, 2008, by and among Salary.com, Inc., the Principals, Oxford and the Additional Shareholders (incorporated by reference to Exhibit 2.1 to the Company’s Current Report on Form 8-K filed August 27, 2008, SEC File No. 001-33312). | |
| 3.1 | Amended and Restated Certificate of Incorporation (incorporated by reference to Exhibit 3.1 filed with Amendment No. 2 to the Company’s Registration Statement on Form S-1, dated January 19, 2007, Registration No. 333-138646). | |
| 3.2 | Form of Second Amended and Restated Certificate of Incorporation (incorporated by reference to Exhibit 3.2 filed with Amendment No. 2 to the Company’s Registration Statement on Form S-1, dated January 19, 2007, Registration No. 333-138646). | |
| 3.3 | Amended and Restated By-Laws (incorporated by reference to Exhibit 3.3 filed with Amendment No. 2 to the Company’s Registration Statement on Form S-1, dated January 19, 2007, Registration No. 333-138646). | |
| 3.4 | Certificate of Designations, Preferences and Rights of a Series of Preferred Stock of Salary.com, Inc. classifying and designating the Series A Junior Participating Cumulative Preferred Stock (incorporated by reference to Exhibit 3.1 filed with the Company’s Registration Statement on Form 8-A, filed November 20, 2008, SEC File No. 001-33312). | |
| 4.1 | Specimen Common Stock Certificate (incorporated by reference to Exhibit 4.1 filed with Amendment No. 2 to the Company’s Registration Statement on Form S-1, dated January 19, 2007, Registration No. 333-138646). | |
| 4.2 | Shareholder Rights Agreement, dated as of November 14, 2008, by and between Salary.com, Inc. and American Stock Transfer & Trust Company, LLC, as Rights Agent (incorporated by reference to Exhibit 4.1 filed with the Company’s Registration Statement on Form 8-A, filed November 20, 2008, SEC File No. 001-33312). | |
69
Table of Contents
| Exhibit |
Description | |
| 10.1 | Second Amended and Restated 2000 Stock Option Incentive Plan (incorporated by reference to Exhibit 10.1 filed with the Company’s Registration Statement on Form S-1, dated November 13, 2006, Registration No. 333-138646). * | |
| 10.1.1 | 2000 Stock Option and Incentive Plan, Form of Incentive Stock Option Agreement (incorporated by reference to Exhibit 10.1.1 filed with the Company’s Registration Statement on Form S-1, dated November 13, 2006, Registration No. 333-138646). * | |
| 10.2 | First Amended and Restated 2004 Stock Option and Incentive Plan (incorporated by reference to Exhibit 10.2 filed with the Company’s Registration Statement on Form S-1, dated November 13, 2006, Registration No. 333-138646). * | |
| 10.2.1 | 2004 Stock Option and Incentive Plan, Form of Stock Option Agreement (incorporated by reference to Exhibit 10.2.1 filed with the Company’s Registration Statement on Form S-1, dated November 13, 2006, Registration No. 333-138646). * | |
| 10.3 | 2007 Stock Option and Incentive Plan (incorporated by reference to Appendix A of the Company’s Proxy Statement, filed July 29, 2008, SEC File No. 001-33312). * | |
| 10.3.1 | 2007 Stock Option and Incentive Plan, Form of Incentive Stock Option Agreement (incorporated by reference to Exhibit 10.3.1 filed with Amendment No. 2 to the Company’s Registration Statement on Form S-1, dated January 19, 2007, Registration No. 333-138646). * | |
| 10.3.2 | 2007 Stock Option and Incentive Plan, Form of Non-Qualified Stock Option Agreement (incorporated by reference to Exhibit 10.3.2 filed with Amendment No. 2 to the Company’s Registration Statement on Form S-1, dated January 19, 2007, Registration No. 333-138646). * | |
| 10.3.3 | 2007 Stock Option and Incentive Plan, Form of Non-Qualified Stock Option Non-Employee Agreement (incorporated by reference to Exhibit 10.3.3 filed with Amendment No. 2 to the Company’s Registration Statement on Form S-1, dated January 19, 2007, Registration No. 333-138646). * | |
| 10.3.4 | 2007 Stock Option and Incentive Plan, Form of Deferred Stock Award Agreement (incorporated by reference to Exhibit 10.3.4 filed with the Company’s Annual Report on Form 10-K filed June 13, 2008, SEC File No. 001-33312). * | |
| 10.4 | 2007 Employee Stock Purchase Plan (incorporated by reference to Exhibit 10.4 filed with Amendment No. 2 to the Company’s Registration Statement on Form S-1, dated January 19, 2007, Registration No. 333-138646). * | |
| 10.5 | Second Amended and Restated Stockholders Agreement (incorporated by reference to Exhibit 10.5 filed with the Company’s Registration Statement on Form S-1, dated November 13, 2006, Registration No. 333-138646). | |
| 10.5.1 | Amendment to Second Amended and Restated Stockholders Agreement (incorporated by reference to Exhibit 10.5.1 filed with Amendment No. 1 to the Company’s Registration Statement on Form S-1, dated December 21, 2006, Registration No. 333-138646). | |
| 10.6 | Second Amended and Restated Registration Rights Agreement (incorporated by reference to Exhibit 10.6 filed with the Company’s Registration Statement on Form S-1, dated November 13, 2006, Registration No. 333-138646). | |
| 10.7 | Form of Common Stock Purchase Warrant (incorporated by reference to Exhibit 10.7 filed with the Company’s Registration Statement on Form S-1, dated November 13, 2006, Registration No. 333-138646). | |
| 10.8 | Loan and Security Agreement (incorporated by reference to Exhibit 10.9 filed with the Company’s Registration Statement on Form S-1, dated November 13, 2006, Registration No. 333-138646). | |
70
Table of Contents
| Exhibit |
Description | |
| 10.8.1 | First Loan Modification Agreement, dated as of August 8, 2008, by and between Salary.com, Inc. and Silicon Valley Bank (incorporated by reference to Exhibit 10.2 to the Company’s Quarterly Report on Form 10-Q filed August 11, 2008, SEC File No. 001-33312). | |
| 10.8.2 | Second Loan Modification Agreement, dated as of September 17, 2008, by and between Salary.com, Inc. and Silicon Valley Bank (incorporated by reference to Exhibit 10.2 to the Company’s Quarterly Report on Form 10-Q filed November 10, 2008, SEC File No. 001-33312). | |
| 10.8.3 | Third Loan Modification Agreement, dated as of October 8, 2008, by and between Salary.com, Inc. and Silicon Valley Bank (incorporated by reference to Exhibit 10.1 to the Company’s Current Report on Form 8-K filed October 15, 2008, SEC File No. 001-33312). | |
| 10.8.4 | Fourth Loan Modification Agreement, dated as of March 16, 2009, by and between Salary.com, Inc. and Silicon Valley Bank (incorporated by reference to Exhibit 10.8.4 to the Company’s Annual Report on Form 10-K filed June 29, 2009, SEC File No. 001-33312). | |
| 10.8.5 | Fifth Loan Modification Agreement, dated as of June 29, 2009, by and between Salary.com, Inc. and Silicon Valley Bank (incorporated by reference to Exhibit 10.8.5 to the Company’s Annual Report on Form 10-K filed June 29, 2009, SEC File No. 001-33312). | |
| 10.8.6 | Sixth Loan Modification Agreement, dated as of October 15, 2009, by and between Salary.com, Inc. and Silicon Valley Bank (incorporated by reference to Exhibit 10.1 to the Company’s Quarterly Report on Form 10-Q filed November 12, 2009, SEC File No. 001-33312). | |
| 10.8.7 | Waiver Agreement, dated as of June 22, 2010, by and between Salary.com, Inc. and Silicon Valley Bank (filed herewith). | |
| 10.9 | Separation Agreement and Release, dated as of May 26, 2009, by and between Salary.com, Inc. and Meredith Hanrahan (incorporated by reference to Exhibit 10.9 to the Company’s Annual Report on Form 10-K filed June 29, 2009, SEC File No. 001-33312). * | |
| 10.10 | Form of Indemnification Agreement (incorporated by reference to Exhibit 10.12 filed with Amendment No. 2 to the Company’s Registration Statement on Form S-1, dated January 19, 2007, Registration No. 333-138646). | |
| 10.11 | Form of Employment Agreement with G. Kent Plunkett (incorporated by reference to Exhibit 10.13 filed with Amendment No. 3 to the Company’s Registration Statement on Form S-1, dated February 9, 2007, Registration No. 333-138646). * | |
| 10.11.1 | Amended and Restated Employment Agreement, dated as of December 30, 2008, by and between Salary.com, Inc. and G. Kent Plunkett (incorporated by reference to Exhibit 10.1 to the Company’s Quarterly Report on Form 10-Q filed February 9, 2009, SEC File No. 001-33312). * | |
| 10.12 | Salary.com, Inc. Employment offer letter dated as of April 2, 2008, by and between Salary.com and Bryce Chicoyne (incorporated by reference to Exhibit 10.17 to the Company’s Annual Report on Form 10-K for the year ended March 31, 2008, SEC File No. 001-33312). * | |
| 10.12.1 | Salary.com, Inc. Amendment to Employment offer letter dated as of December 31, 2008, by and between Salary.com, Inc. and Bryce Chicoyne (incorporated by reference to Exhibit 10.2 to the Company’s Quarterly Report on Form 10-Q filed February 9, 2009, SEC File No. 001-33312). * | |
| 10.13 | Separation Agreement and Release, dated as of January 7, 2009, by and between Salary.com, Inc. and Christopher Fusco (incorporated by reference to Exhibit 10.3 to the Company’s Quarterly Report on Form 10-Q filed February 9, 2009, SEC File No. 001-33312). * | |
71
Table of Contents
| Exhibit |
Description | |
| 10.14 | Lease Contract, dated as of October 24, 2008, by and between SDC China Limited and Shanghai Zhangjiang Microelectronics Port Co., Ltd. (incorporated by reference to Exhibit 10.1 to the Company’s Quarterly Report on Form 10-Q filed November 10, 2008, SEC File No. 001-33312). | |
| 10.15 | Separation Agreement and Release, dated as of April 7, 2009, by and between Salary.com, Inc. and William H. Coleman (incorporated by reference to Exhibit 10.1 to the Company’s Current Report on Form 8-K filed April 13, 2009, SEC File No. 001-33312). * | |
| 10.16 | Separation Agreement and Release, dated as of December 19, 2008, by and between Salary.com, Inc. and Christopher Power (incorporated by reference to Exhibit 10.20 to the Company’s Annual Report on Form 10-K filed June 29, 2009, SEC File No. 001-33312). * | |
| 10.17 | Sublease Agreement, dated as of March 23, 2009, by and between Salary.com, Inc. and Nuance Communications, Inc. (incorporated by reference to Exhibit 10.4 to the Company’s Quarterly Report on Form 10-Q filed August 11, 2009, SEC File No. 001-33312). | |
| 10.18 | Consent, dated August 10, 2009, by and between Salary.com, Inc. and Silicon Valley Bank (incorporated by reference to Exhibit 10.5 to the Company’s Quarterly Report on Form 10-Q filed August 11, 2009, SEC File No. 001-33312). | |
| 10.19 | Separation Agreement, dated as of February 21, 2010, by and between Salary.com, Inc. and G. Kent Plunkett (incorporated by reference to Exhibit 10.1 to the Company’s Current Report on Form 8-K filed February 25, 2010, SEC File No. 001-33312). * | |
| 10.20 | Employment Agreement, dated as of April 12, 2010, by and between Salary.com and Paul Daoust (incorporated by reference to Exhibit 10.1 to the Company’s Current Report on Form 8-K filed April 26, 2010, SEC File 001-33312). * | |
| 10.21 | Retention Bonus Letter Agreement, dated April 20, 2010, by and between Salary.com, Inc. and Bryce Chicoyne (incorporated by reference to Exhibit 10.2 to the Company’s Current Report on Form 8-K filed April 26, 2010, SEC File 001-33312). * | |
| 21.1 | Subsidiaries of the Company (filed herewith). | |
| 23.1 | Consent of Grant Thornton LLP (filed herewith). | |
| 24.1 | Power of Attorney (filed herewith as part of the signature page hereto). | |
| 31.1 | Rule 13a-14(a) Certification of Chief Executive Officer (filed herewith). | |
| 31.2 | Rule 13a-14(a) Certification of Chief Financial Officer (filed herewith). | |
| 32.1 | Certification of Chief Executive Officer and Chief Financial Officer pursuant to 18 U.S.C. Section 1350, as adopted pursuant to Section 906 of the Sarbanes-Oxley Act of 2002 (furnished herewith). | |
| * | Compensatory plan or arrangement applicable to management. |
72
Table of Contents
REPORT OF INDEPENDENT REGISTERED PUBLIC ACCOUNTING FIRM
To the Board of Directors and Stockholders of
Salary.com, Inc.
We have audited the accompanying consolidated balance sheets of Salary.com, Inc. (a Delaware corporation) and subsidiaries (collectively the “Company”) as of March 31, 2010 and 2009, and the related consolidated statements of operations, stockholders’ equity and comprehensive loss, and cash flows for each of the three years in the period ended March 31, 2010. Our audits of the basic financial statements included the financial statement schedule listed in the index appearing under Item 15(a)(2). These financial statements and financial statement schedule are the responsibility of the Company’s management. Our responsibility is to express an opinion on these consolidated financial statements and financial statement schedule based on our audits.
We conducted our audits in accordance with the standards of the Public Company Accounting Oversight Board (United States). Those standards require that we plan and perform the audit to obtain reasonable assurance about whether the financial statements are free of material misstatement. The Company is not required to have, nor were we engaged to perform an audit of its internal control over financial reporting. Our audit included consideration of internal control over financial reporting as a basis for designing audit procedures that are appropriate in the circumstances, but not for the purpose of expressing an opinion on the effectiveness of the Company’s internal control over financial reporting. Accordingly, we express no such opinion. An audit also includes examining, on a test basis, evidence supporting the amounts and disclosures in the financial statements, assessing the accounting principles used and significant estimates made by management, as well as evaluating the overall financial statement presentation. We believe that our audits provide a reasonable basis for our opinion.
In our opinion, the consolidated financial statements referred to above present fairly, in all material respects, the financial position of Salary.com, Inc. and subsidiaries as of March 31, 2010 and 2009, and the results of their operations and their cash flows for each of the three years in the period ended March 31, 2010, in conformity with accounting principles generally accepted in the United States of America. Also in our opinion, the related financial statement schedule, when considered in relation to the basic financial statements taken as a whole, presents fairly, in all material respects, the information set forth therein.
/s/ Grant Thornton LLP
Boston, Massachusetts
June 29, 2010
F-1
Table of Contents
SALARY.COM INC. AND SUBSIDIARIES
CONSOLIDATED BALANCE SHEETS
(in thousands, except share amounts)
| March 31, 2010 |
March 31, 2009 |
|||||||
| Assets |
||||||||
| Current assets: |
||||||||
| Cash and cash equivalents |
$ | 8,773 | $ | 21,085 | ||||
| Accounts receivable, less allowance for doubtful accounts of $249 and $170, at March 31, 2010 and 2009, respectively |
7,695 | 6,040 | ||||||
| Prepaid expenses and other current assets |
2,069 | 1,558 | ||||||
| Total currents assets before funds held for clients |
18,537 | 28,683 | ||||||
| Funds held for clients |
12,967 | 12,964 | ||||||
| Total current assets |
31,504 | 41,647 | ||||||
| Property, equipment and software, net |
2,094 | 3,025 | ||||||
| Amortizable intangible assets, net |
9,125 | 16,112 | ||||||
| Other intangible assets |
935 | 1,504 | ||||||
| Goodwill |
14,967 | 14,734 | ||||||
| Restricted cash |
1,126 | 1,125 | ||||||
| Other assets |
255 | 554 | ||||||
| Total assets |
$ | 60,006 | $ | 78,701 | ||||
| Liabilities and Stockholders’ Equity |
||||||||
| Current liabilities: |
||||||||
| Revolving credit facility |
$ | 2,525 | $ | 8,125 | ||||
| Accounts payable |
3,417 | 1,379 | ||||||
| Accrued compensation |
294 | 964 | ||||||
| Accrued expenses and other current liabilities |
6,251 | 3,300 | ||||||
| Deferred revenue, current portion |
29,356 | 26,556 | ||||||
| Total current liabilities before client funds obligations |
41,843 | 40,324 | ||||||
| Client funds obligations |
12,967 | 12,964 | ||||||
| Total current liabilities |
54,810 | 53,288 | ||||||
| Deferred revenue, less current portion |
2,812 | 1,729 | ||||||
| Deferred income taxes |
1,519 | 1,358 | ||||||
| Other long-term liabilities |
47 | 384 | ||||||
| Total liabilities |
59,188 | 56,759 | ||||||
| Commitments and contingencies (Note 7) |
— | — | ||||||
| Stockholders’ equity: |
||||||||
| Preferred stock, $.0001 par value; 5,000,000 shares authorized; none issued or outstanding |
— | — | ||||||
| Common stock, $.0001 par value; 100,000,000 shares authorized; 16,705,853 and 16,104,454 issued and outstanding at March 31, 2010 and 2009, respectively |
2 | 2 | ||||||
| Additional paid-in capital |
94,248 | 89,372 | ||||||
| Accumulated deficit |
(92,688 | ) | (66,453 | ) | ||||
| Accumulated other comprehensive loss |
(744 | ) | (979 | ) | ||||
| Total stockholders’ equity |
818 | 21,942 | ||||||
| Total liabilities and stockholders’ equity |
$ | 60,006 | $ | 78,701 | ||||
The accompanying notes are an integral part of the consolidated financial statements.
F-2
Table of Contents
SALARY.COM INC. AND SUBSIDIARIES
CONSOLIDATED STATEMENTS OF OPERATIONS
(in thousands, except per share amounts)
| Years ended March 31, | ||||||||||||
| 2010 | 2009 | 2008 | ||||||||||
| Revenues: |
||||||||||||
| Subscription |
$ | 42,685 | $ | 39,630 | $ | 31,552 | ||||||
| Advertising |
3,065 | 2,825 | 2,955 | |||||||||
| Total revenues |
45,750 | 42,455 | 34,507 | |||||||||
| Cost of revenues |
14,458 | 13,157 | 8,229 | |||||||||
| Gross profit |
31,292 | 29,298 | 26,278 | |||||||||
| Operating expenses: |
||||||||||||
| Research and development |
9,696 | 8,846 | 4,941 | |||||||||
| Sales and marketing |
21,788 | 26,139 | 18,963 | |||||||||
| General and administrative |
15,208 | 15,723 | 13,499 | |||||||||
| Amortization of intangible assets |
3,007 | 1,988 | 1,126 | |||||||||
| Restructuring charges |
2,039 | 3,081 | — | |||||||||
| Impairment charges |
5,599 | — | — | |||||||||
| Total operating expenses |
57,337 | 55,777 | 38,529 | |||||||||
| Loss from operations |
(26,045 | ) | (26,479 | ) | (12,251 | ) | ||||||
| Other income (expense): |
||||||||||||
| Interest income |
12 | 537 | 1,906 | |||||||||
| Other expense, net |
(106 | ) | (308 | ) | (48 | ) | ||||||
| Total other (expense) income |
(94 | ) | 229 | 1,858 | ||||||||
| Loss before provision for income taxes |
(26,139 | ) | (26,250 | ) | (10,393 | ) | ||||||
| Provision for income taxes |
97 | 208 | 205 | |||||||||
| Net loss |
$ | (26,236 | ) | $ | (26,458 | ) | $ | (10,598 | ) | |||
| Net loss per share—basic and diluted |
$ | (1.59 | ) | $ | (1.62 | ) | $ | (0.69 | ) | |||
| Weighted average shares outstanding—basic and diluted |
16,456 | 16,320 | 15,464 | |||||||||
The accompanying notes are an integral part of the consolidated financial statements.
F-3
Table of Contents
SALARY.COM INC. AND SUBSIDIARIES
CONSOLIDATED STATEMENTS OF STOCKHOLDERS’ EQUITY
AND COMPREHENSIVE LOSS
(in thousands, except share amounts)
| Common Stock | Additional Paid-In Capital |
Accumulated Deficit |
Accumulated Other Comprehensive Loss |
Total Stockholders’ Equity |
||||||||||||||||||
| Shares | Amount | |||||||||||||||||||||
| Balance at March 31, 2007 |
13,315,580 | $ | 1 | $ | 67,379 | $ | (29,396 | ) | $ | (1 | ) | $ | 37,983 | |||||||||
| Issuance of common stock for warrant and options exercises |
202,144 | — | 409 | — | — | 409 | ||||||||||||||||
| Vesting of early exercise stock options |
444,140 | — | 252 | — | — | 252 | ||||||||||||||||
| Vesting of restricted stock awards |
164,571 | — | — | — | — | — | ||||||||||||||||
| Issuance of common stock for bonuses |
147,451 | — | 1,899 | — | — | 1,899 | ||||||||||||||||
| Issuance of common stock for business acquisitions |
151,211 | — | 773 | — | — | 773 | ||||||||||||||||
| Issuance of common stock for legal settlement |
18,000 | — | 225 | — | — | 225 | ||||||||||||||||
| Issuance of common stock for employee stock purchase plan |
9,902 | — | 100 | — | — | 100 | ||||||||||||||||
| Stock-based compensation expense |
— | — | 5,129 | — | — | 5,129 | ||||||||||||||||
| Comprehensive loss: |
||||||||||||||||||||||
| Cumulative translation adjustment |
— | — | — | — | (4 | ) | (4 | ) | ||||||||||||||
| Net loss |
— | — | — | (10,598 | ) | (10,598 | ) | |||||||||||||||
| Comprehensive loss |
(10,602 | ) | ||||||||||||||||||||
| Balance at March 31, 2008 |
14,452,999 | 1 | 76,166 | (39,994 | ) | (5 | ) | 36,168 | ||||||||||||||
| Issuance of common stock for warrant and options exercises |
108,019 | — | 24 | — | — | 24 | ||||||||||||||||
| Vesting of early exercise stock options |
386,901 | — | 174 | — | — | 174 | ||||||||||||||||
| Vesting of restricted stock awards |
739,890 | 1 | (327 | ) | — | — | (326 | ) | ||||||||||||||
| Issuance of common stock for consulting fees |
52,521 | — | 250 | — | — | 250 | ||||||||||||||||
| Issuance of common stock for business acquisitions |
73,154 | — | 234 | — | — | 234 | ||||||||||||||||
| Issuance of common stock for bonuses and incentive awards |
373,734 | — | 1,725 | — | — | 1,725 | ||||||||||||||||
| Issuance of common stock for Board of Director fees |
67,312 | — | 278 | — | — | 278 | ||||||||||||||||
| Issuance of common stock for employee stock purchase plan |
43,748 | — | 197 | 197 | ||||||||||||||||||
| Repurchase of common stock |
(193,824 | ) | — | (375 | ) | — | — | (375 | ) | |||||||||||||
| Severance payments settled in common stock |
— | — | 154 | — | — | 154 | ||||||||||||||||
| Options assumed as part of acquisition |
— | — | 1,110 | — | — | 1,110 | ||||||||||||||||
| Stock-based compensation expense |
— | — | 9,762 | — | — | 9,762 | ||||||||||||||||
| Comprehensive loss: |
||||||||||||||||||||||
| Cumulative translation adjustment |
— | — | — | — | (974 | ) | (974 | ) | ||||||||||||||
| Net loss |
— | — | — | (26,458 | ) | — | (26,458 | ) | ||||||||||||||
| Comprehensive loss |
(27,432 | ) | ||||||||||||||||||||
| Balance at March 31, 2009 |
16,104,454 | 2 | 89,372 | (66,452 | ) | (979 | ) | 21,943 | ||||||||||||||
| Issuance of common stock for warrant and options exercises |
398,077 | — | 269 | — | — | 269 | ||||||||||||||||
| Vesting of early exercise stock options |
200,315 | — | 46 | — | — | 46 | ||||||||||||||||
| Net restricted stock awards issued and vested |
520,549 | — | (570 | ) | — | — | (570 | ) | ||||||||||||||
| Issuance of common stock for business combination contingent consideration |
32,921 | — | 75 | — | — | 75 | ||||||||||||||||
| Issuance of common stock for bonuses and incentive awards |
246,643 | — | 692 | — | — | 692 | ||||||||||||||||
| Issuance of common stock for Board of Director fees |
94,849 | — | 217 | — | — | 217 | ||||||||||||||||
| Issuance of common stock for employee stock purchase plan |
126,537 | — | 160 | 160 | ||||||||||||||||||
| Repurchase of common stock |
(1,153,816 | ) | — | (2,452 | ) | — | — | (2,452 | ) | |||||||||||||
| Net restricted stock awards issued and vested for severance payments |
135,324 | — | (206 | ) | — | — | (206 | ) | ||||||||||||||
| Stock-based compensation expense |
— | — | 6,645 | — | — | 6,645 | ||||||||||||||||
| Comprehensive loss: |
||||||||||||||||||||||
| Cumulative translation adjustment |
— | — | — | — | 235 | 235 | ||||||||||||||||
| Net loss |
— | — | — | (26,236 | ) | — | (26,236 | ) | ||||||||||||||
| Comprehensive loss |
(26,001 | ) | ||||||||||||||||||||
| Balance at March 31, 2010 |
16,705,853 | $ | 2 | $ | 94,248 | $ | (92,688 | ) | $ | (744 | ) | $ | 818 | |||||||||
The accompanying notes are an integral part of the consolidated financial statements.
F-4
Table of Contents
SALARY.COM INC. AND SUBSIDIARIES
CONSOLIDATED STATEMENTS OF CASH FLOWS
(in thousands)
| Years ended March 31, | ||||||||||||
| 2010 | 2009 | 2008 | ||||||||||
| Cash flows from operating activities: |
||||||||||||
| Net loss |
$ | (26,236 | ) | $ | (26,458 | ) | $ | (10,598 | ) | |||
| Adjustments to reconcile net loss to net cash (used in) provided by operating activities: |
||||||||||||
| Depreciation and amortization of property, equipment and software |
1,659 | 1,411 | 972 | |||||||||
| Amortization of intangible assets |
4,698 | 3,622 | 1,814 | |||||||||
| Stock-based compensation |
6,645 | 9,762 | 5,129 | |||||||||
| Impairment charges |
5,599 | — | — | |||||||||
| Legal settlement paid in common stock |
— | — | 237 | |||||||||
| Board of Directors fees paid in common stock |
217 | 278 | — | |||||||||
| Consulting fees paid in common stock |
— | 250 | — | |||||||||
| Deferred income taxes |
92 | 181 | — | |||||||||
| Provision for (reduction in) doubtful accounts |
79 | (117 | ) | 67 | ||||||||
| Loss on sale or disposal of property, equipment and software |
16 | — | — | |||||||||
| Changes in operating assets and liabilities, net of acquisition: |
||||||||||||
| (Increase) decrease in: |
||||||||||||
| Accounts receivable |
(1,741 | ) | 84 | (203 | ) | |||||||
| Prepaid expenses and other current assets |
(514 | ) | 479 | 311 | ||||||||
| Other assets |
298 | (487 | ) | (73 | ) | |||||||
| Increase (decrease) in: |
||||||||||||
| Accounts payable |
2,101 | (1,002 | ) | 1,354 | ||||||||
| Accrued expense and other current liabilities |
1,379 | (56 | ) | 3,760 | ||||||||
| Other long-term liabilities |
(73 | ) | (20 | ) | 181 | |||||||
| Deferred revenue |
3,828 | 3,851 | 5,477 | |||||||||
| Net cash (used in) provided by operating activities |
(1,953 | ) | (8,222 | ) | 8,428 | |||||||
| Cash flows from investing activities: |
||||||||||||
| Cash paid for acquisition of business, net of cash acquired |
(121 | ) | (12,693 | ) | (16,366 | ) | ||||||
| Cash paid for acquisition of data |
(39 | ) | (23 | ) | (2,369 | ) | ||||||
| Cash paid for other intangible assets |
(417 | ) | (484 | ) | (36 | ) | ||||||
| Increase in restricted cash |
(1 | ) | (386 | ) | (739 | ) | ||||||
| Purchases of property, equipment and software |
(315 | ) | (2,058 | ) | (252 | ) | ||||||
| Proceeds on sale of property, equipment and software |
28 | — | — | |||||||||
| Capitalization of software development costs |
(277 | ) | (153 | ) | (390 | ) | ||||||
| Net increase in assets held to satisfy client funds obligations |
(3 | ) | (7,890 | ) | — | |||||||
| Net cash used in investing activities |
(1,145 | ) | (23,687 | ) | (20,152 | ) | ||||||
| Cash flows from financing activities: |
||||||||||||
| Proceeds from revolving credit facility |
13,475 | 8,125 | — | |||||||||
| Repayments of revolving line of credit and note payable |
(19,291 | ) | (193 | ) | — | |||||||
| Proceeds from exercise of common stock options and warrants |
269 | 221 | 500 | |||||||||
| Repurchase of unvested exercised stock options |
(31 | ) | (56 | ) | (61 | ) | ||||||
| Repurchase and retirement of common and restricted stock |
(3,252 | ) | (702 | ) | — | |||||||
| Net increase in client funds obligations |
3 | 7,890 | — | |||||||||
| Net cash (used in) provided by financing activities |
(8,827 | ) | 15,285 | 439 | ||||||||
| Effect of exchange rate changes on cash and cash equivalents |
(387 | ) | (18 | ) | (4 | ) | ||||||
| Net decrease in cash and cash equivalents |
(12,312 | ) | (16,642 | ) | (11,289 | ) | ||||||
| Cash and cash equivalents, beginning of year |
21,085 | 37,727 | 49,016 | |||||||||
| Cash and cash equivalents, end of year |
$ | 8,773 | $ | 21,085 | $ | 37,727 | ||||||
The accompanying notes are an integral part of the consolidated financial statements.
F-5
Table of Contents
SALARY.COM, INC. AND SUBSIDIARIES
NOTES TO THE CONSOLIDATED FINANCIAL STATEMENTS
| 1. | BUSINESS |
Salary.com, Inc. (the “Company”) is a leading provider of on-demand compensation and talent management solutions in the human capital software-as-a-service (“SaaS”) market. The Company’s software, services and proprietary content help businesses and individuals manage pay and performance. The Company’s products include: CompAnalyst ® , a suite of on-demand compensation management applications that integrates the Company’s data, third-party survey data and a customer’s own pay data with a complete analytics offering; TalentManager ® , the Company’s employee lifecycle performance management software suite which helps businesses automate performance reviews, streamline compensation planning, perform succession planning, and link employee pay to performance; and IPAS ® , a global compensation technology survey with coverage of technology jobs from clerk to chief executive officer in more than 90 countries. The Company also offers one of the largest libraries of leadership and job-specific competencies and a leading job-competency model to manage competencies by position. The Company was incorporated in Delaware in 1999 and its principal operations are located in Needham, Massachusetts. Since December 2006, the Company has operated a facility in Shanghai, China, primarily for research and development activities. In August 2008, the Company acquired Infobasis Limited, now known as Salary.com Limited, a competency-based skills management software company, located in Abingdon, United Kingdom. On December 17, 2008, the Company acquired Genesys Software Systems, Inc. (Genesys), a provider of on-demand HRMS, benefits and payroll services. In June 2010, the Company shut down its telesales operation in Montego Bay, Jamaica which had operated there since February 2009. The Company conducts its business primarily in the United States.
| 2. | SUMMARY OF SIGNIFICANT ACCOUNTING POLICIES |
Principles of Consolidation
The consolidated financial statements include the accounts of Salary.com, Inc. and its wholly-owned subsidiaries. All intercompany balances and transactions have been eliminated in consolidation.
Use of Estimates
The preparation of financial statements in conformity with accounting principles generally accepted in the United States of America (“US GAAP”) requires management to make estimates and assumptions that affect the reported amount of assets and liabilities and disclosure of contingent liabilities at the date of the financial statements and the reported amounts of revenues and expenses during the reporting period. On an ongoing basis, management evaluates these estimates and judgments, including those related to revenue recognition, valuation of long-lived assets, goodwill and intangible assets, acquisition accounting, income taxes, allowance for doubtful accounts, stock-based compensation and capitalization of software development costs. The Company bases these estimates on historical and anticipated results and trends and on various other assumptions that the Company believes are reasonable under the circumstances, including assumptions as to future events. These estimates form the basis for making judgments about the carrying values of assets and liabilities that are not readily apparent from other sources. By their nature, estimates are subject to an inherent degree of uncertainty. Actual results could differ from those estimates.
Cash and Cash Equivalents
The Company considers all highly liquid investments with a maturity of three months or less at the time of purchase to be cash equivalents. The Company invests its excess cash in money market accounts and overnight repurchase agreements. These investments are subject to minimal credit and market risks. At March 31, 2010 and
F-6
Table of Contents
SALARY.COM, INC. AND SUBSIDIARIES
NOTES TO THE CONSOLIDATED FINANCIAL STATEMENTS—(Continued)
2009, the Company has classified cash equivalents totaling approximately $7.0 million and $20.2 million, respectively. Due to the short-term nature of these securities, the carrying amount of these investments approximates fair market value.
Allowance for Doubtful Accounts
Accounts receivable are stated at the amount management expects to collect from customer accounts. Management reviews accounts receivable on a periodic basis to determine if any receivables will potentially be uncollectible. Estimates are used to determine the amount of the allowance for doubtful accounts necessary to reduce accounts receivable to its estimated net realizable value. These estimates are made by analyzing the status of significant past due receivables and by establishing general provisions for estimated losses by analyzing current and historical bad debt trends. Actual collection experience has not varied significantly from estimates, due primarily to credit and collection policies and the financial strength of the Company’s customers. Receivables that are ultimately deemed uncollectible are charged off as a reduction of receivables and the allowance for doubtful accounts. Accounts receivable balances are not collateralized.
Concentration of Credit Risk
Financial instruments that potentially subject the Company to significant concentration of credit risk consist primarily of cash and cash equivalents and accounts receivable. The company may invest in high-quality money market instruments, securities of the U.S. government and high quality corporate issues. At March 31, 2010 and 2009, the Company had cash balances at certain financial institutions in excess of federally insured limits. However, the Company does not believe that it is subject to unusual credit risk beyond the normal credit risk associated with commercial banking relationships. Accounts receivable are typically uncollateralized and are derived from revenues earned from customers primarily located in the United States.
Restricted Cash
Restricted cash consists of certificates of deposit totaling approximately $1.1 million as of March 31, 2010 and 2009. The certificates of deposit are held in the Company’s name with a major financial institution to collateralize the Company’s equipment leases.
Property and Equipment
Property and equipment are carried at cost and are depreciated over the estimated useful life, generally three years, using the straight-line method. Depreciation of leasehold improvements is recorded over the shorter of the estimated useful life of the leasehold improvement or the remaining lease term. Expenditures for maintenance and repairs are charged to operations when incurred, while additions and betterments are capitalized. When assets are retired or disposed, the asset’s original cost and related accumulated depreciation are eliminated from the accounts and any gain or loss is reflected in the statement of operations.
Business Combinations
The Company accounts for business acquisitions in accordance with ASC 805, “Business Combinations” (“ASC 805”), which requires that the purchase method of accounting be used for all business combinations. The Company determines and records the fair values of assets acquired and liabilities assumed as of the dates of acquisition.
F-7
Table of Contents
SALARY.COM, INC. AND SUBSIDIARIES
NOTES TO THE CONSOLIDATED FINANCIAL STATEMENTS—(Continued)
Valuation of Goodwill and Indefinite Lived Intangible Assets
The Company accounts for goodwill and indefinite lived intangible assets in accordance with ASC 350, “Intangibles—Goodwill and Other” (“ASC 350”). Under ASC 350, goodwill and indefinite lived intangible assets are not amortized, but instead are reviewed for impairment annually or more frequently if impairment indicators arise. The Company reviews the carrying value of its goodwill by comparing the carrying value of the related business component to its estimated fair value. The process of evaluating goodwill for impairment requires several judgments and assumptions to be made to determine the fair value of the reporting units, including the method used to determine fair value, discount rates, expected levels of cash flows, revenues and earnings, and the selection of comparable companies used to develop market based assumptions. Changes in the underlying business could affect these estimates, which in turn could affect the recoverability of goodwill. If goodwill becomes impaired, some or all of the goodwill could be written off as a charge to operations. During the fourth quarter of fiscal year ended March 31, 2010, the Company performed its annual impairment test in accordance with ASC 350 and determined that the carrying value of goodwill associated with the payroll/HRMS reporting unit was impaired. As a result, the Company recorded a goodwill impairment charge of approximately $2.1 million. See Note 5 for further information on the Company’s goodwill and annual impairment analysis.
Valuation of Long-Lived Assets
The Company assesses the recoverability of its long-lived assets that are held for use, such as property, plant and equipment and amortizable intangible assets in accordance with ASC 360, “Property, Plant and Equipment” (“ASC 360”) when events or changes in circumstances indicate that the carrying amount of an asset or asset group may not be recoverable. Recoverability of assets or an asset group to be held and used is measured by a comparison of the carrying amount of an asset or asset group to estimated undiscounted future cash flows expected to be generated by the asset or the asset group. Cash flow projections are based on trends of historical performance and management’s estimate of future performance. If the carrying amount of the asset or asset group exceeds the estimated future cash flows, an impairment charge is recognized by the amount by which the carrying amount of the asset or asset group exceeds its estimated fair value. During the fourth quarter of fiscal year ended March 31, 2010, the Company identified a triggering event under ASC 360 related to the long-lived assets of the HR/Payroll reporting unit. As a result of the factors described above, in accordance with ASC 360, the Company determined it was necessary to assess the recoverability of the reporting units long lived assets, primarily amortizable intangible assets. Based on the result of this assessment, the carrying value for each asset group level exceeded the undiscounted cash flows resulting in a non-cash impairment charge of approximately $3.5 million. See Note 5 for further information on the Company’s assessment of its long-lived assets.
Software Development Costs
The Company capitalizes certain internal software development costs under the provisions of ASC 350-40, “Internal Use Software” (“ASC 350-40”). ASC 350-40 requires computer software costs associated with internal use software to be charged to operations as incurred until certain capitalization criteria are met.
The Company incurs software development costs related to its applications developed for subscription services and for management information systems. Costs are incurred in three stages of development: the preliminary project stage, the application development stage, and the post-implementation stage. Costs incurred during the preliminary project stage and the post-implementation stage are expensed as incurred. Certain qualifying costs incurred during the application development stage are capitalized as property, equipment and software. These costs generally consist of internal labor during configuration, coding, and testing activities. Capitalization begins when the preliminary project stage is complete, management with the relevant authority authorizes and commits to the funding of the software project, it is probable that the project will be completed,
F-8
Table of Contents
SALARY.COM, INC. AND SUBSIDIARIES
NOTES TO THE CONSOLIDATED FINANCIAL STATEMENTS—(Continued)
the software will be used to perform the function intended and technical feasibility has been determined. These costs are amortized using the straight-line method over the estimated useful life of the software, which is generally three years. All other development costs are expensed as incurred.
Revenue Recognition
The Company derives its revenues primarily from subscription fees and, to a lesser extent, through advertising on its website and syndication fees. Subscription revenues are comprised primarily of subscription fees from enterprise and small business customers who pay a bundled fee for the Company’s on-demand software applications and data products and implementation services related to the Company’s subscription products, as well as syndication fees from the Company’s website partners and premium membership subscriptions sold primarily to individuals. To a lesser extent, subscription revenues also include fees for discrete professional services which are not bundled with the Company’s subscription products, revenues from sales of job competency models and related implementation and consulting services, revenues from sales of payroll perpetual licenses, maintenance and hosting services including related implementation and consulting services, and revenue from the sale of the Company’s Compensation Market Study and Salary.com Survey products, which are not sold on a subscription basis. These discrete professional services generally represent stand-alone compensation related to consulting and benchmarking of specific jobs. The Company follows the provisions of ASC 605-20, “Services” (“ASC 605-20”). Revenue is recognized when all of the following conditions are satisfied: (1) there is persuasive evidence of an arrangement; (2) the service has been provided to the customer; (3) the amount of fees to be paid by the customer is fixed or determinable; and (4) the collection of fees from the customer is probable.
Subscription revenue is recognized ratably over the contract period. Customers are generally billed for the subscription on an annual basis. For all customers, regardless of their billing method, subscription revenue is initially recorded as deferred revenue in the accompanying balance sheets. As services are performed, the Company recognizes subscription revenue over the applicable service period. For selected products where an implementation process occurs prior to the on-demand applications becoming useful to customers, revenue recognition is deferred until after the product has been implemented and then recognized as revenue ratably over the remaining applicable subscription period.
Subscription agreements that are related to the Company’s products may contain multiple service elements and deliverables. These elements include access to the Company’s on-demand software and often specify initial services including configuration and training. Unless the Company becomes the subject of a bankruptcy proceeding which is not dismissed within 60 days of filing or the Company makes an assignment for the benefit of its creditors, these particular subscription agreements do not provide customers the right to take possession of the software at any time. ASC 605-25, “Multiple-Element Arrangements” (“ASC 605-25”), was issued to address how companies should determine whether an arrangement involving multiple deliverables contains more than one unit of accounting. In applying the guidance in ASC 605-25, the Company determined that it does not have objective and reliable evidence for the fair value of subscription fees after delivery of specified initial services, consisting of configuration and training. The Company cannot establish the fair value of the subscription element of its contracts due to the variability of the sales price between different customers for the subscription element of the contract. Furthermore, the initial services do not have stand-alone value to the customer without being bundled with the subscription element of the contract because the Company does not sell the initial services separately and because such services are not provided by a third party. The Company therefore accounts for these subscriptions arrangements and its related service fees as a single unit of accounting.
F-9
Table of Contents
SALARY.COM, INC. AND SUBSIDIARIES
NOTES TO THE CONSOLIDATED FINANCIAL STATEMENTS—(Continued)
Revenues from the Company’s sales of job competency models and related implementation services may contain multiple service elements and deliverables. These elements include delivery of the job competency models, implementation services, consulting services and post contract customer support. The Company recognizes revenue for these transactions in accordance with ASC 605-25. Except for the post contract customer support services, the Company does not have objective and reliable evidence for the fair value of the deliverables in these types of transactions, primarily due to the variability of the sales price between different customers. Revenue from the sales of post contract customer support services is recognized ratably over the contract period, generally one year, upon delivery of the job competency models. The Company accounts for the job competency models, implementation services and consulting services as a single unit of accounting. Revenue from the sale of job competency models, implementation services and consulting services is recognized when all elements of the contract have been delivered.
Revenues from the Company’s payroll sales, including the sale of perpetual licenses and related post customer support, payroll hosting services and related implementation services, may contain multiple service elements and deliverables. These elements include delivery of the software, hosting services, implementation and consulting services and postcontract customer support (PCS).
Sales of perpetual licenses involve the sale of software and consequently fall under the guidance of ASC 985-605, “Software Revenue Recognition” (“ASC 985-605”), for revenue recognition. The Company licenses software under non-cancelable license agreements and provides services including implementation, consulting, training services and postcontract customer support (PCS). On certain arrangements, the Company has established vendor-specific objective evidence (VSOE) for postcontract customer support, using the substantive renewal rate method. For arrangements for which the Company has established VSOE, the Company allocates revenue using VSOE for the PCS and the residual method for the other elements and accounts for other elements as a single unit of accounting. Revenues from this single unit of accounting are recognized when (1) a non-cancelable license agreement has been signed by both parties, (2) the product has been shipped, (3) no significant vendor obligations remain and (4) collection of the related receivable is considered probable. To the extent any one of these four criteria is not satisfied, license revenue is deferred and not recognized in the consolidated statements of income until all such criteria are met. The revenue related to the postcontract customer support for which the Company has established VSOE is recognized ratably from the delivery date of the license through the contract period. If the Company is not able to establish VSOE on postcontract customer support, and postcontract customer support is the only undelivered element, then all revenue from the arrangement is recognized ratably over the contract period. However, if VSOE is not established but PCS has been delivered, then all revenue from the arrangement is recognized ratably over the contract period once the last element is delivered.
Subscription revenues generated from payroll hosting services are generally recognized in accordance with ASC 605-25 since the customer is purchasing the right to use the payroll software rather than licensing the software on a perpetual basis, except for situations where the customer has a contractual right to the software licenses. Arrangements where the customer is given the contractual right to the license are recognized in accordance with ASC 985-605. The Company does not currently have objective and reliable evidence for the fair value of the deliverables in either type of transaction, primarily due to the variability of the sales price between different customers. The elements that typically exist in hosting arrangements include the hosting services, software maintenance (i.e., product enhancements and customer support) and professional services (i.e., implementation services and training in the use of the software). The pricing for hosting services and the maintenance of the software is bundled and billed based using a per employee per month (“PEPM”) fee. Since the Company does not have objective and reliable evidence for the fair value of the aforementioned deliverables, we do not separate the undelivered elements and recognize revenue on a monthly basis as the services are performed, once the customer processes its first live payroll.
F-10
Table of Contents
SALARY.COM, INC. AND SUBSIDIARIES
NOTES TO THE CONSOLIDATED FINANCIAL STATEMENTS—(Continued)
Services revenues include revenues from fees charged for the implementation of the Company’s software products and training of customers in the use of such products, fees for other services, the provision of payroll- related forms and the printing of Forms W-2 for certain customers, as well as certain reimbursable out-of-pocket expenses. Revenues for implementation consulting and training services are recognized as services are performed to the extent the pricing for such services is on a time and materials basis. Other services are recognized as the product is shipped or as the services are rendered depending on the specific terms of the arrangement. Arrangement fees related to fixed-fee implementation services contracts are recognized using the percentage of completion accounting method, which involves the use of estimates. Percentage of completion is measured at each reporting date based on hours incurred to date compared to total estimated hours to complete. If a sufficient basis to measure the progress towards completion does not exist, revenue is recognized when the project is completed or when the Company receives final acceptance from the customer.
Discrete professional services represent a separate earnings process and revenue is recognized as services are performed. Professional services engagements are generally priced on a fixed-fee basis. Revenue under fixed-fee arrangements is recognized proportionally to the performance of the services utilizing milestones, if present in the arrangement, or at the completion of the project.
Revenues for the Company’s Compensation Market Study and Survey products, which are not sold on a subscription basis, are recognized only when persuasive evidence of an arrangement exists, delivery of the study or survey has occurred, risk of ownership has passed to the customer, the price is fixed and determinable, and collection is reasonably assured.
Advertising revenues are comprised of revenues that the Company generates through agreements to display third party advertising on the Company’s website for a fixed period of time or fixed number of impressions. Advertising revenues are recognized as the advertising is displayed on the website.
Cost of Revenues
Cost of revenues consists primarily of costs for data development and data acquisition, fees paid to the Company’s network provider for the hosting and managing of its servers, related bandwidth costs, costs related to sales of payroll-related forms, compensation and related personnel costs for the support and implementation of the Company’s products, costs to provide training to the Company’s customers and amortization of capitalized software costs.
Deferred Revenue
Deferred revenue primarily consists of billings to customers in advance of revenue recognition from the Company’s subscription service described above and is recognized as the revenue recognition criteria are met. Deferred revenue to be recognized in the succeeding 12-month period is included in current deferred revenue with the remaining amounts included in non-current deferred revenue. Deferred revenue does not include the unbilled portion of multi-year customer contracts, which is held off the balance sheet.
Fair Value of Financial Instruments
ASC 820, “Fair Value Measurements and Disclosures” (“ASC 820”), defines fair value and includes a framework for measuring fair value and disclosing fair value measurements in financial statements. Fair value is a market-based measurement rather than an entity-specific measurement and the fair value hierarchy makes a distinction between assumptions developed based on market data obtained from independent sources (observable inputs) and the reporting entity’s own assumptions (unobservable inputs). This fair value hierarchy gives the
F-11
Table of Contents
SALARY.COM, INC. AND SUBSIDIARIES
NOTES TO THE CONSOLIDATED FINANCIAL STATEMENTS—(Continued)
highest priority to quoted prices in active markets for identical assets or liabilities (Level 1) and the lowest priority to unobservable inputs (Level 3). The carrying value of the Company’s financial instruments, including cash, accounts receivable, accounts payable and accrued liabilities, including notes payable and revolving credit facility approximate their fair value because of their short-term nature.
Comprehensive Loss
ASC 220, “Comprehensive Income” (“ASC 220”), requires that changes in comprehensive loss be shown in a financial statement that is displayed with the same prominence as other financial statements. The Company has presented other comprehensive loss in the Consolidated Statements of Stockholders’ Equity (Deficit). Other comprehensive loss consists of the cumulative translation adjustment.
For Salary.com Limited and Salary.com Jamaica Limited, each of which operates in a local currency environment, assets and liabilities are translated at period-end exchange rates, and income statement items are translated at the average exchange rates for the period. The local currency for the foreign subsidiary is considered to be the functional currency and, accordingly, translation adjustments are reported as a separate component of stockholders’ equity under the caption “accumulated other comprehensive loss.”
Advertising Expenses
The Company expenses advertising as incurred. Advertising expense for the years ended March 31, 2010, 2009 and 2008 was approximately $51,000, $515,000 and $3,900, respectively.
Segment Data
The Company manages its operations on a consolidated, single segment basis for purposes of assessing performance and making operating decisions. Accordingly, the Company does not have reportable segments of its business.
Income Taxes
The Company recognizes deferred tax liabilities and assets for the expected future tax consequences of events that have been included in the financial statements or tax returns. Under this method, deferred tax liabilities and assets are determined based upon the temporary differences between the financial reporting and tax bases of liabilities and assets, using enacted tax rates in effect in the years in which the differences are expected to reverse. Realization of the Company’s net deferred tax assets is contingent upon generation of future taxable income. Due to the uncertainty of realization of the tax benefits, the Company has provided a valuation allowance of $23.4 million against its deferred tax assets.
ASC 740-10, “Income Taxes” (“ASC 740-10”), clarifies the accounting for uncertainty in income taxes by prescribing the minimum recognition threshold and measurement requirements a tax position must meet before recognized a benefit in the financial statements. ASC 740-10 also provides guidance on derecognition, measurement, classification, interest and penalties, accounting for interim periods and disclosures for uncertain tax positions. The Company’s adoption of ASC 740-10 on April 1, 2007 did not result in the recognition of a tax liability for any previously recognized tax benefits and did not have an effect on its financial position or results of operations as the Company had a full valuation allowance against its deferred tax assets.
Other Taxes
Non-income taxes such as sales tax are presented on a net basis.
F-12
Table of Contents
SALARY.COM, INC. AND SUBSIDIARIES
NOTES TO THE CONSOLIDATED FINANCIAL STATEMENTS—(Continued)
Net Loss per Share
Net loss per share is presented in accordance with ASC 260, “Earnings per Share” (“ASC 260”), which requires the presentation of “basic” earnings (loss) per share and “diluted” earnings (loss) per share. Basic net loss attributable to common stockholders per share is computed by dividing net loss attributable to common stockholders by the weighted average number of common shares outstanding for the period. Diluted net loss attributable to common stockholders per share includes the potential dilution that could occur if securities or other contracts to issue common stock were exercised or converted into common stock unless the effect is antidilutive.
The following summarizes the potential outstanding common stock of the Company as of the end of each period:
| March 31, | ||||||
| 2010 | 2009 | 2008 | ||||
| Options to purchase common stock |
1,265,307 | 1,886,042 | 1,645,699 | |||
| Warrants to purchase common |
35,527 | 53,612 | 56,985 | |||
| Restricted stock awards |
1,603,856 | 2,508,915 | 1,565,143 | |||
| Total options, warrants and restricted stock awards exercisable or convertible into common stock |
2,904,690 | 4,448,569 | 3,267,827 | |||
If the outstanding options and warrants were exercised or converted into common stock or the restricted stock awards were to vest, the result would be anti-dilutive. Therefore, basic and diluted net loss attributable to common stockholders per share is the same for all periods presented in the accompanying consolidated statements of operations.
As required by ASC 260, the Company adopted guidance in April 2009 which states that instruments granted in share-based payment transactions that met a certain criteria are considered to be participating securities prior to vesting and, therefore, need to be included in the earnings allocation in computing earnings per share under the two-class method described in ASC 260. The Company determined that the restricted stock outstanding that is related to the early exercise of stock options should be included in the computation of earnings per share. The following table sets forth the impact in earnings per share for the fiscal years ended March 31, 2010, 2009 and 2008, respectively:
| March 31, | ||||||||||||||||||||||||||||||
| 2010 | 2009 | 2008 | ||||||||||||||||||||||||||||
| Net Loss | Shares | Per Share Amount |
Net Loss | Shares | Per Share Amount |
Net Loss | Shares | Per Share Amount |
||||||||||||||||||||||
| Reported net loss per share—basic and diluted |
$ | (26,236 | ) | 15,957 | $ | (1.64 | ) | $ | (26,458 | ) | 15,297 | $ | (1.73 | ) | $ | (10,598 | ) | 13,792 | $ | (0.77 | ) | |||||||||
| Weighted-average restricted shares included in computation upon adoption |
— | 499 | 0.05 | — | 1,023 | 0.11 | — | 1,672 | 0.08 | |||||||||||||||||||||
| Adjusted net loss per share—basic and diluted |
$ | (26,236 | ) | 16,456 | $ | (1.59 | ) | $ | (26,458 | ) | 16,320 | $ | (1.62 | ) | $ | (10,598 | ) | 15,464 | $ | (0.69 | ) | |||||||||
F-13
Table of Contents
SALARY.COM, INC. AND SUBSIDIARIES
NOTES TO THE CONSOLIDATED FINANCIAL STATEMENTS—(Continued)
Stock-Based Compensation
The Company follows the provisions of ASC 718, “Stock Compensation” (“ASC 718”), which requires that all stock-based compensation be recognized as an expense in the financial statements over the vesting period and that such expense be measured at the fair value of the award.
The Company uses the Black-Scholes option pricing model for determining the estimated fair values of its stock option awards. The determination of the fair value of stock-based awards on the date of grant using an option pricing model is affected by the historical price of the Company’s stock as well as key assumptions including the expected life of the award, volatility over the term of the award and actual and projected exercise behaviors. For all share-based awards the Company has recognized stock compensation expense using a straight-line amortization method over the vesting period of the award. ASC 718 requires that stock-based compensation expense be based on awards that ultimately vest. Therefore, estimated stock-based compensation has been reduced for estimated forfeitures.
Funds Held for Customers and Customers Funds Obligations
Tax filing services provided to customers are being sold directly by the Company to its customers in conjunction with its HRMS/Payroll product. As part of this process, the Company receives funds from its customers and holds such funds for purposes of paying the appropriate taxing authorities on behalf of such customers. The Company holds customers’ tax filing deposits for the period between collection from the customer and remittance to the applicable taxing authority. These funds held for customers and the corresponding customer funds obligations are included in current assets and current liabilities, respectively, in the Company’s consolidated balance sheet as of March 31, 2010. The Company holds such funds in high quality money market accounts until payment is due and has reported the cash flows related to the funds received from customers in the investing activities section of the consolidated statement of cash flows for the year ended March 31, 2010. The Company has reported the cash flows related to the funds received and paid on behalf of such customers to the applicable taxing authorities in the financing activities section of the consolidated statement of cash flows for the year ended March 31, 2010.
Recent Accounting Pronouncements
In September 2009, the FASB issued Accounting Standards Update 2009-13, “Revenue Recognition (Topic 605)—Multiple Deliverable Revenue Arrangements” (“ASU 2009-13’), which addresses the accounting for multiple-deliverable arrangements to enable vendors to account for products or services (deliverables) separately rather than as a combined unit. The new guidance will be effective prospectively for revenue arrangements entered into or materially modified beginning in fiscal years on or after June 15, 2010. The Company expects this guidance may have a significant impact on the Company’s revenue recognition policy and financial statements, however, the Company has not determined the impact as of March 31, 2010.
In September 2009, the FASB issued Accounting Standards Update 2009-14, “Software (Topic 985)—Certain Revenue Arrangements That Include Software Elements” (“ASU 2009-14’), which addresses the accounting for revenue transactions involving software. ASU 2009-14 amends ASC 985-605 to exclude from its scope tangible products that contain both software and non-software components that function together to deliver a product’s essential functionality. The new guidance will be effective prospectively for revenue arrangements entered into or materially modified beginning in fiscal years on or after June 15, 2010. The Company expects this guidance may have a significant impact on the Company’s revenue recognition policy and financial statements, however, the Company has not determined the impact as of March 31, 2010.
F-14
Table of Contents
SALARY.COM, INC. AND SUBSIDIARIES
NOTES TO THE CONSOLIDATED FINANCIAL STATEMENTS—(Continued)
| 3. | ACQUISITION OF BUSINESSES |
Genesys Software Systems, Inc.
On December 17, 2008, the Company acquired all issued and outstanding shares of Genesys, a provider of on-demand and licensed human resources management systems and payroll solutions. Under the terms of the agreement, the Company paid the former owners of Genesys $6.0 million, net of cash acquired and converted approximately $1.1 million of options to purchase Genesys common stock into options to purchase approximately 519,492 shares of the Company’s common stock. In addition, the Genesys shareholders and option holders are eligible to earn additional consideration of up to $2.0 million which would be paid in cash or shares of the Company’s common stock, at the Company’s option, based on Genesys meeting certain performance targets during the eighteen months after the closing of the acquisition. As of March 31, 2010, the $2.0 million of additional consideration had been earned and recorded as goodwill. Such amounts were due to be settled in June 2010; however, the Company has filed an indemnification claim against the former owners of Genesys and is currently negotiating the settlement and payment of the contingent consideration. The purchase price allocated for financial accounting purposes was approximately $9.4 million, which includes $1.1 million of options to purchase the Company’s common stock and approximately $1.9 million of net liabilities assumed. Accordingly, the purchase price was allocated based upon the fair value of assets acquired and liabilities assumed. The Company allocated $4.1 million of the purchase price to goodwill based upon the estimated fair value of the assets acquired in the acquisition. Goodwill from the acquisition resulted from the Company’s belief that the products and services offered by Genesys will be complementary to the Company’s on-demand software suites. The results of operations include the impact of this acquisition since December 17, 2008. During fiscal 2010, the Company incurred impairment charges of approximately $5.6 million associated with the goodwill and intangible assets of Genesys. See Note 5 for further information on the Company’s goodwill and annual impairment analysis.
Salary.com Limited
On August 21, 2008, the Company acquired the share capital of Salary.com Limited. Salary.com Limited, located in the United Kingdom, is a provider of competency-based skills management software. Under the terms of the agreement, the Company paid the former owners of Salary.com Limited $5.2 million in cash. The former owners of Salary.com Limited will also be eligible to earn additional consideration based on meeting certain performance targets during each of the five twelve-month periods ending August 31, 2009, 2010, 2011, 2012 and 2013. The additional consideration, if earned, consists of cash payments of a maximum of $200,000 per year for five years, allocated proportionately amongst the employee owners. As of March 31, 2010, no additional consideration had been earned. The total cash paid for the acquisition was approximately $5.4 million, which includes approximately $0.2 million of direct acquisition costs plus approximately $1.3 million of net liabilities assumed. Accordingly, the purchase price was allocated based upon the fair value of assets acquired and liabilities assumed. The Company allocated $3.3 million of the purchase price to goodwill based upon the estimated fair value of the assets acquired in the acquisition. Goodwill from the acquisition resulted from the Company’s belief that the products and services offered by Salary.com Limited will be complementary to the Company’s existing competency business and on-demand software suites. The results of operations include the impact of this acquisition since August 21, 2008.
Schoonover Associates
On December 21, 2007, the Company acquired the assets of Schoonover Associates, Inc. (“Schoonover”). Schoonover is a provider of competency management data and consulting services with over 20 years of experience helping clients maximize their human capital. Under the terms of the agreement, the Company has paid the owner of Schoonover $4.4 million in cash of which $0.4 million reflects payments made by the
F-15
Table of Contents
SALARY.COM, INC. AND SUBSIDIARIES
NOTES TO THE CONSOLIDATED FINANCIAL STATEMENTS—(Continued)
Company in connection with a pre-existing license agreement by and between the parties. Schoonover will also be eligible to earn additional consideration based on meeting certain performance targets during the first five fiscal years beginning on April 1, 2008. The additional consideration, if earned, consists of cash payments of a maximum of $100,000 per year for 5 years and 112,646 shares of common stock valued at $1.5 million, which are eligible to vest ratably over such five-year period. Under the terms of the agreement, the number of shares issued was calculated as the $1.5 million of additional consideration divided by the average of the closing bid prices of the Company’s common stock as reported on the NASDAQ Global Market over the last ten trading days prior to the closing of the agreement. The total cost of the acquisition was approximately $4.4 million and as of March 31, 2010, 20% of the issued shares had vested and $200,000 of the additional consideration has been earned and recorded as compensation expense. Accordingly, the purchase price was allocated based upon the fair value of assets acquired and liabilities assumed. The Company allocated $2.6 million of the purchase price to goodwill based upon the estimated fair value of the assets acquired in the acquisition. Goodwill from the acquisition resulted from the Company’s belief that the products and services offered by Schoonover will be complementary to the Company’s existing competency business and on-demand software suites. The results of operations include the impact of this acquisition since December 21, 2007.
ITG Competency Group
On August 3, 2007, the Company acquired the assets of ITG Competency Group, LLC (“ITG”). ITG is a provider of off-the-shelf competency models and related implementation services used in a wide range of industries. Under the terms of the agreement, the Company has paid the owner of ITG $2.1 million in cash and shares of the Company’s common stock valued at $0.5 million. ITG was also eligible to earn up to $1.0 million in additional consideration based on meeting certain performance targets during the first two years after the closing of the acquisition, and can earn additional consideration if these targets are exceeded. The additional consideration, if earned, will be paid 50% in cash and 50% in common stock. As of March 31, 2010, approximately $1.1 million of the additional consideration has been earned and recorded as additional goodwill. Of the additional consideration earned, $0.9 million was paid to the owner of ITG in cash and shares during fiscal 2009, an additional $0.1 million was paid in cash along with $0.1 million in stock in fiscal 2010. The total cost of the acquisition was approximately $3.0 million. Accordingly, the purchase price was allocated based upon the fair value of assets acquired and liabilities assumed. The Company allocated $1.4 million of the purchase price to goodwill based upon the estimated fair value of the assets acquired in the acquisition and the value of the contingent consideration earned. Goodwill from the acquisition resulted from the Company’s belief that the products developed by ITG will be complementary to the Company’s on-demand software suites. The results of operations include the impact of this acquisition since August 3, 2007.
ICR
On May 15, 2007, the Company acquired all of the membership interests of ICR Limited, L.C. and all of the outstanding share capital of ICR International Ltd. (collectively, “ICR”), a leading provider of industry-specific market intelligence for employee pay and benefits for the global technology and specialty consumer goods markets. Pursuant to the terms of the purchase agreements, the Company paid $10.3 million to the owners of ICR.The total cost of the acquisition, including legal fees of $20,000, was approximately $10.3 million. Accordingly, the purchase price was allocated based upon the fair value of assets acquired and liabilities assumed. The Company allocated $5.8 million of the purchase price to goodwill based upon the estimated fair value of the assets acquired in the acquisition. Goodwill from the acquisition resulted from the Company’s belief that the products developed by ICR will be complementary to the Company’s on-demand software suites. The results of operations include the impact of this acquisition since May 15, 2007.
F-16
Table of Contents
SALARY.COM, INC. AND SUBSIDIARIES
NOTES TO THE CONSOLIDATED FINANCIAL STATEMENTS—(Continued)
| 4. | PROPERTY, EQUIPMENT AND SOFTWARE |
Property, equipment and software at March 31, 2010 and 2009 consisted of the following:
| (in thousands) | ||||||
| 2010 | 2009 | |||||
| Computer equipment and software |
$ | 4,799 | $ | 4,478 | ||
| Office equipment |
450 | 592 | ||||
| Furniture and fixtures |
583 | 727 | ||||
| Capitalized software development costs |
1,613 | 1,335 | ||||
| Leasehold Improvements |
663 | 865 | ||||
| 8,108 | 7,997 | |||||
| Less: accumulated depreciation |
6,014 | 4,972 | ||||
| Property, equipment and software, net |
$ | 2,094 | $ | 3,025 | ||
Depreciation expense for the years ended March 31, 2010, 2009, and 2008 was approximately $1.4 million, $1.1 million, and $0.8 million, respectively.
During the years ended March 31, 2010, 2009 and 2008, the Company capitalized approximately $277,000, $153,000 and $390,000, respectively, of costs of computer software developed or obtained for internal use. These costs are being amortized to cost of revenues on a straight-line basis over their estimated useful life of three years. Amortization expense related to capitalized software development costs amounted to approximately $258,000, $274,000, and $169,000 during the years ended March 31, 2010, 2009, and 2008, respectively.
| 5. | GOODWILL AND OTHER INTANGIBLE ASSETS |
Goodwill and intangible assets as of March 31, 2010 and 2009 consist of the following:
| (in thousands) | ||||||||||||||||||
| March 31, 2010 | March 31, 2009 | |||||||||||||||||
| Cost | Accumulated Amortization |
Carrying Amount |
Cost | Accumulated Amortization |
Carrying Amount | |||||||||||||
| Amortizable intangible assets: |
||||||||||||||||||
| Non-compete agreements (5 years) |
$ | 1,836 | $ | 1,432 | $ | 404 | $ | 1,826 | $ | 898 | $ | 928 | ||||||
| Customer relationships (5-7 years) |
8,391 | 3,703 | 4,688 | 9,059 | 2,090 | 6,969 | ||||||||||||
| Developed technology (5-7 years) |
3,184 | 1,143 | 2,041 | 5,094 | 297 | 4,797 | ||||||||||||
| Other intangible assets (5-18 years) |
368 | 207 | 161 | 326 | 164 | 162 | ||||||||||||
| Trade name (5 years) |
927 | 285 | 642 | 750 | 43 | 707 | ||||||||||||
| Data acquisition costs (1-3 years) |
4,683 | 3,494 | 1,189 | 4,643 | 2,094 | 2,549 | ||||||||||||
| Total amortizable intangible assets |
19,389 | $ | 10,264 | 9,125 | 21,698 | $ | 5,586 | 16,112 | ||||||||||
| Unamortizable intangible assets: |
||||||||||||||||||
| Goodwill |
14,967 | 14,967 | 14,734 | 14,734 | ||||||||||||||
| Other indefinite lived intangible assets |
935 | 935 | 1,504 | 1,504 | ||||||||||||||
| Total goodwill and other indefinite lived intangible assets |
15,902 | 15,902 | 16,238 | 16,238 | ||||||||||||||
| Total intangible assets |
$ | 35,291 | $ | 25,027 | $ | 37,936 | $ | 32,350 | ||||||||||
F-17
Table of Contents
SALARY.COM, INC. AND SUBSIDIARIES
NOTES TO THE CONSOLIDATED FINANCIAL STATEMENTS—(Continued)
The Company’s indefinite-lived acquired intangible assets consist of trade names and domain names. All of the Company’s finite-lived acquired intangible assets are subject to amortization over their estimated useful lives. No residual value is estimated for these intangible assets. Acquired intangible asset amortization for the fiscal years ended March 31, 2010 and 2009 was approximately $4.7 million and $3.6 million, respectively, of which $1.7 million and $1.6 million, respectively, is included in cost of revenues. Amortization for the data acquisition costs begins once the acquired data is integrated into the related product and that product is available to the Company’s customers.
Estimated annual amortization expense for the next five years related to intangible assets is as follows:
| (in thousands) | |||
| Year ending March 31, | |||
| 2011 |
$ | 3,246 | |
| 2012 |
2,266 | ||
| 2013 |
1,374 | ||
| 2014 |
890 | ||
| 2015 |
767 | ||
The changes in the carrying amount of goodwill for the year ended March 31, 2010 are as follows:
| (in thousands) | ||||
| Balance as of March 31, 2009 |
$ | 14,734 | ||
| Increase to goodwill from contingent consideration earned or paid |
2,132 | |||
| Goodwill impairment |
(2,054 | ) | ||
| Effects of foreign currencies |
155 | |||
| Balance as of March 31, 2010 |
$ | 14,967 | ||
For intangible assets, the Company assesses the carrying value of these assets whenever events or circumstances indicate that the carrying value may not be recoverable. Recoverability of assets to be held and used is measured by comparing the carrying amount of an asset, or asset group, to the future undiscounted cash flows expected to be generated by the asset, or asset group.
In February 2010, as a result of the Company’s strategic realignment subsequent to the resignation of its Chief Executive Officer, the Company identified a triggering event under ASC 360 related to the long-lived assets of the payroll/HRMS reporting unit. This event led the Company to revise its expectations of future invoicing, revenues and operating profit margins for the payroll/HRMS reporting unit. As a result of the factors described above, in accordance with ASC 360, the Company determined it was necessary to assess the recoverability of the reporting units long lived assets, primarily amortizable intangible assets.
As required by ASC 360, the Company, with the assistance of a third-party independent appraiser, performed its assessment at the asset group level which represented the lowest level of cash flows that are largely independent of cash flows of other assets and liabilities. The Company used an income approach to determine if the sum of the undiscounted cash flows expected to result from the use and eventual disposition of the assets exceeded the carrying values of those assets. As a result of this assessment, the carrying value for the asset group level exceeded the undiscounted cash flows. Accordingly, the Company then utilized a relief from royalty method and an excess earnings income approach in order to determine fair value of its amortizable intangible assets in order to compare to the carrying values of those assets. This analysis resulted in non-cash impairment charges of $2.3 million to developed technology, $0.8 million to customer relationships and $0.4 million to trade names recorded in the fourth quarter of fiscal 2010.
F-18
Table of Contents
SALARY.COM, INC. AND SUBSIDIARIES
NOTES TO THE CONSOLIDATED FINANCIAL STATEMENTS—(Continued)
These methods require several judgments and assumptions to be made to determine the fair value of the assets, including royalty rates, discount rates and expected levels of cash flows, earnings and revenues. The Company used royalty rates ranging from 1.5% to 10% based on independent research of comparable royalty agreements. Consistent with the Company’s projections of revenue and operating expenses used to assess goodwill, its estimates were based on current market and economic conditions and its historical and expected knowledge of the reporting unit and its intangible assets. The discounted cash flows used to estimate the assets’ fair value was based on assumptions regarding the assets’ estimated projected future tax affected relief from royalty and estimated weighted-average cost of capital that a market participant would use in evaluating the intangible assets in a purchase transaction. The estimated weighted-average cost of capital was based on the risk-free interest rate and other factors such as equity risk premiums and the ratio of total debt to equity capital. The rate used to discount the estimated future cash flows for the payroll/HRMS reporting unit’s amortizable intangible assets was approximately 29%. The failure of the reporting unit, or intangible assets, to execute as forecasted could have an adverse affect on the Company’s impairment test. Future adverse changes in market conditions or poor operating results could result in losses or an inability to recover the carrying value of the respective intangible asset, thereby possibly requiring additional impairment charges in the future.
As of March 31, 2010, the Company had two reporting units, the Salary.com reporting unit and the payroll/HRMS reporting unit which had goodwill balances of approximately $12.9 million and $4.1 million, respectively, prior to the Company’s annual impairment analysis. The Company performed its annual goodwill impairment assessment as of March 31, 2010 using the two-step process required by ASC 350. The Company used a combination of an income approach and a market approach to determine the fair value of the reporting units. The Company then performed “Step 1” and compared the weighted average fair value of the each reporting unit of accounting to its carrying value as of March 31, 2010 which resulted in the carrying value of the payroll/HRMS reporting unit exceeding its fair value. The Salary.com reporting unit’s fair value significantly exceeded its carrying value as of March 31, 2010.
Accordingly, the Company performed “Step 2” only in relation to the payroll/HRMS reporting unit. The second step determines the implied fair value of goodwill by comparing the fair value of the payroll/HRMS reporting unit to the aggregate fair value of all the assets and liabilities of this reporting unit. In “Step 2” of the impairment analysis, the Company compared the implied fair value of goodwill in the payroll/HRMS reporting unit to its carrying value. The Company determined the implied fair value of goodwill was approximately $2.0 million. As a result, the Company recorded a non-cash impairment charge to goodwill of approximately $2.1 million.
The process of evaluating goodwill for impairment requires several judgments and assumptions to be made to determine the fair value of the reporting unit, including the method used to determine fair value, discount rates, expected levels of cash flows, revenues and earnings, and the selection of comparable companies used to develop market based assumptions. The Company employed an eight year discounted cash flow methodology to arrive at the fair value of the payroll/HRMS reporting unit. In calculating the reporting unit’s fair value, the Company derived the projected eight year cash flows for the reporting unit. This process starts with the projected cash flows of the reporting unit and then the cash flows are discounted to present value. The Company also employed a guideline company method which indicates value for the reporting unit by comparison to similar publicly traded companies. The Company identified a set of comparable companies to derive market multiples for the latest twelve months and next fiscal year revenue. The revenue multiples for the reporting unit were based on size, profitability, and comparability of the reporting unit’s products and services relative to those of the selected guideline companies. From the enterprise values determined using these revenue multiples, a control premium of 10% was applied in order to estimate the equity value of the payroll/HRMS reporting unit. Since the
F-19
Table of Contents
SALARY.COM, INC. AND SUBSIDIARIES
NOTES TO THE CONSOLIDATED FINANCIAL STATEMENTS—(Continued)
data underlying the guideline company analysis was based on indications of the value on a minority interest basis, the Company applied the control premium which was based on the analysis of control premiums with the entity’s industry.
The discounted cash flows used to estimate the reporting unit’s fair value was based on assumptions regarding the reporting unit’s estimated projected future cash flows and estimated weighted-average cost of capital that a market participant would use in evaluating the payroll/HRMS reporting unit in a purchase transaction. The estimated weighted-average cost of capital was based on the risk-free interest rate and other factors such as equity risk premiums and the ratio of total debt to equity capital. The rate used to discount the estimated future cash flows for the payroll/HRMS reporting unit was approximately 29%.
The Company’s projections for the next eight years included revenue and operating expenses, in line with its expectations over the period based on current market and economic conditions and its historical and expected knowledge of the reporting unit. The failure of the reporting unit to execute as forecasted could have an adverse affect on the Company’s impairment test. Future adverse changes in market conditions or poor operating results of the reporting unit could result in losses or an inability to recover the carrying value of the investments in the reporting unit, thereby possibly requiring additional impairment charges in the future.
| 6. | REVOLVING CREDIT FACILITY |
On August 8, 2008, the Company entered into a modification of its existing credit facility with Silicon Valley Bank to modify certain of the financial covenants and extend the term of the agreement to September 23, 2008. On September 17, 2008, the Company entered into a second modification of its credit facility to extend the term of the agreement to October 8, 2008. On October 8, 2008, the Company entered into a third modification of its credit facility to extend the term of this credit facility for two years to October 8, 2010 and increased the line of credit from $5.0 million to $10.0 million. On March 16, 2009, the Company entered into a fourth modification of its agreement, which added Genesys as a guarantor to the Company’s obligations under the credit facility. On June 29, 2009, the Company entered into a fifth modification to its agreement which increased the interest rate and certain fees payable, amended certain financial covenants, and increased the amount of stock the Company can repurchase under its repurchase plans. On October 15, 2009, the Company entered into a sixth modification to its agreement decreasing the line of credit to $5.0 million, modifying the interest rate and amending certain financial covenants. Following the sixth modification, up to $5.0 million is available under this credit facility and the facility is collateralized by substantially all of the Company’s assets and expires on October 8, 2010. The line of credit may be used to secure letters of credit and cash management services and the line of credit may be used in connection with foreign exchange forward contracts. The line of credit is subject to a financial covenant that requires the Company to maintain a ratio of assets to liabilities (net of deferred revenue) that is not less than 1.4 to 1. As of March 31, 2010, there was $2.5 million outstanding under the credit facility with a 4.5% interest rate. As of this date, the Company was not in compliance with its debt covenant; however, the Company had sufficient available cash to pay in full the outstanding amounts due on the facility without material consequence to the Company. The Company has received a waiver from Silicon Valley Bank for the months of March, April and May 2010 and is currently negotiating an amendment to its existing credit facility. The Company anticipates that the amendment will be completed during the second quarter of fiscal 2011 and that the Company would be in compliance with the covenants of such arrangement.
F-20
Table of Contents
SALARY.COM, INC. AND SUBSIDIARIES
NOTES TO THE CONSOLIDATED FINANCIAL STATEMENTS—(Continued)
| 7. | COMMITMENTS AND CONTINGENCIES |
The Company has various non-cancelable operating leases, primarily related to real estate, that expire through 2015. Total rent expense charged to operations was approximately $1.8 million, $2.1 million, and $1.3 million for the fiscal years ended March 31, 2010, 2009 and 2008, respectively.
Future minimum lease payments under noncancelable operating leases at March 31, 2010 are as follows:
| (in thousands) | |||
| 2011 |
$ | 1,968 | |
| 2012 |
543 | ||
| 2013 |
490 | ||
| 2014 |
444 | ||
| 2015 |
272 | ||
| Thereafter |
— | ||
| Total future minimum lease payments |
$ | 3,717 | |
Vendor Financing Agreement
In June 2008, the Company entered into an agreement with a vendor to finance the purchase of perpetual software licenses in the amount of approximately $738,000. The Company is required to make quarterly payments of approximately $64,000 for a term of 36 months.
Equipment Leaseline
On April 17, 2008, the Company entered into a leaseline agreement (Leaseline #4) with a maximum available commitment of $350,000. The lease term began on July 1, 2008 and runs for a term of 36 months. As of March 31, 2010, the Company had leased approximately $173,000 of equipment under the terms of this leaseline. On July 24, 2008, the Company entered into a leaseline agreement (Leaseline #5) with a maximum available commitment of $200,000. The lease term began on October 1, 2008 and runs for a term of 36 months. As of March 31, 2010, the Company had not leased any equipment under the terms of this leaseline. As of March 31, 2010, the Company had approximately $1.1 million in a restricted cash account as collateral for equipment leased under the Company’s five leaselines with a value of approximately $1.1 million in accordance with all of its master lease agreements.
Employment Agreements
Certain members of the Company’s management have employment agreements that provide for the continuation of salary and benefits, for a period of time, upon ceasing to be an employee as a result of either termination from or a change in ownership of the Company.
Litigation and Claims
On December 29, 2006, the Company commenced a declaratory judgment action in the Superior Court of Suffolk County, Massachusetts against a former independent consultant to the Company. The action related to a dispute between the Company and the former consultant over a contract which expired by its terms in November 2000. Pursuant to that contract, the former consultant was entitled to a success fee consisting of a right to purchase 33,600 shares of the Company’s common stock at a price of thirty-six cents per share. On August 23,
F-21
Table of Contents
SALARY.COM, INC. AND SUBSIDIARIES
NOTES TO THE CONSOLIDATED FINANCIAL STATEMENTS—(Continued)
2007, the Company entered into a settlement agreement with the former consultant. Pursuant to the settlement agreement, the Company and the former consultant exchanged mutual releases and the Company agreed to dismiss the pending court action. As part of the settlement, the Company permitted the former consultant to exercise and sell his options to purchase 33,600 shares of Salary.com common stock and to forego the $12,000 exercise cost. The Company also paid the former consultant $250,000 and issued 18,000 shares of Salary.com common stock, valued at approximately $225,000 to an affiliate of the former consultant.
On February 1, 2007, Mercer (US) Inc. (formerly Mercer Human Resource Consulting, Inc.) (“Mercer”) filed a Complaint against the Company in the United States District Court for the Southern District of New York relating to, among other things, the Company’s use of Mercer’s products and data. The Company filed several counterclaims against Mercer in the New York action, and filed a separate action against Mercer in the United States District Court for the District of Massachusetts on May 15, 2007, relating to, among other things, Mercer’s use of the Company’s products and data. On September 27, 2007, the Company entered into a Settlement Agreement with Mercer under which the Company and Mercer settled all ongoing litigation and exchanged mutual releases. No payments were made by either party under the settlement agreement. Both the action filed by Mercer against the Company in New York and the action filed by the Company against Mercer in Massachusetts were dismissed. As part of the settlement agreement, Mercer confirmed that customers which have purchased compensation surveys from Mercer have the right to use the Company’s Survey Center product to load and manage their Mercer surveys, as well as other third party surveys.
In December 2009, the Company lost a significant, but not material, payroll customer as a result of a breach of contract by the customer. As a result of the breach, the Company terminated its agreement with the customer and had commenced litigation procedures in order to recover certain amounts billed to the customer and uncollected as well as termination penalties. On May 5, 2010, the parties executed a Mutual Release and Settlement Agreement which both parties agreed to fully and finally settle and resolve the aforementioned litigation and disputes. As part of the settlement agreement and ancillary agreements, the payroll customer made a $1.2 million payment to the Company on May 12, 2010 related to outstanding billings, associated with the previously terminated contract, and future license and maintenance agreements.
In addition to the matters noted above, from time to time the Company is subject to legal proceedings and claims in the ordinary course of business. In the opinion of management, the amount of ultimate expense with respect to any other current legal proceedings and claims will not have a material adverse effect on the Company’s financial position or results of operations.
| 8. | COMMON STOCK |
Authorized Shares and Activity
At March 31, 2010, the Company had authorized 100,000,000 shares of common stock and 5,000,000 of preferred stock. An aggregate of 5,697,802 shares were reserved for the future issuance of common stock related to the vesting of restricted stock awards, the employee stock purchase plan and the exercise of options and warrants at March 31, 2010.
F-22
Table of Contents
SALARY.COM, INC. AND SUBSIDIARIES
NOTES TO THE CONSOLIDATED FINANCIAL STATEMENTS—(Continued)
| 9. | STOCK-BASED COMPENSATION AND STOCK INCENTIVE PLANS |
Stock-based compensation includes expense charges for all stock-based awards to employees and directors. Such awards include option grants, restricted stock awards and shares expected to be purchased under an employee stock purchase plan. The estimated fair value of the Company’s stock-based awards, less expected forfeitures, is amortized over the awards’ vesting period on a straight line basis. Stock-based compensation by award type for the years ended March 31, 2010, 2009 and 2008 was as follows:
| (in thousands) | |||||||||
| Year Ended March 31, | |||||||||
| 2010 | 2009 | 2008 | |||||||
| Stock-based compensation expense by award type: |
|||||||||
| Stock options |
$ | 881 | $ | 1,803 | $ | 2,312 | |||
| Restricted stock awards |
5,687 | 7,832 | 2,765 | ||||||
| Employee stock purchase plan |
77 | 127 | 52 | ||||||
| Total stock-based compensation |
$ | 6,645 | $ | 9,762 | $ | 5,129 | |||
Stock-based compensation by line item in the statement of operations for the years ended March 31, 2010, 2009 and 2008 was as follows:
| (in thousands) | |||||||||
| Years ended March 31, | |||||||||
| 2010 | 2009 | 2008 | |||||||
| Cost of revenues |
$ | 783 | $ | 1,255 | $ | 800 | |||
| Research and development |
1,063 | 1,376 | 459 | ||||||
| Sales and marketing |
2,098 | 2,702 | 1,778 | ||||||
| General and administrative |
2,072 | 2,616 | 2,092 | ||||||
| Restructuring charges |
629 | 1,813 | — | ||||||
| $ | 6,645 | $ | 9,762 | $ | 5,129 | ||||
The Company uses the Black-Scholes option-pricing model to value option grants and determine the related compensation expense. The assumptions used in calculating the fair value of stock-based payment awards represent management’s best estimates. The Company did not grant any new stock options during the fiscal years ended March 31, 2010 and 2009; however, previously granted stock option awards were modified in connection with its workforce reduction on January 7, 2009 and the resignation of the Company’s Chief Executive Officer on February 20, 2010. The modification of the awards consisted of acceleration of the respective awards’ vesting schedule. For awards granted in fiscal year ended March 31, 2008, the Company estimated expected volatility based on that of the Company’s publicly-traded peer companies. Management believed that the historical volatility of the Company’s stock price did not best represent the expected volatility of the stock price. Prior to the Company’s initial public offering in February 2007, the Company was a private company and therefore lacked company-specific historical and implied volatility information. For the modified awards issued during the years ended March 31, 2010 and 2009, the Company determined it has adequate historical data from its traded share price, as such, expected volatilities utilized in the model are based on the historic volatility of the Company’s stock price.
The risk-free interest rate used for each grant is equal to the U.S. Treasury yield curve in effect at the time of grant for instruments with a similar expected life.
F-23
Table of Contents
SALARY.COM, INC. AND SUBSIDIARIES
NOTES TO THE CONSOLIDATED FINANCIAL STATEMENTS—(Continued)
The expected term of the options granted was determined based upon review of the period that the Company’s share-based awards are expected to be outstanding and is estimated based on historical experience of similar awards, giving consideration to the contractual term of the awards, vesting schedules and expectations of employee exercise behavior.
In accordance with the provisions of ASC Topic 718, the Company recognizes compensation expense for only the portion of options that are expected to vest. Therefore, the Company has estimated expected forfeitures of stock options with the adoption of ASC Topic 718. In developing a forfeiture rate estimate, the Company considered its historical experience and its growing employee base. If the actual number of forfeitures differs from those estimated by management, additional adjustments to compensation expense may be required in future periods.
The following table provides the assumptions used in determining the fair value of the share-based awards for the years ended March 31, 2010, 2009 and 2008, respectively:
| Year Ended March 31, 2010 |
Year Ended March 31, 2009 |
Year Ended March 31, 2008 |
|||||||
| Risk-Free Rate |
1.36 | % | 1.66 | % | 4.51 - 4.96 | % | |||
| Expected Life |
0.25 years | 0.25 years | 5 years | ||||||
| Expected Volatility |
49.15 | % | 146.40 | % | 56.10 - 61.03 | % | |||
| Expected Dividend Yield |
0 | % | 0 | % | 0 | % |
Stock Options
Under the 2000 Stock Option and Incentive Plan (the “2000 Plan”), the Company may grant up to 672,000 incentive stock options and nonqualified stock options. In April 2002, the Company’s Board of Directors approved an increase in the number of options available for grant under the 2000 Plan to the higher of 1,344,000 or 30% of the fully diluted outstanding common shares. Under the 2004 Stock Option and Incentive Plan (the “2004 Plan”), the Company may grant stock options for up to 37.5% of the fully diluted outstanding common shares to a maximum of 2,800,000 options.
On January 12, 2007, the Company’s Board of Directors and stockholders approved the adoption of the 2007 Stock Option and Incentive Plan (the “2007 Plan”) under which the maximum number of shares of common stock that may be issued is the sum total of 3,000,000 shares plus all stock option awards or grants returned to the “2000 Plan” and the “2004 Plan” as a result of expiration or cancellation or termination of such stock option awards. The maximum contractual term of stock options granted under the 2007 Plan may range from five to ten years from the date of grant.
On September 18, 2008, the Company’s stockholders approved an amendment to the 2007 Plan to increase the number of shares of the Company’s common stock authorized for issuance under such plan from 3,000,000 shares to 5,800,000 shares.
Under the 2000 Plan and 2004 Plan, option recipients (“Option Holders”) are permitted to exercise options in advance of vesting. Any options exercised in advance of vesting result in the Option Holder receiving Restricted Stock, which is then subject to vesting under the respective option’s vesting schedule. Restricted Stock is subject to a right of repurchase by the Company from any Option Holder who is an employee who leaves the Company (either voluntarily or involuntarily), the Company has the right (but not the obligation) to repurchase the Restricted Stock at the original price paid by the Option Holder at the time the options were exercised.
F-24
Table of Contents
SALARY.COM, INC. AND SUBSIDIARIES
NOTES TO THE CONSOLIDATED FINANCIAL STATEMENTS—(Continued)
Because the Company has the right to repurchase the Restricted Stock upon the cessation of employment, the Company has recognized this potential liability for repurchase on the balance sheet within “Accrued expenses and other current liabilities.” Upon vesting of the restricted shares, the Subscription Payable is relieved and recorded in equity. As of March 31, 2010 and 2009, there were 370,075 and 683,341 restricted shares outstanding, respectively, which resulted from the exercise of unvested stock options.
Stock option activity, under all plans, during the year ended March 31, 2010 was as follows:
| Number of Options |
Weighted Average Exercise Price | |||||
| Outstanding—beginning of year |
1,886,042 | $ | 5.400 | |||
| Granted |
— | — | ||||
| Exercised |
(362,282 | ) | 0.713 | |||
| Canceled |
(258,453 | ) | 7.150 | |||
| Outstanding—end of year |
1,265,307 | $ | 6.390 | |||
| Exercisable—end of year |
1,090,939 | $ | 6.720 | |||
The weighted average grant date fair value of options granted during fiscal year 2008 was $6.089. The total intrinsic value of options exercised during the year ended March 31, 2010, was approximately $719,000.
The following table summarizes information about stock options outstanding at March 31, 2010:
| Options Outstanding | Options Vested and Currently Exercisable | |||||||||||
| Exercise Price |
Number of Options |
Weighted Average Remaining Contractual Life (Years) |
Weighted Average Exercise Price (Per Share) |
Number of Options |
Weighted Average Exercise Price (Per Share) | |||||||
| $0.223—$1.115 |
384,711 | 6.7 | $ | 0.431 | 313,006 | $ | 0.479 | |||||
| $6.607—$8.214 |
381,237 | 6.7 | 7.120 | 289,416 | 7.170 | |||||||
| $10.500—$13.310 |
499,359 | 6.8 | 10.440 | 488,517 | 10.451 | |||||||
| 1,265,307 | 6.8 | $ | 6.393 | 1,090,939 | $ | 6.720 | ||||||
As of March 31, 2010, there was approximately $0.9 million of total unrecognized compensation expense related to stock options. That cost is expected to be recognized over a weighted average period of 3.3 years.
During March 2006, the Company offered certain holders of stock options, totaling 143 employees, the limited opportunity to receive a cash bonus to exercise all of their outstanding stock options. As part of this offer, unvested stock options could be exercised into restricted stock. This offer was accounted for as a modification under ASC Topic 718. The additional compensation expense for the modification was deemed immaterial to the Company’s financial statements. There are 370,075 and 683,341 shares of common stock subject to restriction as of March 31, 2010 and 2009 related to this offer.
On January 7, 2009, the Company implemented and completed a workforce reduction of approximately 100 employees, representing approximately sixteen percent (16%) of the Company’s workforce. In connection with the workforce reduction, the Company accelerated the vesting of 180,651 stock options and 216,759 restricted stock awards held by terminated employees. The Company recognized a non-cash compensation charge of approximately $1.8 million in the quarter ended March 31, 2009 as a result of this acceleration.
F-25
Table of Contents
SALARY.COM, INC. AND SUBSIDIARIES
NOTES TO THE CONSOLIDATED FINANCIAL STATEMENTS—(Continued)
On February 20, 2010, the Company’s President and Chief Executive Officer resigned from his positions at the Company. As a result of the resignation, the Company accelerated the vesting of all outstanding stock options, restricted stock unit awards and any other equity awards held by former executive. The Company recognized a non-cash compensation charge of approximately $0.6 million in the quarter ended March 31, 2010 as a result of this acceleration.
Restricted Stock Awards
On January 12, 2007, the Compensation Committee of the Board of Directors of the Company approved a form of restricted stock agreement for use under the Company’s 2007 Stock Plan pursuant to which the Company has granted stock options and restricted stock awards. The shares of restricted stock awards have a per share price of $0.0001 which equals the par value. The fair value is measured based upon the closing NASDAQ market price of the underlying Company stock as of the date of grant. Compensation expense from the restricted stock awards is amortized over the applicable vesting period, generally 3 years, using the straight-line method. Unamortized compensation cost related to restricted stock awards was $4.5 million as of March 31, 2010. This cost is expected to be recognized over a weighted-average period of 1.4 years. The following table presents a summary of the restricted stock award activity for the year ended March 31, 2010:
| Number of Awards |
Weighted Average Grant Date Fair Value | |||||
| Unvested balance—beginning of year |
2,508,915 | $ | 5.480 | |||
| Awarded |
1,100,482 | 2.822 | ||||
| Vested |
(1,662,827 | ) | 4.931 | |||
| Canceled |
(342,714 | ) | 4.140 | |||
| Unvested balance—end of year |
1,603,856 | $ | 4.506 | |||
Shares Available for Grant
The following is a summary of all stock option and restricted stock award activity and shares available for grant under the 2007 Plan and for years ended March 31, 2010 and 2009.
| Year Ended March 31, 2010 |
Year Ended March 31, 2009 |
|||||
| Balance—beginning of period |
2,483,409 | 1,567,183 | ||||
| Increase in shares available |
— | 2,800,000 | ||||
| Restricted stock awards granted |
(1,100,482 | ) | (3,012,306 | ) | ||
| Stock options cancelled/forfeited |
369,904 | 420,199 | ||||
| Restricted stock awards cancelled/forfeited |
342,714 | 708,333 | ||||
| Balance—end of period |
2,095,545 | 2,483,409 | ||||
F-26
Table of Contents
SALARY.COM, INC. AND SUBSIDIARIES
NOTES TO THE CONSOLIDATED FINANCIAL STATEMENTS—(Continued)
Distribution and Dilutive Effect of Options and Restricted Shares
| Year Ended March 31, 2010 |
Year Ended March 31, 2009 |
|||||
| Shares of common stock outstanding |
16,705,853 | 16,104,454 | ||||
| Restricted stock awards granted (3) |
1,100,482 | 3,012,306 | ||||
| Stock options cancelled/forfeited |
(369,904 | ) | (420,199 | ) | ||
| Restricted stock awards cancelled/forfeited |
(342,714 | ) | (708,333 | ) | ||
| Net options/restricted stock granted |
387,864 | 1,883,774 | ||||
| Grant dilution (1) |
2.3 | % | 11.7 | % | ||
| Stock options exercised |
362,282 | 65,700 | ||||
| Restricted stock awards vested |
1,662,827 | 1,360,201 | ||||
| Total stock options exercised/restricted stock awards vested |
2,025,109 | 1,425,901 | ||||
| Exercised dilution (2) |
12.1 | % | 8.9 | % |
| (1) | The percentage for grant dilution is computed based on net options and restricted stock awards granted as a percentage of shares of common stock outstanding. |
| (2) | The percentage for exercise dilution is computed based on net options exercised as a percentage of shares of common stock outstanding. |
| (3) | Includes 269,700 restricted shares granted as part of the Company’s acquisition of Salary.com Limited. |
Employee Stock Purchase Plan
On January 17, 2007, the Company’s Board of Directors and stockholders approved the adoption of the 2007 Employee Stock Purchase Plan (“ESPP”). Stock purchase rights are granted to eligible employees during six month offering periods with purchase dates at the end of each offering period. The offering periods generally commence each April 1 and October 1. Shares are purchased through payroll deductions at purchase prices equal to 90% of the fair market value of the Company’s common stock at either the first day or the last day of the offering period, whichever is lower. There are 319,813 shares available for issuance under the ESPP as of March 31, 2010. The Company recorded compensation expense of approximately $77,000, $127,000 and $52,000 related to shares issued under the Company’s employee stock purchase plan for the years ended March 31, 2010, 2009 and 2008, respectively.
Warrants
In conjunction with the subordinated notes payable to stockholders in 2002, the Company issued warrants to the holders to purchase 28,000 shares of common stock at $0.89 per share and 750,000 shares of Series B preferred stock at $1.00 per share. The Series B preferred stock warrants were replaced with 750,000 warrants to purchase Series A-4 preferred stock at $0.25 per share in November 2003. In November 2006, the Company issued a warrant to acquire 44,800 shares of its common stock at an exercise price of $6.61 per share to an existing stockholder that is affiliated with a director of the Company.
F-27
Table of Contents
SALARY.COM, INC. AND SUBSIDIARIES
NOTES TO THE CONSOLIDATED FINANCIAL STATEMENTS—(Continued)
As of March 31, 2010, the Company had outstanding warrants to purchase 35,527 shares of common stock at exercise prices ranging from $0.09 to $6.61 per share. The following table presents a summary of the warrants to purchase activity for the year ended March 31, 2010:
| Number of Warrants |
Weighted Average Exercise Price | |||||
| Outstanding—beginning of year |
53,612 | $ | 1.743 | |||
| Granted |
— | |||||
| Exercised |
(5,779 | ) | 0.124 | |||
| Canceled |
(12,306 | ) | 6.610 | |||
| Outstanding—end of year |
35,527 | $ | 0.321 | |||
| Exercisable—end of year |
35,527 | $ | 0.321 | |||
Shareholder Rights Agreement
On November 14, 2008, the Company’s Board of Directors adopted a Shareholder Rights Plan and declared a dividend distribution of one preferred stock purchase right for each outstanding share of the Company’s common stock to shareholders of record as of the close of business on November 15, 2008. Initially, these rights will not be exercisable and will trade with the shares of the Company’s common stock. Under the Shareholder Rights Plan, the rights generally will become exercisable if a person becomes an “acquiring person” by acquiring 20% or more of the common stock of the Company or if a person commences a tender offer that could result in that person owning 20% or more of the common stock of the Company. If a person becomes an acquiring person, each holder of a right (other than the acquiring person) would be entitled to purchase, at the then-current exercise price, such number of shares of preferred stock which are equivalent to shares of the Company’s common stock having a value of twice the exercise price of the right. If the Company is acquired in a merger or other business combination transaction after any such event, each holder of a right would then be entitled to purchase, at the then-current exercise price, shares of the acquiring company’s common stock having a value of twice the exercise price of the right.
Stock Repurchase Program
On December 15, 2008, the Board of Directors authorized the repurchase by the Company of up to $2.5 million of its common stock from time to time at prevailing prices in the open market or in negotiated transactions off the market. On April 17, 2009, the Company’s Board of Directors increased the size of its share repurchase program from $2.5 million to $7.5 million. During the fiscal year ended March 31, 2010, the Company repurchased and retired 1,154,316 shares with a total value of approximately $2.5 million pursuant to this repurchase program. Since the inception of the repurchase program through March 31, 2010, 1,348,140 shares with a total value of approximately $2.8 million have been repurchased and retired by the Company.
| 10. | FUNDS HELD FOR CLIENTS AND CLIENT FUND OBLIGATIONS |
Funds held for clients represent assets that are restricted for use solely for the purpose of satisfying the obligations to remit funds relating to the Company’s payroll and payroll tax filing services, which are classified as a current asset under the caption funds held for clients on the Consolidated Balance Sheets. Funds held for clients are invested in overnight money market securities and had a balance of $13.0 million at March 31, 2010.
Client funds obligations represent the Company’s contractual obligations to remit funds to satisfy clients’ payroll and tax payment obligations and are recorded on the Consolidated Balance Sheets at the time that the
F-28
Table of Contents
SALARY.COM, INC. AND SUBSIDIARIES
NOTES TO THE CONSOLIDATED FINANCIAL STATEMENTS—(Continued)
Company impounds funds from clients. The client funds obligations represent liabilities that will be repaid within one year of the balance sheet date. The Company has reported client funds obligations of $13.0 million as a current liability on the Consolidated Balance Sheet as of March 31, 2010. The amount of collected but not yet remitted funds for the Company’s payroll and payroll tax filing and other services will vary significantly during the fiscal year.
The Company has reported the cash flows related to the client’s funding on a net basis within “net increase in assets held to satisfy client funds obligations” in the investing section of the Statements of Consolidated Cash Flows. The Company has reported the cash flows related to the cash received from and paid on behalf of clients on a net basis within “net increase in client funds obligations” in the financing section of the Statements of Consolidated Cash Flows.
| 11. | INCOME TAXES |
The provision for income taxes consists of:
| (in thousands) Year Ended March 31, |
||||||||||||
| 2010 | 2009 | 2008 | ||||||||||
| Federal: |
||||||||||||
| Current |
$ | — | $ | — | $ | — | ||||||
| Deferred |
(4,798 | ) | (5,665 | ) | (2,990 | ) | ||||||
| (4,798 | ) | (5,665 | ) | (2,990 | ) | |||||||
| State: |
||||||||||||
| Current |
— | 6 | 24 | |||||||||
| Deferred |
(1,099 | ) | (1,450 | ) | (1,090 | ) | ||||||
| (1,099 | ) | (1,444 | ) | (1,066 | ) | |||||||
| Foreign: |
||||||||||||
| Deferred |
(544 | ) | (395 | ) | — | |||||||
| (544 | ) | (395 | ) | — | ||||||||
| Change in Valuation Allowance: |
||||||||||||
| United States |
6,175 | 7,401 | 4,261 | |||||||||
| Foreign |
363 | 311 | — | |||||||||
| 6,538 | 7,712 | 4,261 | ||||||||||
| Provision for income taxes |
$ | 97 | $ | 208 | $ | 205 | ||||||
A reconciliation of the Company’s effective income tax rate to the statutory federal income tax rate of 34% for the years ended March 31, 2010, 2009 and 2008 is as follows:
| Years Ended March 31, | |||||||||
| 2010 | 2009 | 2008 | |||||||
| Statutory rate |
(34.0 | )% | (34.0 | )% | (34.0 | )% | |||
| State taxes, net of federal benefit |
(2.8 | ) | (3.7 | ) | (6.8 | ) | |||
| Goodwill impairment |
2.7 | — | — | ||||||
| Other |
1.2 | 1.5 | 1.8 | ||||||
| Change in valuation allowance |
33.3 | 37.0 | 41.0 | ||||||
| 0.4 | % | 0.8 | % | 2.0 | % | ||||
F-29
Table of Contents
SALARY.COM, INC. AND SUBSIDIARIES
NOTES TO THE CONSOLIDATED FINANCIAL STATEMENTS—(Continued)
Deferred income taxes reflect the net tax effect of temporary differences between the carrying amount of assets and liabilities for financial reporting purposes and the amounts used for income tax purposes. Significant components of the Company’s deferred tax assets for the years ended March 31, 2010 and 2009 are as follows:
| (in thousands) March 31, |
||||||||
| 2010 | 2009 | |||||||
| Deferred tax assets: |
||||||||
| Net operating loss carryforwards |
$ | 16,155 | $ | 12,696 | ||||
| Accrued expenses |
203 | 194 | ||||||
| Property and equipment |
389 | 199 | ||||||
| Amortization—identifiable intangible assets |
1,322 | — | ||||||
| Deferred revenue |
1,132 | 608 | ||||||
| Stock-based compensation |
2,246 | 2,967 | ||||||
| Reserves |
100 | 68 | ||||||
| Tax credits |
1,063 | 1,088 | ||||||
| Other |
30 | 9 | ||||||
| Foreign NOL |
722 | 358 | ||||||
| Total gross deferred tax assets |
23,362 | 18,187 | ||||||
| Valuation allowance |
(23,362 | ) | (16,825 | ) | ||||
| Total deferred tax assets |
— | 1,362 | ||||||
| Deferred tax liabilities: |
||||||||
| Amortization—identifiable intangible assets |
— | (1,362 | ) | |||||
| Amortization—foreign intangible assets |
(775 | ) | (892 | ) | ||||
| Amortization—goodwill |
(744 | ) | (466 | ) | ||||
| Total deferred tax liabilities |
(1,519 | ) | (2,720 | ) | ||||
| Net deferred tax liabilities |
$ | (1,519 | ) | $ | (1,358 | ) | ||
As of March 31, 2010, the Company had net operating loss carryforwards of approximately $41.9 million for federal income tax purposes and $37.8 million for state income tax purposes. Federal and state net operating losses may be available to offset future federal income tax liabilities. The net operating losses for federal income tax purposes expire at various dates through 2030 and state net operating losses expire at various dates through 2015. Management has determined that is more likely than not that the Company will not recognize the benefit of federal and state deferred tax assets, and as a result, a valuation allowance of $23.4 million and $16.8 million has been established at March 31, 2010 and 2009, respectively.
For stock-based awards that are deductible for tax purposes, the cumulative compensation cost is treated as a temporary difference. If a deduction reported on a tax return exceeds the cumulative compensation cost for those awards, any resulting realized tax benefit that exceeds the previously recognized deferred tax asset for those awards (the excess tax benefit) is recognized as additional paid-in capital. If the amount deductible is less than the cumulative compensation cost recognized for financial reporting purposes, the write-off of a deferred tax asset related to that deficiency, net of the related valuation allowance, if any, is first offset to the extent of any remaining additional paid-in capital from excess tax benefits from previous awards with the remainder recognized in the statement of operations.
The Company has additional net operating loss carryforwards of approximately $545,000 resulting from excess tax deductions from stock options exercised since 2006. Pursuant to ASC Topic 740-718, the deferred tax
F-30
Table of Contents
SALARY.COM, INC. AND SUBSIDIARIES
NOTES TO THE CONSOLIDATED FINANCIAL STATEMENTS—(Continued)
asset relating to excess tax benefit from these exercises was not recognized for financial statement purposes; however, this amount may be recognized for financial statement purposes in the future if the benefit is ultimately realized.
Ownership changes, as defined by the Internal Revenue Code, may substantially limit the amount of net operating loss carryforwards that can be utilized annually to offset future taxable income. Subsequent ownership changes could further affect the limitation in future years. Such annual limitations could result in the expiration of net operating loss carryforwards before utilization.
The amount of unrecognized tax benefits as of March 31, 2010 and 2009 was $118,000, which, if ultimately recognized, will reduce the Company’s annual effective tax rate. The Company does not expect any material change in unrecognized tax benefits within the next twelve months.
As of March 31, 2010, the Company is subject to tax in the U.S. Federal, state and foreign jurisdictions. The Company is open to examination for tax years 2006 through 2009. Additionally, since the Company has net operating loss and tax credit carryforwards available for future years, those years are also subject to review by the taxing authorities. The Company is not currently under examination by U.S. Federal and state tax authorities or the China taxing authority.
The Company’s policy is to recognize interest and penalties accrued on any unrecognized tax positions as a component of income tax expense, if any. As of March 31, 2010, the Company has not accrued any interest and penalties for unrecognized tax benefits in its statement of operations.
| 12. | BENEFIT PLAN |
The Company has a retirement savings plan under Section 401(k) of the Internal Revenue Code (the 401(k) Plan). Participants may contribute up to a maximum percentage of their annual compensation to the plan as determined by the Company, limited to a maximum annual amount set by the Internal Revenue Service. The Company has not made any matching contributions to the 401(k) Plan during the years ended March 31, 2010, 2009 and 2008.
| 13. | RESTRUCTURING CHARGES |
On January 7, 2009, the Company implemented and completed a workforce reduction of approximately 100 employees, representing approximately sixteen percent (16%) of the Company’s workforce. The Company implemented this workforce reduction in response to the macro-economic uncertainties. As a result of the workforce reduction, the Company recorded restructuring charges of approximately $3.1 million. These charges were comprised of $1.8 million in stock compensation charges associated with the accelerated vesting of unvested awards, $1.2 million in severance payments, and $0.1 million in various other costs.
On February 20, 2010, the Company’s President and Chief Executive Officer resigned from his positions at the Company. As a result of the former executive’s resignation, the Company recorded restructuring charges of approximately $1.6 million during the fourth quarter of fiscal 2010. These charges were comprised of $0.2 million of severance and payroll related costs, $0.6 million in stock compensation charges associated with the accelerated vesting of unvested awards, and $0.7 million in various other costs, primarily consisting of legal fees. The Company also expects to incur an additional $1.2 million of charges in fiscal 2011 related to the transition process which primarily consists of $1.0 million of severance and compensation related charges as well as $0.2 million of external consultant fees to assist with the process. The future severance payments will commence in August 2010 and be paid and expensed over an eighteen month period consistent with the non-compete agreement executed with the former executive.
F-31
Table of Contents
SALARY.COM, INC. AND SUBSIDIARIES
NOTES TO THE CONSOLIDATED FINANCIAL STATEMENTS—(Continued)
During the fiscal year ended March 31, 2010, the Company also recorded restructuring charges of approximately $0.5 million related to severance payments to 40 employees terminated by the Company.
Restructuring charges were as follows:
| (in thousands) | ||||||||||||||||
| Severance | Stock Compensation |
Other | Total | |||||||||||||
| Accrued restructuring balance at March 31, 2008 |
$ | — | $ | — | $ | — | $ | — | ||||||||
| Restructuring charges |
1,205 | 1,813 | 63 | 3,081 | ||||||||||||
| Cash payments |
(937 | ) | — | (32 | ) | (969 | ) | |||||||||
| Non-cash charges |
— | (1,813 | ) | — | (1,813 | ) | ||||||||||
| Accrued restructuring balance at March 31, 2009 |
268 | — | 31 | 299 | ||||||||||||
| Restructuring charges |
669 | 629 | 741 | 2,039 | ||||||||||||
| Cash payments |
(898 | ) | — | (500 | ) | (1,398 | ) | |||||||||
| Non-cash charges |
— | (629 | ) | — | (629 | ) | ||||||||||
| Accrued restructuring balance at March 31, 2010 |
$ | 39 | $ | — | $ | 272 | $ | 311 | ||||||||
The Company anticipates that the remaining payments related to the restructuring will occur during the first half of fiscal 2011.
| 14. | FINANCIAL INSTRUMENTS |
Fair Value of Financial Instruments
On April 1, 2009, the Company adopted the provisions of ASC 820-10-55 related to non-financial assets and liabilities recognized or disclosed at fair value on a nonrecurring basis. Assets and liabilities subject to this guidance primarily include goodwill, intangible assets, long-lived assets and other assets measured at fair value for impairment assessment. The following table summarizes the Company’s assets measured at fair value on a nonrecurring basis segregated among the appropriate levels within the fair value hierarchy:
| (in thousands) | ||||||||
| Fair Value Measurements at March 31, 2010 Using: | ||||||||
| Description |
Quoted Prices in Active Markets for Identical Assets (Level 1) |
Significant
Other Observable Inputs (Level 2) |
Significant Unobservable Inputs (Level 3)(1) |
Impairment Charges | ||||
| Amortizable intangible assets, net |
— | — | 9,125 | 3,545 | ||||
| Goodwill |
— | — | 14,967 | 2,054 | ||||
| 5,599 | ||||||||
| (1) | See Note 5 for discussion of the valuation techniques used to measure fair value, the description of the inputs and information used to develop those inputs. |
F-32
Table of Contents
SALARY.COM, INC. AND SUBSIDIARIES
NOTES TO THE CONSOLIDATED FINANCIAL STATEMENTS—(Continued)
| 15. | SEGMENT AND RELATED INFORMATION |
The following tables summarize selected financial information of the Company’s operations by geographic locations:
Revenues by geographic location consist of the following:
| (in thousands) Year ended March 31, | |||||||||
| 2010 | 2009 | 2008 | |||||||
| Revenues: |
|||||||||
| United States |
$ | 42,482 | $ | 39,152 | $ | 33,816 | |||
| All other countries |
3,268 | 3,303 | 691 | ||||||
| Total Revenues |
$ | 45,750 | $ | 42,455 | $ | 34,507 | |||
Tangible long-lived assets as of March 31, 2010 and 2009 by geographic location consist of the following:
| (in thousands) | ||||||
| 2010 | 2009 | |||||
| Long-lived assets: |
||||||
| United States |
$ | 35,186 | $ | 42,943 | ||
| United Kingdom |
5,522 | 5,784 | ||||
| All other countries |
762 | 1,291 | ||||
| Total long-lived assets |
$ | 41,470 | $ | 50,018 | ||
F-33
Table of Contents
SALARY.COM, INC. AND SUBSIDIARIES
NOTES TO THE CONSOLIDATED FINANCIAL STATEMENTS—(Continued)
| 16. | SELECTED CONSOLIDATED QUARTERLY OPERATING RESULTS |
The following table presents consolidated statement of operations data for each of the eight quarters in the period beginning April 1, 2008 and ending March 31, 2010. This information is derived from our unaudited financial statements, which in the opinion of management contain all adjustments necessary for a fair presentation of such financial data. Operating results for these periods are not necessarily indicative of the operating results for a full year. Historical results are not necessarily indicative of the results to be expected in future periods.
| (in thousands, except per share
data) Three months ended |
||||||||||||||||||||||||||||||||
| June 30 2008 |
Sept. 30 2008 |
Dec. 31 2008 |
March 31 2009 |
June 30 2009 |
Sept. 30 2009 |
Dec. 31 2009 |
March 31 2010 |
|||||||||||||||||||||||||
| (Unaudited) | ||||||||||||||||||||||||||||||||
| Statements of Operations Data: |
||||||||||||||||||||||||||||||||
| Revenue: |
||||||||||||||||||||||||||||||||
| Subscription revenues |
$ | 8,989 | $ | 9,858 | $ | 10,267 | $ | 10,515 | $ | 10,444 | $ | 10,750 | $ | 11,312 | $ | 10,179 | ||||||||||||||||
| Advertising revenues |
625 | 688 | 735 | 777 | 913 | 895 | 561 | 696 | ||||||||||||||||||||||||
| Total revenues |
9,614 | 10,546 | 11,002 | 11,292 | 11,357 | 11,645 | 11,873 | 10,875 | ||||||||||||||||||||||||
| Cost of revenues |
3,240 | 3,131 | 2,961 | 3,826 | 3,633 | 3,720 | 3,742 | 3,363 | ||||||||||||||||||||||||
| Gross profit |
6,374 | 7,415 | 8,041 | 7,466 | 7,724 | 7,925 | 8,131 | 7,512 | ||||||||||||||||||||||||
| Operating Expenses: |
||||||||||||||||||||||||||||||||
| Research and development |
1,809 | 2,296 | 2,211 | 2,529 | 2,263 | 2,437 | 2,425 | 2,571 | ||||||||||||||||||||||||
| Sales and marketing |
6,490 | 7,153 | 6,715 | 5,782 | 5,716 | 5,494 | 5,243 | 5,335 | ||||||||||||||||||||||||
| General and administrative |
3,995 | 3,941 | 3,749 | 3,995 | 4,035 | 3,718 | 3,543 | 3,912 | ||||||||||||||||||||||||
| Amortization of intangible assets |
379 | 444 | 495 | 701 | 738 | 756 | 763 | 750 | ||||||||||||||||||||||||
| Impairment charges |
— | — | — | — | — | — | — | 5,599 | ||||||||||||||||||||||||
| Restructuring charges |
— | — | — | 3,081 | — | 109 | 122 | 1,808 | ||||||||||||||||||||||||
| Total operating expenses |
12,673 | 13,834 | 13,170 | 16,088 | 12,752 | 12,514 | 12,096 | 19,975 | ||||||||||||||||||||||||
| Loss from operations |
(6,299 | ) | (6,419 | ) | (5,129 | ) | (8,622 | ) | (5,028 | ) | (4,589 | ) | (3,965 | ) | (12,463 | ) | ||||||||||||||||
| Other income (expense) |
223 | 176 | 9 | (172 | ) | (94 | ) | (52 | ) | 21 | 31 | |||||||||||||||||||||
| Loss before provision for income taxes |
(6,076 | ) | (6,243 | ) | (5,120 | ) | (8,794 | ) | (5,122 | ) | (4,641 | ) | (3,944 | ) | (12,432 | ) | ||||||||||||||||
| Provision for income taxes |
86 | 56 | 36 | 36 | 26 | 20 | 16 | 35 | ||||||||||||||||||||||||
| Net loss |
(6,162 | ) | (6,299 | ) | (5,156 | ) | (8,830 | ) | (5,148 | ) | (4,661 | ) | (3,960 | ) | (12,467 | ) | ||||||||||||||||
| Net loss attributable to common stockholders per share—basic and diluted |
$ | (0.39 | ) | $ | (0.39 | ) | $ | (0.31 | ) | $ | (0.53 | ) | $ | (0.32 | ) | $ | (0.29 | ) | $ | (0.24 | ) | $ | (0.74 | ) | ||||||||
During the fourth quarter of fiscal 2010, the Company recorded goodwill and intangible asset impairments of $2.1 million and $3.5 million, respectively, and restructuring charges of $1.8 million. The impairment charges were a result of the Company’s strategic business realignment and annual impairment analysis; while the restructuring charges were primarily related to the resignation of the Company’s President and Chief Executive Officer.
F-34
Table of Contents
SALARY.COM, INC. AND SUBSIDIARIES
NOTES TO THE CONSOLIDATED FINANCIAL STATEMENTS—(Continued)
| 17. | SUPPLEMENTAL CASH FLOW INFORMATION |
| (in thousands) Years ended March 31, |
|||||||||||
| 2010 | 2009 | 2008 | |||||||||
| Supplemental cash flow information: |
|||||||||||
| Cash paid for interest |
$ | 148 | $ | 96 | $ | — | |||||
| Noncash operating activities: |
|||||||||||
| Bonus paid in common stock |
692 | 1,607 | 1,898 | ||||||||
| Incentive compensation paid in common stock |
— | 118 | — | ||||||||
| Board of Directors fees paid in common stock |
217 | 278 | — | ||||||||
| Consulting fees paid in common stock |
— | 250 | — | ||||||||
| Noncash investing activities: |
|||||||||||
| Liabilities assumed on acquisition of business |
— | (2,895 | ) | 402 | |||||||
| Noncash financing activities |
|||||||||||
| Vendor financed equipment purchases |
— | 674 | — | ||||||||
| Options assumed in acquisition |
— | 1,110 | — | ||||||||
| Cash paid for acquisitions, net of cash acquired |
|||||||||||
| Net assets acquired (liabilities assumed) |
— | (2,895 | ) | 937 | |||||||
| Goodwill and intangible assets |
— | 17,037 | 16,722 | ||||||||
| Deferred/contingent consideration payments |
121 | 952 | — | ||||||||
| Direct acquisition related costs |
— | 199 | — | ||||||||
| Total costs of acquisitions |
121 | 15,293 | 17,659 | ||||||||
| Less: |
|||||||||||
| Options assumed in acquisition |
— | (1,110 | ) | — | |||||||
| Cash acquired |
— | (1,490 | ) | (90 | ) | ||||||
| Value of common stock issued |
— | — | (500 | ) | |||||||
| Deferred purchase price |
— | — | (703 | ) | |||||||
| Cash paid for acquisitions, net of cash acquired |
$ | 121 | $ | 12,693 | $ | 16,366 | |||||
F-35
Table of Contents
| 18. | SUBSEQUENT EVENTS |
Discontinued Operations
In May 2010, the Company approved plans to divest its payroll reporting unit. The payroll reporting unit primarily consists of the Company’s enterprise payroll and human resource management software sold by the Company’s Genesys subsidiary and its small business payroll products. The decision to divest this business was based on the Company’s determination that its current product offerings are too broad and its decision to focus its resources in the areas where the Company believes it has the greatest potential for profitable growth: compensation, talent management and consumer businesses. As a result, the Company will begin reporting its payroll reporting unit as a discontinued operation beginning in the first quarter of fiscal 2011. As of March 31, 2010, the Company identified the following carrying amounts of major classes of assets and liabilities associated with the payroll reporting unit subsequent to the $5.6 million non-cash impairment charge to the reporting unit’s goodwill and amortizable intangible assets recorded in the fourth quarter of fiscal 2010, see Note 5 for further information on the Company’s goodwill and annual impairment analysis:
| (in thousands) | |||
| Assets |
|||
| Current assets |
$ | 3,133 | |
| Funds held for clients |
12,967 | ||
| Total current assets |
16,100 | ||
| Intangible assets, net |
2,274 | ||
| Goodwill |
2,022 | ||
| Other non current assets |
299 | ||
| Total assets |
$ | 20,695 | |
| Liabilities |
|||
| Deferred revenue, current portion |
$ | 3,299 | |
| Accrued contingent consideration |
2,000 | ||
| Other current liabilities |
693 | ||
| Client funds obligations |
12,967 | ||
| Total current liabilities |
18,959 | ||
| Non current liabilities |
13 | ||
| Total liabilities |
$ | 18,972 | |
Shutdown of Montego Bay, Jamaica Office
In June 2010, the Company shut down its Montego Bay, Jamaica telesales operation as part of the Company’s strategic realignment. As a result of the closure, the Company recorded severance charges of approximately $0.1 million in May 2010 related to the termination of 37 employees and also terminated the lease for the office property for no additional costs or penalties. Additionally, the Company transferred the majority of the facility’s long-lived assets, primarily consisting of technology equipment, to its corporate offices and sold remaining assets to third parties for approximately $0.3 million in June 2010.
F-36
Table of Contents
SALARY.COM, INC. AND SUBSIDIARIES
SCHEDULE II—VALUATION AND QUALIFYING ACCOUNTS
(in thousands)
| Balance at Beginning of Period |
Charged to Expense |
Deductions | Acquired | Balance at End of Period | |||||||
| Allowance for doubtful accounts (deducted from accounts receivable) |
|||||||||||
| Year ended March 31, 2008 |
180 | 67 | — | — | 247 | ||||||
| Year ended March 31, 2009 |
247 | 130 | (247 | ) | 40 | 170 | |||||
| Year ended March 31, 2010 |
170 | 291 | (212 | ) | — | 249 | |||||
| Balance at Beginning of Period |
Charged to Expense |
Deductions | Acquired | Balance at End of Period | |||||||
| Deferred tax valuation allowance (deducted from net deferred taxes) |
|||||||||||
| Year ended March 31, 2008 |
9,311 | 1,015 | — | — | 10,326 | ||||||
| Year ended March 31, 2009 |
10,326 | 6,499 | — | — | 16,825 | ||||||
| Year ended March 31, 2010 |
16,825 | 6,537 | — | — | 23,362 | ||||||
S-1