Attached files
| file | filename |
|---|---|
| EX-23 - COMMUNITY FINANCIAL CORP /VA/ | ex-23.htm |
| EX-32 - COMMUNITY FINANCIAL CORP /VA/ | ex-32.htm |
| EX-99.2 - COMMUNITY FINANCIAL CORP /VA/ | ex99-2.htm |
| EX-99.1 - COMMUNITY FINANCIAL CORP /VA/ | ex99-1.htm |
| EX-31.1 - COMMUNITY FINANCIAL CORP /VA/ | ex31-1.htm |
| EX-31.2 - COMMUNITY FINANCIAL CORP /VA/ | ex31-2.htm |
UNITED
STATES
SECURITIES
AND EXCHANGE COMMISSION
WASHINGTON,
D.C. 20549
−−−−−−−−−−−
FORM
10-K
|
/X/
|
ANNUAL
REPORT PURSUANT TO SECTION 13 OR 15(d) OF THE SECURITIES EXCHANGE ACT OF
1934
|
FOR
THE FISCAL YEAR ENDED: MARCH 31, 2010
OR
|
/
/
|
TRANSITION
REPORT PURSUANT TO SECTION 13 OR 15(d) OF THE SECURITIES EXCHANGE ACT OF
1934
|
Commission
file number 0-18265.
−−−−−−−−−−−
COMMUNITY
FINANCIAL CORPORATION
(Exact
Name of Registrant as Specified in its Charter)
|
Virginia
|
54-1532044
|
|
|
(State
or other jurisdiction of
incorporation
or organization)
|
(I.R.S.
Employer
Identification
No.)
|
|
|
38
North Central Avenue, Staunton, Virginia
|
24401
|
|
|
(Address
of principal executive offices)
|
(Zip
Code)
|
Registrant’s
telephone number: (540) 886-0796
Securities
Registered Pursuant to Section 12(b) of the Act:
|
Title
of each class
|
Name
of each exchange on which registered
|
|
|
Common
Stock, par value $.01 per share
|
NASDAQ
Capital Market
|
Securities
Registered Pursuant to Section 12(g) of the Act: None
Indicate
by check mark if the registrant is a well-known seasoned issuer, as defined in
Rule 405 of the Securities Act. Yes o No x
Indicate
by check mark if the registrant is not required to file reports pursuant to
Section 13 or Section 15(d) of the Act. Yes o
No x
Indicate
by check mark whether the Registrant (1) has filed all reports required to be
filed by Section 13 or 15(d) of the Securities Exchange Act of 1934 during the
past twelve months (or for such shorter period that the
Registrant was required to file such reports), and (2) has been
subject to such requirements for the past 90 days. Yes x No
o
Indicate
by check mark whether the registrant has submitted electronically and posted on
its corporate Web site, if any, every Interactive Data File required to be
submitted and posted pursuant to Rule 405 of Regulation S-T (§ 229.405 of this
chapter) during the preceding 12 months (or for such shorter period that the
registrant was required to submit and post such files). Yes o No o
Indicate
by check mark if disclosure of delinquent filers pursuant to Item 405 of
Regulation S-K is not contained herein, and will not be contained, to the best
of Registrant’s knowledge, in definitive proxy or information statements
incorporated by reference in Part III of this Form 10-K or any amendment to this
Form 10-K. x
Indicate
by checkmark whether the Registrant is a large accelerated filer, an accelerated
filer, a non-accelerated filer, or a smaller reporting company.
|
(Do
not check if a smaller reporting company)
|
Smaller
reporting company x
|
Indicate
by check mark whether the registrant is a shell company (as defined in Rule
12b-2 of the Act). Yes o No x
As of May
31, 2010, there were issued and outstanding 4,361,658 shares of the Registrant’s
common stock. The aggregate market value of the voting and non-voting common
equity held by non-affiliates of the Registrant, computed by reference to the
price at which the common equity was last sold as of September 30, 2009, was
approximately $16.3 million. (The exclusion from such amount of the
market value of the shares owned by any person shall not be deemed an admission
by the Issuer that such person is an affiliate of the Registrant.)
DOCUMENTS
INCORPORATED BY REFERENCE
PART III
of Form 10-K—Portions of the Proxy Statement for the 2010 Annual Meeting of
Stockholders.
TABLE
OF CONTENTS
Page
|
CAUTIONARY
STATEMENT REGARDING FORWARDING LOOKING STATEMENTS
|
1
|
|
|
PART
I
|
2
|
|
|
ITEM
1. BUSINESS
|
2
|
|
|
General
|
2
|
|
|
Our
Operating Strategy
|
4
|
|
|
Lending
Activities
|
5
|
|
|
Loan
Originations, Purchases and Sales
|
14
|
|
|
Asset
Quality
|
15
|
|
|
Investment
Activities
|
20
|
|
|
Sources
of Funds
|
21
|
|
|
Borrowings
|
24
|
|
|
Subsidiary
Activities
|
25
|
|
|
Competition
|
25
|
|
|
Regulation
|
25
|
|
|
Federal
and State Taxation
|
31
|
|
|
Executive
Officers
|
31
|
|
|
Employees
|
32
|
|
|
ITEM
1A. RISK FACTORS
|
32
|
|
|
ITEM 1B. UNRESOLVED
STAFF COMMENTS
|
32
|
|
|
ITEM 2. PROPERTIES
|
33
|
|
|
ITEM
3. LEGAL PROCEEDINGS
|
34
|
|
|
ITEM
4. (REMOVED AND RESERVED)
|
34
|
|
|
PART
II
|
34
|
|
|
ITEM
5. MARKET FOR REGISTRANT’S COMMON EQUITY, RELATED
STOCKHOLDER
|
||
|
MATTERS
AND ISSUER PURCHASES OF EQUITY SECURITIES
|
34
|
|
|
ITEM
6. SELECTED FINANCIAL DATA
|
36
|
|
|
ITEM
7. MANAGEMENT’S DISCUSSION AND ANALYSIS OF FINANCIAL
CONDITION
|
||
|
AND
RESULTS OF OPERATIONS
|
37
|
|
|
Executive
Overview
|
37
|
|
|
Critical
Accounting Policies
|
38
|
|
|
Asset/Liability
Management
|
39
|
|
|
Average
Balances, Interest Rates and Yields
|
41
|
|
|
Rate/Volume
Analysis
|
42
|
|
|
Financial
Condition
|
42
|
|
|
Results
of Operations
|
43
|
|
|
Liquidity
and Capital Resources
|
46
|
|
|
Contractual
Obligations and Off-Balance Sheet Arrangements
|
46
|
|
|
Impact
of Inflation and Changing Prices
|
46
|
|
|
Recent
Accounting Pronouncements
|
47
|
|
|
ITEM
7A. QUANTITATIVE AND QUALITATIVE DISCLOSURES ABOUT MARKET
RISK
|
47
|
|
|
ITEM
8. FINANCIAL STATEMENTS AND SUPPLEMENTARY DATA
|
47
|
|
|
Index
to Financial Statements
|
48
|
|
|
Report
of Independent Registered Public Accounting Firm
|
49
|
|
|
Consolidated
Balance Sheets at March 31, 2010 and 2009
|
50
|
|
ii
|
Consolidated
Statements of Operations for the years
|
||
|
ended
March 31, 2010, 2009 and 2008
|
51
|
|
|
Consolidated
Statements of Stockholders’ Equity for the years ended March 31,
2010,
|
||
|
2009
and 2008
|
53
|
|
|
Consolidated
Statements of Cash Flows for the years ended March 31, 2010, 2009 and
2008
|
54
|
|
|
Summary
of Accounting Policies
|
56
|
|
|
Notes
to Consolidated Financial Statements
|
65
|
|
|
ITEM
9.CHANGES IN AND DISAGREEMENTS WITH ACCOUNTANTS ON
ACCOUNTING
|
||
|
AND
FINANCIAL DISCLOSURE
|
93
|
|
|
ITEM
9A(T). CONTROLS AND PROCEDURES
|
93
|
|
|
ITEM
9B. OTHER INFORMATION
|
94
|
|
|
PART
III
|
94
|
|
|
ITEM
10. DIRECTORS, EXECUTIVE OFFICERS AND CORPORATE
GOVERANCE
|
94
|
|
|
ITEM
11. EXECUTIVE COMPENSATION
|
95
|
|
|
ITEM
12. SECURITY OWNERSHIP OF CERTAIN BENEFICIAL OWNERS AND
MANAGEMENT
|
||
|
AND
RELATED STOCKHOLDER MATTERS
|
95
|
|
|
ITEM
13. CERTAIN RELATIONSHIPS AND RELATED TRANSACTIONS, AND
DIRECTOR INDEPENDENCE
|
95
|
|
|
ITEM
14. PRINCIPAL ACCOUNTING FEES AND SERVICES
|
95
|
|
|
PART
IV
|
95
|
|
|
ITEM
15. EXHIBITS, FINANCIAL STATEMENT SCHEDULES
|
95
|
|
|
SIGNATURES
|
96
|
|
|
INDEX
TO EXHIBITS
|
97 | |
|
|
|
|
iii
CAUTIONARY
STATEMENT REGARDING FORWARDING LOOKING STATEMENTS
This
document, including information incorporated by reference, contains, and future
filings by Community Financial Corporation on Form 10-K, Form 10-Q and Form 8-K
and future oral and written statements by Community Financial Corporation and
its management may contain, forward-looking statements about Community Financial
Corporation which we believe are within the meaning of the Private Securities
Litigation Reform Act of 1995. These forward-looking statements include, without
limitation, statements with respect to anticipated future operating and
financial performance, including revenue creation, lending origination,
operating efficiencies, loan sales, charge-offs and loan loss provisions, growth
opportunities, interest rates, cost savings and funding advantages. These
forward-looking statements are based on currently available competitive,
financial and economic data and management's views and assumptions regarding
future events. These forward-looking statements are inherently uncertain and
investors must recognize that actual results may differ from those expressed or
implied in the forward-looking statements. Accordingly, Community Financial
Corporation cautions readers not to place undue reliance on any forward-looking
statements.
Words
such as may, could, should, would, believe, anticipate, estimate, expect,
intend, plan and similar expressions are intended to identify these
forward-looking statements. The important factors discussed below, as well as
other factors discussed elsewhere in this document and factors identified in our
filings with the Securities and Exchange Commission and those presented
elsewhere by our management from time to time, could cause actual results to
differ materially from those indicated by the forward-looking statements made in
this document. Among the factors that could cause our actual results to differ
from these forward-looking statements are:
|
·
|
the
strength of the United States economy in general and the strength of the
local economies in which we conduct our operations;
|
|
·
|
general
economic conditions, either nationally or regionally, may be less
favorable than expected, resulting in, among other things, a deterioration
in the credit quality of our loans and other assets;
|
|
·
|
the
effects of, and changes in, trade, monetary and fiscal policies and laws,
including interest rate policies of the Board of Governors of the Federal
Reserve System;
|
|
·
|
fluctuations
in deposit flows, loan demand, and/or real estate values, which may
adversely affect our business;
|
|
·
|
the
credit risks of lending and investing activities, including changes in the
level and direction of loan delinquencies and write-offs and changes in
estimates of the adequacy of the allowance for loan losses;
|
|
·
|
results
of examinations of Community Bank by its primary regulator, the Office of
Thrift Supervision, including the possibility that the Office of Thrift
Supervision may, among other things, require Community Bank to increase
its allowance for loan losses;
|
|
·
|
our
ability to access cost-effective funding;
|
|
·
|
financial
market, monetary and interest rate fluctuations, particularly the relative
relationship of short-term interest rates to long-term interest
rates;
|
1
|
·
|
the
timely development of and acceptance of new products and services of
Community Financial Corporation and Community Bank, and the perceived
overall value of these products and services by users, including the
features, pricing and quality compared to competitors' products and
services;
|
|
·
|
the
impact of changes in financial services laws and regulations (including
laws concerning taxes, accounting standards, banking, securities and
insurance); legislative or regulatory changes may adversely affect the
business in which we are engaged;
|
|
·
|
our success in gaining regulatory approval of our
products and services and branching locations, when
required;
|
|
·
|
the
impact of technological changes;
|
|
·
|
changes
in consumer spending and saving habits; and
|
|
·
|
our
success at managing the risks involved in the foregoing.
|
We do not
intend to update our forward-looking information and statements, whether written
or oral, to reflect change. All forward-looking statements
attributable to us are expressly qualified by these cautionary
statements.
PART
I
ITEM
1. BUSINESS
General
Community
Financial Corporation is a Virginia corporation, which owns Community
Bank. Community Bank was organized in 1928 as a Virginia-chartered
building and loan association, converted to a federally-chartered savings and
loan association in 1955 and to a federally-chartered savings bank in
1983. In 1988, Community Bank converted to the stock form of
organization through the sale and issuance of shares of our common
stock. References in this document to we, us, our, the Corporation,
the Company and the Bank refer to Community Financial and/or Community Bank as
the context requires.
Our
principal asset is the outstanding stock of Community Bank, our wholly owned
subsidiary. Our common stock trades on The Nasdaq Stock Market under the symbol
“CFFC.”
Community
Financial Corporation and Community Bank are subject to comprehensive
regulation, examination and supervision by the Office of Thrift Supervision,
Department of the Treasury and by the Federal Deposit Insurance
Corporation. The Bank is a member of the Federal Home Loan Bank
(“FHLB”) System and our deposits are backed by the full faith and credit of the
United States Government and are insured to the maximum extent permitted by the
Federal Deposit Insurance Corporation. At March 31, 2010, we had $547.2 million
in assets, deposits of $398.4 million and stockholders' equity of $49.0 million.
Our primary business consists of attracting deposits from the general public and
originating real estate loans and other types of investments through our offices
located in Staunton, Waynesboro, Stuart Drafts, Raphine, Verona, Lexington,
Harrisonburg, Buena Vista and Virginia Beach, Virginia.
Like all
financial institutions our operations are materially affected by general
economic conditions, the monetary and fiscal policies of the federal government
and the policies of the various
2
regulatory
authorities, including the Office of Thrift Supervision and the Board of
Governors of the Federal Reserve System (“Federal Reserve Board”). Our results
of operations are largely dependent upon our net interest income, which is the
difference between the interest we receive on our loan portfolio and our
investment securities portfolio, and the interest we pay on our deposit accounts
and borrowings.
Dramatic
declines in the housing market over the past two years, with decreasing home
prices and increasing delinquencies and foreclosures, unemployment and
under-employment, have negatively impacted the credit performance of mortgage
and construction loans and resulted in significant write-downs of assets by many
financial institutions. General downward economic trends, reduced availability
of commercial credit, and increasing unemployment and under-employment have
negatively impacted the credit performance of commercial and consumer credit,
resulting in additional write-downs for many financial
institutions. Concerns over the stability of the financial markets
and the economy also have resulted in decreased lending by many financial
institutions to their customers and to each other. This market
turmoil and tightening of credit has led to increased delinquencies, lack of
customer confidence, increased market volatility and widespread reduction in
general business activity. Some financial institutions have
experienced decreased access to deposits or borrowings. The resulting
economic pressure on consumers and businesses and the lack of confidence in the
financial markets may adversely affect our business, results of operations and
stock price.
Our
ability to assess the creditworthiness of customers and to estimate the losses
inherent in our credit exposure is more complex under these difficult market and
economic conditions. We expect to face increased regulation and
government oversight as a result of these downward trends. This
increased government action may increase our costs and limit our ability to
pursue certain business opportunities. We also may be required to pay
even higher FDIC premiums than the recently increased level, because financial
institution failures resulting from the depressed market conditions have
depleted and may continue to deplete the FDIC insurance fund and reduce the
FDIC’s ratio of reserves to insured deposits.
We do not
expect these difficult conditions to improve in the near future. A
worsening of these conditions would likely exacerbate the adverse effects of
these difficult market and economic conditions on us, our customers and the
other financial institutions in our market. As a result, we may
experience increases in foreclosures, delinquencies and customer bankruptcies,
as well as more restricted access to funds.
As
previously mentioned, we are subject to extensive regulation, supervision and
examination by the Office of Thrift Supervision and the Federal Deposit
Insurance Corporation. These regulatory authorities have extensive
discretion in connection with their supervisory and enforcement activities,
including the ability to impose restrictions on a bank’s operations, reclassify
assets, determine the adequacy of a bank’s allowance for loan losses and
determine the level of deposit insurance premiums assessed. Because
our business is highly regulated, the laws and applicable regulations are
subject to frequent change. Any change in these regulations and
oversight, whether in the form of regulatory policy, new regulations or
legislation or additional deposit insurance premiums could have a material
impact on our operations.
In
response to the financial crisis of 2008 and early 2009, Congress has taken
actions that are intended to strengthen confidence and encourage liquidity in
financial institutions, and the Federal Deposit Insurance Corporation has taken
actions to increase insurance coverage on deposit accounts. In
addition, there have been proposals made by members of Congress and others that
would reduce the amount delinquent borrowers are otherwise contractually
obligated to pay under their mortgage loans and limit an institution’s ability
to foreclose on mortgage collateral.
3
The
potential exists for additional federal or state laws and regulations, or
changes in policy, affecting lending and funding practices and liquidity
standards. Moreover, bank regulatory agencies have been active in
responding to concerns and trends identified in examinations, and have issued
many formal enforcement orders requiring capital ratios in excess of regulatory
requirements. Bank regulatory agencies, such as the Office of Thrift
Supervision and the Federal Deposit Insurance Corporation, govern the activities
in which we may engage, primarily for the protection of depositors, and not for
the protection or benefit of potential investors. New laws and
regulations may increase our costs of regulatory compliance and of doing
business, and otherwise affect our operations. New laws and
regulations also may significantly affect the markets in which we do business,
the markets for and value of our loans and investments, the fees we can charge
and our ongoing operations, costs and profitability.
Congress
is currently considering significant financial reform legislation. If
new legislation is enacted, it could have a significant impact on the regulation
and operations of financial institutions and their holding
companies. The legislation provides for the elimination of the Office
of Thrift Supervision, our primary regulator, and could make Community Financial
subject to regulatory capital requirements. The legislation also
would create a new consumer financial protection agency that would issue and
enforce consumer protection initiatives governing financial products and
services. The details and impact of financial reform legislation
cannot be determined until new legislation is enacted. In addition,
the regulations governing Community Financial and Community Bank may be amended
from time to time. Any legislative or regulatory changes in the
future could adversely affect our operations and financial
condition.
Our main
office is located at 38 North Central Avenue, Staunton, Virginia 24401. Our
telephone number is (540) 886-0796. This annual report on Form 10-K,
as well as other public information that we file with the Securities and
Exchange Commission, is also available on our website at www.cbnk.com and on the
Securities and Exchange Commission’s website at www.sec.gov.
Our
Operating Strategy
Our goal
is to operate and grow a profitable community-oriented financial institution,
and to maximize stockholder value by:
|
·
|
retaining
our community-oriented focus to meet the financial needs of the
communities we serve;
|
|
·
|
enhancing
our focus on core deposits, including savings and checking
accounts;
|
|
·
|
maintaining
a high level of asset quality.
|
|
·
|
selectively
emphasizing products and services to provide diversification of revenue
sources and to capture our customer’s full relationship. We
intend to continue to expand our business by cross selling our loan and
deposit products and services to our customers;
|
|
·
|
growing
and diversifying our loan portfolio by emphasizing the origination of
commercial and multi-family real estate loans, one- to four-family
residential mortgage loans, construction loans, secured business loans and
consumer loans;
|
|
·
|
expanding
our banking network by opening de novo branches and by selectively
acquiring branch offices, although currently we do not have any specific
expansion plans;
|
4
|
·
|
controlling
operating expenses while continuing to provide quality personal service to
our customers; and
|
|
·
|
utilizing
borrowings as needed to fund growth and enhance
profitability.
|
Market
Area
Our primary market area includes
Shenandoah, Rockingham, Page, Highland, Augusta, Albemarle, Bath, Rockbridge and
Nelson Counties, and the Hampton Roads area in Virginia. Our
headquarters are located in Historic Downtown Staunton, Virginia in Augusta
County. We conduct our business through our headquarters and 10
branch offices located in Staunton (2), Waynesboro, Stuart Drafts, Raphine,
Verona, Lexington, Harrisonburg, Buena Vista and Virginia Beach (2),
Virginia.
The Virginia economy is expected to
lose another 85,300 jobs in 2011 before stabilizing in
2012. Employment is expected to fall 2.3 percent in 2011, and
modestly increase by 1.1% and 2.1% in 2012 and 2013,
respectively. The current unemployment rate in Virginia is
7.2%.
Harrisonburg-Rockingham County has a
population of approximately 120,467, and is the third largest county in
Virginia. Major employment sectors include services, manufacturing,
trade, government, and construction. The largest employers
headquartered here are James Madison University, Rockingham Memorial Hospital,
Pilgrim’s Pride Corp., R.R. Donnelly & Sons Co., and Merck & Co.,
Inc.
The Staunton-Waynesboro-Augusta County
area has a population of approximately 115,000. Major employment
sectors include manufacturing, healthcare, retail trade, hospitality and
educational services. The largest employers headquartered here
include Augusta Medical Center, McKee Foods Corporation, Hershey Chocolate of
VA, Target Mid-Atlantic Distribution Center, Ply Gem and Hollister,
Inc.
Lexington – Buena Vista-Rockbridge
County area has a population of approximately 36,000. Lexington is the county
seat for Rockbridge County. The area’s primary economic activity
stems from higher education and tourism, as well as government, manufacturing,
trade and construction. Major employers in the area include Lees
Carpets, Washington & Lee University, Stonewall Jackson Hospital, Wal-Mart,
Inc. and Virginia Military Institute.
The Virginia Beach and Hampton Roads
region has a combined population of approximately 1.5
million. The military has a large presence in this
region. The Virginia Beach – Hampton Roads region’s economic base is
largely port-related, including shipbuilding, ship repair, naval installations,
cargo transfer and storage, and manufacturing related to the processing of
imports and exports. Other major employment sectors in the area include
hospitality, agriculture and engineering, medical professionals, and Services to
Buildings/Dwellings. The largest employers in the area include Northrop Grumman,
Newport News, Sentara Healthcare, Virginia Beach City Public Schools, Norfolk
Naval Shipyard and Riverside Health System.
Lending
Activities
General. We
concentrate our lending activities on first mortgage conventional loans secured
by residential properties, commercial and multi-family real estate with an
emphasis on multi-family housing and, to a lesser extent, construction loans
secured by commercial and multi-family real estate and one- to four-family
residential properties, and commercial business loans. Additionally, we make
consumer loans in order to increase the diversification and decrease the
interest rate sensitivity of our loan portfolio, and
5
to
increase interest income as these loans typically carry higher interest rates
than residential mortgage loans. Substantially all of our loans are originated
within our market area which includes Shenandoah, Rockingham, Page, Highland,
Augusta, Albemarle, Bath, Rockbridge and Nelson Counties, and the Hampton Roads
area in Virginia. For the fiscal years 2004 through 2008, our
residential loan portfolio as a percentage of our total loan portfolio steadily
declined, while our commercial real estate, construction, commercial business
and consumer lending portfolios increased. During fiscal 2009 and
2010 residential, commercial real estate and construction loans increased, while
our consumer lending portfolios declined in 2009 and increased in 2010. The
change is primarily the result of economic factors nationally and in our market
areas. Additionally, the change in our loan portfolio has occurred
due to customers’ preference for fixed rate mortgage loans in a historically low
interest rate environment rather than adjustable rate mortgage
loans. As part of our asset liability management strategy, we have
not originated fixed rate residential loans with terms of 15 years or more for
our portfolio for approximately eight years.
Residential
loan originations come primarily from walk-in customers, real estate brokers and
builders. Commercial and multi-family real estate loan originations are obtained
through broker referrals, direct solicitation of developers and continued
business from customers. All completed loan applications are reviewed by our
salaried loan officers. As part of the application process, information is
obtained concerning the income, financial condition, employment and credit
history of the applicant and any related business interests. If commercial or
multi-family real estate is involved, information is also obtained concerning
cash flow after debt service. The quality of loans is analyzed based on our
experience and on guidelines with respect to credit underwriting as well as the
guidelines issued by Freddie Mac and Fannie Mae and other purchasers of loans,
depending on the type of loans involved. The one- to four-family,
adjustable-rate mortgage loans originated by us, however, are not readily
saleable in the secondary market because we do not typically require title
insurance or written verifications of employment history and deposit
relationships. All real estate is appraised by independent fee appraisers who
have been pre-approved by our Board of Directors.
Our loan
commitments are approved at different levels, depending on the size and type of
the loan being sought. Our Board of Directors has authorized different loan
limits for individual loan officers depending on the types of loans being
approved. Individual loan officer limits for one- to four-family real
estate loans range from $100,000 to $300,000 and for commercial real estate
loans range from $100,000 to $175,000. One- to four-family real
estate loans not exceeding $350,000 and commercial real estate loans not
exceeding $225,000 may be approved by the President of the Bank. One-
to four-family real estate loans not exceeding $950,000 and commercial real
estate loans not exceeding $875,000 may be approved by one member of senior
management and two other officers. Any loan not exceeding $1,000,000
may be approved by the Bank’s loan committee. All mortgage loans in
excess of $1,000,000 must be approved by the Board of
Directors. Individual loan officer limits for unsecured consumer and
commercial business loans range from $10,000 to $50,000 and for secured consumer
and commercial business loans range from $25,000 to $175,000. Consumer and
commercial business loans up to $375,000 on a secured basis and $150,000 on an
unsecured basis require the approval of one member of senior management and two
other officers. Consumer and commercial business loans in excess of individual
loan officer or collective senior management loan authority must be approved by
a majority of our Loan Committee or Board of Directors.
The
aggregate amount of loans that the Bank is permitted to make to any one
borrower, including related entities, and the aggregate amount that the Bank may
invest in any one real estate project, with certain exceptions, is limited to
the greater of 15% of our unimpaired capital and surplus or $500,000. At March
31, 2010, the maximum amount which we could have loaned to one borrower and the
borrower’s related entities or invested in any one project was approximately
$8.0 million. At March 31, 2010, we had only 15 borrowers, or groups of related
borrowers, with an aggregate outstanding loan balance at March 31, 2010, in
excess of $3.0 million, with the largest being a $5.1 million relationship,
consisting of eleven
6
loans
secured by residential real estate, multi-family real estate and commercial real
estate. All but one of these borrowers in excess of $3.0 million is
performing in accordance with their payment terms. We also had 17 other
borrowers, or groups of related borrowers, with an aggregate outstanding loan
balance at March 31, 2010 of between $2.0 million and $3.0 million, of which one
borrower was not performing in accordance with its payment terms at March 31,
2010.
Loan Portfolio
Composition. The following table sets forth the composition of
our total loan portfolio in dollars and percentages as of the dates
indicated.
|
March
31,
|
||||||||||||||||||||||||||||||||||||||||
|
2010
|
2009
|
2008
|
2007
|
2006
|
||||||||||||||||||||||||||||||||||||
|
Amount
|
Percent
|
Amount
|
Percent
|
Amount
|
Percent
|
Amount
|
Percent
|
Amount
|
Percent
|
|||||||||||||||||||||||||||||||
|
(Dollars
in Thousands)
|
||||||||||||||||||||||||||||||||||||||||
|
Real
Estate Loans:
|
||||||||||||||||||||||||||||||||||||||||
|
Residential
|
$ | 144,951 | 27.59 | % | $ | 140,064 | 28.17 | % | $ | 122,605 | 27.08 | % | $ | 118,044 | 28.59 | % | $ | 115,169 | 30.77 | % | ||||||||||||||||||||
|
Commercial
|
171,805 | 32.71 | 154,781 | 31.14 | 150,059 | 33.14 | 119,354 | 28.91 | 105,990 | 28.32 | ||||||||||||||||||||||||||||||
|
Construction
|
63,807 | 12.14 | 62,887 | 12.65 | 53,891 | 11.90 | 48,857 | 11.83 | 41,645 | 11.13 | ||||||||||||||||||||||||||||||
|
Total
real estate
|
380,563 | 72.44 | 357,732 | 71.96 | 326,555 | 72.12 | 286,255 | 69.33 | 262,804 | 70.22 | ||||||||||||||||||||||||||||||
|
Consumer
Loans:
|
||||||||||||||||||||||||||||||||||||||||
|
Home
equity
|
48,061 | 9.14 | 41,653 | 8.37 | 32,780 | 7.24 | 30,806 | 7.46 | 20,992 | 5.61 | ||||||||||||||||||||||||||||||
|
Automobile
|
35,533 | 6.77 | 37,411 | 7.53 | 44,961 | 9.93 | 50,992 | 12.34 | 49,996 | 13.36 | ||||||||||||||||||||||||||||||
|
Other
|
7,819 | 1.49 | 6,906 | 1.39 | 6,930 | 1.53 | 7,171 | 1.74 | 6,911 | 1.84 | ||||||||||||||||||||||||||||||
|
Total
consumer
|
91,413 | 17.40 | 85,970 | 17.29 | 84,671 | 18.70 | 88,969 | 21.54 | 77,899 | 20.81 | ||||||||||||||||||||||||||||||
|
Commercial
business
|
53,402 | 10.16 | 53,436 | 10.75 | 41,578 | 9.18 | 37,691 | 9.13 | 33,564 | 8.97 | ||||||||||||||||||||||||||||||
|
Total
loans receivable
|
525,378 | 100.00 | % | 497,138 | 100.00 | % | 452,804 | 100.00 | % | 412,915 | 100.00 | % | 374,267 | 100.00 | % | |||||||||||||||||||||||||
|
Less:
|
||||||||||||||||||||||||||||||||||||||||
|
Undisbursed
loans in
process
|
16,158 | 15,222 | 13,599 | 11,884 | 13,822 | |||||||||||||||||||||||||||||||||||
|
Deferred
(costs) and
unearned discounts
|
(959 | ) | (990 | ) | (1,184 | ) | (1,299 | ) | (1,235 | ) | ||||||||||||||||||||||||||||||
|
Allowance
for losses
|
8,053 | 5,956 | 3,215 | 3,078 | 2,966 | |||||||||||||||||||||||||||||||||||
|
Total
loans receivable, net
|
$ | 502,126 | $ | 476,950 | $ | 437,174 | $ | 399,252 | $ | 358,714 | ||||||||||||||||||||||||||||||
7
The
following table shows the composition of our loan portfolio by fixed and
adjustable-rate, at the dates indicated.
|
March
31,
|
||||||||||||||||||||||||||||||||||||||||
|
2010
|
2009
|
2008
|
2007
|
2006
|
||||||||||||||||||||||||||||||||||||
|
Amount
|
Percent
|
Amount
|
Percent
|
Amount
|
Percent
|
Amount
|
Percent
|
Amount
|
Percent
|
|||||||||||||||||||||||||||||||
|
(Dollars
in Thousands)
|
||||||||||||||||||||||||||||||||||||||||
|
Fixed-Rate
Loans:
|
||||||||||||||||||||||||||||||||||||||||
|
Real
Estate:
|
||||||||||||||||||||||||||||||||||||||||
|
Residential
|
$ | 20,170 | 3.84 | % | $ | 29,204 | 5.87 | % | $ | 22,146 | 4.89 | % | $ | 24,657 | 5.97 | % | $ | 25,952 | 6.93 | % | ||||||||||||||||||||
|
Commercial
|
33,447 | 6.37 | 31,919 | 6.42 | 22,592 | 4.99 | 15,097 | 3.66 | 13,651 | 3.65 | ||||||||||||||||||||||||||||||
|
Construction(1)
|
7,473 | 1.42 | 3,528 | 0.71 | 6,870 | 1.52 | -- | 0.00 | 855 | 0.23 | ||||||||||||||||||||||||||||||
|
Total
real estate loans
|
61,090 | 11.63 | 64,651 | 13.00 | 51,608 | 11.40 | 39,754 | 9.63 | 40,458 | 10.81 | ||||||||||||||||||||||||||||||
|
Home
equity
|
4,222 | 0.80 | 5,437 | 1.09 | 5,692 | 1.26 | 4,972 | 1.20 | 4,816 | 1.29 | ||||||||||||||||||||||||||||||
|
Automobile
|
35,460 | 6.76 | 37,300 | 7.51 | 44,843 | 9.90 | 50,895 | 12.32 | 49,840 | 13.32 | ||||||||||||||||||||||||||||||
|
Other
|
5,969 | 1.14 | 5,718 | 1.15 | 5,872 | 1.30 | 5,619 | 1.36 | 5,548 | 1.47 | ||||||||||||||||||||||||||||||
|
Total
consumer loans
|
45,651 | 8.70 | 48,455 | 9.75 | 56,407 | 12.46 | 61,486 | 14.88 | 60,204 | 16.08 | ||||||||||||||||||||||||||||||
|
Commercial
business
|
17,150 | 3.26 | 21,234 | 4.27 | 19,912 | 4.40 | 17,721 | 4.29 | 15,340 | 4.10 | ||||||||||||||||||||||||||||||
|
Total
fixed-rate loans
|
123,891 | 23.59 | 134,340 | 27.02 | 127,927 | 28.26 | 118,961 | 28.80 | 116,002 | 30.99 | ||||||||||||||||||||||||||||||
|
Adjustable-Rate
loans:
|
||||||||||||||||||||||||||||||||||||||||
|
Real
Estate:
|
||||||||||||||||||||||||||||||||||||||||
|
Residential
|
124,781 | 23.75 | 110,860 | 22.30 | 100,459 | 22.19 | 93,387 | 22.62 | 89,217 | 23.84 | ||||||||||||||||||||||||||||||
|
Commercial
|
138,358 | 26.34 | 122,862 | 24.72 | 127,467 | 28.15 | 104,257 | 25.25 | 92,339 | 24.67 | ||||||||||||||||||||||||||||||
|
Construction(2)
|
56,334 | 10.72 | 59,359 | 11.94 | 47,021 | 10.38 | 48,857 | 11.83 | 40,790 | 10.90 | ||||||||||||||||||||||||||||||
|
Total
real estate loans
|
319,473 | 60.81 | 293,0811 | 58.96 | 274,9471 | 60.72 | 246,5011 | 59.70 | 222,346 | 59.41 | ||||||||||||||||||||||||||||||
|
Home
equity
|
43,839 | 8.34 | 36,216 | 7.28 | 27,088 | 5.98 | 25,834 | 6.26 | 16,176 | 4.32 | ||||||||||||||||||||||||||||||
|
Automobile
|
73 | 0.01 | 111 | 0.02 | 118 | 0.03 | 97 | 0.02 | 156 | 0.04 | ||||||||||||||||||||||||||||||
|
Other
|
1,850 | 0.35 | 1,188 | 0.24 | 1,058 | 0.23 | 1,552 | 0.38 | 1,363 | 0.37 | ||||||||||||||||||||||||||||||
|
Total
consumer loans
|
45,762 | 8.70 | 37,515 | 7.54 | 28,264 | 6.24 | 27,483 | 6.66 | 17,695 | 4.73 | ||||||||||||||||||||||||||||||
|
Commercial
Business
|
36,252 | 6.90 | 32,202 | 6.48 | 21,666 | 4.78 | 19,970 | 4.84 | 18,224 | 4.87 | ||||||||||||||||||||||||||||||
|
Total
adjustable-rate
loans
|
401,487 | 76.41 | 362,798 | 72.98 | 324,877 | 71.74 | 293,954 | 71.20 | 258,265 | 69.01 | ||||||||||||||||||||||||||||||
|
Total
loans receivable
|
$ | 525,378 | 100.00 | % | $ | 497,138 | 100.00 | % | $ | 452,804 | 100.00 | % | $ | 412,915 | 100.00 | % | $ | 374,267 | 100.00 | % | ||||||||||||||||||||
_________________
(1) Includes
residential real estate construction loans of $3.2 million, $1.9 million,
$247,000, $0, and $0, and commercial real estate construction loans of $4.3
million, $1.6 million, $6.6 million, $0 and $855,000 at March 31, 2010, 2009,
2008, 2007 and 2006 respectively.
(2) Includes
residential real estate construction loans of $39.3 million, $45.2 million,
$43.3 million, $47.2 million and $39.6 million, and commercial real estate
construction loans of $15.9 million, $14.2 million, $3.7 million, $1.7 million
and $1.2 million at March 31, 2010, 2009, 2008, 2007 and 2006,
respectively.
8
Loan Maturity and
Repricing. The following schedule illustrates the contractual
maturity of our real estate construction and commercial business loan portfolios
as of March 31, 2010, before net items. Loans that have adjustable or
renegotiable interest rates are shown as maturing in the period during which the
contract is due. The schedule does not reflect the effects of
possible prepayments or enforcement of due-on-sale clauses.
|
Real
Estate Construction
or
Development
|
Commercial
Business
|
Total
|
||||||||||
|
(Dollars
in Thousands)
|
||||||||||||
|
Due
during periods
ending
March 31,
|
||||||||||||
|
2011
|
$ | 53,778 | $ | 33,441 | $ | 87,219 | ||||||
|
2012
to 2015
|
10,029 | 17,968 | 27,997 | |||||||||
|
After
2015
|
-- | 1,993 | 1,993 | |||||||||
|
Totals
|
$ | 63,807 | $ | 53,402 | $ | 117,209 | ||||||
The total
amount of loans in the above table due after March 31, 2011, which have fixed
interest rates is $14.4 million, while the total amount of loans due after such
date which have floating or adjustable interest rates is $15.6
million.
One- to
Four-Family Residential Real Estate Lending. We originate loans
secured by one- to four-family residences, substantially all of which are
located in our market areas. We evaluate both the borrower’s ability to make
principal and interest payments and the value of the property that will secure
the loan. Although federal law permits us to make loans in amounts of up to 100%
of the appraised value of the underlying real estate, we generally make one- to
four-family residential real estate loans in amounts of 80% or less of the
appraised value. In certain instances, we will lend up to 90% of the
appraised value of the underlying real estate and require the borrower to
purchase private mortgage insurance in an amount sufficient to reduce our
exposure to 80% or less.
In order
to manage our exposure to changes in interest rates, in the past we originate
only a limited amount of 30-year and 15-year fixed-rate, one-to four-family
residential mortgage loans for our portfolio. For the year ended
March 31, 2010, 92.4% of all one-to four-family residential loans we originated
had adjustable interest rates. At March 31, 2010, only $20.2 million, or 3.8%,
of our total loans receivable, before net items, consisted of fixed-rate
residential mortgage loans.
To
compete with other lenders in our market area, we make one, three and five year
adjustable-rate mortgage (“ARM”) loans at interest rates which, for the initial
period, may be below the index rate which would otherwise apply to these loans.
Borrowers are qualified, however, at the fully indexed interest rate. Our one-
to four-family residential ARM loans primarily have interest rates that adjust
annually, based on a stated interest margin over the yields on one year U.S.
Treasury Bills. Although our one- to four-family ARM loans primarily
adjust annually after the initial period, we currently offer residential ARM
loans which adjust every three and five years generally in
accordance with the rates based on a stated margin over the yields on the
applicable U.S. Treasury Bills. At March 31, 2010 we had the following loans
that adjust on an annual basis after the initial period, $39.5 million that
adjust after three years, $139.2 million after five years, $3.7 million after
seven years and $8.9 million after ten years. An additional $9.4 million loans
adjust every five years. We do not currently offer residential ARM
loans with an initial adjust period greater than five years. Our ARM loans
generally limit interest rate increases to 2% each rate adjustment period and
have an established ceiling rate at the time the loans are made of up to 6% over
the original interest rate. At March 31, 2010, residential ARM loans
totaled $124.8 million, representing 86.1% of our total residential real estate
loans and 23.8% of our total loans
9
receivable,
before net items. ARM loans generally pose different credit risks than
fixed-rate loans primarily because during periods of rising interest rates, the
risk of defaults on ARM loans may increase due to the upward adjustment of
interest costs to borrowers.
All one-
to four-family real estate mortgage loans originated by us contain a
“due-on-sale” clause that allows us to declare the unpaid principal balance due
and payable upon the sale of the mortgaged property. It is our policy to enforce
these due-on-sale clauses concerning fixed-rated loans and to permit assumptions
of ARM loans, for a fee, by qualified borrowers.
We
require, in connection with the origination of residential real estate loans,
title opinions and fire and casualty insurance coverage, as well as flood
insurance where appropriate, to protect our interests. The cost of this
insurance coverage is paid by the borrower. We generally do not require escrows
for taxes and insurance.
Commercial Real
Estate and Construction Lending. We have originated and,
in the past have purchased, commercial real estate loans and loan
participations. We also make commercial and residential real estate construction
loans. Our commercial real estate loans are secured by various types of
collateral, including raw land, multi-family residential buildings, hotels and
motels, convenience stores, commercial and industrial buildings, shopping
centers and churches. At March 31, 2010, commercial real estate and construction
loans aggregated $235.6 million or 44.9% of our total loans receivable, before
net items, with $194.7 million of these loans having adjustable interest rates
and $40.9 million having fixed interest rates. Our commercial real estate and
construction loans are secured primarily by properties located in our market
areas.
Our
commercial real estate loans are generally made at interest rates that adjust
annually based on yields for one-year U.S. Treasury securities, with a 2% annual
cap on rate adjustments and a 6% cap on interest rates over the life of the
loan. Typically, we charge origination fees ranging from 1% to 2% on these
loans. Commercial real estate loans made by us are fully amortizing with
maturities ranging from five to 30 years. Our construction loans are
generally for a term of 12 months or less with interest only due monthly.
Construction loans are generally made with permanent financing to be provided by
us, although not required. Construction loans to builders may be made on a basis
where a buyer has contracted to buy the house or the construction may be on a
speculative basis. Limits are set by us as to the number of each type of
construction loan for each builder, whether speculative or pre-sold, dependent
on the determination made by us during the underwriting process.
In our
underwriting of commercial real estate and construction loans, we may lend,
under federal regulations, up to 100% of the security property’s appraised
value, although the loan to original appraised value ratio on such properties is
generally 80% or less. Our commercial real estate and construction loan
underwriting requires an examination of debt service coverage ratios,
the borrower’s creditworthiness and prior credit history and reputation, and we
generally require personal guarantees or endorsements of borrowers. We also
carefully consider the location of the security property.
At March
31, 2010, we had commercial real estate loans totaling $171.8 million, including
93 commercial real
estate loans (or multiple loans to one borrower) in excess of $1.0 million with
an aggregate balance of $77.9 million. The largest loan or
lending relationship to a single borrower was for $5.1 million, which consisted
of eleven loans secured by residential real estate, multi-family real estate and
an office building.
10
The
following table presents information as to our commercial real estate and
commercial construction lending portfolio as of March 31, 2010, by type of
project.
|
Number
of
loans
|
Principal
Balance
|
|||||||
|
(Dollars
in Thousands)
|
||||||||
|
Permanent
financing:
|
||||||||
|
Multi-family
residential buildings
|
41 | $ | 16,911 | |||||
|
Hotel
and motel
|
21 | 22,112 | ||||||
|
Commercial
and industrial buildings
|
115 | 42,950 | ||||||
|
Raw
land
|
185 | 42,975 | ||||||
|
Church
|
10 | 1,578 | ||||||
|
Restaurant
|
15 | 3,989 | ||||||
|
Warehouse
|
28 | 9,975 | ||||||
|
Retail
Store
|
80 | 24,856 | ||||||
|
School/Recreational
|
13 | 6,459 | ||||||
|
Commercial
construction
|
19 | 21,704 | ||||||
|
Total
|
527 | $ | 193,509 | |||||
Commercial
construction loans are 19 loans that range from $425,000 to $2.9 million. The
loans are made for various types of construction projects with the largest being
a multi-family residence project. At March 31, 2010, one commercial construction
loan totaling $10,000 was past due.
The
largest portion of our commercial real estate portfolio consists of loans
secured by raw land. The Company originates loans to local real
estate developers with whom it has established relationships for the purpose of
developing residential subdivisions (i.e., installing roads, sewers, water and
other utilities), as well as loans to individuals to purchase building
lots. Land development loans are secured by a lien on the property
and made for a period usually not to exceed twelve months with an interest rate
that adjusts with the prime rate, and are made with loan-to-value ratios not
exceeding 80%. Monthly interest payments are required during the term of the
loan. Subdivision loans are structured so that we are repaid in full upon the
sale by the borrower of approximately 90% of the subdivision lots. All of our
land loans are secured by property located in our primary market
area. We also generally obtain personal guarantees from financially
capable parties based on a review of personal financial
statements. Loans secured by commercial and industrial buildings
increased from $40.2 million at March 31, 2009 to $43.0 million at March 31,
2010.
Loans
secured by undeveloped land or improved lots involve greater risks than one- to
four- family residential mortgage loans because these loans are advanced upon
the predicted future value of the developed property. If the estimate of the
future value proves to be inaccurate, in the event of default and foreclosure,
the Company may be confronted with a property the value of which is insufficient
to assure full repayment. Loans on raw land may run the risk of adverse zoning
changes, environmental or other restrictions on future use. At March
31, 2010, we had $4.7 million of non-performing raw land loans.
We also
make construction loans to individuals for the construction of their residences
as well as to builders and developers for the construction of non-residential
properties, one- to four-family residences and the development of one- to
four-family lots in Virginia. These construction loans are
11
generally
for a term of 12 months or less with interest only due monthly. Construction
loans are generally made with permanent financing to be provided by us, although
not required. Construction loans to builders may be made on a basis where a
buyer has contracted to buy the house or the construction may be on a
speculative basis. Limits are set by us as to the number of each type of
construction loan for each builder, whether speculative or pre-sold, dependent
on the determination made by us during the underwriting process. At
March 31, 2010, we had $42.1 million or 8.0% of our total loans receivable,
before net items, in 157 residential
construction loans, the largest of which was $1.0 million, compared to $47.1
million or 9.9% at March 31, 2009. Residential construction loans
totaled approximately 66.0% of the total construction loan
portfolio.
At March
31, 2010, we had 19 commercial construction loans totaling $21.7 million, the
largest one having an outstanding balance of $1.9 million. One commercial
construction loan totaling $10,000 is presently past due. Our commercial
construction loans are generally made for a one year term or less, with a
requirement that the borrower have a commitment for permanent financing prior to
funding the construction loan. Our construction loans generally provide for a
fixed rate of interest at the prevailing prime rate or slightly above. Such
loans are generally secured by the personal guarantees of the borrowers and by
first mortgages on the projects.
Commercial
real estate and construction lending is generally considered to involve a higher
level of credit risk than one- to four-family residential lending due to the
concentration of principal in a limited number of loans and borrowers and the
effects of general economic conditions on real estate developers and managers.
Our risk of loss on a construction loan is dependent largely upon the accuracy
of the initial estimate of the property’s sale value upon completion of the
project and the estimated cost of the project. If the estimated cost of
construction or development proves to be inaccurate, we may be required to
advance funds beyond the amount originally committed to permit completion of the
project. If the estimate of value proves to be inaccurate, we may be confronted,
at or prior to the maturity of the loan, with a project with value which is
insufficient to assure full repayment. Because we usually provide loans to a
developer for the entire estimated cost of the project, defaults in repayment
generally do not occur during the construction period and it is therefore
difficult to identify problem loans at an early stage. When loan payments become
due, borrowers may experience cash flow from the project which is not adequate
to service total debt. This cash flow shortage can result in the failure to make
loan payments. In such cases, we may be compelled to modify the terms of the
loan. In addition, the nature of these loans is such that they are generally
less predictable and more difficult to evaluate and monitor.
Consumer
Lending. We
offer a variety of secured consumer loans, including new and used automobile
loans, home equity loans and lines of credit, and deposit account, installment
and demand loans. We also offer unsecured loans. We
originate our consumer loans primarily in our market areas. At March
31, 2010, our consumer loans totaled $91.4 million or 17.4% of our total loans
receivable, before net items. With the exception of $38.4 million of home equity
lines of credit loans at March 31, 2010, our consumer loans primarily have fixed
interest rates and generally have terms ranging from 90 days to five
years.
The
largest component of our consumer loans is home equity loans. At March 31, 2010,
our home equity loans totaled $48.1 million and comprised 9.1% of our total loan
portfolio, before net items, including $38.4 million of home equity lines of
credit. Home
equity loans may be originated in amounts, together with the amount of the
existing first mortgage, of up to 90% of the value of the property securing the
loan. The amount of the line of credit also may not exceed 90% of the value of
the property securing the loan. Home equity lines of credit are
originated with an adjustable rate of interest, based on the prime rate of
interest, or with a fixed rate of interest. Home equity lines of
credit have a 20 year term and amounts may be re-borrowed after payment at any
time during the life of the loan. At March 31, 2010, unfunded
commitments on these lines of credit totaled $14.0 million.
12
We
originate automobile loans on a direct and indirect basis. Automobile
loans totaled $35.5 million at March 31, 2010, or 6.8% of our total loan
portfolio, before net items, with $7.1 million in direct loans and $28.4 million
in indirect loans. Our automobile loan portfolio decreased from $37.4
million at March 31, 2009 to $35.5 million at March 31, 2010, or
6.8%. The decrease in automobile loans is attributable to a slower
economic environment and competitive interest rates. The bulk of our
indirect lending comes from relationships with approximately 40 car dealerships
under an arrangement providing a premium for the amount over our interest rate
to the referring dealer, with approximately half of these loans originated
through four dealerships located in our market area. Indirect lending
is highly competitive; however, our ability to provide same day funding makes
our product competitive. Automobile loans may be written for a term
of up to six years and have fixed rates of interest. Loan-to-value
ratios are up to 110% of the manufacturer's suggested retail price for new
direct auto loans and 125% of the manufacturer's invoice for new indirect auto
loans. For used car loans we use the same loan-to-value ratios based
on National Automobile Dealers Association ("NADA") retail value for direct
loans and NADA trade-in value for indirect loans.
The
automobile loans are generally evenly divided between new and used vehicles. The
automobile loans are primarily without recourse to the dealer, but the Bank may
require either full or partial recourse to the dealer under certain
circumstances. If the customer’s credit history or the loan to value of the
vehicle warrants, the Bank may require full or partial recourse to the
dealer.
We follow
our internal underwriting guidelines in evaluating direct automobile loans,
including credit scoring. Indirect automobile loans are underwritten
by a third party on our behalf, using substantially similar guidelines to our
internal guidelines. However, because these loans are originated
through a third party and not directly by us, they present greater risks than
other types of lending activities. At March 31, 2010, we had $246,000
in non-performing automobile loans, which included $91,000 in indirect
automobile loans.
During
fiscal 2009, we evaluated the benefits of the increased yields on our credit
card portfolio with the higher risk and operating costs related to maintaining
and servicing an unsecured credit card portfolio. We believed that offering a
credit card product was important to our existing customer base and for
obtaining new customers. As a result of this evaluation, we entered into an
agent-bank relationship with an unaffiliated non-bank pursuant to which our
customers can obtain credit cards with the Community Bank brand and for which we
earn commissions for new accounts and a percentage of interchange fees, but for
which we incur no liability or credit risk. At the same time, we sold our
existing credit card portfolio to that unaffiliated organization. During the
September 30, 2008 quarter, we sold our credit card portfolio with an
approximate loan balance of $500,000 which resulted in a gain of
$37,000.
The
underwriting standards employed by us for consumer loans include a determination
of the applicant’s payment history on other debts and an assessment of ability
to meet existing obligations and payments on the proposed loan. The stability of
the applicant’s monthly income may be determined by verification of gross
monthly income from primary employment, and additionally from any verifiable
secondary income. Although creditworthiness of the applicant is of primary
consideration, the underwriting process also includes a comparison of the value
of the security in relation to the proposed loan amount.
Consumer
loans may entail greater risk than do residential mortgage loans, particularly
in the case of consumer loans which are unsecured, such as credit card
receivables, or secured by rapidly depreciable assets such as
automobiles. In such cases, any repossessed collateral for a
defaulted consumer loan may not provide an adequate source of repayment of the
outstanding loan balance as a result of the greater likelihood of damage, loss
or depreciation. The remaining deficiency often does not warrant further
substantial collection efforts against the borrower. In addition, consumer loan
collections
13
are
dependent on the borrower’s continuing financial stability, and thus are more
likely to be adversely affected by job loss, divorce, illness or personal
bankruptcy. Furthermore, the application of various federal and state
laws, including federal and state bankruptcy and insolvency laws, may limit the
amount which can be recovered on such loans. Such loans may also give rise to
claims and defenses by a consumer loan borrower against an assignee of such loan
such as us, and a borrower may be able to assert against such assignee claims
and defenses which it has against the seller of the underlying collateral. We
add general provisions to our loan loss allowance, in amounts determined in
accordance with industry standards, at the time the loans are originated.
Consumer loan delinquencies often increase over time as the loans age. The level of
non-performing assets in our consumer loan portfolio increased from $928,000 at
March 31, 2009 to
$2,296,000 at March 31, 2010. There can be no assurance that
delinquencies will not continue to increase in the future.
Commercial
Business Lending. At March 31, 2010, our
commercial business loans totaled $53.4 million, or 10.2%, of our total loans
receivable, before net items. We offer commercial business loans to service
existing customers, to consolidate our banking relationships with these
customers, and to further our asset/liability management goals. Our
commercial business lending activities encompass loans with a variety of
purposes and security, including but are not limited to business automobiles,
equipment and accounts receivable. We recognize the generally
increased credit risk associated with commercial business lending. Our
commercial business lending practice emphasizes credit file documentation and
analysis of the borrower’s character, management capabilities, capacity to repay
the loan, the adequacy of the borrower’s capital and collateral. An analysis of
the borrower’s past, present and future cash flows is also an important aspect
of our credit analysis.
Unlike
residential mortgage loans which generally are made on the basis of the
borrower’s ability to make repayment from his or her employment and other
income, and which are secured by real property whose value tends to be more
easily ascertainable, commercial business loans are of higher risk and typically
are made on the basis of the borrower’s ability to make repayment from the cash
flow of the borrower’s business. As a result, the availability of funds for the
repayment of commercial business loans may be dependent upon the success of the
business itself. Our commercial business loans almost always include personal
guarantees and are usually, but not always, secured by business
assets. However, the collateral securing the loans may depreciate
over time, may be difficult to appraise and may fluctuate in value based on the
success of the business.
Loan
Originations
Federal
regulations authorize us to make real estate loans anywhere in the United
States. At March 31, 2010, substantially all of our real estate loans were
secured by real estate located in our market area.
We
originate both fixed-rate and adjustable-rate loans. Our ability to
originate loans, however, is dependent upon customer demand for loans in our
market areas. Demand is affected by competition and the interest rate
environment.
Loans
purchased must conform to our underwriting guidelines. We have not purchased any
loans during the last six fiscal years or sold any loans during the last five
fiscal years. Management believes that purchases of loans and loan
participations are generally desirable only when local mortgage demand is less
than the supply of funds available for local mortgage origination.
During
the past few years, we, like many other financial institutions, have experienced
significant prepayments on loans due to the low interest rate environment
prevailing in the United States. In periods of economic uncertainty,
the ability of financial institutions, including us, to originate or purchase
large
14
dollar
volumes of real estate loans may be substantially reduced or restricted, with a
resultant decrease in interest income.
The
following table shows our loan origination and repayment activities for the
periods indicated. We did not purchase or sell any loans during the
reported periods
|
Year
Ended March 31,
|
|||||||||||||
|
2010
|
2009
|
2008
|
|||||||||||
|
Origination
by Type:
|
|||||||||||||
|
Adjustable
Rate:
|
|||||||||||||
|
Real
estate - 1-4 family residential
|
$ | 38,657 | $ | 41,441 | $ | 34,113 | |||||||
|
-
commercial
|
31,675 | 25,814 | 37,837 | ||||||||||
|
-
construction
|
15,733 | 30,740 | 14,671 | ||||||||||
|
Non-real
estate - consumer
|
580 | 522 | 531 | ||||||||||
|
-
commercial business
|
6,717 | 7,695 | 3,841 | ||||||||||
|
Total
adjustable rate
|
93,362 | 106,212 | 90,993 | ||||||||||
|
Fixed
Rate:
|
|||||||||||||
|
Real
estate - 1-4 family residential
|
3,170 | 7,757 | 6,256 | ||||||||||
|
-
commercial
|
9,711 | 10,329 | 9,452 | ||||||||||
|
-
construction
|
3,032 | 2,608 | 6,005 | ||||||||||
|
Non-real
estate - consumer
|
18,948 | 15,711 | 21,252 | ||||||||||
|
-
commercial business
|
5,379 | 9,449 | 9,124 | ||||||||||
|
Total
fixed rate
|
40,240 | 45,854 | 52,089 | ||||||||||
|
Sales
and Repayments:
|
|||||||||||||
|
Principal
repayments
|
105,362 | 107,732 | 103,193 | ||||||||||
|
Total
reductions
|
105,362 | 107,732 | 103,193 | ||||||||||
|
Increase/(Decrease)
in other items, net
|
3,064 | 4,558 | 1,967 | ||||||||||
|
Net
increase
|
$ | 25,176 | $ | 39,776 | $ | 37,922 | |||||||
Asset
Quality
Delinquent
Loans. When a borrower
fails to make a required payment on a loan, we attempt to cause the deficiency
to be cured by contacting the borrower, generally within 15 days of the loan
becoming delinquent. A notice is mailed to the borrower after a payment is 15
days past due and again when the loan is 30 days past due. For most loans, if
the delinquency is not cured within 30 days we issue a notice of intent to
foreclose on the property and if the delinquency is not cured within 60 days, we
may institute foreclosure action. If foreclosed on, real property is sold at a
public sale and may be purchased by us.
The
following table sets forth information concerning delinquent mortgage and other
loans at March 31, 2010. The amounts presented represent the total remaining
principal balances of the related loans, rather than the actual payment amounts
which are overdue.
15
|
Residential
Real
Estate
|
Commercial
Real Estate, Multi-Family and Land
|
Construction
|
Consumer
|
Commercial
Business
|
Total
|
|||||||||||||||||||||||||||||||||||||||||||
|
Number
|
Amount
|
Number
|
Amount
|
Number
|
Amount
|
Number
|
Amount
|
Number
|
Amount
|
Number
|
Amount
|
|||||||||||||||||||||||||||||||||||||
|
(Dollars
in Thousands)
|
||||||||||||||||||||||||||||||||||||||||||||||||
|
Loans
Delinquent for:
|
||||||||||||||||||||||||||||||||||||||||||||||||
|
30-59 days
|
14 | $ | 2,234 | 4 | $ | 5,654 | 6 | $ | 1,246 | 103 | $ | 2,457 | 23 | $ | 1,560 | 150 | $ | 13,151 | ||||||||||||||||||||||||||||||
|
60-89 days
|
10 | 1,937 | 4 | 349 | -- | -- | 21 | 1,354 | 9 | 158 | 44 | 3,798 | ||||||||||||||||||||||||||||||||||||
|
90
days and over
|
24 | 3,286 | 26 | 5,807 | 6 | 1,473 | 58 | 2,144 | 31 | 1,854 | 145 | 14,564 | ||||||||||||||||||||||||||||||||||||
|
Total
delinquent loans
|
48 | $ | 7,457 | 34 | $ | 11,810 | 12 | $ | 2,719 | 182 | $ | 5,955 | 63 | $ | 3,572 | 339 | $ | 31,513 | ||||||||||||||||||||||||||||||
Non-Performing
Assets. The table below sets forth the amounts and categories
of non-performing assets in our loan portfolio. Non-performing assets include
non-accruing loans, accruing loans delinquent 90 days or more as to principal or
interest payments and real estate acquired through foreclosure, which include
assets acquired in settlement of loans. Typically, a loan becomes nonaccruing
when it is 90 days delinquent. All consumer loans more than 120 days delinquent
are charged against the allowance for loan losses. Accruing mortgage loans
delinquent more than 90 days are loans that we consider to be well secured and
in the process of collection. For the years presented, we have no accruing loans
90 days or more delinquent.
|
March
31,
|
||||||||||||||||||||
|
2010
|
2009
|
2008
|
2007
|
2006
|
||||||||||||||||
|
(Dollars
in Thousands)
|
||||||||||||||||||||
|
Non-accruing
loans:
|
||||||||||||||||||||
|
Commercial
business and
consumer
|
$ | 3,998 | $ | 2,428 | $ | 137 | $ | 142 | $ | 230 | ||||||||||
|
Real
Estate
|
10,566 | 5,138 | 889 | 1,173 | 239 | |||||||||||||||
|
Total
non-accruing loans
|
14,564 | 7,566 | 1,026 | 1,315 | 469 | |||||||||||||||
|
Real
estate acquired through
foreclosure
|
3,182 | 1,400 | 593 | 181 | 120 | |||||||||||||||
|
Total
non-performing assets
|
$ | 17,746 | $ | 8,966 | $ | 1,619 | $ | 1,496 | $ | 589 | ||||||||||
|
Total
as a percentage of
total
assets
|
3.24 | % | 1.75 | % | .33 | % | .32 | % | .14 | % | ||||||||||
|
Allowance
for loan losses
|
$ | 8,053 | $ | 5,956 | $ | 3,215 | $ | 3,078 | $ | 2,966 | ||||||||||
Non-performing
assets at March 31, 2010 were comprised primarily of non-accruing loans, real
estate owned and repossessed automobiles. Based on current market values of the
properties securing these loans, management anticipates no significant losses in
excess of the reserves for losses previously recorded. Our largest non-accruing
loan relationship at March 31, 2010 totaled $3.2 million and is located in the
Charlottesville, Virginia area and is primarily a land and land development
loan. The next largest non-accruing loan relationship was $641,000 secured by
residential real estate.
Nonaccrual
loans amounted to $14.6 million at March 31, 2010. If interest on
these loans had been accrued, such income would have approximated $668,000 for
the year ended March 31, 2010, none of which is included in interest
income.
16
Other Loans Of
Concern. In addition to
the non-performing assets set forth in the table above, as of March 31, 2010, we
had approximately $2.8 million of loans with respect to which known information
about the possible credit problems of the borrowers or the cash flows of the
security properties have caused management to have doubts as to the ability of
the borrowers to comply with present loan repayment terms and which may result
in the future inclusion of such items in the non-performing asset
categories. Although management believes that these loans are adequately
secured and no material loss is expected, certain circumstances may cause the
borrower to be unable to comply with the present loan repayment terms at some
future date. These loans have been considered in management's determination of
our allowance for loan losses.
In
addition to these other loans of concern, we have $15.3 million in additional
loans which we monitor. These loans are generally performing substantially in
accordance with the loan terms but exhibit characteristics such as insufficient
cash flow or occasional delinquencies which we monitor for deterioration. Of the
$15.3 million, $10.3 million is comprised of residential real estate and
consumer loans and $5.0 million commercial real estate and business
loans.
Classified
Assets. Federal regulations provide for the classification of
loans and other assets, such as debt and equity securities considered by the
Office of Thrift Supervision to be of lesser quality, as "substandard,"
"doubtful" or "loss." An asset is considered "substandard" if it is
inadequately protected by the current net worth and paying capacity of the
obligor or of the collateral pledged, if any. "Substandard" assets
include those characterized by the "distinct possibility" that the insured
institution will sustain "some loss" if the deficiencies are not
corrected. Assets classified as "doubtful" have all of the weaknesses
in those classified "substandard," with the added characteristic that the
weaknesses present make "collection or liquidation in full," on the basis of
currently existing facts, conditions and values, "highly questionable and
improbable." Assets classified as "loss" are those considered
"uncollectible" and of such little value that their continuance as assets
without the establishment of a specific loss reserve is not
warranted.
When an
insured institution classifies problem assets as either substandard or doubtful,
it may establish general allowances for loan losses in an amount deemed prudent
by management. General allowances represent loss allowances which
have been established to recognize the risk associated with lending activities,
but which, unlike specific allowances, have not been allocated to particular
problem assets. When an insured institution classifies problem assets
as "loss," it is required either to establish a specific allowance for losses
equal to 100% of that portion of the asset so classified or to charge off such
amount. An institution's determination as to the classification of
its assets and the amount of its valuation allowances is subject to review by
the Office of Thrift Supervision and the Federal Deposit Insurance Corporation,
which may order the establishment of additional general or specific loss
allowances.
We
regularly review the problem assets in our portfolio to determine whether any
assets require classification in accordance with applicable
regulations. On the basis of management’s review of our assets, at
March 31, 2010, we had classified $20.7 million of our assets as substandard,
none as doubtful and none as loss. The $20.7 million in classified loans is
comprised primarily of residential and commercial real estate loans
Allowance for
Losses on Loans and Real Estate. We provide valuation
allowances for anticipated losses on loans and real estate when management
determines that a significant decline in the value of the collateral has
occurred, as a result of which the value of the collateral is less than the
amount of the unpaid principal of the related loan plus estimated costs of
acquisition and sale. In addition, we also provide allowances based on the
dollar amount and type of collateral securing our loans in order to protect
against unanticipated losses. Although management believes that it uses the best
information available to make such determinations, future adjustments to
allowances may be necessary, and
17
net
income could be significantly affected, if circumstances differ substantially
from the assumptions used in making the initial determinations. See
"Management's Discussion and Analysis of Financial Condition and Results of
Operations - Results of Operations - Provision for Loan Losses” in Item 7
of this report and Note 2 of the Notes to Consolidated Financial Statements in
Item 8 of this report.
The
following table sets forth an analysis of our allowance for loan
losses.
|
Year
Ended March 31,
|
||||||||||||||||||||
|
2010
|
2009
|
2008
|
2007
|
2006
|
||||||||||||||||
|
(Dollars
in Thousands)
|
||||||||||||||||||||
|
Balance
at beginning of period
|
$ | 5,956 | $ | 3,215 | $ | 3,078 | $ | 2,966 | $ | 3,021 | ||||||||||
|
Provision
charged to operations
|
4,031 | 4,285 | 625 | 388 | 177 | |||||||||||||||
|
Charge-offs:
|
||||||||||||||||||||
|
Residential
real estate
|
(135 | ) | (72 | ) | (44 | ) | --- | --- | ||||||||||||
|
Commercial
Real Estate, Multifamily and Land
|
(397 | ) | (488 | ) | (3 | ) | --- | --- | ||||||||||||
|
Construction
|
(351 | ) | (100 | ) | (25 | ) | --- | --- | ||||||||||||
|
Home
Equity
|
(578 | ) | --- | --- | --- | --- | ||||||||||||||
|
Automobile
|
(429 | ) | (438 | ) | (437 | ) | (279 | ) | (236 | ) | ||||||||||
|
Other
|
(130 | ) | (213 | ) | (73 | ) | (76 | ) | (79 | ) | ||||||||||
|
Commercial
Business
|
(86 | ) | (371 | ) | (41 | ) | (2 | ) | (29 | ) | ||||||||||
|
Recoveries:
|
||||||||||||||||||||
|
Residential
real estate
|
1 | 11 | --- | --- | --- | |||||||||||||||
|
Commercial
Real Estate, Multifamily and Land
|
--- | --- | 1 | --- | --- | |||||||||||||||
|
Construction
|
20 | --- | --- | --- | --- | |||||||||||||||
|
Home
Equity
|
4 | --- | --- | --- | --- | |||||||||||||||
|
Automobile
|
135 | 116 | 79 | 55 | 63 | |||||||||||||||
|
Other
|
2 | 9 | 10 | 26 | 49 | |||||||||||||||
|
Commercial
Business
|
10 | 2 | 45 | --- | --- | |||||||||||||||
|
Net
charge-offs
|
(1,934 | ) | (1,544 | ) | (488 | ) | (276 | ) | (232 | ) | ||||||||||
|
Balance
at end of period
|
$ | 8,053 | $ | 5,956 | $ | 3,215 | $ | 3,078 | $ | 2,966 | ||||||||||
|
Ratio
of net charge-offs during the
period
to average loans outstanding
during
the period
|
.39 | % | .33 | % | .12 | % | .07 | % | .07 | % | ||||||||||
18
The
distribution of the allowance for losses on loans at the dates indicated is
summarized as follows:
|
Residential
|
Commercial
Real
Estate,
Multi-Family
and
Land
|
Construction
|
Commercial
Business
|
Home
Equity
|
Consumer
|
Total
|
||||||||||||||||||||||
|
(Dollars
in Thousands)
|
||||||||||||||||||||||||||||
|
March
31, 2010:
|
||||||||||||||||||||||||||||
|
Amount
of loan loss allowance
|
$ | 314 | $ | 2,079 | $ | 997 | $ | 3,170 | $ | 603 | $ | 890 | $ | 8,053 | ||||||||||||||
|
Percent
of loans in each category
to
total loans
|
27.59 | % | 32.71 | % | 12.14 | % | 10.16 | % | 9.14 | % | 8.26 | % | 100.00 | % | ||||||||||||||
|
March
31, 2009:
|
||||||||||||||||||||||||||||
|
Amount
of loan loss allowance
|
$ | 276 | $ | 1,637 | $ | 665 | $ | 2,196 | $ | 224 | $ | 958 | $ | 5,956 | ||||||||||||||
|
Percent
of loans in each category
to
total loans
|
28.17 | % | 31.14 | % | 12.65 | % | 10.75 | % | 8.38 | % | 8.91 | % | 100.00 | % | ||||||||||||||
|
March
31, 2008:
|
||||||||||||||||||||||||||||
|
Amount
of loan loss allowance
|
$ | 258 | $ | 981 | $ | 383 | $ | 565 | $ | 130 | $ | 898 | $ | 3,215 | ||||||||||||||
|
Percent
of loans in each category
to
total loans
|
27.08 | % | 33.14 | % | 11.90 | % | 9.18 | % | 7.24 | % | 11.46 | % | 100.00 | % | ||||||||||||||
|
March
31, 2007:
|
||||||||||||||||||||||||||||
|
Amount
of loan loss allowance
|
$ | 238 | $ | 819 | $ | 354 | $ | 530 | $ | 109 | $ | 1,028 | $ | 3,078 | ||||||||||||||
|
Percent
of loans in each category
to
total loans
|
28.59 | % | 28.90 | % | 11.83 | % | 9.13 | % | 7.46 | % | 14.09 | % | 100.00 | % | ||||||||||||||
|
March
31, 2006:
|
||||||||||||||||||||||||||||
|
Amount
of loan loss allowance
|
$ | 250 | $ | 713 | $ | 350 | $ | 514 | $ | 96 | $ | 1,043 | $ | 2,966 | ||||||||||||||
|
Percent
of loans in each category
to
total loans
|
30.77 | % | 28.32 | % | 11.13 | % | 8.97 | % | 5.61 | % | 15.20 | % | 100.00 | % | ||||||||||||||
19
Investment Activities
Federally chartered savings institutions have the authority
to invest in various types of liquid assets, including United States Treasury
obligations, securities of various federal agencies, including callable agency
securities, certain certificates of deposit of insured banks and savings
institutions, certain bankers' acceptances, repurchase agreements and federal
funds. Subject to various restrictions, federally chartered savings
institutions may also invest their assets in investment grade commercial paper
and corporate debt securities and mutual funds whose assets conform to the
investments that a federally chartered savings institution is otherwise
authorized to make directly. See "Regulation - Qualified Thrift
Lender Test" below for a discussion of additional restrictions on our investment
activities.
The
senior vice president/chief financial officer has the basic responsibility for
the management of our investment portfolio, subject to the direction and
guidance of the asset/liability management committee. The
senior vice president/chief financial officer considers various factors when
making decisions, including the marketability, maturity and tax consequences of
the proposed investment. The maturity structure of investments will
be affected by various market conditions, including the current and anticipated
slope of the yield curve, the level of interest rates, the trend of new deposit
inflows, and the anticipated demand for funds via deposit withdrawals and loan
originations and purchases.
The general objectives of our investment portfolio are to
assist in maintaining earnings when loan demand is low and to maximize earnings
while satisfactorily managing risk, including credit risk, reinvestment risk,
liquidity risk and interest rate risk. See also "Management's
Discussion and Analysis of Financial Condition and Results of Operations - Asset
and Liability Management" in Item 7 of this Form 10-K.
As a
member of the Federal Home Loan Bank of Atlanta, we had $6.2 million in stock of
the Federal Home Loan Bank of Atlanta at March 31, 2010, and for the year ended
March 31, 2010, we received $23,000 in dividends on such stock.
The
contractual maturities and weighted average yields of our investment securities
portfolio, excluding FHLB of Atlanta stock and Freddie Mac stock, are indicated
in the following table.
|
March
31, 2010
|
||||||||||||||||||||
|
Within
1
Year
or
Less
|
After
1
Year
through
5
Years
|
After
5
Years
through
10
Years
|
Total
Investment
Securities(1)
|
|||||||||||||||||
|
Book
Value
|
Book
Value
|
Book
Value
|
Book
Value
|
Market
Value
|
||||||||||||||||
|
(Dollars
in Thousands)
|
||||||||||||||||||||
|
Federal
agency obligations
|
$ | --- | $ | 1,500 | $ | --- | $ | 1,500 | $ | 1,500 | ||||||||||
|
Other
|
198 | --- | --- | 198 | 198 | |||||||||||||||
|
Total
Investment Securities
|
$ | 198 | $ | 1,500 | $ | --- | $ | 1,698 | $ | 1,698 | ||||||||||
|
Weighted
Average Yield(2)
|
1.67 | % | 3.24 | % | --- | % | 3.06 | % | 3.06 | % | ||||||||||
______________________
(1) Included
in the above table are $1.5 million of securities that are callable in one year
or less.
(2) The
weighted average yield is not computed on a tax equivalent
basis.
20
The
following table sets forth the composition of our available for sale and held to
maturity securities portfolios at the dates indicated. At March 31,
2010, our securities portfolio did not contain securities of any issuer with an
aggregate book value in excess of 10% of our equity capital, excluding those
issued by the United States Government or its agencies. See Note 1 of
the Notes to Consolidated Financial Statements in Item 8 of this report for
additional information on our investment securities.
|
March
31,
|
||||||||||||||||||||||||
|
2010
|
2009
|
2008
|
||||||||||||||||||||||
|
Book
Value
|
%
of
Total
|
Book
Value
|
%
of
Total
|
Book
Value
|
%
of
Total
|
|||||||||||||||||||
|
(Dollars
in Thousands)
|
||||||||||||||||||||||||
|
Interest-bearing
deposits with banks
|
$ | 3,825 | 100.0 | % | $ | 512 | 100.0 | % | $ | 12,762 | 100.0 | % | ||||||||||||
|
Investment
securities:
|
||||||||||||||||||||||||
|
Federal
agency obligations
|
$ | 1,500 | 18.9 | % | $ | 1,500 | 21.0 | % | $ | 2,500 | 14.1 | % | ||||||||||||
|
State
agencies and commercial paper
|
--- | --- | 200 | 2.8 | 440 | 2.5 | ||||||||||||||||||
|
Other
|
198 | 2.5 | --- | --- | --- | --- | ||||||||||||||||||
|
United
States agency equity securities
|
73 | 0.9 | 207 | 2.9 | 9,562 | 54.0 | ||||||||||||||||||
|
Subtotal
|
1,771 | 22.3 | 1,907 | 26.7 | 12,502 | 70.6 | ||||||||||||||||||
|
FHLB
stock
|
6,184 | 77.7 | 5,239 | 73.3 | 5,211 | 29.4 | ||||||||||||||||||
|
Total
investment securities
and
FHLB stock
|
$ | 7,955 | 100.0 | % | $ | 7,146 | 100.0 | % | $ | 17,713 | 100.0 | % | ||||||||||||
|
Average
remaining life or term
to
repricing(1)
|
4
Years
|
3
Years
|
2
Years
|
|||||||||||||||||||||
____________________
(1) Excludes
Freddie Mac common stock and other marketable equity securities.
During
fiscal 2010, the market rates paid on investment securities
decreased. During fiscal 2010 and 2009, we made limited investment
securities purchases due to the minimal spread between short and long term rates
during most of these reporting periods.
During
fiscal 2009, due to the conservatorship of Fannie Mae and Freddie Mac in
September, 2008 and the related restrictions on its outstanding preferred stock
(including the elimination of dividends), the Company recorded an other than
temporary impairment (OTTI) non-cash charge with respect to the Fannie Mae and
Freddie Mac preferred stock it owns of $11,536,000. One of the preferred stock
issues is the Freddie Mac preferred series L with a par value of $50 per share.
The dividend rate of this issue resets every five years based on the five year
treasury rate. The next dividend reset date for this security is December 31,
2010. The Company sold 185,000 shares of Fannie Mae and Freddie Mac preferred
stock during fiscal year 2010 and has 57,000 shares remaining.
Sources
of Funds
General. Deposits have
traditionally been the principal source of our funds for use in lending and for
other general business purposes. In addition to deposits, we derive funds from
loan repayments, cash flows generated from operations, which includes interest
credited to our deposit accounts, repurchase agreements entered into with
commercial banks and FHLB of Atlanta advances.
21
Contractual
loan payments are a relatively stable source of funds, while deposit inflows and
outflows and the related cost of such funds have varied widely. Borrowings may
be used on a short-term basis to compensate for reductions in deposits or
deposit inflows at less than projected levels and may be used on a longer-term
basis to support expanded lending activities.
Deposits. We attract both
short-term and long-term deposits from the general public by offering a wide
assortment of accounts and rates. We have been required by market conditions to
rely on short-term accounts and other deposit alternatives that are more
responsive to market interest rates than fixed interest rate, fixed-term
certificates that were our primary source of deposits in the past. We offer
regular savings accounts, checking accounts, various money market accounts,
fixed-rate long-term certificates with varying maturities, $100,000 or more
jumbo certificates of deposit and individual retirement accounts. During fiscal
2010, we utilized brokered deposits due to their lower relative costs. At March
31, 2010, we had total brokered deposits of $22.5 million.
The
following table sets forth the dollar amount of savings deposits in the various
types of deposit programs offered by us at the periods indicated.
|
March
31,
|
||||||||||||
|
2010
|
2009
|
2008
|
||||||||||
|
(In
Thousands)
|
||||||||||||
|
Passbook
and statement accounts
|
$ | 31,586 | $ | 27,320 | $ | 27,520 | ||||||
|
NOW
and Super NOW accounts
|
68,844 | 56,626 | 55,034 | |||||||||
|
Money
market accounts
|
38,466 | 25,255 | 22,364 | |||||||||
|
One-
to five-year fixed-rate certificates
|
246,329 | 247,347 | 210,903 | |||||||||
|
Six-month
and 91 day certificates
|
13,195 | 8,958 | 34,910 | |||||||||
|
Total
|
$ | 398,420 | $ | 365,506 | $ | 350,731 | ||||||
The
variety of deposit accounts we offer has allowed us to be competitive in
obtaining funds and has allowed us to respond with flexibility (by paying rates
of interest more closely approximating market rates of interest) to, although
not eliminate the threat of, disintermediation (the flow of funds away from
depository institutions such as thrift institutions into direct investment
vehicles such as government and corporate securities). In addition, we have
become much more subject to short-term fluctuations in deposit flows, as
customers have become more interest rate conscious. Our ability to attract and
maintain deposits, and our cost of funds, has been, and will continue to be,
significantly affected by money market conditions.
22
The
following table sets forth our deposit flows during the periods
indicated.
|
Year
Ended March 31,
|
||||||||||||
|
2010
|
2009
|
2008
|
||||||||||
|
(Dollars
in Thousands)
|
||||||||||||
|
Opening
balance
|
$ | 365,506 | $ | 350,731 | $ | 330,538 | ||||||
|
Net
deposits
|
24,780 | 6,639 | 8,677 | |||||||||
|
Interest
credited
|
8,134 | 8,136 | 11,516 | |||||||||
|
Ending
balance
|
$ | 398,420 | $ | 365,506 | $ | 350,731 | ||||||
|
Net
increase
|
$ | 32,914 | $ | 14,775 | $ | 20,193 | ||||||
|
Percent
increase
|
9.01 | % | 4.21 | % | 6.11 | % | ||||||
During fiscal
2008, the increase in deposits was related primarily to customers’ preference
for relatively higher rate short-term time deposits in a declining rate
environment. During fiscal 2009, the change in deposits was related primarily to
the utilization of brokered deposits. We also experienced an increase in
interest-bearing checking accounts due to our continued emphasis on increasing
these relationships. During fiscal 2010, the change in deposits was related
primarily to the utilization of brokered deposits and our continued emphasis on
increasing transaction accounts. We remained competitive on deposit rates, in
particular on time deposits. We may use borrowings from time to time as an
alternative source of funds. See “ Borrowings.”
The
following table contains information pertaining to the average amount of and the
average rate paid on each of the following deposit categories for the periods
indicated.
|
Year
Ended March 31,
|
||||||||||||||||||||||||
|
2010
|
2009
|
2008
|
||||||||||||||||||||||
|
Average
Balance
|
Average
Rate
Paid
|
Average
Balance
|
Average
Rate
Paid
|
Average
Balance
|
Average
Rate
Paid
|
|||||||||||||||||||
|
(Dollars
in Thousands)
|
||||||||||||||||||||||||
|
Deposit
Category:
|
||||||||||||||||||||||||
|
Non-interest
bearing demand deposits
|
$ | 26,717 | --- | % | $ | 25,514 | --- | % | $ | 27,641 | --- | % | ||||||||||||
|
Interest
bearing demand deposits
|
66,355 | 0.95 | 51,920 | 1.16 | 45,747 | 1.50 | ||||||||||||||||||
|
Savings deposits
|
29,484 | 0.92 | 27,463 | 1.18 | 27,690 | 1.33 | ||||||||||||||||||
|
Time deposits
|
259,948 | 2.40 | 250,702 | 3.82 | 236,530 | 4.78 | ||||||||||||||||||
|
Total deposits
|
$ | 382,504 | 1.87 | % | $ | 355,599 | 2.95 | % | $ | 337,608 | 3.66 | % | ||||||||||||
The
following table shows rate information for our certificates of deposit as
indicated.
|
Less
Than
2.00%
|
2.00-
3.00%
|
3.01-
4.00%
|
4.01-
5.00%
|
5.01-
6.00%
|
Total
|
|||||||||||||||||||
|
March
31, 2010
|
$ | 171,125 | $ | 70,378 | $ | 5,060 | $ | 12,115 | $ | 846 | $ | 259,524 | ||||||||||||
|
March
31, 2009
|
$ | 15,460 | $ | 63,401 | $ | 118,149 | $ | 55,266 | $ | 4,029 | $ | 256,305 | ||||||||||||
|
March
31, 2008
|
$ | 88 | $ | 4,253 | $ | 56,806 | $ | 136,432 | $ | 48,234 | $ | 245,813 | ||||||||||||
23
The
following table indicates the amount of the certificates of deposit by time
remaining until maturity as of March 31, 2010.
|
Maturity
|
||||||||||||||||||||
|
3
Months
or
less
|
Over
3
Months
through
6
Months
|
Over
6
Months
through
12
Months
|
Over
12
Months
|
Total
|
||||||||||||||||
|
(Dollars
in Thousands)
|
||||||||||||||||||||
|
Certificates
of deposit less than $100,000
|
$ | 44,334 | $ | 44,387 | $ | 51,580 | $ | 20,967 | $ | 161,268 | ||||||||||
|
Certificates
of deposit of $100,000 or more
|
29,170 | 33,108 | 23,346 | 12,632 | 98,256 | |||||||||||||||
|
Total
certificates of deposit
|
$ | 73,504 | $ | 77,495 | $ | 74,926 | $ | 33,599 | $ | 259,524 | ||||||||||
Borrowings
We
generally utilize borrowings to supplement deposits when they are available at a
lower overall cost to us or they can be invested at a positive rate of
return. Our borrowings generally consist of advances from the FHLB of
Atlanta. Each FHLB credit program has its own interest rate, which
may be fixed or variable, and range of maturities. The FHLB of Atlanta may
prescribe the acceptable uses to which these advances may be put, as well as
limitations on the size of the advances and repayment provisions.
Our
borrowings, from time to time, also include securities sold under agreements to
repurchase, with mortgage-backed securities or other securities pledged as
collateral. At March 31, 2010, we had $846,000 of securities sold
under agreements to repurchase which adjust with the federal funds rate. For
additional information on our borrowings and securities sold under agreements to
repurchase, see Notes 6 and 7 of the Notes to Consolidated Financial Statements
contained in Item 8 of this report.
The
following table sets forth information as to our borrowings and the weighted
average interest rate paid on such borrowings at the dates
indicated.
|
At
March 31,
|
||||||||||||
|
2010
|
2009
|
2008
|
||||||||||
|
(Dollars
in thousands)
|
||||||||||||
|
Securities
sold under agreements to repurchase
|
$ | 846 | $ | 1,476 | $ | 2,834 | ||||||
|
Other
borrowings
|
250 | 1,000 | --- | |||||||||
|
FHLB
advances
|
96,000 | 94,000 | 96,000 | |||||||||
|
Total
Borrowings
|
$ | 97,096 | $ | 96,476 | $ | 98,834 | ||||||
|
Weighted
average interest rate of borrowings
|
0.90 | % | 1.00 | % | 2.74 | % | ||||||
24
Information
related to short-term borrowing activity from the Federal Home Loan Bank is as
follows:
|
At
or for the Year Ended March 31,
|
2010
|
2009
|
2008
|
|||||||||
|
(Dollars
in Thousands)
|
||||||||||||
|
Amount
outstanding at year end
|
$ | 96,000 | $ | 74,000 | $ | 76,000 | ||||||
|
Average
interest rate on amount at year end
|
0.93 | % | 0.43 | % | 2.75 | % | ||||||
|
Average
amount outstanding during the year
|
$ | 79,397 | $ | 72,055 | $ | 87,962 | ||||||
|
Average
interest rate during the year
|
0.37 | % | 1.69 | % | 4.80 | % | ||||||
|
Maximum
amount outstanding during the year
|
$ | 97,000 | $ | 94,000 | $ | 100,000 | ||||||
Subsidiary
Activities
There are no significant subsidiary
activities.
Competition
Community
faces strong competition both in originating real estate loans and in attracting
deposits. Competition in originating real estate loans comes primarily from
other thrift institutions, commercial banks and mortgage bankers who also make
loans secured by real estate located in our market area. We compete for real
estate loans principally on the basis of our interest rates and loan fees, the
types of loans and the quality of services provided to borrowers.
We face
substantial competition in attracting deposits from other thrift institutions,
commercial banks, money market and mutual funds, credit unions and other
investment vehicles. Our ability to attract and retain deposits depends on our
ability to provide an investment opportunity that satisfies the requirements of
investors as to rate of return, liquidity, risk and other factors. We compete
for these deposits by offering a variety of deposit accounts at competitive
rates and convenient business hours.
We
consider our primary markets for deposits to be Augusta County and Hampton Roads
and for mortgage loans to be Augusta and Rockingham Counties and the Hampton
Roads area. We estimate that our market share of savings deposits in
Augusta County is approximately 15% and our share of mortgage loans in Augusta
and Rockingham Counties is less than 10%. The opening of an office by the Bank
in April, 1997 in Virginia Beach, Virginia expanded the Bank’s market area to
the Hampton Roads area of Virginia.
Regulation
General. Set
forth below is a brief description of certain laws and regulations that are
applicable to Community Financial and Community Bank. The description
of these laws and regulations, as well as descriptions of laws and regulations
contained elsewhere herein, does not purport to be complete and is qualified in
its entirety by reference to the applicable laws and regulations.
Legislative
or regulatory changes in the future could adversely affect our operations and
financial condition. No assurance can be given as to whether or in
what form any such changes may occur. Under pending legislative
proposals, significant changes to the regulation of Community Financial and
Community Bank could occur. These changes include eliminating the
Office of Thrift Supervision, making the Office of the Comptroller of the
Currency the primary federal banking regulator of Community Bank, making the
Federal Reserve Board the primarily federal banking regulator of Community
Financial, imposing capital requirements on Community Financial and numerous
others.
25
The
Office of Thrift Supervision has extensive enforcement authority over all
savings associations and their holding companies, including Community Financial
and Community Bank. This enforcement authority includes, among other
things, the ability to assess civil money penalties, to issue cease-and-desist
or removal orders and to initiate injunctive actions. In general,
these enforcement actions may be initiated for violations of laws and
regulations and unsafe or unsound practices. Other actions or
inactions may provide the basis for enforcement action, including misleading or
untimely reports filed with the Office of Thrift Supervision. Except
under certain circumstances, public disclosure of final enforcement actions by
the Office of Thrift Supervision is required by law.
Federal
Regulation of Savings Associations. Community Bank, as a
federally chartered savings bank, is subject to regulation and oversight by the
Office of Thrift Supervision extending to all aspects of its
operations. This regulation of Community Bank is intended for the
protection of depositors and the insurance of accounts fund and not for the
purpose of protecting shareholders. Community Bank is required to
maintain minimum levels of regulatory capital and is subject to some limitations
on the payment of dividends to Community Financial. See “- Regulatory
Capital Requirements” and “- Limitations on Dividends and Other Capital
Distributions.” Community Bank also is subject to regulation and
examination by the Federal Deposit Insurance Corporation, which insures the
deposits of Community Bank to the maximum extent permitted by law.
We are
subject to periodic examinations by the Office of Thrift
Supervision. During these examinations, the examiners may require
Community Bank to provide for higher general or specific loan loss reserves,
which can impact our capital and earnings. As a federal savings bank,
Community Bank is subject to a semi-annual assessment, based upon its total
assets, to fund the operations of the Office of Thrift Supervision.
The
Office of Thrift Supervision has adopted guidelines establishing safety and
soundness standards on such matters as loan underwriting and documentation,
asset quality, earnings standards, internal controls and audit systems, interest
rate risk exposure and compensation and other employee benefits. Any
institution regulated by the Office of Thrift Supervision that fails to comply
with these standards must submit a compliance plan.
Insurance of
Accounts and Regulation by the FDIC. As insurer, the FDIC
imposes deposit insurance premiums and is authorized to conduct examinations of
and to require reporting by FDIC-insured institutions. It also may
prohibit any FDIC-insured institution from engaging in any activity the FDIC
determines by regulation or order to pose a serious risk to the
fund. The FDIC also has the authority to initiate enforcement actions
against savings institutions, after giving the OTS an opportunity to take such
action, and may terminate the deposit insurance if it determines that the
institution has engaged in unsafe or unsound practices or is in an unsafe or
unsound condition.
Community
Bank is a member of the Deposit Insurance Fund (DIF), which is administered by
the FDIC. Deposits are insured up to the applicable limits by the
FDIC, backed by the full faith and credit of the United States
Government. Under new legislation, during the period from October 3,
2008 through December 31, 2013, the basic deposit insurance limit is $250,000,
instead of the $100,000 limit in effect earlier.
The FDIC
assesses deposit insurance premiums on each FDIC-insured institution quarterly
based on annualized rates for four risk categories applied to its deposits
subject to certain adjustments. Each institution is assigned to one of four risk
categories based on its capital, supervisory ratings and other factors. Well
capitalized institutions that are financially sound with only a few minor
weaknesses are assigned to Risk Category I. Risk Categories II, III and IV
present progressively greater risks to the DIF. Under FDIC’s current risk-based
assessment rules, the initial base assessment rates prior to adjustments
26
range
from 12 to 16 basis points for Risk Category I, 22 basis points for Risk
Category II, 32 basis points for Risk Category III, and 45 basis points for Risk
Category IV. Initial base assessment rates are subject to adjustments
based on an institution’s unsecured debt, secured liabilities and brokered
deposits, and other adjustments if an institution’s assets are $10.0 billion or
more, such that the total base assessment rates after adjustments range from 7
to 24 basis points for Risk Category I, 17 to 43 basis points for Risk Category
II, 27 to 58 basis points for Risk Category III, and 40 to 77.5 basis points for
Risk Category IV. Rates increase uniformly by three basis points
effective January 1, 2011.
In
addition to the regular quarterly assessments, due to losses and projected
losses attributed to failed institutions, the FDIC adopted a rule imposing a
special assessment of 5 basis points on the amount of each depository
institution’s assets reduced by the amount of its Tier 1 capital (not to exceed
10 basis points of its assessment base for regular quarterly premiums) as of
June 30, 2009, collected on September 30, 2009. The special
assessment rule also permitted the FDIC to impose two additional special
assessments, each of the same amount or less, based on assets, capital and
deposits as of September 30, 2009 and December 31, 2009, to be collected,
respectively, on December 31, 2009 and March 30, 2010. The FDIC
imposed the first of the additional special assessments but did not impose the
second assessment.
In
December, 2009 the FDIC collected from insured institutions the premium for the
third quarter of 2009 and a prepaid premium for all calendar quarters through
the fourth quarter of 2012. The prepaid premium for Community Bank was $2.3
million and was calculated on the September 30, 2009 deposit balance. The
calculation assumes a 5% deposit growth rate and the three basis point increase
effective January 1, 2011. The amount paid will be adjusted for actual deposit
growth.
In April
2010, the FDIC issued a proposed rule modifying the way assessments are
determined. Under the proposed rule, for most institutions, initial base
assessment rates would be 10 to 14 basis points for Risk Category I, 22 basis
points for Risk Category II, 34 basis points for Risk Category III, and 50 basis
points for Risk Category IV. After adjustments based on unsecured
long-term debt, secured liabilities and brokered deposits for all Risk
Categories, the total base assessment rates would be 5 to 21 basis points for
Risk Category I, 17 to 43 basis points for Risk Category II, 29 to 61 basis
points for Risk Category III, and 45 to 85 basis points for Risk Category
IV. However, for large institutions (those with $10 billion or more
of total assets for four consecutive quarters), the Risk Categories would not
apply and new scorecard methods would be employed, under which the initial base
assessment rates would be 10 to 50 basis points and, after certain adjustments
based on unsecured long-term debt, secured liabilities and brokered deposits,
total base assessment rates would be 5 to 85 basis points. Rates for all
institutions would increase by 3 basis points effective January 1,
2011.
The FDIC
has authority to increase insurance assessments and its authority could be
affected by pending legislation. A significant increase in insurance premiums
would likely have an adverse effect on the operating expenses and results of
operations of the Bank. There can be no prediction as to what insurance
assessment rates will be in the future. Insurance of deposits may be
terminated by the FDIC upon a finding that the institution has engaged in unsafe
or unsound practices, is in an unsafe or unsound condition to continue
operations or has violated any applicable law, regulation, rule, order or
condition imposed by the FDIC or the OTS. We are not aware of any
practice, condition or violation that might lead to termination of the Bank’s
deposit insurance.
In
addition to the assessment for deposit insurance, institutions are required to
make payments on bonds issued in the late 1980s by the Financing Corporation to
recapitalize a predecessor deposit insurance fund. This payment is established
quarterly and during the four quarters ending March 31, 2010 averaged 1.04 basis
points of assessable deposits.
27
Transactions with
Affiliates. Transactions
between Community Bank and its affiliates generally are required to be on terms
as favorable to the institution as transactions with non-affiliates, and certain
of these transactions, such as loans to an affiliate, are restricted to a
percentage of Community Bank's capital. In addition, Community Bank
may not lend to any affiliate engaged in activities not permissible for a bank
holding company or acquire the securities of most
affiliates. Community Financial is an affiliate of Community
Bank.
Regulatory
Capital Requirements. To be considered
well capitalized, an institution must have a ratio of Tier 1 capital to total
adjusted assets of at least 5.0%, a ratio of Tier 1 capital to risk-weighted
assets of at least 6.0%, and a ratio of total capital to risk-weighted assets of
at least 10.0% and not be subject to any agreement, order or directive of the
OTS to meet and maintain any specific capital measure. Tier 1 capital
generally consists of common stockholders’ equity, retained earnings and certain
noncumulative perpetual preferred stock, plus certain intangibles. At
March 31, 2010, Community Bank had no intangibles in Tier 1
capital.
Total
capital consists of Tier 1 and Tier 2 capital. Tier 2 capital
generally consists of certain permanent and maturing capital instruments that do
no qualify as Tier 1 capital and up to 1.25% of risk-weighted assets in
allowance for loan and lease losses. The amount of Tier 2 capital
includable in total capital may not exceed the amount of Tier 1 capital.
Risk-weighted assets are determined by assigning a risk weight ranging from 0%
to 100% to all assets and certain off-balance sheet items.
To be
adequately capitalized, an institution must have a ratio of Tier 1 capital to
total adjust assets of at least 4.0%, a ratio of Tier 1 capital to risk-weighted
assets of at least 4.0% and a ratio of total capital to risk-weighted assets of
at least 8.0%. At March 31, 2010, Community Bank was well
capitalized. The Office of Thrift Supervision is authorized to
require federal savings banks on a case-by-case basis to maintain an additional
amount of total capital to account for concentration of credit risk, level of
interest rate risk, equity investments in non-financial companies and the risk
of non-traditional activities.
The
Office of Thrift Supervision is authorized, and under certain circumstances
required, to take certain actions against savings banks that are not at least
adequately capitalized. Any such institution must submit a capital
restoration plan and until such plan is approved by the Office of Thrift
Supervision may not increase its assets, acquire another institution, establish
a branch or engage in any new activities, and generally may not make capital
distributions. Additional restrictions may apply, including a forced
merger, acquisition, or liquidation of the institution. The Office of
Thrift Supervision generally is authorized to reclassify an institution into a
lower capital category and impose the restrictions if the institution is engaged
in unsafe or unsound practices or is in an unsafe or unsound
condition. The imposition by the Office of Thrift Supervision of any
of these measures on Community Bank may have a substantial adverse effect on our
operations and profitability. Regulatory capital is discussed further
in Note 10 of the Notes to Consolidated Financial Statements contained in Item 8
of this report.
Any
institution that meets the requirement to be “adequately capitalized” and not
the requirements to be “well capitalized” may not accept, renew or rollover
brokered deposits without a waiver from the FDIC. An institution that
does not meet the requirements to be “adequately capitalized” may not accept,
renew or rollover brokered deposits. Brokered deposits include deposits
solicited by the institution or its employees if the interest rates on such
deposits exceed certain thresholds.
Limitations on
Dividends and Other Capital Distributions. Office of Thrift
Supervision regulations impose various restrictions on the ability of Community
Bank to make distributions of capital, which include dividends, stock
redemptions or repurchases, cash-out mergers and other transactions charged to
the capital account. Community Bank must file a notice or application
with the Office of Thrift Supervision before making any capital
distribution. Community Bank generally may make capital
28
distributions
during any calendar year in an amount up to 100% of net income for the
year-to-date plus retained net income for the two preceding years, so long as it
is well-capitalized after the distribution. If, however, Community
Bank proposes to make a capital distribution when it does not meet (or will not
meet following the proposed capital distribution) the requirements to be
adequately capitalized or to make a distribution that will exceed these net
income limitations, it must obtain Office of Thrift Supervision approval prior
to making such distribution. The Office of Thrift Supervision may
object to any distribution based on safety and soundness concerns.
Community
Financial is not subject to Office of Thrift Supervision regulatory restrictions
on the payment of dividends. Dividends from Community Financial,
however, may depend, in part, upon its receipt of dividends from Community Bank.
Issuance of preferred stock under the TARP and CPP restricts the Company from
increasing its dividend distribution to stockholders without approval from the
OTS.
Qualified Thrift
Lender Test. All savings associations, including Community
Bank, are required to meet a qualified thrift lender test to avoid certain
restrictions on their operations. This test requires a savings association to
have at least 65% of its portfolio assets (as defined by statute) in qualified
thrift investments on a monthly average for nine out of every 12 months on a
rolling basis. As an alternative, the savings association may maintain 60% of
its assets in those assets specified in Section 7701(a)(19) of the Internal
Revenue Code. Under either test, such assets primarily consist of residential
housing related loans and investments. At March 31, 2010, Community Bank met the
test and has always met the test since its effective date.
Any
savings institution that fails to meet the qualified thrift lender test must
convert to a national bank, unless it re-qualifies as a qualified thrift lender
and thereafter remains a qualified thrift lender. If an institution
that fails the qualified thrift lender test is controlled by a holding company
(unless the institution re-qualifies in timely fashion after first failing the
test), then within one year after the failure, the holding company must register
as a bank holding company and become subject to all restrictions on bank holding
companies. See"-Holding Company Regulation."
Community
Reinvestment Act. Under the Community Reinvestment Act, every
FDIC- insured institution has a continuing and affirmative obligation consistent
with safe and sound banking practices to help meet the credit needs of its
entire community, including low and moderate income neighborhoods. The Community
Reinvestment Act does not establish specific lending requirements or programs
for financial institutions nor does it limit an institution’s discretion to
develop the types of products and services that it believes are best suited to
its particular community, consistent with the Act. The Community Reinvestment
Act requires the Office of Thrift Supervision, in connection with the
examination of Community Bank, to assess the institution’s record of meeting the
credit needs of its community and to take such record into account in its
evaluation of certain applications, such as a merger or the establishment of a
branch, by Community Bank. An unsatisfactory rating may be used as the basis for
the denial of an application by the Office of Thrift Supervision. Community Bank
was examined for Community Reinvestment Act compliance in May, 2008 and received
a rating of “Satisfactory”.
Holding Company
Regulation. Community Financial is a unitary savings and loan
holding company subject to regulatory oversight by the Office of Thrift
Supervision. As such, we are required to register and file reports with the
Office of Thrift Supervision and are subject to regulation and examination by
the Office of Thrift Supervision. In addition, the Office of Thrift Supervision
has enforcement authority over us and our non-savings association subsidiaries,
which also permits the Office of Thrift Supervision to restrict or prohibit
activities that are determined to be a serious risk to the subsidiary savings
association.
29
As a
unitary savings and loan holding company that acquired Community Bank before May
4, 1999, we generally are not subject to activity restrictions. If we acquire
control of one or more additional savings associations as a separate subsidiary,
our activities and those of any of our subsidiaries (other than Community Bank
or any other insured savings association) would become subject to such
restrictions unless such other associations each qualify as a QTL and were
acquired in supervisory acquisitions.
Federal
Securities Laws. The stock of Community Financial is
registered with the SEC under the Securities Exchange Act of 1934, as
amended. Community Financial is subject to the information, proxy
solicitation, insider trading restrictions and other requirements of the SEC
under the Securities Exchange Act of 1934.
The SEC
and the NASDAQ have adopted regulations and policies under the Sarbanes-Oxley
Act of 2002 that apply to Community Financial as a registered company under the
Securities Exchange Act of 1934 and a NASDAQ-traded company. The
stated goals of these Sarbanes-Oxley requirements are to increase corporate
responsibility, provide for enhanced penalties for accounting and auditing
improprieties at publicly traded companies and to protect investors by improving
the accuracy and reliability of corporate disclosures pursuant to the securities
laws. The SEC and NASDAQ Sarbanes-Oxley-related regulations and
policies include very specific additional disclosure requirements and corporate
governance rules. The Sarbanes-Oxley Act represents significant
federal involvement in matters traditionally left to state regulatory systems,
such as the regulation of the accounting profession, and to state corporate law,
such as the relationship between a board of directors and management and between
a board of directors and its committees.
Captial Purchase
Program. On December 19, 2008, as part of the Troubled Asset
Relief Program (“TARP”) Capital Purchase Program (“CPP”) of the United States
Department of the Treasury (“Treasury”), the Company entered into a Letter
Agreement and Securities Purchase Agreement (collectively, the “Purchase
Agreement”) with Treasury, pursuant to which the Company (i) sold to Treasury
12,643 shares of the Company’s Fixed Rate Cumulative Perpetual Preferred Stock,
Series A (the “Series A Preferred Stock”), having a liquidation preference
amount of $1,000 per share, for a purchase price of $12.6 million in cash and
(ii) issued to Treasury a ten-year warrant (the “Warrant”) to purchase
351,194 shares of the Company’s common stock, par value $0.01 per share
(the “Common Stock”), at an exercise price of $5.40 per share.
The
Series A Preferred Stock qualified as Tier 1 capital and will pay cumulative
dividends on the liquidation preference amount on a quarterly basis at a rate of
5% per annum for the first five years, and 9% per annum
thereafter. Subject to the prior approval of the Board of Governors
of the Federal Reserve System, the Series A Preferred Stock is redeemable at the
option of the Company in whole or in part at a redemption price of 100% of the
liquidation preference amount plus any accrued and unpaid
dividends.
The
enactment of ARRA on February 17, 2009 permits the Company to repay the
Treasury without penalty and without the need to raise new capital, subject to
the Treasury’s consultation with the recipient’s appropriate regulatory
agency. Additionally, upon repayment the Treasury will liquidate all
outstanding warrants at their current market value.
The
Series A Preferred Stock and the Warrant were issued in a private placement
exempt from registration pursuant to Section 4(2) of the Securities Act of 1933,
as amended (the “Securities Act”). In accordance with the Purchase
Agreement, the Company subsequently registered the Series A Preferred Stock, the
Warrant and the shares of Common Stock underlying the Warrant under the
Securities Act.
30
Federal
and State Taxation
Federal
Taxation. Savings associations such as Community Bank that
meet certain definitional tests relating to the composition of assets and other
conditions prescribed by the Internal Revenue Code of 1986, as amended, had been
permitted to establish reserves for bad debts and to make annual additions
thereto which could, within specified formula limits, be taken as a deduction in
computing taxable income for federal income tax purposes. The amount of the bad
debt reserve deduction for “non-qualifying loans” was computed under the
experience method. The amount of the bad debt reserve deduction is now actual
net charge-offs. As a result, the Bank must recapture as taxable income that
portion of the reserve that exceeds the amount that could have been taken under
the experience method for post- 1987 tax years. At March 31, 2010, Community
Bank’s had no excess reserves to be recaptured.
In
addition to the regular income tax, corporations, including savings associations
such as Community Bank, generally are subject to a minimum tax. An alternative
minimum tax is imposed at a minimum tax rate of 20% on alternative minimum
taxable income, which is the sum of a corporation’s regular taxable income (with
certain adjustments) and tax preference items, less any available exemption. The
alternative minimum tax is imposed to the extent it exceeds the corporation’s
regular income tax and net operating losses can offset no more than 90% of
alternative minimum taxable income.
To the
extent earnings appropriated to a savings association’s bad debt reserves for
“qualifying real property loans” and deducted for federal income tax purposes
exceed the allowable amount of such reserves computed under the experience
method and to the extent of the association’s supplemental reserves for losses
on loans (“Excess”), such Excess may not, without adverse tax consequences, be
utilized for the payment of cash dividends or other distributions to a
shareholder (including distributions on redemption, dissolution or liquidation)
or for any other purpose (except to absorb bad debt losses).
Community
Financial and Community Bank file consolidated federal income tax returns on a
fiscal year basis. Savings associations, such as the Community Bank, that file
federal income tax returns as part of a consolidated group are required by
applicable Treasury regulations to reduce their taxable income for purposes of
computing the percentage bad debt deduction for losses attributable to
activities of the non-savings association members of the consolidated group that
are functionally related to the activities of the savings association
member.
Our
federal income tax returns and our consolidated subsidiary for the last three
years are open to possible audit by the Internal Revenue Service. In the opinion
of management, any examination of still open returns (including returns of
subsidiaries and predecessors of, or entities merged into, Community Bank) would
not result in a deficiency which could have a material adverse effect on the
financial condition of Community Financial and our consolidated
subsidiaries.
Virginia
Taxation. We conduct our business in Virginia and consequently
are subject to the Virginia corporate income tax. The Commonwealth of Virginia
imposes a corporate income tax on a basis similar to federal income tax at a
rate of 6% on Virginia taxable income.
Executive
Officers
The
following information as to the business experience during the past five years
is supplied with respect to executive officers of Community Financial. Except as
otherwise indicated, the persons named have served as officers of Community
Financial since it became the holding company of Community Bank, and all offices
and positions described below are also with Community Bank.
31
P. Douglas
Richard, age 66,
was appointed the Acting President and Chief Executive Officer of Community
Financial and Community Bank on January 12, 2000, and became the President and
Chief Executive Officer of Community Financial and Community Bank on April 26,
2000. Mr. Richard will retire from his officer positions with the
Company and the Bank effective April 30, 2010, but will continue to serve on the
Board of Directors. He was appointed to the Board of Directors of
Community Financial on April 26, 2000 and was recently appointed Vice Chairman
of the Board. From January 1, 1997, to January 12, 2000, Mr. Richard
was a Senior Vice President of Community Bank. From December 1993 to
January 1996, he was President and Chief Executive Officer of Seaboard
Bancorp.
Norman C. Smiley,
III, age
48, was appointed President of Community Bank in March, 2008, and
effective April 30, 2010, became the President and Chief Executive Officer of
Community Financial and Community Bank. Prior to joining the Company
in April 1996, Mr. Smiley was a Branch Manager for First Virginia where he was
employed for 14 years. He is a 1987 graduate of the Virginia Bankers
School of Bank Management at the University of Virginia and a 2001 graduate of
the American Bankers Association Stonier Graduate School of Banking at
Georgetown University. Mr. Smiley is currently a Board member of the
American Frontier Museum and the Staunton Redevelopment Housing Authority. He is
a past Board member of the Coordinated Area Transportation System, Big
Brothers/Big Sisters, Salvation Army, the Red Cross, the City of Staunton Board
of Zoning Appeals and past Elder of the First Presbyterian Church.
R. Jerry
Giles, age 61, is our Chief Financial Officer and Senior Vice President,
a position he has held since April 1994. Prior to joining the Company in April
1994, Mr. Giles was a Certified Public Accountant in public accounting and the
Chief Financial Officer with a savings bank for eleven years.
Benny N.
Werner, age 61,
is our Senior Vice President and Chief Operations Officer, a position he has
held since May 1998. Prior to joining the Company, Mr. Werner was employed by
Crestar for three years as President-Warrenton area and employed by Jefferson
Savings and Loan, Warrenton, Virginia as Senior Vice President of Retail Banking
for seventeen years.
Lyle A.
Moffett, age 41,
is our Senior Vice President of Lending, a position he has held since March,
2008. Mr. Moffett joined Community Bank in 1997 and was Vice President and
Commercial Loan Officer prior to his current position.
John J.
Howerton, age 52, is our Senior Vice President of Retail Banking, a
position he has held since September, 2008. Mr. Howerton has been employed in
the banking industry since 1982 and prior to joining the Company, Mr. Howerton
was the Senior Vice President of Retail Banking with Stellar One.
Clarence W.
Keel, age 63, is
the Senior Vice President in our Hampton Roads Region, a position he has held
since March, 2010. Mr. Keel has been employed in the banking industry since 1971
and prior to joining the Company, Mr. Keel was the Senior Vice President and
Manager of Shareholder Services with BB&T Corporation.
Employees
At March
31, 2010, we had a total of 156 employees, including 23 hourly employees. None
of our employees are represented by any collective bargaining group. Management
considers our employee relations to be good.
ITEM
1A. RISK FACTORS – Not required by smaller reporting
companies.
ITEM
1B. UNRESOLVED STAFF
COMMENTS–
Not required by smaller reporting companies.
32
ITEM 2. PROPERTIES
The
following table sets forth information at March 31, 2010, with respect to our
retail and operational offices, furniture and equipment. We believe
that our current facilities are adequate to meet our present and foreseeable
need
|
Location
|
Opened
|
Owned
or
Lease
Expiration
|
Gross
Square
Footage
|
Net
Book Value
at
March 31,
2010
|
||||||||
|
38
North Central Avenue
Staunton,
Virginia
|
1965
|
Owned
|
17,000 | $ | 1,186,000 | |||||||
|
Rte
250 West
Waynesboro,
Virginia
|
1989
|
Owned
|
5,300 | 490,000 | ||||||||
|
Route
340 and 608
Stuarts
Draft, Virginia
|
1993
|
Owned
|
3,000 | 869,000 | ||||||||
|
621
Nevan Road
Virginia
Beach, Virginia
|
1998
|
2038
|
13,000 | 799,000 | ||||||||
|
101
Community Way
Staunton,
Virginia
|
1999
|
2039
|
4,500 | 536,000 | ||||||||
|
2134
Raphine Road,
Raphine,
Virginia
|
2001
|
2011
|
2,308 | 34,000 | ||||||||
|
21
Dick Huff Lane
Verona,
Virginia
|
2002
|
Owned
|
3,850 | 963,000 | ||||||||
|
123
West Frederick Street
Staunton,
Virginia
|
2003
|
Owned
|
22,000 | 1,656,000 | ||||||||
|
1201
Lake James Drive
Virginia
Beach, Virginia
|
2005
|
2012
|
3,900 | 228,000 | ||||||||
|
463
Hidden Creek Lane
Harrisonburg,
Virginia
|
2005
|
2011
|
2,000 | 32,000 | ||||||||
|
102
Walker Street
Lexington,
Virginia
|
2006
|
2028
|
2,200 | 189,000 | ||||||||
|
211
West Frederick Street
Staunton,
Virginia
|
2009
|
Owned
|
4,445 | 269,000 | ||||||||
|
128
West 21st
Street
Buena
Vista, Virginia
|
2009
|
Owned
|
4,100 | 1,670,000 | ||||||||
Our
accounting and record-keeping activities are maintained on an in-house computer
system. The net book value of our computer equipment at March 31, 2010 was
$69,596.
33
ITEM
3. LEGAL PROCEEDINGS
There are
no material pending legal proceedings to which we or our subsidiary is a party
or to which any of our property is subject.
Item
4. (Removed and reserved)
PART
II
ITEM
5. MARKET FOR REGISTRANT’S COMMON EQUITY, RELATED STOCKHOLDER MATTERS
AND ISSUER PURCHASES OF EQUITY SECURITIES
As of May
31, 2010, there were approximately 420 holders of record of Community Financial
common stock. Community Financial common stock is traded on The
Nasdaq Capital Market under the symbol “CFFC.” The number of
shareholders of record does not reflect persons or entities who hold their stock
in nominee or “street” name.
The
following tables present the high, low and closing sales prices of our common
stock as reported by the Nasdaq Stock Market during the last two fiscal years
and the dividends declared by us for the stated periods.
|
Fiscal
2010
|
High
|
Low
|
Close
|
Dividend
Declared
|
||||||||||||
|
March
2010
|
$ | 4.48 | $ | 3.68 | $ | 4.16 | $ | .000 | ||||||||
|
December
2009
|
4.94 | 3.32 | 4.34 | .000 | ||||||||||||
|
September
2009
|
4.70 | 3.70 | 4.16 | .000 | ||||||||||||
|
June
2009
|
6.00 | 3.50 | 4.40 | .000 | ||||||||||||
|
Fiscal
2009
|
High
|
Low
|
Close
|
Dividend
Declared
|
||||||||||||
|
March
2009
|
$ | 4.40 | $ | 2.04 | $ | 4.00 | $ | .000 | ||||||||
|
December
2008
|
6.73 | 3.25 | 3.83 | .000 | ||||||||||||
|
September
2008
|
8.50 | 4.55 | 5.85 | .065 | ||||||||||||
|
June
2008
|
9.25 | 6.70 | 7.76 | .065 | ||||||||||||
The Board
of Directors of Community Financial makes dividend payment decisions with
consideration of a variety of factors, including earnings, financial condition,
market considerations and regulatory restrictions. Our ability to pay
dividends is limited by restrictions imposed by the Virginia Stock Corporation
Act, contractually pursuant to our participation in the U.S. Treasury’s CPP and
indirectly by the Office of Thrift Supervision. Restrictions on
dividend payments from Community Bank to Community Financial (Community
Financials’ primary source of funds for the payment of dividends to its
stockholders) are described in Note 10 of the Notes to Consolidated Financial
Statements contained in Item 8 of this Form 10-K.
The
Equity Compensation Plan information contained in Item 12 of this Form 10-K is
incorporated herein by reference. No stock was repurchased by the
Company during the fourth quarter of fiscal 2010. Our ability to
repurchase stock is limited as a result of our participation in the U.S.
Treasury’s CCP and, indirectly, by the Office of Thrift
Supervision.
The following graph compares the
performance of the Company’s common stock with The Nasdaq Stock Market Index and
the Hemscott Savings and Loan Group Index. The comparison
assumes $100 was invested on March 31, 2005 in Community Financial common stock
and in each of the
34
foregoing
indices and assumes the reinvestment of all dividends. Historical
stock price performance is not necessarily indicative of future stock price
performance.
Comparison
of Cumulative Total Return
Among
Community Financial Corporation, Nasdaq Market Index
and
Hemscott Savings and Loan Group Index
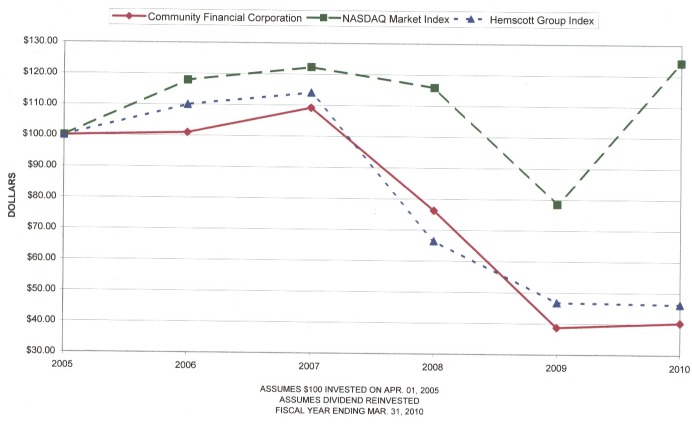
|
3/31/05
|
3/31/06
|
3/31/07
|
3/31/08
|
3/30/09
|
3/31/10
|
|||||||||||||||||||
|
Community
Financial Corp VA
|
$ | 100.00 | $ | 100.99 | $ | 109.16 | $ | 76.25 | $ | 38.73 | $ | 40.28 | ||||||||||||
|
Savings
& Loans
|
100.00 | 117.89 | 122.27 | 115.88 | 78.46 | 124.22 | ||||||||||||||||||
|
NASDAQ
Market Index
|
100.00 | 100.44 | 118.41 | 122.81 | 115.02 | 76.35 | ||||||||||||||||||
35
ITEM
6. SELECTED FINANCIAL DATA
|
At
March 31,
|
||||||||||||||||||||
|
2010
|
2009
|
2008
|
2007
|
2006
|
||||||||||||||||
|
(In
thousands)
|
||||||||||||||||||||
|
Selected Financial Condition
Data:
|
||||||||||||||||||||
|
Total
assets
|
$ | 547,180 | $ | 512,724 | $ | 491,246 | $ | 463,112 | $ | 422,606 | ||||||||||
|
Loans
receivable, net
|
502,126 | 476,950 | 437,174 | 399,252 | 358,714 | |||||||||||||||
|
Investment
securities and other earning assets(1)
|
11,780 | 7,658 | 30,475 | 43,703 | 45,102 | |||||||||||||||
|
Real
estate owned, net
|
3,182 | 1,400 | 593 | 181 | 120 | |||||||||||||||
|
Deposits
|
398,420 | 365,506 | 350,731 | 330,538 | 306,849 | |||||||||||||||
|
Advances
and other borrowed money
|
97,096 | 96,476 | 98,834 | 90,740 | 78,976 | |||||||||||||||
|
Stockholders’
equity
|
49,012 | 46,337 | 38,705 | 38,570 | 35,167 | |||||||||||||||
|
Year
Ended March 31,
|
||||||||||||||||||||
| 2010 | 2009 | 2008 | 2007 | 2006 | ||||||||||||||||
|
(In
thousands)
|
||||||||||||||||||||
|
Selected Operations Data:
|
||||||||||||||||||||
|
Total
interest income
|
$ | 28,198 | $ | 28,692 | $ | 32,244 | $ | 29,419 | $ | 24,466 | ||||||||||
|
Total
interest expense
|
8,081 | 12,460 | 16,978 | 14,792 | 10,312 | |||||||||||||||
|
Net
interest income
|
20,117 | 16,232 | 15,266 | 14,627 | 14,154 | |||||||||||||||
|
Provision
for loan losses
|
4,031 | 4,285 | 625 | 388 | 177 | |||||||||||||||
|
Net
interest income after provision for
loan
losses
|
16,086 | 11,946 | 14,641 | 14,239 | 13,977 | |||||||||||||||
|
Service
charges and fees
|
3,300 | 3,037 | 3,007 | 2,816 | 2,557 | |||||||||||||||
|
Securities
impairment
|
--- | (11,536 | ) | --- | --- | --- | ||||||||||||||
|
Other
noninterest income(2)
|
550 | 386 | 336 | 369 | 444 | |||||||||||||||
|
Noninterest
expenses
|
14,995 | 13,449 | 12,292 | 11,306 | 10,791 | |||||||||||||||
|
Income
(loss) before income taxes
|
4,941 | (9,616 | ) | 5,692 | 6,118 | 6,187 | ||||||||||||||
|
Income
taxes (benefit)
|
1,349 | (3,793 | ) | 1,856 | 2,027 | 1,919 | ||||||||||||||
|
Net
income (loss)
|
$ | 3,592 | $ | (5,823 | ) | $ | 3,836 | $ | 4,091 | $ | 4,268 | |||||||||
|
Amortization
of discount on preferred stock
|
(121 | ) | (34 | ) | - | - | - | |||||||||||||
|
Cumulative
dividends on preferred stock
|
(632 | ) | (176 | ) | - | - | - | |||||||||||||
|
Net
income (loss) available to common
stockholders
|
$ | 2,839 | $ | (6,033 | ) | $ | 3,836 | $ | 4,091 | $ | 4,268 | |||||||||
|
At
or For the Year Ended March 31,
|
||||||||||||||||||||
| 2010 | 2008 | 2007 | 2006 | 2005 | ||||||||||||||||
|
Other Data:
|
||||||||||||||||||||
|
Average
interest-earning assets
to
average interest bearing liabilities
|
104.24 | % | 105.41 | % | 105.21 | % | 104.86 | % | 104.81 | % | ||||||||||
|
Average
interest rate spread during year
|
3.92 | 3.25 | 3.14 | 3.30 | 3.51 | |||||||||||||||
|
Non-performing
assets to total assets
|
3.24 | 1.75 | .33 | .32 | .14 | |||||||||||||||
|
Return
on assets (ratio of net income to
average
total assets)
|
.67 | (1.17 | ) | .80 | .92 | 1.04 | ||||||||||||||
|
Return
on equity (ratio of net income to
average
total equity)
|
7.45 | (14.57 | ) | 9.77 | 11.06 | 12.79 | ||||||||||||||
|
Equity-to-assets
ratio (ratio of average
equity
to average assets)
|
9.02 | 8.03 | 8.18 | 8.36 | 8.16 | |||||||||||||||
|
Allowance
for loan losses to loans
receivable,
net
|
1.58 | 1.25 | .73 | .77 | .82 | |||||||||||||||
|
Allowance
for loan losses to non-performing loans
|
55.29 | 78.70 | 313.30 | 234.16 | 503.57 | |||||||||||||||
|
Per Common Share Data: (3)
|
||||||||||||||||||||
|
Net
income (loss)-diluted
|
$ | 0.65 | $ | (1.39 | ) | $ | 0.87 | $ | 0.93 | $ | .98 | |||||||||
|
Book
value
|
8.34 | 7.72 | 8.93 | 8.98 | 8.29 | |||||||||||||||
|
Dividends
|
0.00 | .130 | .260 | .255 | .225 | |||||||||||||||
|
Dividend
payout ratio
|
--- | % | --- | % | 29.22 | % | 26.54 | % | 22.13 | % | ||||||||||
|
Number
of full-service offices
|
11 | 11 | 10 | 10 | 9 | |||||||||||||||
36
____________________
| (1) | Includes federal funds sold, securities purchased under resale agreements and overnight deposits. |
| (2) | Other income includes customer service fees and commissions, gain or loss on disposal of property and other items. |
|
(3)
|
Per
share data for the periods presented has been restated to reflect the
2-for-1 stock split declared on July 26, 2006, as
applicable.
|
ITEM
7. MANAGEMENT’S DISCUSSION AND ANALYSIS OF FINANCIAL CONDITION AND RESULTS OF
OPERATIONS
Executive
Overview
Community
Financial Corporation is a Virginia corporation. Certain of the information
presented herein relates to Community Bank, a wholly owned subsidiary of
Community Financial. Community Financial and Community Bank, like all
thrift institutions and their holding companies, are subject to comprehensive
regulation, examination and supervision by the Office of Thrift Supervision and
the Federal Deposit Insurance Corporation.
The
following information is intended to provide investors a better understanding of
our financial position and the operating results of Community Financial
Corporation and its subsidiary, Community Bank. This discussion is primarily
from management’s perspective and may not contain all information that is of
importance to the reader. Accordingly, the information should be considered in
the context of the consolidated financial statements and other related
information contained herein.
Our net
income is primarily dependent on the difference or spread between the average
yield earned on loans and investments and the average rate paid on deposits and
borrowings, as well as the relative amounts of such assets and liabilities. The
interest rate spread is affected by regulatory, economic and competitive factors
that influence interest rates, loan demand and deposit flows. Like
other financial institutions, we are subject to interest rate risk to the degree
that our interest bearing liabilities, primarily deposits and borrowings with
short and medium term maturities, mature or reprice more rapidly, or on a
different basis, than interest earning assets, primarily loans with longer term
maturities than deposits and borrowings. While having liabilities that mature or
reprice more frequently on average than assets may be beneficial in times of
declining interest rates, such an asset/liability structure may result in lower
net income or net losses during periods of rising interest rates, unless offset
by other noninterest income. Our net income is also affected by, among other
things, fee income, asset quality, provision for loan losses, operating expenses
and income taxes.
The
primary factor contributing to our increase in net income for the fiscal year
was the securities impairment related to our Fannie Mae and Freddie Mac
preferred stock in the 2009 fiscal year that did not recur in the 2010 fiscal
year. Additionally, we experienced a 23.9% increase in our net interest income
for the current fiscal year compared to the prior fiscal year.
The
primary factors contributing to the increase in net interest income for the
fiscal year ended March 31, 2010 was an increase in the interest rate spread and
the growth in interest-earning assets, primarily loans. The increased interest
rate spread is primarily attributable to a reduction in the cost of our
interest-bearing liabilities due to aggressive rate reductions by the Federal
Reserve during the prior fiscal year. The aggressive rate reductions in the
prior fiscal year resulted in a timing difference in the repricing of assets and
liabilities. We will monitor the impact a change in interest rates may have on
both the growth in interest-earning assets and our interest rate spread. The
pace and extent of future interest rate changes will impact our loan growth and
interest rate spread, as well as interest rate adjustments on certain adjustable
rate loans that are subject to caps.
37
Utilization
of brokered deposits and management’s emphasis on increasing low and no interest
bearing transaction accounts has impacted the composition of our
interest-bearing liabilities. Deposits were the primary source of funding during
the fiscal year ended March 31, 2010. We acquired lower cost brokered deposits
and low interest bearing transaction accounts during the fiscal year to fund the
growth in our loans. While we have the capacity to continue to
utilize borrowings to meet funding needs, management recognizes the practical
long-term limitations of such a funding strategy. Management is also cognizant
of the potential for compression in our net interest margin related to the need
to acquire funds and the pace of interest rate changes. Management will continue
to monitor the level of deposits and borrowings in relation to the current
interest rate environment.
Critical
Accounting Policies
General. Our
financial statements are prepared in accordance with accounting principles
generally accepted in the United States (“GAAP”). The financial information
contained within our financial statements is, to a significant extent, financial
information that is based on measures of the financial effects of transactions
and events that have already occurred. A variety of factors could affect the
ultimate value that is obtained either when earning income, recognizing an
expense, recovering an asset or relieving a liability. We use historical loss
factors as one factor in determining the inherent loss that may be present in
our loan portfolio. Actual losses could differ significantly from the historical
factors that we use. In addition, GAAP itself may change from one previously
acceptable method to another method. Although the economics of our transactions
would be the same, the timing of events that would impact our transactions could
change.
Allowance for
Loan Losses. The allowance for loan losses is an estimate of
the losses that may be sustained in our loan portfolio. The allowance is based
on two basic principles of accounting: (i) that losses be accrued when they are
probable of occurring and estimable and (ii) that losses be accrued based on the
differences between the value of collateral, present value of future cash flows
or values that are observable in the secondary market, and the loan
balance.
The
allowance for loan losses is maintained at a level considered by management to
be adequate to absorb future loan losses currently inherent in the loan
portfolio. Management's assessment of the adequacy of the allowance is based
upon type and volume of the loan portfolio, past loan loss experience, existing
and anticipated economic conditions, and other factors which deserve current
recognition in estimating future loan losses. This evaluation is
inherently subjective as it requires estimates that are susceptible to
significant revision as more information becomes available. Additions
to the allowance are charged to operations. Subsequent recoveries, if
any, are credited to the allowance. Loans are charged-off partially or wholly at
the time management determines collectibility is not
probable. Management's assessment of the adequacy of the allowance is
subject to evaluation and adjustment by our regulators.
The
allowance consists of specific, general and unallocated
components. The specific component relates to loans that are
classified as either doubtful or substandard. For such loans that are
also classified as impaired, an allowance is established when the discounted
cash flows (or collateral value or observable market price) of the impaired loan
is lower than the carrying value of that loan. The general component
covers special mention and non-classified loans and is based on historical loss
experience adjusted for qualitative factors. An unallocated component
is maintained to cover uncertainties that could affect management’s estimate of
probable losses. The unallocated component of the allowance reflects
the margin of imprecision inherent in the underlying assumptions used in the
methodologies for estimating specific and general losses in the
portfolio.
38
The
Corporation uses real estate appraisal, future cash flows or other appropriate
methods to determine the value of impaired loans. With the use of these methods,
the Corporation provides valuation allowances for anticipated losses when
management determines that a decline in the value of the collateral or expected
cash flows has occurred. Updated appraisals are obtained periodically and in
those instances where management has reason to believe a material change may
have occurred in the fair value of the collateral. Evaluation of impairment
requires judgment and estimates, management uses all relevant and timely
information available to determine specific reserves on impaired loans,
including appraisals and cash flow analysis. Loans are partially or
completely charged off in the period when they are deemed uncollectible in
accordance with ASC 310-35.
Large
groups of smaller balance homogeneous loans are collectively evaluated for
impairment. Accordingly, we do not separately identify individual
consumer and residential loans for impairment disclosures, unless such loans are
the subject of a restructuring agreement. These loans were included in the
allowance calculation as pools of loans in the general component with
allocations based on historic charge-offs and qualitative factor adjustments
deemed appropriate by management for these types of loans and their nonaccrual
status.
Asset/Liability
Management
Management
believes it is important to manage the relationship between interest rates and
the effect on our net portfolio value. This approach calculates the
difference between the present value of expected cash flows from assets and the
present value of expected cash flows from liabilities, as well as cash flows
from off-balance sheet contracts. Management of our assets and liabilities is
done within the context of the marketplace, but also within limits established
by the board of directors on the amount of change in net portfolio value which
is acceptable given certain interest rate changes.
Presented
in the following table, as of March 31, 2010 and 2009, is an analysis of our
interest rate risk as measured by changes in net portfolio value for
instantaneous and sustained parallel shifts in the yield curve and compared to
our board policy limits. Information is presented in accordance with
Office of Thrift Supervision regulations and based on its
assumptions. The Board limits have been established with
consideration of the dollar impact of various rate changes and our strong
capital position. The Board limit has been established as a minimum percentage
of the Company’s net portfolio value. Our net portfolio values at March 31, 2010
were within the parameters set by the Board of Directors. As
illustrated in the table, net portfolio value is not significantly impacted by
rising or falling rates as of the date indicated.
|
March
31, 2010
|
March
31, 2009
|
|||||||||
|
Change
in
Interest
Rate
(Basis
Points)
|
Board
Limit
NPV
as %
of
Assets
|
$
Change
in
NPV
|
NPV
as %
of
Assets
|
$
Change
in
NPV
|
NPV
as %
of
Assets
|
|||||
|
(Dollars
in Thousands)
|
||||||||||
|
+200
|
7
|
(1,273)
|
11.3%
|
(4,234)
|
10.3%
|
|||||
|
+100
|
8
|
(142)
|
11.4
|
(1,852)
|
10.6
|
|||||
|
-0-
|
9
|
---
|
11.4
|
---
|
10.9
|
|||||
|
-100
|
8
|
(1,280)
|
11.2
|
840
|
11.1
|
|||||
|
-200
|
7
|
---
|
---
|
---
|
---
|
|||||
Generally,
management strives to maintain a neutral position regarding interest rate
risk. In the current interest rate environment, our customers are
interested in obtaining long-term credit products and short-term savings
products. Management has taken action to counter this
trend. A significant effort has been made to reduce the duration and
average life of our interest-earning assets. As of March 31, 2010,
39
approximately
76.4% of our gross loan portfolio consisted of loans which reprice during the
life of the loan. We emphasize adjustable-rate mortgage loans and have increased
our portfolio of short-term consumer loans. Applications are taken
and processed for customers seeking longer term fixed-rate mortgage loans, 15 to
30 years, with the loan being closed and retained by other
organizations.
On the
deposit side, management has worked to reduce the impact of interest rate
changes by emphasizing non-interest bearing or low interest deposit products and
maintaining competitive pricing on longer term certificates of
deposit. We have also used Federal Home Loan Bank advances to provide
funding for loan originations and to provide liquidity as needed.
In
managing our asset/liability mix, depending on the relationship between long-
and short-term interest rates, market conditions and consumer preference, we may
place somewhat greater emphasis on maximizing our net interest income than on
strictly matching the interest rate sensitivity of our assets and liabilities.
We believe the increased net income that may result from an acceptable mismatch
in the actual maturity or repricing of our asset and liability portfolio can
provide sufficient returns to justify the increased exposure to sudden and
unexpected increases in interest rates which may result from such a mismatch. We
have established limits, which may change from time to time, on the level of
acceptable interest rate risk. There can be no assurance, however, that in the
event of an adverse change in interest rates, our efforts to limit interest rate
risk will be successful.
As with
any method of measuring interest rate risk, certain shortcomings are inherent in
the method of analysis presented in the foregoing table. For example,
although certain assets and liabilities may have similar maturities or periods
to repricing, they may react in different degrees to changes in market interest
rates. Also, the interest rates on certain types of assets and
liabilities may fluctuate in advance of changes in market interest rates, while
interest rates on other types may lag behind changes in market rates.
Additionally, certain assets, such as adjustable-rate mortgage loans, have
features which restrict changes in interest rates on a short-term basis and over
the life of the asset. Further, in the event of a change in interest rates,
expected rates of prepayments on loans and early withdrawals from certificates
could likely deviate significantly from those assumed in calculating the
information in the table above. Finally, the ability of many
borrowers to service their debt may decrease in the event of an interest rate
increase. We consider all of these factors in monitoring our exposure
to interest rate risk.
40
Average
Balances, Interest Rates and Yields
The
following table sets forth certain information relating to categories of our
interest-earning assets and interest-bearing liabilities for the periods
indicated. All average balances are computed on a daily
basis. Non-accruing loans have been included in the table as loans
carrying a zero yield. The yields have not been adjusted for tax
preferences.
|
Year
Ended March 31,
|
||||||||||||||||||||||||||||||||||||
|
2010
|
2009
|
2008
|
||||||||||||||||||||||||||||||||||
|
Average
Balance
|
Interest
|
Yield/
Cost
|
Average
Balance
|
Interest
|
Yield/
Cost
|
Average
Balance
|
Interest
|
Yield/
Cost
|
||||||||||||||||||||||||||||
|
(Dollars
in Thousands)
|
||||||||||||||||||||||||||||||||||||
|
Interest-Earning
Assets
|
||||||||||||||||||||||||||||||||||||
|
Loans
|
$ | 494,427 | $ | 28,009 | 5.66 | % | $ | 458,265 | $ | 28,129 | 6.14 | % | $ | 417,897 | $ | 30,248 | 7.24 | % | ||||||||||||||||||
|
Investment
securities and other investments
|
9,656 | 189 | 1.96 | % | 20,172 | 563 | 2.79 | % | 41,064 | 1,996 | 4.86 | % | ||||||||||||||||||||||||
|
Total
interest-earning assets
|
504,083 | 28,198 | 5.59 | % | 478,437 | 28,692 | 6.00 | % | 458,961 | 32,244 | 7.03 | % | ||||||||||||||||||||||||
|
Non-interest
earning assets
|
30,674 | 18,953 | 20,959 | |||||||||||||||||||||||||||||||||
|
Total
Assets
|
$ | 534,757 | $ | 497,390 | $ | 479,920 | ||||||||||||||||||||||||||||||
|
Interest-Bearing
Liabilities
|
||||||||||||||||||||||||||||||||||||
|
Deposits
|
$ | 382,504 | 7,149 | 1.87 | % | $ | 355,599 | 10,497 | 2.95 | % | $ | 337,608 | 12,354 | 3.66 | % | |||||||||||||||||||||
|
FHLB
advances and other borrowings
|
101,072 | 932 | 0.92 | % | 98,293 | 1,963 | 2.00 | % | 98,636 | 4,624 | 4.69 | % | ||||||||||||||||||||||||
|
Total
interest-bearing liabilities
|
483,576 | 8,081 | 1.67 | % | 453,892 | 12,460 | 2.75 | % | 436,244 | 16,978 | 3.89 | % | ||||||||||||||||||||||||
|
Non-interest
bearing Liabilities
|
2,965 | 3,533 | 4,414 | |||||||||||||||||||||||||||||||||
|
Total
Liabilities
|
486,541 | 457,425 | 440,658 | |||||||||||||||||||||||||||||||||
|
Stockholder’s
equity
|
48,216 | 39,965 | 39,262 | |||||||||||||||||||||||||||||||||
|
Total
Liabilities and Stockholders’ Equity
|
$ | 534,757 | $ | 497,390 | $ | 479,920 | ||||||||||||||||||||||||||||||
|
Net interest
income
|
$ | 20,117 | $ | 16,232 | $ | 15,266 | ||||||||||||||||||||||||||||||
|
Interest rate
spread
|
3.92 | % | 3.25 | % | 3.14 | % | ||||||||||||||||||||||||||||||
|
Net
interest-earning assets/net yield
on
interest-earning assets
|
$ | 20,507 | 3.99 | % | $ | 24,545 | 3.39 | % | $ | 22,717 | 3.33 | % | ||||||||||||||||||||||||
|
Percentage
of interest-earning assets
to
interest-bearing liabilities
|
104.24 | % | 105.21 | % | 104.86 | % | ||||||||||||||||||||||||||||||
41
Rate/Volume
Analysis
The
following table describes the extent to which changes in interest rates and
changes in volume of interest-related assets and liabilities have affected our
interest income and expense during the periods indicated. For each
category of interest-earning assets and interest-bearing liabilities,
information is provided on changes attributable to (i) changes in volume (change
in volume multiplied by prior year rate), (ii) changes in rate (change in rate
multiplied by prior year volume), and (iii) total changes in rate and
volume. The combined effect of changes in both volume and rate, which
cannot be separately identified, has been allocated proportionately to the
change due to volume and the change due to rate.
| Year Ended March 31, | ||||||||||||||||||||||||
| 2010 v. 2009 | 2009 v. 2008 | |||||||||||||||||||||||
|
Increase
(Decrease)
Due
to
Volume
|
Rate
|
Total
Increase
(Decrease)
|
Increase
(Decrease)
Due
to
Volume
|
Rate
|
Total
Increase
(Decrease)
|
|||||||||||||||||||
|
(Dollars
in Thousands)
|
||||||||||||||||||||||||
|
Interest-Earning Assets
|
||||||||||||||||||||||||
|
Loans
|
$ | 2,049 | $ | (2,169 | ) | $ | (120 | ) | $ | 2,478 | $ | (4,597 | ) | $ | (2,119 | ) | ||||||||
|
Investment
securities and
other investments
|
(206 | ) | (168 | ) | (374 | ) | (583 | ) | (850 | ) | (1,433 | ) | ||||||||||||
|
Total
Interest-earning
assets
|
$ | 1,843 | $ | (2,337 | ) | $ | (494 | ) | $ | 1,895 | $ | (5,447 | ) | $ | (3,552 | ) | ||||||||
|
Interest-Bearing
Liabilities
|
||||||||||||||||||||||||
|
Deposits
|
$ | 503 | $ | (3,851 | ) | $ | (3,348 | ) | $ | 531 | $ | (2,388 | ) | $ | (1,857 | ) | ||||||||
|
FHLB
advances and other
borrowings
|
25 | (1,056 | ) | (1,031 | ) | (7 | ) | (2,654 | ) | (2,661 | ) | |||||||||||||
|
Total
interest-bearing
liabilities
|
$ | 528 | $ | (4,907 | ) | $ | (4,379 | ) | $ | 524 | $ | (5,042 | ) | $ | (4,518 | ) | ||||||||
|
Net
interest income
|
$ | 3,885 | $ | 966 | ||||||||||||||||||||
Financial
Condition
Total
assets increased $34.5 million, or 6.7%, to $547.2 million at March 31, 2010,
primarily as a result of an increase in loans of $25.2 million. The increase in
assets was funded by a $32.9 million, or 9.0%, increase in deposits. The
increase in deposits is reflected primarily in increased transaction accounts of
$16.5 million, money market accounts of $13.2 million and brokered time deposits
of $12.3 million. Management believes the increase in transaction and money
market deposits is primarily attributable to an increased emphasis on customer
relationships, service and pricing. Management attributes the increase in loans
receivable primarily to excellent customer service and competitive pricing on
both mortgage and consumer loans.
The
Hampton Roads region of the Bank experienced loan growth of $2.3 million,
primarily commercial real estate loans, for the fiscal year ended 2010. The
Shenandoah Valley region of the Bank had loan growth of approximately $23.0
million, primarily commercial real estate loans, secured lines of credit and
home equity loans.
Asset
quality is an important factor in the successful operation of a financial
institution. The loss of interest income and principal that may
result from non-performing assets has an adverse effect on
42
earnings,
while the resolution of those assets requires the use of capital and managerial
resources. At March 31, 2010, non-performing assets, consisting of
non-performing loans, foreclosed real estate and repossessed automobiles,
totaled $17.7 million, or 3.24% of total assets, compared to $9.0 million or
1.75% of total assets at March 31, 2009. Non-performing assets
at March 31, 2010 were comprised primarily of raw land, residential real estate
loans 90 days or more and real estate owned. Based on current market
values of the collateral securing these loans, management anticipates no
significant losses in excess of the reserves for losses previously
recorded. Due to an uncertain real estate market and the economy in
general, no assurances can be given that our level of non-performing assets will
not increase in the future.
Stockholders'
equity increased $2.7 million, or 5.8%, to $49.0 million at March 31, 2010
compared to $46.3 million at March 31, 2009. The increase was the result of
earnings for the year ended March 31, 2010 offset by cash dividend payments on
preferred stock.
Results
of Operations
Our
results of operations depend primarily on the level of our net interest income
and noninterest income and the level of our operating expenses. Net
interest income depends upon the value of interest-earning assets and
interest-bearing liabilities and the interest rate earned or paid on
them.
Comparison
of Years Ended March 31, 2010 and 2009
General. Net
income for the year ended March 31, 2010 was $3.6 million or $0.65 diluted
earnings per common share compared to $(5.8) million or $(1.39) diluted earnings
per common share for the year ended March 31, 2009. Net income increased due
primarily to the securities impairment related to Fannie Mae and Freddie Mac
preferred stock in the March 31, 2009 fiscal year and an increase in net
interest income for the March 31, 2010 fiscal year.
Interest
Income. Total interest income decreased $494,000, or 1.7%, to
$28.2 million for the year ended March 31, 2010 as compared to $28.7 million for
the year ended March 31, 2009. The decrease in total interest income can be
attributed to a decrease in the yield on interest earning assets offset by an
increase in the average dollar volume of interest-earning assets, primarily
$25.3 million in loans receivable. Average yields on total interest-earning
assets decreased 0.41% from 6.00% in fiscal 2009 to 5.59% for the current fiscal
year due primarily to a decrease in loans yields in a decreasing rate
environment.
Interest
Expense. Total interest expense decreased $4.4 million, or
35.1%, to $8.1 million for the year ended March 31, 2010 from $12.5 million for
the year ended March 31, 2009. The decrease in total interest expense is
attributable to a decrease in the cost of interest-bearing liabilities offset by
an increase in the average dollar volume in deposits of $26.9 million. The cost
of funds decreased 1.08% from 2.75% for the year ended March 31, 2009 to 1.67%
for the current year. The increase in deposit balances was due primarily to
increases in transaction accounts for the current fiscal year.
Provision for
Loan Losses. We establish provisions for loan losses, which
are charged to earnings, at a level required to reflect credit losses inherent
in the loan portfolio. In evaluating the level of the allowance for
loan losses, management considers historical loss experience, the types of loans
and the amount of loans in the loan portfolio, adverse situations that may
affect borrowers’ ability to repay, estimated value of any underlying
collateral, peer group data, prevailing economic conditions, and current
factors. Large groups of smaller balance homogeneous loans, such as residential
real estate, small commercial real estate, home equity and consumer loans, are
evaluated in the aggregate using historical loss factors adjusted for current
economic conditions and other relevant data. Larger non-homogeneous
43
loans,
such as commercial loans for which management has concerns about the borrowers’
ability to repay, are evaluated individually, and specific loss allocations are
provided for these loans when necessary.
In the
current economic environment, management has considered the potential impact of
subprime lending in certain areas of the national economy. These circumstances
do not appear to have significantly impacted economic conditions in our market
areas which to date remain stable. We have experienced increases in delinquency
and charge-off rates but at levels generally less than our industry during the
fiscal year ended March 31, 2010. We have maintained experienced and stable
lending personnel during that period.
Based on
management’s evaluation of these factors, the provision for loan losses
decreased $254,000, or 5.9%, to $4.0 million for the fiscal year ended March 31,
2010 from $4.3 million for the fiscal year ended March 31, 2009. The loan loss allowance
for specific impaired loans is dependent primarily on the value of the
collateral relative to the outstanding loan balance. We monitor our loan loss
allowance on a quarterly basis and make allocations as
necessary. Management believes that the level of our loan loss
allowance is adequate. As of March 31, 2010, the total allowance for loan losses
amounted to $8.1 million. At March 31, 2010, our allowance as a
percentage of total loans receivable was 1.58% and as a percentage of total
non-performing loans was 55.29%.
Noninterest
Income. Noninterest income increased $427,000, or 12.5%, to
$3.9 million in fiscal 2009 as compared to $3.3 million for the year ended March
31, 2008. The increase in noninterest income was primarily due to secondary
mortgage loan fees. The increase in Other income is due to the sale of
Fannie Mae and Freddie Mac preferred stock which was Other Than Temporarily
Impaired in the previous fiscal year.
|
Fiscal
2009
|
Fiscal
2008
|
Change
|
||||||||||
|
Loan
fee income
|
$ | 920,013 | $ | 641,952 | $ | 278,061 | ||||||
|
Deposit
fee income
|
2,379,771 | 2,394,740 | (14,969 | ) | ||||||||
|
Other
|
550,421 | 386,158 | 164,263 | |||||||||
|
Total
noninterest income
|
$ | 3,850,205 | $ | 3,422,850 | $ | 427,355 | ||||||
Noninterest
Expense. Total noninterest expense increased $1.5 million, or
11.5%, to $15.0 million for the year ended March 31, 2010 from $13.5 million for
the year ended March 31, 2009, due primarily to increased compensation expense
of $584,000 and increased deposit insurance expense of $781,000 due to premium
increases. The increase in compensation expenses is related to merit pay
increases and additional loan personnel. The increase in other expenses is
primarily due to the increase in nonperforming assets and related collection
expenses.
Taxes. Total
taxes increased $5.1 million to $1.3 million during the year ended March 31,
2010 from $(3.8) million during fiscal 2009. The effective tax rate for the year
ended March 31, 2010 was 27.3%. Income taxes for the March 31, 2010 fiscal year
includes a historic tax credit of $483,000.
Comparison
of Years Ended March 31, 2009 and 2008
General. Net
loss for the year ended March 31, 2009 was $(5.8) million or $(1.39) diluted
earnings per common share compared to $3.8 million income or $0.87 diluted
earnings per common share for the year ended March 31, 2008. Net income
decreased due primarily to securities impairment related to Fannie Mae and
Freddie Mac preferred stock and an increase in our provision for loan
losses.
44
Interest
Income. Total interest income decreased $3.6 million, or
11.0%, to $28.7 million for the year ended March 31, 2009 as compared to $32.2
million for the year ended March 31, 2008. The decrease in total interest income
can be attributed to a decrease in the yield on interest earning assets offset
by an increase in the average dollar volume of interest-earning assets,
primarily $40.0 million in loans receivable. Average yields on total
interest-earning assets decreased 1.03% from 7.03% in fiscal 2008 to 6.00% for
the current fiscal year due primarily to an decrease in loans yields in a
decreasing rate environment.
Interest
Expense. Total interest expense decreased $4.5 million, or
26.6%, to $12.5 million for the year ended March 31, 2009 from $17.0 million for
the year ended March 31, 2008. The decrease in total interest expense is
attributable to a decrease in the cost of interest-bearing liabilities offset by
an increase in the average dollar volume in deposits of $18.0 million. The cost
of funds decreased 1.14% from 3.89% for the year ended March 31, 2008 to 2.75%
for the current year. The increase in deposit balances was due primarily to
increases in time deposits for the current fiscal year.
Provision for
Loan Losses. We experienced moderate increases in delinquency and
charge-off rates but at levels generally less than our industry during the
fiscal year ended March 31, 2009. We maintained experienced and stable lending
personnel during that period. We also evaluated our risk in certain lending
areas and reduced our exposure in automobile lending by $7.6
million.
Based on
management’s evaluation of these factors, the provision for loan losses
increased $3.7 million, or 586.0%, to $4.3 million for the fiscal year ended
March 31, 2009 from $625,000 for the fiscal year ended March 31,
2008. The increase in the provision for fiscal 2009 was due to an
increase in the rate of loan growth and reserves for non-performing assets. We monitor our loan loss
allowance on a quarterly basis and make allocations as
necessary. Management believes that the level of our loan loss
allowance is adequate. As of March 31, 2009, the total allowance for loan losses
amounted to $6.0 million. At March 31, 2009, our allowance as a
percentage of total loans receivable was 1.25% and as a percentage of total
non-performing loans was 78.7%.
Noninterest
Income. Noninterest income increased $80,000, or 2.4%, to $3.4
million in fiscal 2009 as compared to $3.3 million for the year ended March 31,
2008. The increase in noninterest income was primarily due to
overdraft fees.
|
Fiscal
2009
|
Fiscal
2008
|
Change
|
||||||||||
|
Loan
fee income
|
$ | 641,952 | $ | 655,548 | $ | (13,596 | ) | |||||
|
Deposit
fee income
|
2,394,740 | 2,351,277 | 43,463 | |||||||||
|
Other
|
386,158 | 336,211 | 49,947 | |||||||||
|
Total
noninterest income
|
$ | 3,422,850 | $ | 3,343,036 | $ | 79,814 | ||||||
Noninterest
Expense. Total noninterest expense increased $1.2 million, or
9.4%, to $13.4 million for the year ended March 31, 2009 from $12.3 million for
the year ended March 31, 2008, due primarily to increased compensation expense
of $416,000, increased deposit insurance expense of $289,000 due to rate
increases and information technology purchases of $89,000. The increase in
compensation expenses is related to merit pay increases and the one additional
branch location. The increase in data processing is related to software and
computer hardware purchases. The increase in occupancy expense is due to
inclement weather and equipment purchases.
Taxes. Total
taxes decreased $5.6 million to $(3.8) million during the year ended March 31,
2009 from $1.9 million during fiscal 2008.
45
Liquidity
and Capital Resources
Liquidity
represents our ability to meet our on-going funding requirements for contractual
obligations, the credit needs of customers, withdrawal of customers' deposits
and operating expenses Our principal sources of funds are customer deposits,
advances from the Federal Home Loan Bank of Atlanta, amortization and prepayment
of loans, proceeds from the sale of loans and funds provided from
operations. Management maintains investments in liquid assets based
upon its assessment of (i) our need for funds, (ii) expected deposit flows,
(iii) the yields available on short-term liquid assets, (iv) the liquidity of
our loan portfolio and (v) the objectives of our asset/liability management
program. .
Our
dominant source of funds during the year ended March 31, 2010 was from deposits
which increased by $32.9 million. Our cash increased $2.9 million from $2.5
million at March 31, 2009 to $5.4 million at March 31, 2010.
At March
31, 2010, we had commitments to purchase or originate $5.2 million of
loans. Certificates of deposit scheduled to mature in one year
or less at March 31, 2009 totaled $225.9 million. Based on our historical
experience, management believes that a significant portion of such deposits will
remain with us. Management further believes that loan repayments and
other sources of funds will be adequate to meet our foreseeable short- and
long-term liquidity needs.
At March
31, 2010, we had tangible and core capital of 8.90% of adjusted total assets,
which was in excess of their respective requirements of 1.5% and
4.0%. We also had risk-based capital of 11.25% of risk weighted
assets, which also exceeded its requirement of 8.0%. The Bank was considered
“well capitalized” as of March 31, 2010. Regulatory capital is discussed further
in Note 10 of the Notes to Consolidated Financial Statements contained in Item 8
of this report.
Contractual
Obligations and Off-Balance Sheet Arrangements
As of
March 31, 2010, we have not participated in any unconsolidated entities or
financial partnerships, often referred to as structured finance or special
entities. We do have significant commitments to fund loans in the ordinary
course of business. Such commitments and resulting off-balance sheet risk are
further discussed in Note 14 of the Consolidated Financial Statements contained
in Item 8 of this report.
The
following table presents our contractual cash obligations, excluding deposit
obligations, as of March 31, 2010.
|
Total
|
Less
than
1
year
|
1-3
years
|
3-5
years
|
More
than
5
years
|
||||||||||||||||
|
Operating
Leases
|
$ | 844,839 | $ | 195,141 | $ | 336,628 | $ | 117,320 | $ | 195,750 | ||||||||||
|
Long-Term
Debt
|
--- | --- | --- | --- | --- | |||||||||||||||
|
Total
|
$ | 844,839 | $ | 195,141 | $ | 336,628 | $ | 117,320 | $ | 195,750 | ||||||||||
Impact
of Inflation and Changing Prices
The
consolidated financial statements and related data presented herein have been
prepared in accordance with accounting principles generally accepted in the
United States of America which require the measurement of financial position and
results of operations in terms of historical dollars without considering changes
in the relative purchasing power of money over time because of inflation. Unlike
most industrial companies, virtually all of the assets and liabilities of a
financial institution are monetary
46
in
nature. As a result, interest rates have a more significant impact on
a financial institution's performance than the effects of general levels of
inflation. Interest rates do not necessarily move in the same
direction or the same magnitude as the price of goods and
services. In the current interest-rate environment, equity, maturity
structure and quality of our assets and liabilities are critical to the
maintenance of acceptable performance levels.
Recent
Accounting Pronouncements
For a
discussion of recent accounting pronouncements implemented by us during fiscal 2010
and new pronouncements which will be implemented in the future, see “Summary of
Accounting Policies” in our Consolidated Financial Statements contained in Item
8 of this report.
ITEM 7A. QUANTITATIVE AND QUALITATIVE DISCLOSURES ABOUT
MARKET RISK
See “Management’s Discussion and Analysis of Financial
Condition and Results of Operations – Assset/Liability Management” in Item 7 of
this report.
ITEM
8. FINANCIAL STATEMENTS AND SUPPLEMENTARY
DATA
47
Community
Financial Corporation
and
Subsidiary
Contents
|
Report of Independent Registered Public Accounting
Firm
|
49 | |
|
|
|
|
|
Consolidated Financial Statements
|
||
|
Consolidated Balance
Sheets
|
50
|
|
|
|
|
|
|
Consolidated Statements of
Operations
|
51
|
|
| Consolidated Statements of Stockholders' Equity | 53 | |
| Consolidated Statements of Cash Flows | 54 | |
| Summary of Accounting Policies | 56 | |
| Notes to Consolidated Financial Statements | 65 | |
48

REPORT
OF INDEPENDENT REGISTERED
PUBLIC
ACCOUNTING FIRM
To the
Board of Directors and Stockholders
Community
Financial Corporation
Staunton,
Virginia
We have
audited the accompanying consolidated balance sheets of Community Financial
Corporation and Subsidiary as of March 31, 2010 and 2009, and the related
consolidated statements of operations, stockholders’ equity and cash flows for
each of the three years in the period ended March 31, 2010. These
financial statements are the responsibility of the Corporation’s
management. Our responsibility is to express an opinion on these
financial statements based on our audits.
We
conducted our audits in accordance with the standards of the Public Company
Accounting Oversight Board (United States). Those standards require
that we plan and perform the audit to obtain reasonable assurance about whether
the financial statements are free of material misstatement. An audit
includes examining, on a test basis, evidence supporting the amounts and
disclosures in the financial statements. An audit also includes
assessing the accounting principles used and significant estimates made by
management, as well as evaluating the overall financial statement
presentation. We believe that our audits provide a reasonable basis
for our opinion.
In our
opinion, the consolidated financial statements referred to above present fairly,
in all material respects, the financial position of Community Financial
Corporation and Subsidiary as of March 31, 2010 and 2009, and the results
of their operations and their cash flows for each of the three years in the
period ended March 31, 2010, in conformity with U.S. generally accepted
accounting principles.
We were
not engaged to examine management’s assessment of the effectiveness of Community
Financial Corporation and Subsidiary’s internal control over financial reporting
as of March 31, 2010 included in Management’s Annual Report on the Internal
Control over Financial Reporting and, accordingly, we do not express an opinion
thereon.

Winchester,
Virginia
June 28,
2010
50 South
Cameron Street
P.O. Box
2560
Winchester,
VA 22604
(540)
662-3417 Offices located in:
Winchester, Middleburg, Leesburg, Culpeper, and Richmond, Virginia
FAX (540)
662-4211 Member: American Institute of
Certified Public Accountants / Virginia Society of Certified Public
Accountants
49
Community
Financial Corporation
and
Subsidiary
Consolidated
Balance Sheets
|
March
31,
|
2010
|
2009
|
||||||
|
Assets
|
||||||||
|
Cash
(including interest bearing deposits of $3,824,672
|
||||||||
|
and $512,258)
|
$ | 5,374,665 | $ | 2,482,182 | ||||
|
Securities
|
||||||||
|
Held to maturity (fair value
approximates $1,698,155
|
||||||||
|
and
$1,711,187)
|
1,698,000 | 1,700,010 | ||||||
|
Available for sale, at fair
value
|
73,397 | 207,347 | ||||||
|
Restricted
investment in Federal Home Loan Bank stock, at cost
|
6,183,600 | 5,238,600 | ||||||
|
Loans
receivable, net of allowance for loan losses of
|
||||||||
|
$8,052,875 and
$5,955,847
|
502,125,963 | 476,950,379 | ||||||
|
Real
estate owned, net of valuation allowance of $1,052,569
and
$608,002
|
3,182,419 | 1,400,192 | ||||||
|
Property
and equipment, net
|
8,920,769 | 8,351,679 | ||||||
|
Accrued
interest receivable
|
2,128,611 | 1,976,475 | ||||||
|
Prepaid
expenses and other assets
|
17,492,388 | 14,416,972 | ||||||
|
Total
assets
|
$ | 547,179,812 | $ | 512,723,836 | ||||
|
Liabilities and Stockholders’
Equity
|
||||||||
|
Liabilities
|
||||||||
|
Deposits
|
$ | 398,420,330 | $ | 365,505,504 | ||||
|
Borrowings
|
96,250,000 | 95,000,000 | ||||||
|
Securities sold under agreements
to repurchase
|
845,503 | 1,475,594 | ||||||
|
Advance payments by borrowers for
taxes and insurance
|
192,360 | 179,575 | ||||||
|
Other liabilities
|
2,459,744 | 4,226,600 | ||||||
|
Total
liabilities
|
498,167,937 | 466,387,273 | ||||||
|
Commitments
and Contingencies
|
- | - | ||||||
|
Stockholders’
Equity
|
||||||||
|
Preferred stock, $.01 par value,
$1,000 liquidation value,
|
||||||||
|
authorized 3,000,000 shares,
12,643 outstanding
|
12,643,000 | 12,643,000 | ||||||
|
Common stock, $.01 par value,
10,000,000 authorized
|
||||||||
|
shares, 4,361,658 and 4,361,658
shares outstanding
|
43,617 | 43,617 | ||||||
|
Warrants
|
603,153 | 603,153 | ||||||
|
Discount
on preferred stock
|
(448,337 | ) | (568,973 | ) | ||||
|
Additional paid-in
capital
|
5,577,958 | 5,569,558 | ||||||
|
Retained earnings
|
31,259,441 | 28,420,439 | ||||||
|
Accumulated other comprehensive
(loss), net
|
(666,957 | ) | (374,231 | ) | ||||
|
Total
stockholders’ equity
|
49,011,875 | 46,336,563 | ||||||
|
Total
liabilities and stockholders’ equity
|
$ | 547,179,812 | $ | 512,723,836 | ||||
See accompanying summary of accounting
policies and notes to consolidated financial statements.
50
Community
Financial Corporation
and
Subsidiary
Consolidated
Statements of Operations
|
Year Ended March
31,
|
2010
|
2009
|
2008
|
|||||||||
|
Interest
and dividend income
|
||||||||||||
|
Loans
|
$ | 28,009,388 | $ | 28,128,744 | $ | 30,247,693 | ||||||
|
Investment
securities
|
49,114 | 102,707 | 827,673 | |||||||||
|
Other investments
|
139,862 | 460,431 | 1,168,394 | |||||||||
|
Total
interest and dividend income
|
28,198,364 | 28,691,882 | 32,243,760 | |||||||||
|
Interest
expense
|
||||||||||||
|
Deposits
|
7,149,169 | 10,497,223 | 12,354,281 | |||||||||
|
Borrowed money
|
932,177 | 1,962,933 | 4,623,819 | |||||||||
|
Total
interest expense
|
8,081,346 | 12,460,156 | 16,978,100 | |||||||||
|
Net
interest income
|
20,117,018 | 16,231,726 | 15,265,660 | |||||||||
|
Provision
for loan losses
|
4,031,454 | 4,285,389 | 624,717 | |||||||||
|
Net
interest income after provision for
|
||||||||||||
|
loan losses
|
16,085,564 | 11,946,337 | 14,640,943 | |||||||||
|
Noninterest
income
|
||||||||||||
|
Service charges, fees and
commissions
|
3,299,784 | 3,036,692 | 3,006,825 | |||||||||
|
Other
|
550,421 | 386,158 | 336,211 | |||||||||
|
Other-than-temporary
impairment of
equity
securities
|
- | (11,535,669 | ) | - | ||||||||
|
Total
noninterest income
|
3,850,205 | (8,112,819 | ) | 3,343,036 | ||||||||
|
Noninterest
expense
|
||||||||||||
|
Compensation and employee
benefits
|
8,292,343 | 7,708,019 | 7,291,661 | |||||||||
|
Occupancy
|
1,719,320 | 1,537,291 | 1,450,116 | |||||||||
|
Data processing
|
1,486,174 | 1,495,990 | 1,406,813 | |||||||||
|
Advertising
|
490,110 | 477,852 | 438,815 | |||||||||
|
Professional fees
|
361,690 | 556,117 | 448,725 | |||||||||
|
Deposit insurance
|
1,108,652 | 327,523 | 38,851 | |||||||||
|
Other
|
1,536,503 | 1,346,559 | 1,217,551 | |||||||||
|
Total
noninterest expense
|
14,994,792 | 13,449,351 | 12,292,532 | |||||||||
51
Community
Financial Corporation
and
Subsidiary
Consolidated
Statements of Operations
(continued)
|
Year
Ended March 31,
|
2010
|
2009
|
2008
|
|||||||||
|
Income
(loss) before income taxes
|
$ | 4,940,977 | $ | (9,615,833 | ) | $ | 5,691,447 | |||||
|
Income
tax expense (benefit)
|
1,349,189 | (3,792,549 | ) | 1,855,625 | ||||||||
|
Net
income (loss)
|
3,591,788 | (5,823,284 | ) | 3,835,822 | ||||||||
|
Amortization
of discount on preferred stock
|
(120,636 | ) | (34,180 | ) | - | |||||||
|
Cumulative
dividends on preferred stock
|
(632,150 | ) | (176,334 | ) | - | |||||||
|
Net
income (loss) available to common
|
||||||||||||
|
Stockholders
|
$ | 2,839,002 | $ | (6,033,798 | ) | $ | 3,835,822 | |||||
|
Earnings
(loss) per common share
|
||||||||||||
|
Basic
|
$ | 0.65 | $ | (1.39 | ) | $ | 0.89 | |||||
|
Diluted
|
$ | 0.65 | $ | (1.39 | ) | $ | 0.87 | |||||
See
accompanying summary of accounting policies and notes to consolidated financial
statements.
52
Community
Financial Corporation
and
Subsidiary
Consolidated
Statements of Stockholders' Equity
|
Accumulated
|
||||||||||||||||||||||||||||||||
|
Discount
on
|
Additional
|
Other
Compre-
|
Total
|
|||||||||||||||||||||||||||||
|
Preferred
|
Common
|
Preferred
|
Paid-in
|
Retained
|
hensive
Income
|
Stockholders’
|
||||||||||||||||||||||||||
|
Stock
|
Stock
|
Warrants
|
Stock
|
Capital
|
Earnings
|
(Loss),
Net
|
Equity
|
|||||||||||||||||||||||||
|
Balance,
March 31, 2007
|
$ | - | $ | 42,957 | $ | - | $ | - | $ | 5,097,321 | $ | 32,277,332 | $ | 1,152,802 | $ | 38,570,412 | ||||||||||||||||
|
Comprehensive
income:
|
||||||||||||||||||||||||||||||||
|
Net
income
|
- | - | - | - | - | 3,835,822 | - | 3,835,822 | ||||||||||||||||||||||||
|
Change in unrealized
gain (loss) on
available for sale securities,
net of tax
|
- | - | - | - | - | - | (2,888,476 | ) | (2,888,476 | ) | ||||||||||||||||||||||
|
Pension
liability adjustment, net of tax
|
||||||||||||||||||||||||||||||||
| - | - | - | - | - | - | 12,798 | 12,798 | |||||||||||||||||||||||||
|
Total
comprehensive income
|
960,144 | |||||||||||||||||||||||||||||||
|
Cash
dividends on common stock,
$.260 per
share
|
- | - | - | - | - | (1,120,639 | ) | - | (1,120,639 | ) | ||||||||||||||||||||||
|
Exercise
of stock options
|
- | 483 | - | - | 375,042 | - | - | 375,525 | ||||||||||||||||||||||||
|
Repurchase
of common stock
|
- | (80 | ) | - | - | (80,659 | ) | - | - | (80,739 | ||||||||||||||||||||||
|
Balance,
March 31, 2008
|
- | 43,360 | - | - | 5,391,704 | 34,992,515 | (1,722,876 | ) | 38,704,703 | |||||||||||||||||||||||
|
Comprehensive
loss:
|
||||||||||||||||||||||||||||||||
|
Net
loss
|
- | - | - | - | - | (5,823,284 | ) | - | (5,823,284 | ) | ||||||||||||||||||||||
|
Change in unrealized
loss on
available for sale
securities,
net of tax
|
- | - | - | - | - | - | 1,353,616 | 1,353,616 | ||||||||||||||||||||||||
|
Pension
liability adjustment,
net of tax
|
||||||||||||||||||||||||||||||||
| - | - | - | - | - | - | (4,971 | ) | (4,971 | ) | |||||||||||||||||||||||
|
Total
comprehensive loss
|
(4,474,639 | ) | ||||||||||||||||||||||||||||||
|
Cash
dividends on common stock,
$0.13 per
share
|
||||||||||||||||||||||||||||||||
| - | - | - | - | - | (565,814 | ) | - | (565,814 | ) | |||||||||||||||||||||||
|
Preferred
stock issuance
|
12,643,000 | - | 603,153 | (603,153 | ) | - | - | - | 12,643,000 | |||||||||||||||||||||||
|
Reduction
due to change in pension measurement date, net of tax
|
- | - | - | - | - | (50,464 | ) | - | (50,464 | ) | ||||||||||||||||||||||
|
Amortization
of discount on preferred
stock
|
- | - | - | 34,180 | - | (34,180 | ) | - | - | |||||||||||||||||||||||
|
Dividend
on preferred stock
|
- | - | - | - | - | (98,334 | ) | - | (98,334 | ) | ||||||||||||||||||||||
|
Stock-based
compensation expense
|
- | - | - | - | 6,826 | - | - | 6,826 | ||||||||||||||||||||||||
| - | - | - | - | |||||||||||||||||||||||||||||
|
Exercise
of stock options
|
- | 257 | - | - | 171,028 | - | - | 171,285 | ||||||||||||||||||||||||
|
Balance,
March 31, 2009
|
12,643,000 | 43,617 | 603,153 | (568,973 | ) | 5,569,558 | 28,420,439 | (374,231 | ) | 46,336,563 | ||||||||||||||||||||||
|
Comprehensive
income:
|
||||||||||||||||||||||||||||||||
|
Net
income
|
- | - | - | - | - | 3,591,788 | - | 3,591,788 | ||||||||||||||||||||||||
|
Pension
liability adjustment, net of tax
|
- | - | - | - | - | - | (292,726 | ) | (292,726 | ) | ||||||||||||||||||||||
|
Total
comprehensive income
|
3,299,062 | |||||||||||||||||||||||||||||||
|
Amortization
of discount on preferred
stock
|
||||||||||||||||||||||||||||||||
| - | - | - | 120,636 | - | (120,636 | ) | - | - | ||||||||||||||||||||||||
|
Stock-based
compensation
|
- | - | - | - | 8,400 | - | - | 8,400 | ||||||||||||||||||||||||
|
Dividend
on preferred stock
|
- | - | - | - | - | (632,150 | ) | - | (632,150 | ) | ||||||||||||||||||||||
|
Balance,
March 31, 2010
|
$ | 12,643,000 | $ | 43,617 | $ | 603,153 | $ | (448,337 | ) | $ | 5,577,958 | $ | 31,259,411 | $ | (666,957 | ) | $ | 49,011,875 | ||||||||||||||
See accompanying summary of accounting
policies and notes to consolidated financial statements.
53
Community
Financial Corporation
and
Subsidiary
Consolidated
Statements of Cash Flows
|
Year
Ended March 31,
|
2010
|
2009
|
2008
|
|||||||||
|
Operating
activities
|
||||||||||||
|
Net income (loss)
|
$ | 3,591,788 | $ | (5,823,284 | ) | $ | 3,835,822 | |||||
|
Adjustments to reconcile net
income (loss) to
|
||||||||||||
|
net cash provided by operating
activities
|
||||||||||||
|
Provision for loan
losses
|
4,031,454 | 4,285,389 | 624,717 | |||||||||
|
Depreciation
|
603,873 | 585,777 | 613,008 | |||||||||
|
Stock-based compensation
expense
|
8,400 | 6,826 | - | |||||||||
|
Amortization of premium and
accretion
|
||||||||||||
|
of discount on securities,
net
|
10 | 207 | 5,758 | |||||||||
|
Decrease in net deferred
loan
|
||||||||||||
|
origination costs
Securities
impairment
|
30,912 - | 193,534 11,535,669 | 115,508 - | |||||||||
|
Deferred income tax expense
(benefit)
|
1,778,645 | (5,851,976 | ) | (155,330 | ) | |||||||
|
(Increase) decrease in other
assets
|
(4,826,785 | ) | 420,522 | (532,555 | ) | |||||||
|
Increase (decrease) in other
liabilities
|
(2,226,209 | ) | 1,430,351 | (288,591 | ) | |||||||
|
Net
cash provided by operating activities
|
2,992,088 | 6,783,015 | 4,218,337 | |||||||||
|
Investing
activities
|
||||||||||||
|
Proceeds from maturities of held
to
|
||||||||||||
|
maturity
securities
|
1,500,000 | 4,840,000 | 21,140,000 | |||||||||
|
Proceeds from redemption of
available
|
||||||||||||
|
for sale
securities
|
133,950 | - | 28,852 | |||||||||
|
Purchase of held to maturity
securities
|
(1,498,000 | ) | (3,600,000 | ) | (500,000 | ) | ||||||
|
Net increase in
loans
|
(33,469,313 | ) | (46,384,656 | ) | (39,508,792 | ) | ||||||
|
Purchase of property and
equipment
|
(1,172,963 | ) | (1,013,975 | ) | (515,218 | ) | ||||||
|
Proceeds from sale of real estate
owned
|
2,449,136 | 1,321,568 | 435,767 | |||||||||
|
Purchase of FHLB
stock
|
(945,000 | ) | (27,800 | ) | (388,700 | ) | ||||||
|
Net
cash (used in)
|
||||||||||||
|
investing
activities
|
(33,002,190 | ) | (44,864,863 | ) | (19,308,091 | ) | ||||||
54
Community
Financial Corporation
and
Subsidiary
Consolidated
Statements of Cash Flows
(continued)
|
Year
Ended March 31,
|
2010
|
2009
|
2008
|
|||||||||
|
Financing
activities
|
||||||||||||
|
Net increase in certificates of
deposit
|
$ | 3,218,975 | $ | 10,491,810 | $ | 21,090,110 | ||||||
|
Net increase (decrease) in savings
and
|
||||||||||||
|
checking deposits
|
29,695,851 | 4,282,860 | (896,980 | ) | ||||||||
|
Proceeds from issuance of common
stock
|
- | 171,285 | 375,525 | |||||||||
|
Proceeds from issuance of
preferred stock
|
- | 12,643,000 | - | |||||||||
|
Repurchase of common
stock
|
- | - | (80,739 | ) | ||||||||
|
Increase (decrease) in securities
sold under
|
||||||||||||
|
agreements to
repurchase
|
(630,091 | ) | (1,358,818 | ) | 1,094,722 | |||||||
|
Dividends paid
|
(632,150 | ) | (664,148 | ) | (1,120,639 | ) | ||||||
|
Net change in
borrowings
|
1,250,000 | (1,000,000 | ) | 7,000,000 | ||||||||
|
Net
cash provided by financing activities
|
32,902,585 | 24,565,989 | 27,461,999 | |||||||||
|
Increase
(decrease) in cash and cash
|
||||||||||||
|
equivalents
|
2,892,483 | (13,515,859 | ) | 12,372,245 | ||||||||
|
Cash and cash
equivalents – beginning of year
|
2,482,182 | 15,998,041 | 3,625,796 | |||||||||
|
Cash and cash
equivalents – end of year
|
$ | 5,374,665 | $ | 2,482,182 | $ | 15,998,041 | ||||||
|
Supplemental
Disclosure of Cash Flow
|
||||||||||||
|
Information
|
||||||||||||
|
Cash
payments of interest expense
|
$ | 9,827,121 | $ | 12,891,364 | $ | 17,409,308 | ||||||
|
Cash
payments of income taxes
|
$ | 2,852,283 | $ | 1,307,487 | $ | 1,806,188 | ||||||
|
Supplemental
Schedule of Non-Cash
|
||||||||||||
|
Investing and Financing
Activities
|
||||||||||||
|
Net
change in unrealized gain (loss) on
|
||||||||||||
|
securities
available for sale
|
$ | - | $ | 2,180,606 | $ | (4,658,833 | ) | |||||
|
Pension
liability adjustment
|
$ | (472,138 | ) | $ | (8,019 | ) | $ | 14,788 | ||||
|
Transfers
from loans to real estate acquired
|
||||||||||||
|
through
foreclosure
|
$ | 4,231,363 | $ | 2,129,151 | $ | 847,164 | ||||||
55
Community
Financial Corporation
and
Subsidiary
Summary
of Accounting Policies
Principles
of Consolidation
The accompanying consolidated financial statements include the accounts of Community Financial Corporation (the "Corporation") and its wholly-owned subsidiary, Community Bank (the "Bank"). All material intercompany accounts and transactions have been eliminated in consolidation.
Nature
of Business and Regulatory Environment
The Bank
is a federally chartered savings association and the primary asset of the
Corporation. The Corporation provides a full range of banking
services to individual and corporate customers primarily in the Shenandoah
Valley and Hampton Roads regions of Virginia through its wholly-owned
subsidiary.
The
Office of Thrift Supervision ("OTS") is the primary regulator for federally
chartered savings associations, as well as well as savings and loan holding
companies.
The
Bank's deposits are insured up to applicable limits by the Deposit Insurance
Fund ("DIF"), which is administered by the Federal Deposit Insurance Corporation
("FDIC"). The FDIC has specific authority to prescribe and enforce
such regulations and issue such orders as it deems necessary to prevent actions
or practices by savings associations that pose a serious threat to the
DIF.
The
Federal Deposit Insurance Corporation Improvement Act of 1991 ("FDICIA") was
effective January 1, 1993. FDICIA contained provisions which allow
regulators to impose prompt corrective action on undercapitalized institutions
in accordance with a categorized capital-based system.
Estimates
In
preparing consolidated financial statements in conformity with U.S. generally
accepted accounting principles, management is required to make estimates and
assumptions that affect the reported amounts of assets and liabilities as of the
date of the balance sheet and reported amounts of revenues and expenses during
the reporting period. Actual results could differ from those
estimates. Material estimates that are particularly susceptible to
significant change in the near term relate to the determination of the allowance
for loan losses, the valuation of deferred tax assets, the valuation of real
estate owned, and the fair value of financial instruments.
Cash and Cash
Equivalents
For
purposes of reporting cash flows, cash and cash equivalents include cash on
hand, amounts due from banks, interest-bearing deposits and federal funds
sold.
Securities
Securities may be
classified as either trading, held to maturity or available for
sale. Trading securities are held principally for resale and recorded
at their fair values. Unrealized gains and losses on trading
securities are included immediately in operations. Held to maturity
securities are those which the Corporation has the positive intent and ability
to hold to maturity and are reported at amortized cost. Available for
sale securities consist of
56
Community
Financial Corporation
and
Subsidiary
Summary
of Accounting Policies
Securities
(continued)
securities not classified
as trading securities nor as held to maturity securities. Unrealized
holding gains and losses on available for sale securities are excluded from
operations and reported in accumulated other comprehensive income
(loss). Gains and losses on the sale of available for sale securities
are recorded on the trade date and are determined using the specific
identification method. Premiums and discounts on securities are
recognized in interest income using the interest method over the period to
maturity.
Management
evaluates securities for other-than-temporary impairment on a quarterly basis,
and more frequently when economic or market concerns warrant such
evaluation. Impairment of securities occurs when the fair value of a
security is less than its amortized cost. For debt securities,
impairment is considered other-than-temporary and recognized in its entirety in
net income if either (i) the Corporation intends to sell the security or (ii) it
is more likely than not that the Corporation will be required to sell the
security before recovery of its amortized cost basis. If, however,
the Corporation does not intend to sell the security and it is not
more-than-likely that the Corporation will be required to sell the security
before recovery, management must determine what portion of the impairment is
attributable to a credit loss, which occurs when the amortized cost of the
security exceeds the present value of the cash flows expected to be collected
from the security. If there is no credit loss, there is no
other-than-temporary impairment. If there is a credit loss,
other-than-temporary impairment exists, and the credit loss must be recognized
in net income and the remaining portion of impairment must be
recognized in other comprehensive income.
For
equity securities, impairment is considered to be other-than-temporary based on
the Corporation's ability and intent to hold the investment until a recovery of
the fair value. Other-than-temporary impairment of an equity security
results in a write-down that must be included in income.
Loans
Receivable
Loans
receivable consists primarily of long-term real estate loans secured by first
deeds of trust on single family residences, other residential property,
commercial property and land located primarily in the state of
Virginia. Interest income on mortgage loans is recorded when earned
and is recognized based on the level yield method. The Corporation
provides an allowance for accrued interest deemed to be uncollectible, which is
netted against accrued interest receivable in the consolidated balance
sheets.
The
Corporation defers loan origination and commitment fees, net of certain direct
loan origination costs, and the net deferred fees are amortized into interest
income over the lives of the related loans as yield adjustments. Any
unamortized net fees on loans fully repaid or sold are recognized as income in
the year of repayment or sale.
Corporation
becomes aware that the borrower has entered bankruptcy proceedings, or in
situations in which the loans have developed inherent problems prior to being 90
days delinquent that indicate payments of principal or interest will not be made
in full. Whenever the accrual of interest is stopped, previously
accrued but uncollected interest income is reversed. Thereafter,
interest is recognized only as cash is received until the loan is reinstated to
accrual status. Loans are returned to accrual status when all the
principal and interest amounts contractually due are brought current and future
payments are reasonably assured.
57
Community
Financial Corporation
and
Subsidiary
Summary
of Accounting Policies
Allowance for Loan
Losses
The
allowance for loan losses is maintained at a level considered by management to
be adequate to absorb future loan losses currently inherent in the loan
portfolio. Management's assessment of the adequacy of the allowance
is based upon type and volume of the loan portfolio, past loan loss experience,
existing and anticipated economic conditions, and other factors which deserve
current recognition in estimating future loan losses. This evaluation
is inherently subjective as it requires estimates that are susceptible to
significant revision as more information becomes available. Additions
to the allowance are charged to operations. Subsequent recoveries, if
any, are credited to the allowance. Loans are charged-off partially
or wholly at the time management determines collectibility is not
probable. Management's assessment of the adequacy of the allowance is
subject to evaluation and adjustment by the Corporation's
regulators.
The
allowance consists of specific, general and unallocated
components. The specific component relates to loans that are
classified as either doubtful or substandard. For such loans that are
also classified as impaired, an allowance is established when the discounted
cash flows (or collateral value or observable market price) of the impaired loan
is lower than the carrying value of that loan. A loan is considered
impaired when, based on current information and events, it is probable that the
Corporation will be unable to collect the scheduled payments of principal or
interest when due according to the contractual terms of the loan
agreement. The general component covers non-classified and special
mention loans and is based on historical loss experience adjusted for
qualitative factors. An unallocated component is maintained to cover
uncertainties that could affect management’s estimate of probable
losses. The unallocated component of the allowance reflects the
margin of imprecision inherent in the underlying assumptions used in the
methodologies for estimating specific and general losses in the
portfolio.
The
Corporation uses real estate appraisal, future cash flows or other appropriate
methods to determine the value of impaired loans. With the use of these methods,
the Corporation provides valuation allowances for anticipated losses when
management determines that a decline in the value of the collateral or expected
cash flows has occurred. Updated appraisals are obtained periodically
and in those instances where management has reason to believe a material change
may have occurred in the fair value of the collateral. Evaluation of
impairment requires judgment and estimates, management uses all relevant and
timely information available to determine specific reserves on impaired loans,
including appraisals and cash flow analysis. Loans are partially or
completely charged off in the period when they are deemed uncollectible in
accordance with ASC 310-35.
Large
groups of smaller balance homogeneous loans are collectively evaluated for
impairment. Accordingly, the Corporation does not separately identify
individual consumer and residential loans for impairment disclosures, unless
such loans are the subject of a restructuring agreement. These loans
were included in the allowance calculation as pools of loans in the general
component with allocations based on historic charge-offs and qualitative factor
adjustments deemed appropriate by management for these types of loans and their
nonaccrual status.
58
Community
Financial Corporation
and
Subsidiary
Summary
of Accounting Policies
Real
Estate Owned
Real
estate acquired through foreclosure is initially recorded at the lower of fair
value, less selling costs, or the balance of the loan on the property at the
date of foreclosure. Costs relating to the development and
improvement of property are capitalized, whereas those relating to holding the
property are charged to expense.
Valuations
are periodically performed by management, and an allowance for losses is
established by a charge to operations if the carrying value of a property
exceeds its estimated net realizable value.
Property
and Equipment
Land is
carried at cost. Property and equipment is stated at cost less
accumulated depreciation. Provisions for depreciation are computed
using the straight-line method over the estimated useful lives of the individual
assets. Expenditures for betterments and major renewals are
capitalized and ordinary maintenance and repairs are charged to operations as
incurred. Estimated useful lives are three to ten years for furniture
and equipment and five to fifty years for buildings and
improvements.
Income
Taxes
Deferred
income tax assets and liabilities are determined using the balance sheet
method. Under this method, the net deferred tax asset or liability is
determined based on the tax effects of the temporary differences between the
book and tax bases of the various balance sheet assets and liabilities and gives
current recognition to changes in tax rates and laws.
When tax returns
are filed, it is highly certain that some positions taken would be sustained
upon examination by the taxing authorities, while others are subject to
uncertainty about the merits of the position taken or the amount of the position
that would be ultimately sustained. The benefit of a tax position is
recognized in the financial statements in the period during which, based on all
available evidence, management believes it is more likely than not that the
position will be sustained upon examination, including the resolution of appeals
or litigation processes, if any. Tax positions taken are not offset
or aggregated with other positions. Tax positions that meet the
more-likely-than-not recognition threshold are measured as the largest amount of
tax benefit that is more than 50 percent likely of being realized upon
settlement with the applicable taxing authority. The portion of the
benefits associated with tax positions taken that exceeds the amount measured as
described above is reflected as a liability for unrecognized tax benefit in the
accompanying consolidated balance sheets along with any associated interest and
penalties that would be payable to the taxing authorities upon
examination. Interest and penalties associated with unrecognized tax
benefits are classified as additional income taxes in the consolidated
statements of operations.
59
Community
Financial Corporation
and
Subsidiary
Summary
of Accounting Policies
Earnings
Per Common Share
Basic
earnings per common share represents income available to common shareholders
divided by the weighted-average number of common shares outstanding during the
period. Diluted earnings per common share reflects additional common
shares that would have been outstanding if dilutive potential common shares had
been issued, as well as any adjustment to income that would result from the
assumed issuance. Potential common shares that may be issued by the
Corporation relate solely to outstanding stock options and are determined using
the treasury stock method.
Stock-Based
Compensation Plan
The
Corporation recognizes the costs resulting from all share-based payments in the
financial statements. Share-based compensation is estimated at the
date of grant using the Black-Scholes option valuation model for determining
fair value. The cost is recognized over the period the employee is
required to provide services for the award.
Advertising
Costs
The
Corporation follows the policy of charging the costs of advertising to expense
as incurred.
Comprehensive
Income
Accounting
principles generally require that recognized revenue, expenses, gains and losses
be included in net income. Although certain changes in assets and
liabilities, such as unrealized gains and losses on available for sale
securities and pension liability adjustments, are reported as a separate
component of the equity section of the balance sheet, such items, along with net
income are components of comprehensive income.
Fair
Value Measurements
Fair
value of financial instruments are estimated using relevant market information
and other assumptions, as more fully disclosed in Note 5. Fair value
estimates involve uncertainties and matters of significant
judgment. Changes in assumptions or in market conditions could
significantly affect estimates.
Reclassifications
Certain
reclassifications have been made to prior period balances to conform to the
current year presentation.
60
Community
Financial Corporation
and
Subsidiary
Summary
of Accounting Policies
(continued)
Recent
Accounting Pronouncements
In June
2009, the Financial Accounting Standards Board (FASB) issued new accounting
guidance related to U.S. GAAP (FASB ASC 105, Generally Accepted Accounting
Principles). This guidance establishes FASB Accounting Standards
Codification (ASC) as the source of authoritative U.S. GAAP recognized by FASB
to be applied by nongovernmental entities. Rules and interpretive
releases of the Securities and Exchange Commission (SEC) under authority of
federal securities laws are also sources of authoritative U.S. GAAP for SEC
registrants. FASB ASC supersedes all existing non-SEC accounting and
reporting standards. All other nongrandfathered, non-SEC accounting
literature not included in FASB ASC has become nonauthoritative. FASB
will no longer issue new standards in the form of Statements, FASB Staff
Positions or Emerging Issues Task Force Abstracts. Instead, it will
issue Accounting Standards Updates (ASUs), which will serve to update FASB ASC,
provide background information about the guidance and provide the basis for
conclusions on the changes to FASB ASC. FASB ASC is not intended to
change U.S. GAAP or any requirements of the SEC.
The
Corporation adopted new guidance impacting FASB Topic 805: Business Combinations (“Topic
805”) on January 1, 2009. This guidance requires the acquiring entity in a
business combination to recognize the full fair value of assets acquired and
liabilities assumed in the transaction (whether a full or partial acquisition);
establishes the acquisition-date fair value as the measurement objective for all
assets acquired and liabilities assumed; requires expensing of most transaction
and restructuring costs; and requires the acquirer to disclose to investors and
other users all of the information needed to evaluate and understand the nature
and financial effect of the business combination. The adoption of the new
guidance did not have a material impact on the Corporation’s consolidated
financial statements.
In April
2009, the FASB issued new guidance impacting Topic 805. This guidance addresses
application issues raised by preparers, auditors, and members of the legal
profession on initial recognition and measurement, subsequent measurement and
accounting, and disclosure of assets and liabilities arising from contingencies
in a business combination. This guidance was effective for business combinations
entered into on or after January 1, 2009. This guidance did not have a
material impact on the Corporation’s consolidated financial
statements.
In
December 2008, the FASB issued new guidance impacting FASB Topic 715-20: Compensation Retirement Benefits –
Defined Benefit Plans – General. The objectives of this guidance are to
provide users of the financial statements with more detailed information related
to the major categories of plan assets, the inputs and valuation techniques used
to measure the fair value of plan assets and the effect of fair value
measurements using significant unobservable inputs (Level 3) on changes in plan
assets for the period, as well as how investment allocation decisions are made,
including the factors that are pertinent to an understanding of investment
policies and strategies. The disclosures about plan assets required by this
guidance are included in Note 12 of the Corporation’s consolidated financial
statements.
In April
2009, the FASB issued new guidance impacting FASB Topic 820: Fair Value Measurements and
Disclosures (“Topic 820”). This provides additional guidance for
estimating fair value when the volume and level of activity for the
asset or liability have significantly decreased. This also includes guidance on
identifying circumstances that indicate a transaction is not orderly and
requires additional disclosures of valuation inputs and
61
Community
Financial Corporation
and
Subsidiary
Summary
of Accounting Policies
(continued)
Recent
Accounting Pronouncements (continued)
techniques
in interim periods and defines the major security types that are required to be
disclosed. This guidance was effective for interim and annual periods ending
after June 15, 2009, and should be applied prospectively. The adoption of the
standard did not have a material impact on the Corporation’s consolidated
financial statements.
In April
2009, the FASB issued new guidance impacting FASB Topic 320-10: Investments – Debt and Equity
Securities. This guidance amends GAAP for debt securities to make the
guidance more operational and to improve the presentation and disclosure of
other-than-temporary impairments on debt and equity securities in the financial
statements. This guidance was effective for interim and annual periods ending
after June 15, 2009, with earlier adoption permitted for periods ending after
March 15, 2009. The Corporation did not have any cumulative effect adjustment
related to the adoption of this guidance.
In May
2009, the FASB issued new guidance impacting FASB Topic 855: Subsequent Events. This
provides guidance on management’s assessment of subsequent events that occur
after the balance sheet date through the date that the financial statements are
issued. This guidance is generally consistent with current accounting practice.
In addition, it requires certain additional disclosures. This guidance was
effective for periods ending after June 15, 2009 and had no impact on the
Corporation’s consolidated financial statements.
In August
2009, the FASB issued new guidance impacting Topic 820 (“Fair Value Measurements
and Disclosures – Overall). This guidance is intended to reduce ambiguity in
financial reporting when measuring the fair value of liabilities. This guidance
was effective for the first reporting period after issuance and had no impact on
the Corporation’s consolidated financial statements.
In
September 2009, the FASB issued new guidance impacting Topic 820. This creates a
practical expedient to measure the fair value of an alternative investment that
does not have a readily determinable fair value. This guidance also requires
certain additional disclosures. This guidance is effective for interim and
annual periods ending after December 15, 2009. The Corporation does not
expect the adoption of the new guidance to have a material impact on its
consolidated financial statements.
In
January 2010, the FASB issued Accounting Standards Update No. 2010-01 (ASU
2010-01), “Equity (Topic 505): Accounting for Distributions to Shareholders with
Components of Stock and Cash – a consensus of the FASB Emerging Issues Task
Force.” ASU 2010-01 clarifies that the stock portion of a distribution to
shareholders that allows them to elect to receive cash or stock with a potential
limitation on the total amount of cash that all shareholders can elect to
receive in the aggregate is considered a share issuance that is reflected in EPS
prospectively and is not a stock dividend. ASU 2010-01 is effective
for interim and annual periods ending on or after December 15, 2009 and should
be applied on a retrospective basis. The Corporation does not expect
the adoption of ASU 2010-01 to have a material impact on its consolidated
financial statements.
62
Community
Financial Corporation
and
Subsidiary
Summary
of Accounting Policies
(continued)
Recent
Accounting Pronouncements (continued)
In
January 2010, the FASB issued Accounting Standards Update No. 2010-02 (ASU
2010-02), “Consolidation (Topic 810): Accounting and reporting for Decreases in
Ownership of a Subsidiary – a Scope Clarification.” ASU 2010-02 amends Subtopic
810-10 to address implementation issues related to changes in ownership
provisions including clarifying the scope of the decrease in ownership and
additional disclosures. ASU 2010-02 is effective beginning in the
period that an entity adopts Statement 160. If an entity has
previously adopted Statement 160, ASU 2010-02 is effective beginning in the
first interim or annual reporting period ending on or after December 15, 2009
and should be applied retrospectively to the first period Statement 160 was
adopted. The Corporation does not expect the adoption of ASU
2010-02 to have a material impact on its consolidated financial
statements.
In
June 2009, the FASB issued new guidance relating to the accounting for
transfers of financial assets. The new guidance, which was issued as SFAS
No. 166, “Accounting for Transfers of Financial Assets, an amendment to
SFAS No. 140”, was adopted into Codification in December 2009 through the
issuance of ASU 2009-16. The new standard provides guidance to improve the
relevance, representational faithfulness, and comparability of the information
that an entity provides in its financial statements about a transfer of
financial assets; the effects of a transfer on its financial position, financial
performance, and cash flows; and a transferor’s continuing involvement, if any,
in transferred financial assets. The Corporation adopted the new
guidance in 2010 with no impact to the consolidated financial
statements.
In June
2009, the FASB issued new guidance relating to the variable interest
entities. The new guidance, which was issued as SFAS No. 167,
“Amendments to FASB Interpretation No. 46(R),” was adopted into
Codification in December 2009. The objective of the guidance is to improve
financial reporting by enterprises involved with variable interest entities and
to provide more relevant and reliable information to users of financial
statements. SFAS No. 167 is effective as of January 1, 2010. The
Corporation does not expect the adoption of the new guidance to have a material
impact on its consolidated financial statements.
In
October 2009, the FASB issued Accounting Standards Update No. 2009-15 (ASU
2009-15), “Accounting for Own-Share Lending Arrangements in Contemplation of
Convertible Debt Issuance or Other Financing.” ASU 2009-15 amends Subtopic
470-20 to expand accounting and reporting guidance for own-share lending
arrangements issued in contemplation of convertible debt issuance. ASU 2009-15
is effective for fiscal years beginning on or after December 15, 2009 and
interim periods within those fiscal years for arrangements outstanding as of the
beginning of those fiscal years. The Corporation does not expect the adoption of
ASU 2009-15 to have a material impact on its consolidated financial
statements.
63
Community
Financial Corporation
and
Subsidiary
Summary
of Accounting Policies
(continued)
Recent
Accounting Pronouncements (continued)
In
January 2010, the FASB issued Accounting Standards Update No. 2010-06, “Fair
Value Measurements and Disclosures (Topic 820): Improving Disclosures about Fair
Value Measurements.” ASU 2010-06 amends Subtopic 820-10 to clarify existing
disclosures, require new disclosures, and includes conforming amendments to
guidance on employers’ disclosures about postretirement benefit plan assets. ASU
2010-06 is effective for interim and annual periods beginning after December 15,
2009, except for disclosures about purchases, sales, issuances, and settlements
in the roll forward of activity in Level 3 fair value measurements. Those
disclosures are effective for fiscal years beginning after December 15, 2010 and
for interim periods within those fiscal years. The Corporation does
not expect the adoption of ASU 2010-01 to have a material impact on its
consolidated financial statements.
In
January 2010, the FASB issued ASU 2010-04, Accounting for Various Topics –
Technical Corrections to SEC Paragraphs. ASU 2010-04 makes technical
corrections to existing SEC guidance including the following topics: accounting
for subsequent investments, termination of an interest rate swap, issuance of
financial statements - subsequent events, use of residential method to value
acquired assets other than goodwill, adjustments in assets and liabilities for
holding gains and losses, and selections of discount rate used for measuring
defined benefit obligation. The adoption of the new guidance did not have a
material impact on the Corporation’s consolidated financial
statements.
In
February 2010, the FASB issued Accounting Standards Update No. 2010-08,
“Technical Corrections to Various Topics.” ASU 2010-08 clarifies guidance on
embedded derivatives and hedging. ASU 2010-08 is effective for interim and
annual periods beginning after December 15, 2009. The Corporation does not
expect the adoption of ASU 2010-01 to have a material impact on its consolidated
financial statements.
In
February 2010, the FASB issued Accounting Standards Update No. 2010-09,
“Subsequent Events (Topic 855): Amendments to Certain Recognition and Disclosure
Requirements.” ASU 2010-09 addresses both the interaction of the
requirements of Topic 855 with the SEC’s reporting requirements and the intended
breadth of the reissuance disclosures provisions related to subsequent
events. An entity that is an SEC filer is not required to disclose
the date through which subsequent events have been evaluated. ASU
2010-09 is effective immediately. The adoption of the new
guidance did not have a material impact on the Corporation’s consolidated
financial statements.
64
Community
Financial Corporation
and
Subsidiary
Notes
to Consolidated Financial Statements
1. Securities
A summary
of the amortized cost and estimated market values of securities is as
follows:
|
March
31, 2010
|
||||||||||||||||
|
Gross
Unrealized
Gains
|
Gross
Unrealized
Losses
|
Estimated
Market
Value
|
||||||||||||||
|
Amortized
Cost
|
||||||||||||||||
|
Held
to Maturity
|
||||||||||||||||
|
United States government
and
|
||||||||||||||||
|
agency
obligations
|
$ | 1,500,000 | $ | 2,655 | $ | 2,500 | $ | 1,500,155 | ||||||||
|
Other
|
198,000 | - | - | 198,000 | ||||||||||||
| 1,698,000 | 2,655 | 2,500 | 1,698,155 | |||||||||||||
|
Available
for Sale
|
||||||||||||||||
|
Equity securities
|
73,397 | - | - | 73,397 | ||||||||||||
| $ | 1,771,397 | $ | 2,655 | $ | 2,500 | $ | 1,771,552 | |||||||||
|
March
31, 2009
|
||||||||||||||||
|
Gross
Unrealized
Gains
|
Gross
Unrealized
Losses
|
Estimated
Market
Value
|
||||||||||||||
|
Amortized
Cost
|
||||||||||||||||
|
Held
to Maturity
|
||||||||||||||||
|
United States government
and
|
||||||||||||||||
|
agency
obligations
|
$ | 1,500,000 | $ | 10,595 | $ | - | $ | 1,510,595 | ||||||||
|
State and municipal
obligations
|
200,010 | 582 | - | 200,592 | ||||||||||||
| 1,700,010 | 11,177 | - | 1,711,187 | |||||||||||||
|
Available
for Sale
|
||||||||||||||||
|
Equity securities
|
207,347 | - | - | 207,347 | ||||||||||||
| $ | 1,907,357 | $ | 11,177 | $ | - | $ | 1,918,534 | |||||||||
65
Community
Financial Corporation
and
Subsidiary
Notes
to Consolidated Financial Statements
(continued)
1. Securities
(continued)
The
amortized cost and estimated market value of securities at March 31, 2010, by
contractual maturity, are as follows:
|
Estimated
Market
Value
|
||||||||
|
Amortized
Cost
|
||||||||
|
Held
to Maturity
|
||||||||
|
Due in one year or
less
|
$ | 198,000 | $ | 198,000 | ||||
|
Due in one through five
years
|
1,500,000 | 1,500,155 | ||||||
| 1,698,000 | 1,698,155 | |||||||
|
Available
for Sale
|
||||||||
|
Equity securities
|
73,397 | 73,397 | ||||||
| $ | 1,771,397 | $ | 1,771,552 | |||||
Securities
having a market value of $1,500,155 and $1,009,710 at March 31, 2010 and 2009,
respectively, were pledged by the Corporation for purposes required by
law.
The
Corporation had no securities with gross unrealized losses at March 31,
2009. Information pertaining to securities with gross unrealized
losses at March 31, 2010, aggregated by investment category and length of time
that individual securities have been in a continuous loss position,
follows:
| March 31, 2010 | ||||||||||||||||
| Less Than Twelve Months | Over Twelve Months | |||||||||||||||
|
Gross
Unrealized
Losses
|
Estimated
Market
Value
|
Gross
Unrealized
Losses
|
Estimated
Market
Value
|
|||||||||||||
|
Held
to Maturity
|
||||||||||||||||
|
United
States government and
|
||||||||||||||||
|
agency
obligations
|
$ | 2,500 | $ | 997,500 | $ | - | $ | - | ||||||||
66
Community
Financial Corporation
and
Subsidiary
Notes
to Consolidated Financial Statements
(continued)
1. Securities
(continued)
United States government and agency
obligations. The unrealized loss on the one investment in
direct obligations of U.S. government agencies was caused by interest rate
increases. The contractual terms of this investment does not permit
the issuer to settle at a price less than the amortized cost bases of the
investment. Because the Corporation does not intend to sell the
investment and it is not more likely than not that the Corporation will be
required to sell the investment before recovery of the amortized cost basis,
which may be maturity, the Corporation does not consider this investment to be
other-than-temporarily impaired at March 31, 2010.
During
the year ended March 31, 2009 due to the conservatorship of Fannie Mae and
Freddie Mac in September 2008 and the related restrictions on its outstanding
preferred stock (including the elimination of dividends), the Corporation
recorded an other-than-temporary impairment (OTTI) charge with respect to the
Fannie Mae and Freddie Mac preferred stock it owned of $11.5 million. The OTTI
charge was based on the closing quoted stock market values on March 31, 2009.
The Corporation used guidance in ASC 320, Investments – Debt and Equity
Securities, to determine the OTTI.
The
Corporation's investment in FHLB stock totaled $6,183,600 at March 31,
2010. FHLB stock is generally viewed as a long-term investment
and as a restricted security, which is carried at cost, because there is no
market for the stock, other than the FHLBs or member
institutions. Therefore, when evaluating FHLB stock for impairment,
its value is based on the ultimate recoverability of the par value rather than
by recognizing temporary declines in value. Despite the FHLB's
temporary suspension of repurchases of excess capital stock in 2009, we do not
consider this investment to be other-than-temporarily impaired at March 31, 2010
and no impairment has been recognized. FHLB stock is shown in
restricted investments on the balance sheet and is not part of the AFS
securities portfolio.
2. Loans
Receivable, Net
Loans
receivable are summarized as follows:
|
March
31,
|
2010
|
2009
|
||||||
|
Residential
real estate
|
$ | 144,951,059 | $ | 140,063,979 | ||||
|
Commercial
real estate
|
171,805,427 | 154,781,353 | ||||||
|
Construction
|
63,806,643 | 62,887,605 | ||||||
|
Commercial
business
|
53,402,539 | 53,436,237 | ||||||
|
Consumer
|
91,412,757 | 85,968,679 | ||||||
| 525,378,425 | 497,137,853 | |||||||
|
Less:
|
||||||||
|
Loans in process
|
16,158,845 | 15,221,797 | ||||||
|
Deferred loan (costs),
net
|
(959,258 | ) | (990,170 | ) | ||||
|
Allowance for loan
losses
|
8,052,875 | 5,955,847 | ||||||
| 23,252,462 | 20,187,474 | |||||||
| $ | 502,125,963 | $ | 476,950,379 | |||||
Loans
serviced for others amounted to approximately $236,639 and $294,357 at March 31,
2010 and 2009, respectively. The loans are not included in the
accompanying consolidated balance sheets.
67
Community
Financial Corporation
and
Subsidiary
Notes
to Consolidated Financial Statements
(continued)
2. Loans
Receivable, Net (continued)
A summary
of the allowance for loan losses is as follows:
|
Year
Ended March 31,
|
2010
|
2009
|
2008
|
|||||||||
|
Balance
at beginning of year
|
$ | 5,955,847 | $ | 3,214,771 | $ | 3,078,397 | ||||||
|
Provision
for loan loss
|
4,031,454 | 4,285,389 | 624,717 | |||||||||
|
Loans
charged-off
|
(2,105,988 | ) | (1,682,067 | ) | (623,055 | ) | ||||||
|
Recoveries
of loans previously charged-off
|
171,562 | 137,754 | 134,712 | |||||||||
|
Balance
at end of year
|
$ | 8,052,875 | $ | 5,955,847 | $ | 3,214,771 | ||||||
Impaired
loans with a valuation allowance totaled $11,209,986 and $9,792,151 at March 31,
2010 and 2009, respectively. The valuation allowance related to these
impaired loans was $3,878,534 and $1,873,646 at March 31, 2010 and 2009,
respectively. Impaired loans without a valuation allowance totaled
$3,713,249 and $28,771 as of March 31, 2010 and 2009, respectively.
The
average investment in impaired loans for the years ended March 31, 2010, 2009
and 2008 totaled $13,392,119, $2,784,423 and $871,220,
respectively. No interest income was recognized on these
loans.
No
additional funds are committed to be advanced in connection with impaired
loans. There were no loans past due 90 days and still accruing
interest.
Impaired
loans include loans modified in troubled debt restructurings where concessions
have been granted to borrowers experiencing financial
difficulties. These concessions could include a reduction in the
interest rate on the loan, payment extensions, forgiveness of principal,
forbearance or other actions intended to maximize collection. At
March 31, 2010, the Corporation had $3,458,156 of mortgage loans and $255,093 of
consumer loans that were modified in troubled debt restructurings and
impaired.
Nonaccrual
loans excluded from impaired loan disclosure amounted to $7,487,929, $3,050,662
and $1,026,298 at March 31, 2010, 2009 and 2008, respectively. If
interest on these loans had been accrued, such income would have approximated
$668,028, $222,629 and $44,880 for the years ended March 31, 2010, 2009 and
2008, respectively.
3. Property
and Equipment
Property
and equipment are summarized as follows:
|
March
31,
|
2010
|
2009
|
||||||
|
Buildings
|
$ | 8,848,863 | $ | 7,867,829 | ||||
|
Land
and improvements
|
2,662,512 | 2,843,628 | ||||||
|
Furniture
and equipment
|
5,881,673 | 5,363,503 | ||||||
|
Construction
in progress
|
3,500 | 157,923 | ||||||
| 17,396,548 | 16,232,883 | |||||||
|
Less
accumulated depreciation and amortization
|
8,475,779 | 7,881,204 | ||||||
|
Property
and equipment, net
|
$ | 8,920,769 | $ | 8,351,679 | ||||
Depreciation
expense for the years ended March 31, 2010, 2009 and 2008 amounted to $603,873,
$585,777 and $613,008, respectively.
68
Community
Financial Corporation
and
Subsidiary
Notes
to Consolidated Financial Statements
(continued)
4. Deposits
Deposits are summarized as follows:
|
March
31,
|
2010
|
2009
|
||||||
|
Demand
deposits
|
||||||||
|
Noninterest
bearing
|
$ | 28,465,460 | $ | 25,445,489 | ||||
|
Savings accounts
|
31,586,397 | 27,320,324 | ||||||
|
NOW accounts
|
40,378,534 | 31,180,035 | ||||||
|
Money market deposit
accounts
|
38,465,825 | 25,254,517 | ||||||
|
Total
demand deposits
|
138,896,216 | 109,200,365 | ||||||
|
Time
deposits
|
259,524,114 | 256,305,139 | ||||||
| $ | 398,420,330 | $ | 365,505,504 | |||||
The
aggregate amount of time deposit accounts with a minimum denomination of
$100,000 was $98,256,051 and $82,222,204 at March 31, 2010 and 2009,
respectively.
Time
deposits mature as follows:
|
Year
Ending March 31,
|
||||
|
2011
|
$ | 225,925,134 | ||
|
2012
|
13,447,344 | |||
|
2013
|
8,270,023 | |||
|
2014
|
5,097,565 | |||
|
2015
|
6,784,048 | |||
| $ | 259,524,114 | |||
At March
31, 2010 and 2009, overdraft demand deposits reclassified to loans totaled
$75,906 and $88,493, respectively.
Brokered
deposits totaled $22,468,768 and $10,187,193 at March 31, 2010 and 2009,
respectively.
69
Community
Financial Corporation
and
Subsidiary
Notes
to Consolidated Financial Statements
(continued)
4. Deposits
(continued)
Interest
expense on deposits is summarized as follows:
|
Year
Ended March 31,
|
2010
|
2009
|
2008
|
|||||||||
|
Time
deposits
|
$ | 6,246,167 | $ | 9,569,305 | $ | 11,300,885 | ||||||
|
Money
market deposit and NOW accounts
|
633,449 | 602,623 | 686,406 | |||||||||
|
Savings
|
269,553 | 325,295 | 366,990 | |||||||||
| $ | 7,149,169 | $ | 10,497,223 | $ | 12,354,281 | |||||||
5. Fair
Value Measurements
The
Corporation uses fair value measurements to record fair value adjustments to
certain assets and liabilities and to determine fair value
disclosures. The fair value of a financial instrument is the price
that would be received to sell an asset or paid to transfer the liability in an
orderly transaction between market participants at the measurement
date. Fair value is best determined based upon quoted market
prices. However, in many instances, there are no quoted market prices
for the Corporation's various financial instruments. In cases where
quoted market prices are not available, fair values are based on estimates using
present value or other valuation techniques. Those techniques are
significantly affected by the assumptions used, including the discount rate and
estimates of future cash flows. Accordingly, the fair value estimates
may not be realized in an immediate settlement of the instrument.
The
recent fair value guidance provides a consistent definition of fair value, which
focuses on exit price in an orderly transaction (that is, not a forced
liquidation or distressed sale) between market participants at the measurement
date under current market conditions. If there has been a
significant decrease in the volume and level of activity for the asset or
liability, a change in valuation technique or the use of multiple valuation
techniques may be appropriate. In such instances, determining the
price at which willing market participants would transact at the measurement
date under current market conditions depends on the facts and circumstances and
requires the use of significant judgment. The fair value is a
reasonable point within the range that is most representative of fair value
under current market conditions.
Fair
Value Hierarchy
In
accordance with this guidance, the Corporation groups financial assets and
financial liabilities generally measured at fair value in three levels, based on
the markets in which the assets and liabilities are traded and the reliability
of the assumptions used to determine the fair value.
|
Level
1 –
|
Valuation
is based on quoted prices in active markets for identical assets and
liabilities.
|
|
Level
2 –
|
Valuation
is based on observable inputs including quoted prices in active markets
for similar assets and liabilities, quoted prices for identical or similar
assets and liabilities in less active markets, and model-based valuation
techniques for which significant assumptions can be derived primarily from
or corroborated by observable data in the
market.
|
70
Community
Financial Corporation
and
Subsidiary
Notes
to Consolidated Financial Statements
(continued)
5. Fair
Value Measurements (continued)
|
Level
3 –
|
Valuation
is based on model-based techniques that use one or more significant inputs
or assumptions that are unobservable in the
market.
|
The
following describes the valuation techniques used by the Corporation to measure
certain financial assets and liabilities recorded at fair value on a recurring
basis in the financial statements:
Securities available for
sale: Securities available for sale are recorded at fair value on a
recurring basis. Fair value measurement is based upon quoted market prices, when
available (Level 1). If quoted market prices are not available, fair values are
measured utilizing independent valuation techniques of identical or similar
securities for which significant assumptions are derived primarily from or
corroborated by observable market data. Third party vendors compile prices from
various sources and may determine the fair value of identical or similar
securities by using pricing models that considers observable market data (Level
2).
The
following table presents the balances of financial assets and liabilities
measured at fair value on a recurring basis as of March 31, 2010:
|
Fair
Value Measurements Using
|
||||||||||||||||
|
Description
|
Balance
|
Quoted
Prices
in
Active
Markets
for
Identical
Assets
(Level
1)
|
Significant
Other
Observable
Inputs
(Level
2)
|
Significant
Unobservable
Inputs
(Level
3)
|
||||||||||||
|
March
31, 2010:
|
||||||||||||||||
|
Available-for-sale
securities
|
$ | 73,397 | $ | - | $ | 73,397 | $ | - | ||||||||
|
March
31, 2009:
|
||||||||||||||||
|
Available-for-sale
securities
|
$ | 207,347 | $ | - | $ | 207,347 | $ | - | ||||||||
Certain
assets are measured at fair value on a nonrecurring basis in accordance with
generally accepted accounting principles. Adjustments to the fair value of these
assets usually result from the application of lower-of-cost-or-market accounting
or write-downs of individual assets.
The
following describes the valuation techniques used by the Corporation to measure
certain assets recorded at fair value on a nonrecurring basis in the financial
statements:
Impaired Loans: Loans are designated as impaired
when, in the judgment of management based on current information and events, it
is probable that all amounts due according to the contractual terms of the loan
agreement will not be collected. The measurement of loss associated with
impaired loans can be based on either the observable market price of the
loan, the fair value of the collateral or discounted cash flow
analyses. Fair value is
71
Community
Financial Corporation
and
Subsidiary
Notes
to Consolidated Financial Statements
(continued)
5. Fair
Value Measurements (continued)
Impaired Loans
(continued): typically measured based on the value of the collateral
securing the loans. Collateral may be in the form of real
estate or business assets including equipment, inventory, and accounts receivable. The vast majority of the
collateral is real estate. The value of real estate collateral is determined
utilizing an income or market valuation approach based on an appraisal conducted
by an independent, licensed appraiser outside of the Corporation using
observable market data (Level 2). However, if the collateral is a
house or building in the process of construction or if an appraisal of the real
estate property is over two years old, then the fair value is considered Level
3. The value of business equipment is based upon an outside appraisal if deemed
significant, or the net book value on the applicable business’ financial
statements if not considered significant using observable market data. Likewise,
values for inventory and accounts receivables collateral are based on financial
statement balances or aging reports (Level 3). Loans valued using
discounted cash flow analyses are considered Level 3. Impaired loans
allocated to the Allowance for Loan Losses are measured at fair value on a
nonrecurring basis. Any fair value adjustments are recorded in the period
incurred as provision for loan losses on the Consolidated Statements of
Operations.
Real Estate Owned:
Foreclosed assets and repossessions are adjusted to fair value upon transfer of
the loans to foreclosed assets and repossessions. Subsequently,
foreclosed assets and repossessions are carried at the lower of carrying value
or fair value. Fair value is based upon independent market prices,
appraised values of the collateral or management's estimation of the value of
the collateral. When the fair value of the collateral is based on an
observable market price or a current appraised value, the Corporation records
the foreclosed asset as nonrecurring Level 2. When an appraised value
is not available or management determines the fair value of the collateral is
further impaired below the appraised value and there is no observable market
price, the Corporation records the foreclosed asset or repossession as
nonrecurring Level 3.
The
following table summarizes the Corporation’s assets that were measured at fair
value on a nonrecurring basis during the period.
|
Carrying Value
|
||||||||||||||||
|
Description
|
Balance
|
Quoted
Prices
in
Active
Markets
for
Identical
Assets
(Level 1)
|
Significant
Other
Observable
Inputs
(Level 2)
|
Significant
Unobservable
Inputs
(Level 3)
|
||||||||||||
|
March
31, 2010
|
||||||||||||||||
|
Assets
|
||||||||||||||||
|
Impaired
loans net of
|
||||||||||||||||
|
valuation
allowance
|
$ | 7,331,452 | $ | - | $ | - | $ | 7,331,452 | ||||||||
|
Real
estate owned
|
$ | 3,182,419 | $ | - | $ | 855,000 | $ | 2,327,419 | ||||||||
|
March
31, 2009
|
||||||||||||||||
|
Assets
|
||||||||||||||||
|
Impaired
loans net of
|
||||||||||||||||
|
valuation
allowance
|
$ | 7,918,505 | $ | - | $ | - | $ | 7,918,505 | ||||||||
|
Real
estate owned
|
$ | 1,400,192 | $ | - | $ | 889,215 | $ | 510,977 | ||||||||
72
Community
Financial Corporation
and
Subsidiary
Notes
to Consolidated Financial Statements
(continued)
5. Fair
Value Measurements (continued)
The
estimated fair values of the Corporation's financial instruments are as
follows:
|
March
31,
|
2010
|
2009
|
||||||||||||||
|
(In
Thousands)
|
Carrying
Amount
|
Fair
Value
|
Carrying
Amount
|
Fair
Value
|
||||||||||||
|
Financial
assets
|
||||||||||||||||
|
Cash and cash
equivalents
|
$ | 5,375 | $ | 5,375 | $ | 2,482 | $ | 2,482 | ||||||||
|
Securities
|
1,771 | 1,772 | 1,907 | 1,919 | ||||||||||||
|
Federal Home Loan Bank stock,
restricted
|
6,184 | 6,184 | 5,239 | 5,239 | ||||||||||||
|
Loans, net
|
502,126 | 514,522 | 476,950 | 487,788 | ||||||||||||
|
Accrued interest
receivable
|
2,129 | 2,129 | 1,976 | 1,976 | ||||||||||||
|
Financial
liabilities
|
||||||||||||||||
|
Deposits
|
$ | 398,420 | $ | 403,330 | $ | 365,506 | $ | 373,896 | ||||||||
|
Borrowings
|
96,250 | 96,550 | 95,000 | 95,164 | ||||||||||||
|
Securities sold under agreements
to repurchase
|
846 | 846 | 1,476 | 1,476 | ||||||||||||
|
Accrued interest
payable
|
148 | 148 | 1,894 | 1,894 | ||||||||||||
Accounting
guidance excludes certain financial instruments and all non-financial
instruments from its disclosure requirements. Accordingly, the
aggregate fair value amounts presented may not necessarily represent the
underlying fair value of the Corporation.
The
following methods and assumptions were used to estimate the fair value of each
class of financial instruments for which it is practicable to estimate that
value.
Cash and cash equivalents
For those
short-term investments, the carrying amount is a reasonable estimate of fair
value.
Securities
Fair
values for securities, excluding Federal Home Loan Bank stock, are based on
quoted market prices or dealer quotes. If a quoted market price is
not available, fair value is estimated using quoted market prices for similar
securities. The carrying value of Federal Home Loan Bank stock
approximates fair value based on the redemption provisions of the Federal Home
Loan Bank.
73
Community
Financial Corporation
and
Subsidiary
Notes
to Consolidated Financial Statements
(continued)
5. Fair
Value of Financial Instruments (continued)
Loans receivable
For
variable-rate loans that reprice frequently and with no significant change in
credit risk, fair values are based on carrying values. Fair values
for certain mortgage loans (e.g., one-to-four family residential), credit card
loans, and other consumer loans are based on quoted market prices of similar
loans sold in conjunction with securitization transactions, adjusted for
differences in loan characteristics. Fair values for other loans
(e.g., commercial real estate and investment property mortgage loans, commercial
and industrial loans) are estimated using discounted cash flow analyses, using
interest rates currently being offered for loans with similar terms to borrowers
of similar credit quality. Fair values for non-performing loans are
estimated using discounted cash flow analyses or underlying collateral values,
where applicable.
Deposit
liabilities
The fair
values disclosed for demand deposits (e.g., interest and non-interest checking,
passbook savings, and certain types of money market accounts) are, by
definition, equal to the amount payable on demand at the reporting date (i.e.,
their carrying amounts). The carrying amounts of variable-rate,
fixed-term money market accounts and certificates of deposit approximate their
fair values at the reporting date. Fair values for fixed-rate
certificates of deposit are estimated using a discounted cash flow calculation
that applies interest rates currently being offered on certificates to a
schedule of aggregated expected monthly maturities on time
deposits.
Borrowings
For
advances that mature within one year of the balance sheet date, carrying value
is considered a reasonable estimate of fair value. The fair values of
all other advances are estimated using discounted cash flow analysis based on
the Corporation's current incremental borrowing rate for similar types of
advances.
Securities
sold under agreements to repurchase
Securities
sold under agreements to repurchase are treated as short-term borrowings and the
carrying value approximates fair value.
Accrued
interest
The
carrying amounts of accrued interest approximate fair
value.
74
Community
Financial Corporation
and
Subsidiary
Notes
to Consolidated Financial Statements
(continued)
5. Fair
Value of Financial Instruments (continued)
Off-balance sheet instruments
The fair
value of commitments to extend credit is estimated using the fees currently
charged to enter into similar agreements, taking into account the remaining
terms of the agreements and the present credit worthiness of the
counterparties. For fixed-rate loan commitments, fair value also
considers the difference between current levels of interest rates and the
committed rates. The fair value of standby letters of credit is based
on fees currently charged for similar agreements or on the estimated cost to
terminate them or otherwise settle the obligations with the counterparties at
the reporting date. At March 31, 2010 and 2009, the fair value of
loan commitments and standby letters of credit were deemed
immaterial.
6. Borrowings
Advances
from the Federal Home Loan Bank and other borrowings are summarized as
follows:
|
Due in year
ending March 31,
|
|||||
|
2011
|
$ | 96,250,000 | |||
The
weighted average interest rate on borrowings was 0.90% and 1.00% at March 31,
2010 and 2009, respectively. The fixed-rate FHLB advances are
collateralized by the investment in FHLB stock and the Corporation's portfolio
of first mortgage loans, multi-family, commercial real estate, second mortgage
and home equity lines of credit under a Blanket Floating Lien
Agreement. Value of this collateral as of March 31, 2010 was
$135,864,031.
Information
related to borrowing activity of the borrowings is as
follows:
|
Year
Ended March 31,
|
2010
|
2009
|
2008
|
|||||||||
|
Maximum
amount outstanding during the year
|
$ | 117,625,000 | $ | 113,000,000 | $ | 105,000,000 | ||||||
|
Average
amount outstanding during the year
|
$ | 100,477,527 | $ | 96,204,110 | $ | 96,049,162 | ||||||
|
Average
interest rate during the year
|
0.92 | % | 2.02 | % | 4.75 | % | ||||||
During
the year ended March 31, 2009, the Corporation became non-compliant on a line of
credit of $5 million due to being less than “well capitalized” related to the
OTTI charge on its Fannie Mae and Freddie Mac preferred stock. The Corporation
has entered into a Waiver and Loan Modification agreement with the lender to
waive the previous non-compliance violations and has agreed to quarterly
principal payments of $125,000. The term of the loan has been
extended to October 30, 2010. The balance remaining to be paid on
this line of credit was $250,000 at March 31, 2010. The Company also
regained “well capitalized” status subsequent to the OTTI charge and was in
compliance with all loan covenants at March 31, 2010.
75
Community
Financial Corporation
and
Subsidiary
Notes
to Consolidated Financial Statements
(continued)
7. Securities
Sold Under Agreements to Repurchase
Securities sold under agreements to repurchase are secured
borrowings that generally mature within one to four days from the transaction
date. These amounts are recorded at the amount of cash received in
connection with the transaction. The Corporation may be required to
provide additional collateral based on the fair value of the underlying
securities.
The
following is a summary of certain information regarding the Corporation’s
repurchase agreements:
|
Year
Ended March 31,
|
2010
|
2009
|
2008
|
|||||||||
|
Balance
at end of year
|
$ | 845,503 | $ | 1,475,594 | $ | 2,834,412 | ||||||
|
Weighted
average interest rate during the year
|
1.01 | % | 1.00 | % | 2.54 | % | ||||||
|
Average
amount outstanding during the year
|
$ | 1,080,290 | $ | 2,089,259 | $ | 2,586,392 | ||||||
|
Maximum
amount outstanding at any month end
|
||||||||||||
|
during the year
|
$ | 1,694,704 | $ | 3,010,248 | $ | 3,921,662 | ||||||
8. Income
Taxes
The
Corporation files income tax returns in the U.S. federal jurisdiction and the
state of Virginia. With few exceptions, the Corporation is no longer
subject to U.S. federal, state and local income tax examinations by tax
authorities for years prior to 2006.
Deferred
tax assets (liabilities), included in the consolidated balance sheets are as
follows:
|
March
31,
|
2010
|
2009
|
||||||
|
Deferred
tax assets
|
||||||||
|
Allowance for
losses
|
$ | 3,060,093 | $ | 2,263,222 | ||||
|
Deferred
compensation
|
724,071 | 645,857 | ||||||
|
Securities
impairment
|
1,121,824 | 4,383,585 | ||||||
|
Pension
|
342,281 | 42,003 | ||||||
|
Real estate owned
|
512,662 | 251,580 | ||||||
|
Nonaccrual
interest
|
303,303 | 84,599 | ||||||
| 6,064,234 | 7,670,846 | |||||||
|
Deferred
tax liabilities
|
||||||||
|
Depreciable assets
|
(179,926 | ) | (187,305 | ) | ||||
|
Net
deferred tax asset
|
$ | 5,884,308 | $ | 7,483,541 | ||||
76
Community
Financial Corporation
and
Subsidiary
Notes
to Consolidated Financial Statements
(continued)
8. Income
Taxes (continued)
In
accordance with ASC 740, Income
Taxes, the Corporation was unable to recognize the deferred tax benefit
related to the OTTI charge on Fannie Mae and Freddie Mac preferred stock during
the quarter ended September 30, 2008. Tax laws in effect at September
30, 2008 characterized the loss as a capital loss. The Company did
not have sufficient capital gain income to offset the loss and therefore set up
a valuation allowance related to the capital loss. Subsequent to the
September 30, 2008 quarter, the U.S. Congress passed the Emergency Economic
Stabilization Act which re-characterized the OTTI loss on the Company’s Fannie
Mae and Freddie Mac preferred stock to ordinary from capital for tax purposes.
The tax benefit related to this loss of $11.5 million based on the Company’s
approximate income tax rate of 38% was $4.4 million. Therefore the
Company recognized the deferred tax asset during the quarter ended December 31,
2008, the period of enactment, as required by ASC 740. The Company
also determined that it had sufficient taxable income available in carryback
years and probable future taxable income to fully recognize the deferred tax
asset. The deferred tax asset related to the OTTI loss was $1.1
million and $4.4 million at March 31, 2010 and 2009,
respectively. During the year ended March 31, 2010, the Corporation
sold and therefore realized losses for tax purposes on a portion of the
preferred stock.
The
provision (benefit) for income taxes charged to operations for the years ended
March 31, 2010, 2009 and 2008, consists of the following:
|
Year
Ended March 31,
|
2010
|
2009
|
2008
|
|||||||||
|
Current
|
$ | (429,456 | ) | $ | 2,059,427 | $ | 2,010,955 | |||||
|
Deferred
|
1,778,645 | (5,851,976 | ) | (155,330 | ) | |||||||
| $ | 1,349,189 | $ | (3,792,549 | ) | $ | 1,855,625 | ||||||
Differences
between the statutory and effective tax rates are summarized as
follows:
|
Year
Ended March 31,
|
2010
|
2009
|
2008
|
|||||||||
|
Tax
at statutory rate
|
34.0 | % | 34.0 | % | 34.0 | % | ||||||
|
Increases
(decreases) in taxes resulting from:
|
||||||||||||
|
State income taxes, net of federal
benefit
|
3.7 | 4.2 | 3.0 | |||||||||
|
Non-taxable interest and dividend
received deduction
|
- | 0.5 | (2.8 | ) | ||||||||
|
Bank-owned
life insurance
|
(1.8 | ) | 0.9 | (1.5 | ) | |||||||
|
Rehabilitation
tax credit
|
(9.8 | ) | - | - | ||||||||
|
Other
|
1.2 | (0.2 | ) | (0.1 | ) | |||||||
| 27.3 | % | 39.4 | % | 32.6 | % | |||||||
77
Community
Financial Corporation
and
Subsidiary
Notes
to Consolidated Financial Statements
(continued)
9. Comprehensive
Income (Loss)
The
components of comprehensive income (loss) are summarized as
follows:
|
Year
Ended March 31,
|
2010
|
2009
|
2008
|
|||||||||
|
Net
income (loss)
|
$ | 3,591,788 | $ | (5,823,284 | ) | $ | 3,835,822 | |||||
|
Other
comprehensive income (loss), net of tax:
|
||||||||||||
|
Unrealized
holding (loss) arising during the period
|
- | (2,180,606 | ) | (4,658,833 | ) | |||||||
|
Pension
liability adjustment
|
(472,138 | ) | (8,019 | ) | 14,788 | |||||||
|
Income
tax (expense) benefit related to items of other
comprehensive
income
|
179,412 | (823,942 | ) | 1,768,367 | ||||||||
|
Total
other comprehensive income (loss), net of tax
|
(292,726 | ) | 1,348,645 | (2,875,678 | ) | |||||||
|
Total
comprehensive income (loss)
|
$ | 3,299,062 | $ | (4,474,639 | ) | $ | 960,144 | |||||
The
components of accumulated other comprehensive income (loss), included in
stockholders' equity, are as follows:
|
March
31,
|
2010
|
2009
|
||||||
|
Pension
liability adjustment
|
$ | (1,075,737 | ) | $ | (603,599 | ) | ||
|
Tax
effect
|
408,780 | 229,368 | ||||||
| Net-of-tax amount | $ | (666,957 | ) | $ | (374,231 | ) | ||
10. Stockholders’
Equity and Regulatory Capital Requirements
Savings
institutions must maintain specific capital standards that are no less stringent
than the capital standards applicable to national banks. The OTS
regulations currently have three capital standards including (i) a tangible
capital requirement, (ii) a core capital requirement, and (iii) a risk-based
capital requirement. The tangible capital standard requires savings
institutions to maintain tangible capital of not less than 1.5% of adjusted
total assets. The core capital standard requires a savings
institution to maintain core capital of not less than 4.0% of adjusted total
assets. The risk-based capital standard requires risk-based capital
of not less than 8.0% of risk-weighted assets.
78
Community
Financial Corporation
and
Subsidiary
Notes
to Consolidated Financial Statements
(continued)
10. Stockholders’
Equity and Regulatory Capital Requirements (continued)
The
following table represents the Bank's regulatory capital levels, relative to the
OTS requirements applicable at that date:
|
Amount
|
Percent
|
Actual
|
Actual
|
Excess
|
|||||||||||||||||
|
March 31,
2010
|
Required
|
Required
|
Amount
|
Percent
|
Amount
|
||||||||||||||||
|
(In
Thousands)
|
|||||||||||||||||||||
|
Tangible
Capital
|
$ | 8,252 | 1.50 | % | $ | 48,965 | 8.90 | % | $ | 40,713 | |||||||||||
|
Core
Capital
|
22,005 | 4.00 | 48,965 | 8.90 | 26,960 | ||||||||||||||||
|
Risk-based
Capital
|
37,793 | 8.00 | 53,129 | 11.25 | 15,336 | ||||||||||||||||
|
Amount
|
Percent
|
Actual
|
Actual
|
Excess
|
|||||||||||||||||
|
March 31,
2009
|
Required
|
Required
|
Amount
|
Percent
|
Amount
|
||||||||||||||||
|
Tangible
Capital
|
$ | 7,743 | 1.50 | % | $ | 46,771 | 9.06 | % | $ | 39,028 | |||||||||||
|
Core
Capital
|
20,649 | 4.00 | 46,771 | 9.06 | 26,122 | ||||||||||||||||
|
Risk-based
Capital
|
35,456 | 8.00 | 49,523 | 11.17 | 14,067 | ||||||||||||||||
The Bank
may not declare or pay a cash dividend, or repurchase any of its capital stock
if the effect thereof would cause the net worth of the Bank to be reduced below
certain requirements imposed by federal regulations.
Capital
distributions by OTS-regulated savings banks are limited by regulation ("Capital
Distribution Regulation"). Capital distributions are defined to
include, in part, dividends, stock repurchases and cash-out
mergers. The Capital Distribution Regulation permits a "Tier 1"
savings bank to make capital distributions during a calendar year equal to net
income for the current year plus the previous two years net income, less capital
distributions paid over that same time period. Any distributions in
excess of that amount require prior OTS notice, with the opportunity for OTS to
object to the distribution. A Tier 1 savings bank is defined as a
savings bank that has, on a pro forma basis after the proposed distribution,
capital equal to or greater than the OTS fully phased-in capital requirement and
has not been deemed by the OTS to be "in need of more than normal
supervision". The Bank is currently classified as a Tier 1
institution for these purposes. The Capital Distribution Regulation
requires that savings banks provide the applicable OTS District Director with a
30-day advance written notice of all proposed capital distributions whether or
not advance approval is required by the regulation.
79
Community
Financial Corporation
and
Subsidiary
Notes
to Consolidated Financial Statements
(continued)
10. Stockholders’
Equity and Regulatory Capital Requirements (continued)
On
December 19, 2008, the Corporation received an investment from the U.S. Treasury
Department ("the Treasury") of $12,643,000 in the form of 5% cumulative
preferred stock. The Corporation also issued a warrant to purchase
351,194 shares of common stock at $5.40 per share to the
Treasury. This investment was part of the Treasury's Capital Purchase
Plan. The preferred stock will pay cumulative dividends at a rate of
5% per year for the first five years and 9% per year thereafter. The
preferred stock is generally nonvoting. The warrant is immediately
exercisable.
11. Earnings
Per Common Share
During
the year ended March 31, 2003, the Board of Directors authorized a stock
repurchase program under which 368,706 shares of the Corporation’s stock may be
repurchased. 8,074 shares were repurchased during the fiscal year ended March
31, 2008. No shares were repurchased during the fiscal years ended
March 31, 2010 or 2009.
Earnings
per common share is calculated as follows:
|
Year
Ended March 31,
|
2010
|
2009
|
2008
|
|||||||||
|
Basic
earnings (loss) per common share
|
||||||||||||
|
Income
(loss) available to common shareholders
|
$ | 2,839,002 | $ | (6,033,798 | ) | $ | 3,835,822 | |||||
|
Weighted
average shares outstanding
|
4,361,658 | 4,355,909 | 4,305,445 | |||||||||
|
Basic
earnings (loss) per common share
|
$ | 0.65 | $ | (1.39 | ) | $ | 0.89 | |||||
|
Diluted
earnings (loss) per common share
|
||||||||||||
|
Income
(loss) available to common shareholders
|
$ | 2,839,002 | $ | (6,033,798 | ) | $ | 3,835,822 | |||||
|
Weighted
average shares outstanding
|
4,361,658 | 4,355,909 | 4,305,445 | |||||||||
|
Dilutive effect of stock
options
|
468 | - | 93,576 | |||||||||
|
Total
weighted average shares outstanding
|
4,362,126 | $ | 4,355,909 | $ | 4,399,021 | |||||||
|
Diluted
earnings (loss) per common share
|
$ | 0.65 | $ | (1.39 | ) | $ | 0.87 | |||||
During
the years ended March 31, 2010, 2009 and 2008, stock options and warrants
representing 307,200 shares, 499,447 shares and 142,000 shares, respectively, on
average were not included in the calculation of earnings per share because their
effect would have been antidilutive.
80
Community
Financial Corporation
and
Subsidiary
Notes
to Consolidated Financial Statements
(continued)
12. Employee
Benefit Plans
Pension
Plan
The
Corporation has a noncontributory defined benefit pension plan covering
substantially all of its employees. The benefits are based on years
of service and final average compensation. The Corporation's funding
policy is to contribute amounts to the pension trust at least equal to the
minimum funding requirements of the Employee Retirement Income Security Act of
1974 (ERISA), but not in excess of the maximum tax deductible
amount. Contributions are intended to provide not only for benefits
attributed to service to date but also for those expected to be earned in the
future. Prepaid pension cost includes any contributions made after
the measurement date but prior to the fiscal year end. The following
is a summary of information with respect to the plan:
|
March
31,
|
2010
|
2009
|
2008
|
|||||||||
|
Change
in benefit obligation:
|
||||||||||||
|
Benefit
obligation at beginning of year
|
$ | 3,683,909 | $ | 3,422,890 | $ | 2,956,892 | ||||||
|
Service
cost
|
306,260 | 412,726 | 345,315 | |||||||||
|
Interest
cost
|
238,195 | 262,757 | 182,931 | |||||||||
|
Actuarial
(gain) loss
|
423,500 | (81,231 | ) | (32,329 | ) | |||||||
|
Benefits
paid
|
(81,579 | ) | (333,233 | ) | (29,919 | ) | ||||||
|
Benefit
obligation at end of year
|
4,570,285 | 3,683,909 | 3,422,890 | |||||||||
|
Change
in plan assets:
|
||||||||||||
|
Fair
value of plan assets at beginning of year
|
3,571,818 | 3,697,356 | 2,530,479 | |||||||||
|
Actual
return on plan assets
|
177,750 | 207,695 | 130,956 | |||||||||
|
Employer
contribution
|
- | - | 1,065,840 | |||||||||
|
Benefits
paid
|
(81,759 | ) | (333,233 | ) | (29,919 | ) | ||||||
|
Fair
value of plan assets at end of year
|
3,667,809 | 3,571,818 | 3,697,356 | |||||||||
|
Funded
status
|
$ | (902,296 | ) | $ | (112,091 | ) | $ | 274,466 | ||||
|
Amounts
recognized in the balance sheet:
Other
assets
|
$ | - | $ | - | $ | 274,466 | ||||||
|
Other
liabilities
|
902,296 | 112,091 | - |
|
Amounts
recognized in accumulated other
comprehensive
(loss):
|
||||||||||||
|
Net
(loss)
|
$ | (1,075,737 | ) | $ | (603,599 | ) | $ | (595,580 | ) | |||
81
Community
Financial Corporation
and
Subsidiary
Notes
to Consolidated Financial Statements
(continued)
12. Employee
Benefit Plans (continued)
The accumulated benefit obligation for the defined benefit
pension plan was $3,169,588, $2,554,868 and $2,358,379 as of March 31, 2010,
2009 and 2008, respectively.
|
Year
Ended March 31,
|
2010
|
2009
|
2008
|
|||||||||
|
Components
of net periodic pension cost:
|
||||||||||||
|
Service
cost
|
$ | 306,260 | $ | 412,726 | $ | 345,315 | ||||||
|
Interest
cost
|
238,195 | 262,757 | 182,931 | |||||||||
|
Expected
return on plan assets
|
(246,153 | ) | (320,873 | ) | (175,740 | ) | ||||||
|
Recognized
net actuarial loss
|
19,765 | 23,926 | 27,243 | |||||||||
|
Net
periodic benefit cost
|
318,067 | 378,536 | 379,749 | |||||||||
|
Other
changes in plan assets and benefit obligations
|
||||||||||||
|
recognized
in other comprehensive income:
|
||||||||||||
|
Net
loss (gain)
|
472,138 | 8,019 | (14,788 | ) | ||||||||
|
Deferred
income tax expense (benefit)
|
(179,412 | ) | (3,048 | ) | 1,990 | |||||||
|
Total
recognized in other comprehensive (income) loss
|
292,726 | 4,971 | (12,798 | ) | ||||||||
|
Total
recognized in net periodic benefit cost and
|
||||||||||||
|
other
comprehensive (income) loss
|
$ | 610,793 | $ | 383,507 | $ | 366,951 | ||||||
|
Year
Ended March 31,
|
2009
|
|||
|
Adjustment
to retained earnings due to change
|
||||
|
in
measurement date:
|
||||
|
Service
cost
|
$ | 87,669 | ||
|
Interest
cost
|
53,011 | |||
|
Expected
return on plan assets
|
(64,175 | ) | ||
|
Recognized
net actuarial loss
|
4,888 | |||
|
Detailed
income tax (benefit)
|
(30,929 | ) | ||
|
Net
periodic benefit cost
|
$ | 50,464 | ||
The
following assumed rates were used in determining the benefit
obligations:
|
Year
Ended March 31,
|
2010
|
2009
|
2008
|
|||||||||
|
Weighted
average discount rate
|
6.00 | % | 6.50 | % | 6.25 | % | ||||||
|
Increase
in future compensation levels
|
4.00 | % | 4.00 | % | 4.00 | % | ||||||
82
Community
Financial Corporation
and
Subsidiary
Notes
to Consolidated Financial Statements
(continued)
12. Employee
Benefit Plans (continued)
The
following assumed rates were used in determining the net periodic pension
costs:
|
Year
Ended March 31,
|
2010
|
2009
|
2008
|
|||||||||
|
Weighted
average discount rate
|
6.00 | % | 6.25 | % | 6.00 | % | ||||||
|
Expected
long-term rate of return on plan assets
|
7.00 | % | 7.00 | % | 7.00 | % | ||||||
|
Increase
in future compensation levels
|
4.00 | % | 4.00 | % | 4.00 | % | ||||||
Long-Term
Rate of Return
The plan sponsor, in consultation with
management, selects the expected long-term rate of return on assets assumption
in consultation with their investment advisors. The rate is intended
to reflect the average rate of earnings expected to be earned on the funds
invested to provide plan benefits. Historical performance is reviewed
with respect to real rates of return (net of inflation) for the major asset
classes held or anticipated to be held by the trust, and for the trust
itself. Undue weight is not given to recent experience that may not
continue over the measurement period, with higher significance placed on current
forecasts of future long-term economic conditions.
|
Fair Value Measurements at March 31,
2010
|
||||||||||||||||
|
Asset
Category
|
Total
|
Quoted
Prices in
Active
Markets
for
Identical
Assets
(Level 1)
|
Significant
Observable
Inputs
(Level 2)
|
Significant
Unobservable
Inputs
(Level 3)
|
||||||||||||
|
(in
thousands)
|
||||||||||||||||
|
Cash
and due from broker
|
$ | 91,459 | $ | 91,459 | $ | - | $ | - | ||||||||
|
Equities
|
242,718 | 242,718 | - | - | ||||||||||||
|
Fixed
income
|
2,817,639 | 2,817,639 | - | - | ||||||||||||
|
Other
|
516,033 | 516,033 | - | - | ||||||||||||
| - | ||||||||||||||||
|
Total
|
$ | 3,667,809 | $ | 3,667,809 | $ | - | $ | - | ||||||||
Funds are
invested in the general asset of Minnesota Life which seeks to provide income
while providing safety of principal. Principal and interest earnings
are guaranteed by Minnesota Life. Investments are primarily in
long-term bonds and mortgages with no single asset representing more than 0.5
percent.
83
Community
Financial Corporation
and
Subsidiary
Notes
to Consolidated Financial Statements
(continued)
12. Employee
Benefit Plans (continued)
Asset
Allocation
The
pension plan’s weighted-average asset allocations at March 31, 2010 and 2009, by
asset category are as follows:
|
March
31,
|
2010
|
2009
|
||||||
|
Fixed
income securities
|
80 | % | 77 | % | ||||
|
Equity
securities
|
7 | % | 8 | % | ||||
|
Cash
|
3 | % | 5 | % | ||||
|
Other
|
10 | % | 10 | % | ||||
| 100 | % | 100 | % | |||||
Funds are
invested in a participation guarantee contract of the selected insurance
company. The funds are in the general assets of the guaranteeing
company which are primarily long-term bonds and long-term
mortgages. Funds are guaranteed by the insurance company against
failed investments. Interest is credited annually to the
funds.
The
Corporation expects to contribute $400,000 to its pension plan during the year
ending March 31, 2010.
Estimated
future benefit payments, which reflect expected future service, as appropriate,
are as follows:
|
Year
Ending March 31,
|
|||||
|
2011
|
$ | 110,606 | |||
|
2012
|
130,935 | ||||
|
2013
|
152,672 | ||||
|
2014
|
210,431 | ||||
|
2015
|
225,291 | ||||
|
2016-2020
|
1,483,095 | ||||
84
Community
Financial Corporation
and
Subsidiary
Notes
to Consolidated Financial Statements
(continued)
12. Employee
Benefit Plans (continued)
Employee
Stock Ownership Plan
The
Employee Stock Ownership and 401(k) Profit Sharing Plan (the "Plan") is a
combination of a profit sharing plan with 401(k) and a stock bonus
plan. The Plan provides for retirement, death, and disability
benefits for all eligible employees.
An
employee becomes eligible for participation after completion of six months of
service. After meeting the eligibility requirements, an employee
becomes a member of the Plan on the earliest January 1, April 1, July 1, or
October 1 occurring on or after his or her qualification.
The
contributions to the Plan are discretionary and are determined by the Board of
Directors. The contributions are limited annually to the maximum
amount permitted as a tax deduction under the applicable Internal Revenue Code
provisions
Profit-sharing
expenses were approximately $195,000, $172,000 and $181,000 for the years ended
March 31, 2010, 2009 and 2008, respectively.
Deferred
Compensation Plans
During
the year ended March 31, 2004, the Corporation adopted deferred compensation
plans for the Board of Directors, President and four Executive
Officers. Benefits are to be paid in monthly installments commencing
at retirement and ending upon the death of the director or
officer. The agreement provides that if board membership or
employment is terminated for reasons other than death or disability prior to
retirement age, the amount of benefits would be reduced. The deferred
compensation expense for the years ended March 31, 2010, 2009, and 2008, based
on the present value of the retirement benefits, was $215,000, $438,000 and
$371,000, respectively. The deferred compensation liability was
$1,905,000 and $1,667,000 at March 31, 2010 and 2009,
respectively. The plans are unfunded; however, life insurance has
been acquired on the life of the employees in amounts sufficient to discharge
the obligation.
85
Community
Financial Corporation
and
Subsidiary
Notes
to Consolidated Financial Statements
(continued)
13. Stock
Option Plan
The
Corporation has a noncompensatory stock option plan (the "Plan") designed to
provide long-term incentives to employees. All options are
exercisable at end of year.
The
following table summarizes options outstanding:
|
Year
Ended March 31,
|
2010
|
|||||||||||
|
Weighted
-
|
||||||||||||
|
Average
|
Aggregate
|
|||||||||||
|
Exercise
|
Intrinsic
|
|||||||||||
|
Shares
|
Price
|
Value
|
||||||||||
|
Outstanding
at
|
||||||||||||
|
beginning
of year
|
380,200 | $ | 8.41 | |||||||||
|
Granted
|
7,500 | 3.68 | ||||||||||
|
Forfeited
|
(73,000 | ) | 5.35 | |||||||||
|
Exercised
|
- | - | ||||||||||
|
Outstanding
at
end
of year
|
314,700 | 8.66 | $ | - | ||||||||
|
Exercisable
at end
of
year
|
314,700 | 8.66 | $ | - | ||||||||
|
Weighted
average fair
value
of options granted
|
$ | 1.12 | ||||||||||
86
Community
Financial Corporation
and
Subsidiary
Notes
to Consolidated Financial Statements
(continued)
13. Stock
Option Plan (continued)
The
aggregate intrinsic value of a stock option in the table above represents the
total pre-tax intrinsic value (the amount by which the current market value of
the underlying stock exceeds the exercise price of the option) that would have
been received by option holders had all option holders exercised their options
on March 31, 2010. This amount changes based on changes in the market
value of the Corporation's stock.
The fair
value of each option grant is estimated on the date of grant using the
Black-Scholes option-pricing model with the following weighted-average
assumptions:
| Year Ended March 31, |
2010
|
|||
|
Dividend
yield
|
2.25 | % | ||
|
Expected
life
|
10
years
|
|||
|
Expected
volatility
|
30.84 | % | ||
|
Risk-free
interest rate
|
2.48 | % | ||
The
expected volatility is based on historical volatility. The risk-free
interest rates for periods within the contractual life of the awards are based
on the U.S. Treasury yield curve in effect at the time of the
grant. The expected life is based on historical
experience. The dividend yield assumption is based on the
Corporation's history and expectation of dividend payouts.
The
following table summarizes information about stock options outstanding and
exercisable at March 31, 2010:
|
|
Options
Outstanding and Exercisable
|
|||
|
Weighted
|
||||
|
Average
|
Weighted
|
|||
|
Remaining
|
Average
|
|||
|
Contractual
|
Exercise
|
|||
|
Range
of Exercise Price
|
Number
|
Life
(in Years)
|
Price
|
|
|
$
3.68 - $ 7.43
$
8.75 - $ 9.40
|
96,500
116,200
|
2.62
3.69
|
5.21
9.32
|
|
|
$10.90-$11.22
|
102,000
|
5.13
|
11.17
|
|
14. Commitments
and Contingencies
The
Corporation is a party to credit related financial instruments with
off-balance-sheet risk in the normal course of business to meet the financing
needs of its customers. These financial instruments include
commitments to extend credit, standby letters of credit and commercial letters
of credit. Such commitments involve, to varying degrees, elements of
credit and interest rate risk in excess of the amount recognized in the
consolidated balance sheets.
The
Corporation’s exposure to credit loss is represented by the contractual amount
of these commitments. The Corporation follows the same credit
policies in making commitments as it does for on-balance-sheet
instruments.
87
Community
Financial Corporation
and
Subsidiary
Notes
to Consolidated Financial Statements
(continued)
14. Commitments
and Contingencies (continued)
At March
31, 2010 and 2009, the following financial instruments were outstanding whose
contract amounts represent credit risk:
| Contract Amount | ||||||||
|
March
31,
|
2010
|
2009
|
||||||
|
(In
Thousands)
|
||||||||
|
Commitments
to grant loans
|
$ | 5,192 | $ | 17,807 | ||||
|
Unfunded
commitments under lines of credit
|
30,249 | 31,644 | ||||||
|
Standby
letters of credit
|
1,783 | 2,794 | ||||||
Commitments
to extend credit are agreements to lend to a customer as long as there is no
violation of any condition established in the contract. Commitments
generally have fixed expiration dates or other termination clauses and may
require payment of a fee. The commitments for equity lines of credit
may expire without being drawn upon. Therefore, the total commitment
amounts do not necessarily represent future cash requirements. The
amount of collateral obtained, if it is deemed necessary by the Corporation, is
based on management’s credit evaluation of the customer.
Unfunded
commitments under commercial lines of credit, revolving credit lines and
overdraft protection agreements are commitments for possible future extensions
of credit to existing customers. These lines of credit are
uncollateralized and usually do not contain a specified maturity date and may
not be drawn upon to the total extent to which the Corporation is
committed.
Standby
letters of credit are conditional commitments issued by the Corporation to
guarantee the performance of a customer to a third party. Those
letters of credit are primarily issued to support public and private borrowing
arrangements. Essentially all letters of credit issued have
expiration dates within one year. The credit risk involved in issuing
letters of credit is essentially the same as that involved in extending loan
facilities to customers. The Corporation generally holds collateral
supporting those commitments if deemed necessary.
88
Community
Financial Corporation
and
Subsidiary
Notes
to Consolidated Financial Statements
(continued)
14. Commitments
and Contingencies (continued)
Leases
The
Corporation is obligated under several noncancellable operating
leases. Future minimum annual rental commitments under the leases are
as follows:
|
Year Ending March
31,
|
Amount
|
|||
|
2011
|
$ | 195,141 | ||
|
2012
|
185,719 | |||
|
2013
|
150,909 | |||
|
2014
|
73,820 | |||
|
2015
|
43,500 | |||
|
Thereafter
|
195,750 | |||
| $ | 844,839 | |||
Total
lease expense was approximately $201,022, $194,000 and $182,000 for the years
ended March 31, 2010, 2009 and 2008, respectively.
In the
normal course of business, the Corporation has entered into employment or
severance agreements with certain officers of the Bank.
The
Corporation maintains its cash accounts in several correspondent
banks. As of March 31, 2010, deposits in excess of amounts insured by
the Federal Deposit Insurance Corporation (FDIC) were approximately
$1,426,000.
15. Related
Party Transactions
The
Corporation has had, and may be expected to have in the future, banking
transactions in the ordinary course of business with directors, principal
shareholders, executive officers, their immediate families and affiliated
companies in which they are principal shareholders (commonly referred to as
related parties), on the same terms, including interest rates and collateral, as
those prevailing at the time for comparable transactions with
others. At March 31, 2010 and 2009, these loans totaled $828,285 and
$826,872, respectively. During the year ended March 31, 2010,
total principal additions were $79,300 and total principal payments were
$77,887.
Deposits
from related parties held by the Corporation at March 31, 2010 and 2009 amounted
to $742,450 and $510,225, respectively.
89
Community
Financial Corporation
and
Subsidiary
Notes
to Consolidated Financial Statements
(continued)
16. Condensed
Financial Information of the Corporation (Parent Company
Only)
|
Condensed
Balance Sheets
|
||||||||
|
March
31,
|
2010
|
2009
|
||||||
|
Assets
|
||||||||
|
Investment
in subsidiary
|
$ | 48,298,344 | $ | 46,396,550 | ||||
|
Cash
|
37,100 | 77,273 | ||||||
|
Prepaid
expenses and other assets
|
931,983 | 864,375 | ||||||
|
Total
assets
|
$ | 49,267,427 | $ | 47,338,198 | ||||
|
Liabilities and Stockholders’
Equity
|
||||||||
|
Liabilities
|
||||||||
|
Borrowings
|
$ | 250,000 | $ | 1,000,000 | ||||
|
Other
liabilities
|
5,552 | 1,635 | ||||||
|
Total
liabilities
|
255,552 | 1,001,635 | ||||||
|
Stockholders’
Equity
|
||||||||
|
Preferred stock
|
12,643,000 | 12,643,000 | ||||||
|
Common stock
|
43,617 | 43,617 | ||||||
|
Warrants
|
603,153 | 603,153 | ||||||
|
Discount on preferred
stock
|
(448,337 | ) | (568,973 | ) | ||||
|
Additional paid-in
capital
|
5,577,958 | 5,569,558 | ||||||
|
Retained earnings
|
31,259,441 | 28,420,439 | ||||||
|
Accumulated other comprehensive
(loss), net
|
(666,957 | ) | (374,231 | ) | ||||
|
Total
stockholders’ equity
|
49,011,875 | 46,336,563 | ||||||
|
Total
liabilities and stockholders’ equity
|
$ | 49,267,427 | $ | 47,338,198 | ||||
90
Community
Financial Corporation
and
Subsidiary
Notes
to Consolidated Financial Statements
(continued)
16. Condensed
Financial Information of the Corporation (Parent Company Only)
(continued)
|
Condensed
Statements of Operations
|
||||||||||||
|
Year
Ended March 31,
|
2010
|
2009
|
2008
|
|||||||||
|
Income
|
||||||||||||
|
Dividend from
subsidiary
|
$ | 1,500,000 | $ | - | $ | 1,000,000 | ||||||
|
Interest income
|
17,087 | 54,241 | 52,460 | |||||||||
|
Total
income
|
1,517,087 | 54,241 | 1,052,460 | |||||||||
|
Expenses
|
||||||||||||
|
Interest
expense
|
25,944 | 59,889 | - | |||||||||
|
Noninterest
expenses
|
156,733 | 199,151 | 219,758 | |||||||||
|
Total
expenses
|
182,677 | 259,040 | 219,758 | |||||||||
|
Income
(loss) before equity in undistributed net
|
||||||||||||
|
income of
subsidiary
|
1,334,410 | (204,799 | ) | 832,702 | ||||||||
|
Equity
in earnings (loss) of subsidiary, net of distributions
|
2,194,520 | (5,693,635 | ) | 2,939,614 | ||||||||
|
Income
(loss) before income taxes
|
3,528,930 | (5,898,434 | ) | 3,772,316 | ||||||||
|
Income
tax (benefit)
|
(62,858 | ) | (75,150 | ) | (63,506 | ) | ||||||
|
Net
income (loss)
|
$ | 3,591,788 | $ | (5,823,284 | ) | $ | 3,835,822 | |||||
91
Community
Financial Corporation
and
Subsidiary
Notes
to Consolidated Financial Statements
(continued)
16. Condensed
Financial Information of the Corporation (Parent Company Only)
(continued)
|
Condensed
Statements of Cash Flows
|
||||||||||||
|
Year
Ended March 31,
|
2010
|
2009
|
2008
|
|||||||||
|
Operating
activities
|
||||||||||||
|
Net income (loss)
|
$ | 3,591,788 | $ | (5,823,284 | ) | $ | 3,835,822 | |||||
|
Adjustments
|
||||||||||||
|
Equity in (earnings) loss of
subsidiary, net of distributions
|
(2,194,520 | ) | 5,693,635 | (2,939,614 | ) | |||||||
|
(Increase)
decrease in prepaid and other assets
|
(67,608 | ) | (74,316 | ) | 27,939 | |||||||
|
Stock-based
compensation expense
|
8,400 | 6,826 | - | |||||||||
|
Increase
(decrease) in other liabilities
|
3,917 | 1,635 | (6 | ) | ||||||||
|
Net
cash provided by (used in) operating activities
|
1,341,977 | (195,504 | ) | 924,141 | ||||||||
|
Investing
activities
|
||||||||||||
|
Capital
to subsidiary
|
- | (13,643,000 | ) | - | ||||||||
|
Net
cash (used in) investing activities
|
- | (13,643,000 | ) | - | ||||||||
|
Financing
activities
|
||||||||||||
|
Cash dividends paid on common
stock
|
- | (565,814 | ) | (1,120,639 | ) | |||||||
|
Cash dividends paid on preferred
stock
|
(632,150 | ) | (98,334 | ) | - | |||||||
|
Proceeds from issuance of common
stock
|
- | 171,285 | 375,525 | |||||||||
|
Proceeds from issuance of
preferred stock
|
- | 12,643,000 | - | |||||||||
|
Proceeds
from borrowed money
|
- | 4,000,000 | - | |||||||||
|
Repayment
of borrowed money
|
(750,000 | ) | (3,000,000 | ) | - | |||||||
|
Repurchase of common
stock
|
- | - | (80,739 | ) | ||||||||
|
Net
cash provided by (used in) financing activities
|
(1,382,150 | ) | 13,150,137 | (825,853 | ) | |||||||
|
Increase
(decrease) in cash
|
(40,173 | ) | (688,367 | ) | 98,288 | |||||||
|
Cash, beginning of
year
|
77,273 | 765,640 | 667,352 | |||||||||
|
Cash, end of
year
|
$ | 37,100 | $ | 77,273 | $ | 765,640 | ||||||
92
ITEM
9. CHANGES IN AND DISAGREEMENTS WITH ACCOUNTANTS ON ACCOUNTING AND FINANCIAL
DISCLOSURE
There has
been no current report on Form 8-K filed within 48 months prior to the date of
the most recent financial statements reporting a change in accountants and/or
reporting disagreements on any matter of accounting principle on financial
statements disclosure.
ITEM
9A(T). CONTROLS AND PROCEDURES
An
evaluation of the Company’s disclosure controls and procedures (as defined in
Rule 13a-15(e) of the Securities Exchange Act of 1934 (the "Act")) as of March
31, 2010, was carried out under the supervision and with the participation of
the Company's Chief Executive Officer, Chief Financial Officer and several other
members of the Company's senior management. The Corporation's Chief Executive
Officer and Chief Financial Officer concluded that the Corporation's disclosure
controls and procedures currently in effect are effective in ensuring that the
information required to be disclosed by the Company in the reports it files or
submits under the Act is: (i) accumulated and communicated to the Company's
management (including the Chief Executive Officer and Chief Financial Officer)
in a timely manner and (ii) recorded, processed, summarized and reported within
the time periods specified in the SEC's rules and forms. In addition, there have
been no changes in our internal control over financial reporting (as defined in
Rule 13a-15(f) of the Act) that occurred during the quarter ended March 31,
2010, that has materially affected, or is reasonably likely to materially
affect, our internal control over financial reporting.
The
Company does not expect that its disclosure controls and procedures and internal
control over financial reporting will prevent all errors and all fraud. A
control procedure, no matter how well conceived and operated, can provide only
reasonable, not absolute, assurance that the objectives of the control procedure
are met. Because of the inherent limitations in all control procedures, no
evaluation of controls can provide absolute assurance that all control issues
and instances of fraud, if any, within the Company have been detected. These
inherent limitations include the realities that judgments in decision-making can
be faulty, and that breakdowns can occur because of simple error or mistake.
Additionally, controls may be circumvented by the individual acts of some
persons, by collusion of two or more people, or by override of the control. The
design of any control procedure also is based in part upon certain assumptions
about the likelihood of future events, and there can be no assurance that any
design will succeed in achieving its stated goals under all potential future
conditions; over time, controls may become inadequate because of changes in
conditions, or the degree of compliance with the policies or procedures may
deteriorate. Because of the inherent limitations in a cost-effective control
procedure, misstatements due to error or fraud may occur and not be
detected.
Management's
Report on Internal Control over Financial Reporting
The
management of Community Financial Corporation is responsible for establishing
and maintaining adequate internal control over financial
reporting. This internal control system has been designed to provide
reasonable assurance to the Company’s management and board of directors
regarding the preparation and fair presentation of the Company’s published
financial statements.
All
internal control systems, no matter how well designed, have inherent
limitations. Therefore, even those systems determined to be effective
can provide only reasonable assurance with respect to financial statement
preparation and presentation.
93
The
management of Community Financial Corporation has assessed the effectiveness of
the Company’s internal control over financial reporting as of March 31,
2010. To make the assessment, we used the criteria for effective
internal control over financial reporting described in Internal Control –
Integrated Framework, issued by the Committee of Sponsoring Organizations of the
Treadway Commission. Based on our assessment, we believe that, as of
March 31, 2010, the Company’s internal control over financial reporting was
effective based on those criteria.
This
annual report does not include the attestation report of the Corporation’s
registered public accounting firm regarding internal control over financial
reporting. Management’s report was not subject to attestation by the
Corporation’s registered public accounting firm pursuant to temporary rules of
the Securities and Exchange Commission that permit the Corporation to provide
only management’s report in this annual report.
ITEM
9B. OTHER INFORMATION
None.
PART
III
ITEM
10. DIRECTORS, EXECUTIVE OFFICERS AND CORPORATE
GOVERANCE
Directors and
Executive Officers. Information concerning directors of the
Registrant is incorporated herein by reference from our definitive Proxy
Statement for the 2010 Annual Meeting of Stockholders, copy of which will be
filed not later than 120 days after the close of the fiscal year.
Information
concerning executive officers is set forth in Item 1 of this report under the
caption “Executive Officers.”
Compliance with
Section 16(a). Information concerning compliance with Section
16(a) of the Securities Exchange Act of 1934 is incorporated herein by reference
from our definitive Proxy Statement for the 2010 Annual Meeting of Stockholders,
a copy of which will be filed not later than 120 days after the close of the
fiscal year.
Audit Committee
Matters and Audit Committee Financial Expert. Information
concerning the audit committee of the Company’s Board of Directors, including
information regarding audit committee financial experts serving on the audit
committee, is incorporated herein by reference from the definitive Proxy
Statement for the 2010 Annual Meeting of Stockholders, a copy of which will be
filed not later than 120 days after the close of the fiscal year.
Code of
Ethics. The Company has adopted a written Code of Ethics based
upon the standards set forth under Item 406 of Regulation S-K of the Securities
Exchange Act. The Code of Ethics applies to all of the Company’s
directors, officers and employees. A copy of the Company’s Code of
Ethics was filed with the SEC as Exhibit 14 to its Annual Report on Form 10-KSB
for the year ended March 31, 2004 and as posted in the Investor Relations
section of our web site at www.cbnk.com. You may obtain a copy of the
Code of Ethics free of charge from the Company by writing to the Secretary of
Community Financial Corporation at 38 North Central Avenue, Staunton, Virginia
24401, or by calling (540) 886-0796.
Nomination
Procedures. There has been no material changes to the
procedures by which shareholders may recommend nominees to the Company’s Board
of Directors.
94
ITEM
11. EXECUTIVE COMPENSATION
Information
concerning executive compensation is incorporated herein by reference from our
definitive Proxy Statement for the 2010 Annual Meeting of Stockholders, a copy
of which will be filed not later than 120 days after the close of the fiscal
year.
ITEM 12. SECURITY OWNERSHIP OF
CERTAIN BENEFICIAL OWNERS AND MANAGEMENT AND RELATED STOCKHOLDER
MATTERS
Information
concerning security ownership of certain beneficial owners and management is
incorporated herein by reference from our definitive Proxy Statement for the
2010 Annual Meeting of Stockholders, a copy of which will be filed not later
than 120 days after the close of the fiscal year.
The
following table summarizes our equity compensation plans as of March 31,
2010.
Equity Compensation
Plans
|
Plan
Category
|
Number
of securities
to
be issued upon
exercise
of out-
standing
options,
warrants
and rights
|
Weighted-average
exercise
price of
outstanding
options,
warrants
and rights
|
Number
of securities
remaining
available
for
future issuance
under
equity
compensation
plans
(excluding
securities
reflected
in column)
|
|||||||||
|
Equity
compensation
plans
approved by
security
holders
|
314,700 | $ | 8.66 | 32,300 | ||||||||
|
Equity
compensation
plans
not approved
by
security holders
|
0 | 0 | 0 | |||||||||
|
Total
|
314,700 | $ | 8.66 | 32,300 | ||||||||
The
number of shares available for issuance are adjusted for changes in
capitalization due to reorganization, recapitalization, stock splits, stock
dividends combination or exchange of shares, merger, consolidation or any change
in the corporate structure.
ITEM
13. CERTAIN RELATIONSHIPS AND RELATED TRANSACTIONS, AND
DIRECTOR INDEPENDENCE
Information
concerning certain relationships and transactions and director dependence is
incorporated herein by reference from our definitive Proxy Statement for the
2010 Annual Meeting of Stockholders, a copy of which will be filed not later
than 120 days after the close of the fiscal year.
ITEM
14. PRINCIPAL ACCOUNTING FEES AND SERVICES
Information
concerning fees and services by our principal accountants is incorporated herein
by reference from our definitive Proxy Statement for the 2010 Annual Meeting of
Stockholders, a copy of which will be filed not later than 120 days after the
close of the fiscal year.
PART IV
ITEM 15. EXHIBITS, FINANCIAL STATEMENT
SCHEDULES
See Exhibit Index.
95
SIGNATURES
Pursuant
to the requirements of Section 13 or 15(d) of the Securities Exchange Act of
1934, the Registrant has duly caused this Report to be signed on its behalf by
the undersigned, thereunto duly authorized.
|
COMMUNITY
FINANCIAL CORPORATION
|
||
|
Date: June
28, 2010
|
By:
|
/s/
Norman C. Smiley, III
|
|
Norman
C. Smiley, III
(Duly
Authorized Representative)
|
||
Pursuant
to the requirements of the Securities Exchange Act of 1934, this Report has been
signed below by the following persons on behalf of the Registrant and in the
capacities and on the dates indicated.
|
By:
|
/s/Norman
C. Smiley, III
|
By:
|
/s/
James R. Cooke, Jr.
|
|
Norman
C. Smiley, III
Director,
President and Chief
Executive
Officer
(Principal
Executive Officer)
|
James
R. Cooke, Jr.
Chairman
of the Board
and
Director
|
||
|
Date:
|
June
28, 2010
|
Date:
|
June
28, 2010
|
|
By:
|
/s/
P. Douglas Richard
|
By:
|
/s/
Charles F. Andersen
|
|
P.
Douglas Richard
Vice
Chairman of the Board
and
Director
|
Charles
F. Andersen
Director
|
||
|
Date:
|
June
28, 2010
|
Date:
|
June
28, 2010
|
|
By:
|
/s/
Dale C. Smith
|
By:
|
/s/
Morgan N. Trimyer, Jr.
|
|
Dale
C. Smith
Director
|
Morgan
N. Trimyer, Jr.
Director
|
||
|
Date:
|
June
28, 2010
|
Date:
|
June
28, 2010
|
|
By:
|
/s/
R. Jerry Giles
|
By:
|
/s/
Charles W. Fairchilds
|
|
R.
Jerry Giles
Chief
Financial Officer
(Principal
Financial and Accounting Officer)
|
Charles
W. Fairchilds
Director
|
||
|
Date:
|
June
28, 2010
|
Date:
|
June
28, 2010
|
96
INDEX
TO EXHIBITS
|
Regulation
S-K
Exhibit
Number
|
Document
|
|
|
3.1
|
Amended
and Restated Articles of Incorporation, filed on July 5, 1996 as an
exhibit to the Registrant’s Definitive Proxy Statement on Schedule 14A
(SEC File No. 000-18265), are incorporated herein by
reference.
|
|
|
3.2
|
Bylaws,
as amended and restated and currently in effect, filed on December 20,
2008 as Exhibit 3.2 to the Registrant’s Current Report on Form 8-K (SEC
File No. 000-18265), is incorporated herein by reference.
|
|
|
4.1
|
Registrant’s
Specimen Common Stock Certificate, filed on June 29, 1999 as Exhibit 4 to
the Annual Report on Form 10-KSB (SEC File No. 000-18265) for the fiscal
year ended March 31, 1999, is incorporated herein by
reference.
|
|
|
4.2
|
Registrant’s
Form of Certificate for the Series A Preferred Stock, filed on December
22, 2008, as Exhibit 4.1 to the Registrant’s Current Report on Form 8-K
(SEC File No. 000-18265), is incorporated herein by
reference.
|
|
|
4.3
|
Registrant’s
Form of Warrant for Purchase of Shares of Common Stock, filed on December
22, 2008, as Exhibit 4.2 to the Registrant’s Current Report on Form 8-K
(SEC File No. 000-18265), is incorporated herein by
reference.
|
|
|
10.1
|
Amended
and Restated Employment Agreement by and between Community Bank and P.
Douglas Richard, filed on May 5, 2006, as Exhibit 99.2 to the Registrant’s
Current Report on Form 8-K (SEC File No. 000-18265), is incorporated
herein by reference.
|
|
|
10.2
|
Form
of Change in Control Agreement by and between Community Financial
Corporation and each of P. Douglas Richard and Chris P. Kyriakides, filed
on May 5, 2006 as Exhibit 99.4 to the Registrant’s Current Report on Form
8-K (SEC File No. 000-18265), is incorporated herein by
reference.
|
|
|
10.3
|
Registrant’s
1996 Incentive Plan, filed on July 5, 1996 as an exhibit to the
Registrant’s Definitive Proxy Statement on Schedule 14A (SEC File No.
000-18265), is incorporated herein by reference.
|
|
|
10.4
|
Amended
and Restated Employment Agreement by and between Community Bank and Chris
P. Kyriakides, filed on May 5, 2006 as Exhibit 99.3 to the Registrant’s
Current Report on Form 8-K (SEC File No. 000-18265), is incorporated
herein by reference.
|
97
|
10.5
|
Form
of Change in Control Agreement by and between Community Bank and each of
R. Jerry Giles and Benny N. Werner, filed on May 5, 2006 as Exhibit 99.5
to the Registrant’s Current Report on Form 8-K (SEC File No. 000-18265),
is incorporated herein by reference.
|
|
|
10.6
|
Retirement
Agreements by and between Community Bank and Non-Employee Directors filed
on June 29, 2004 as an exhibit to the Registrant’s Annual Report on Form
10-KSB (SEC File No. 000-18265) for the fiscal year ended March 31, 2004,
and incorporated here by reference.
|
|
|
10.7
|
Form
of First Amendment to the Retirement Agreements by and between Community
Bank and Non-Employee Directors, filed on June 29, 2005 as an exhibit to
the Registrant’s Annual Report on Form 10-K (SEC File No. 000-18265) for
the fiscal year ended March 31, 2005, is incorporated here by
reference.
|
|
|
10.8
|
Salary
Continuance Agreements by and between Community Bank and Officers Richard,
Kyriakides, Giles, Smiley and Werner filed on June 29, 2004 as an exhibit
to the Registrant’s Annual Report on Form 10-KSB (SEC File No. 000-18265)
for the fiscal year ended March 31, 2004, and incorporated here by
reference.
|
|
|
10.9
|
Form
of Director Deferred Fee Agreement, as amended, filed on June 29, 2005 as
an exhibit to the Registrant’s Annual Report on Form 10-K (SEC File No.
000-18265) for the fiscal year ended March 31, 2005, is incorporated here
by reference.
|
|
|
10.10
|
Registrant’s
2003 Stock Option and Incentive Plan, filed on June 26, 2003 as an exhibit
to the Registrant’s Definitive Proxy Statement on Schedule 14A (SEC File
No. 000-18265), is incorporated herein by reference.
|
|
|
10.11
|
Form
of Incentive Stock Option Agreement and Non-Qualified Stock Option
Agreement for Registrant’s 2003 Stock Option and Incentive Plan, filed on
August 12, 2005 as an exhibit to the Registrant’s Quarterly Report on Form
10-Q (SEC File No. 000-18265) for the quarter ended June 30, 2005, are
incorporated herein by reference.
|
|
|
10.12
|
Employment
Agreement by and between Community Bank and Norman C. Smiley, III, filed
on June 16, 2008 as Exhibit 10.1 to the Registrant’s Current Report on
Form 8-K (SEC File No. 000-18265), is incorporated herein by
reference.
|
|
|
10.13
|
Change
in Control Agreement by and between Community Financial Corporation and
Norman C. Smiley, III, filed on June 16, 2008 as an exhibit to the
Registrant’s Current Report on Form 8-K (SEC File No. 000-18265), is
incorporated herein by reference.
|
|
|
10.14
|
Form
of Change in Control Agreement by and between Community Financial
Corporation and Lyle Moffett, filed on July 1, 2008 as Exhibit 10.1 to the
Registrant’s Current Report on Form 8-K (SEC File No. 000-18265), is
incorporated herein by reference.
|
|
|
10.15
|
Form
of Change in Control Agreement by and between Community Financial
Corporation and John Howerton is filed with this Form
10-Q.
|
98
|
10.16
|
Letter
Agreement, including Schedule A, and Securities Purchase Agreement, dated
December 19, 2008, between Community Financial Corporation and United
States Department of the Treasury, with respect to the issuance and sale
of the Series A Preferred Stock and the Warrant, filed on December 22,
2008, as Exhibit 10.1 to the Registrant’s Current Report on Form 8-K (SEC
File No. 000-18265), is incorporated herein by reference
|
|
|
10.17
|
Form
of Compensation Modification Agreement and Waiver, executed by each of P.
Douglas Richard, Norman C. Smiley, III and Chris P. Kyriakides, filed on
December 22, 2008, as Exhibit 10.2 to the Registrant’s Current Report on
Form 8-K (SEC File No. 000-18265), is incorporated herein by
reference
|
|
|
10.18
|
Separation
Agreement and Release between the Registrant, and its wholly owned
subsidiary, Community Bank, and Chris P. Kyriakides, filed on May 26, 2009
as Exhibit 10.1 to the Registrant’s Current Report on Form 8-K (SEC File
No. 000-18265), is incorporated herein by reference.
|
|
|
11
|
Statement
re computation of per share earnings (see Note 12 of the Notes to
Consolidated Financial Statements included in Item 8 of this Annual Report
on Form 10-K).
|
|
|
14
|
Code
of Ethics, filed on June 29, 2004 as an exhibit to the Registrant’s Annual
Report on Form 10-KSB (SEC File No. 000-18265) for the fiscal year ended
March 31, 2004, and incorporated here by reference.
|
|
|
21
|
Subsidiaries
of the Registrant, filed on June 29, 2005 as an exhibit to the
Registrant’s Annual Report on Form 10-K (SEC File No. 000-18265) for the
fiscal year ended March 31, 2005, is incorporated here by
reference.
|
|
|
23
|
Consent
of Independent Auditors
|
|
|
31.1
|
Rule
13(a)-14(a) Certification (Chief Executive Officer)
|
|
|
31.2
|
Rule
13(a)-14(a) Certification (Chief Financial Officer)
|
|
|
32
|
Section
1350 Certifications
|
|
|
99.1
|
Certification
of Principal Executive Officer Pursuant to 31 CFR §30.15
|
|
|
99.2
|
Certification
of Principal Financial Officer Pursuant to 31 CFR
§30.15
|
99