Attached files
| file | filename |
|---|---|
| 8-K - FORM 8-K - ABRAXAS PETROLEUM CORP | fbr8k62410.htm |

Small-Cap E&P Conference
June 24, 2010
Exhibit 99.1

2
Forward-Looking Statements
The information presented herein may contain predictions, estimates and
other forward-looking statements within the meaning of Section 27A of the
Securities Act of 1933 and Section 21E of the Securities Exchange Act of
1934. Although the Company believes that its expectations are based on
reasonable assumptions, it can give no assurance that its goals will be
achieved.
other forward-looking statements within the meaning of Section 27A of the
Securities Act of 1933 and Section 21E of the Securities Exchange Act of
1934. Although the Company believes that its expectations are based on
reasonable assumptions, it can give no assurance that its goals will be
achieved.
Important factors that could cause actual results to differ materially from
those included in the forward-looking statements include the timing and
extent of changes in commodity prices for oil and gas, the need to develop
and replace reserves, environmental risks, competition, government
regulation and the ability of the Company to meet its stated business
goals.
those included in the forward-looking statements include the timing and
extent of changes in commodity prices for oil and gas, the need to develop
and replace reserves, environmental risks, competition, government
regulation and the ability of the Company to meet its stated business
goals.
3
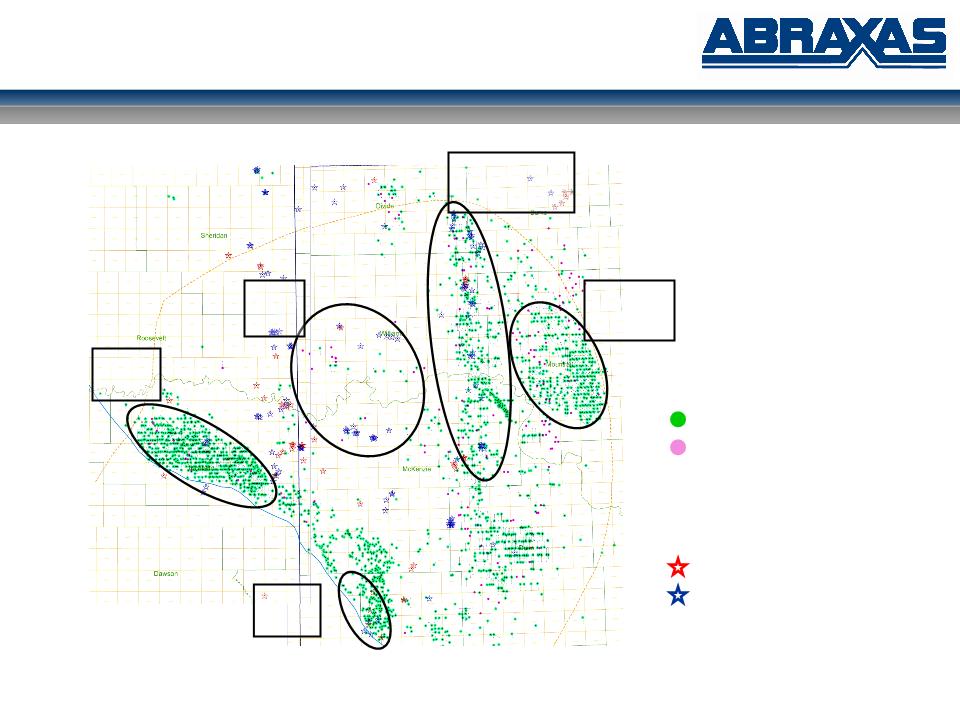
LEGEND:
Bakken producers
Bakken permits (Q1 2010)
EXISTING ABRAXAS WELLS
(VARIOUS FORMATIONS):
Abraxas operated wells
Abraxas non-operated wells
Bakken Sleeper (Industry)
Montana North Dakota
EOG, WLL:
Parshall &
Sanish
CTL, MRO, DNR:
Nesson
Anticline
XOM:
Elm
Coulee
WLL:
Lewis &
Clark
BEXP:
Rough
Rider
4
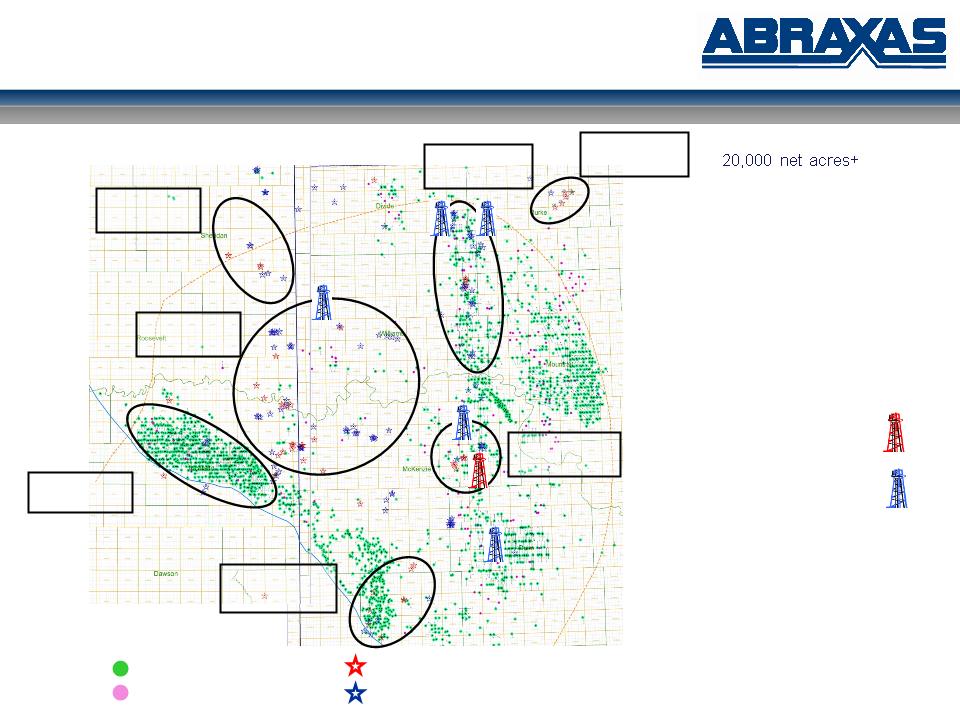
Bakken producers Abraxas operated wells
Bakken permits (Q1 2010) Abraxas non-operated wells
Bakken Sleeper (AXAS)
17% average WI
(WI range of 2 - 50%)
= ~100 gross (1280 acre) units
Numerous opportunities
(operated and non-operated)
NO LEASE EXPIRATIONS - acreage
principally held by production
principally held by production
July 2010 -
first operated well
first operated well
NON-OP: 8 WELLS
1 - ORRI BPO: on production
2 - 10% WI: on production
3 - 2% WI: on production
4 - 2% WI: flowing back
5 - 4% WI: spud - summer 2010
6 - 4% WI: spud - summer 2010
7 - 4% WI: spud - summer 2010
8 - 4% WI: spud - summer 2010
Montana North Dakota
Nesson
2,600 net acres
Elm Coulee
440 net acres
Elkhorn Ranch
2,000 net acres
Harding
5,800 net acres
North Fork
3,200 net acres
Carter
3,200 net acres
Sheridan
3,000 net acres
3
4
2
1
5-8
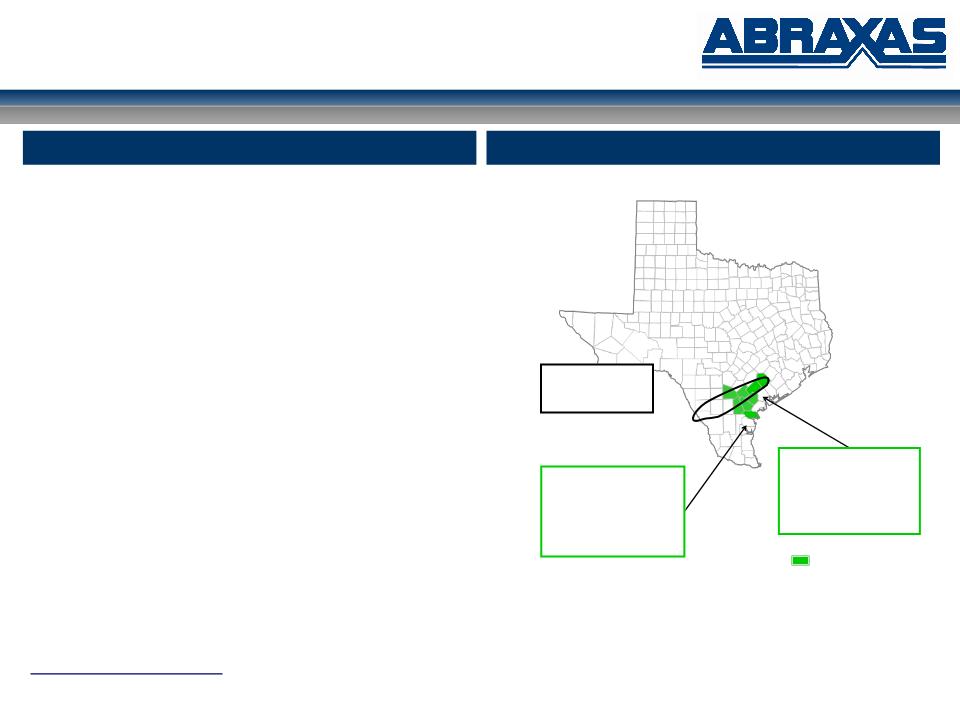
5
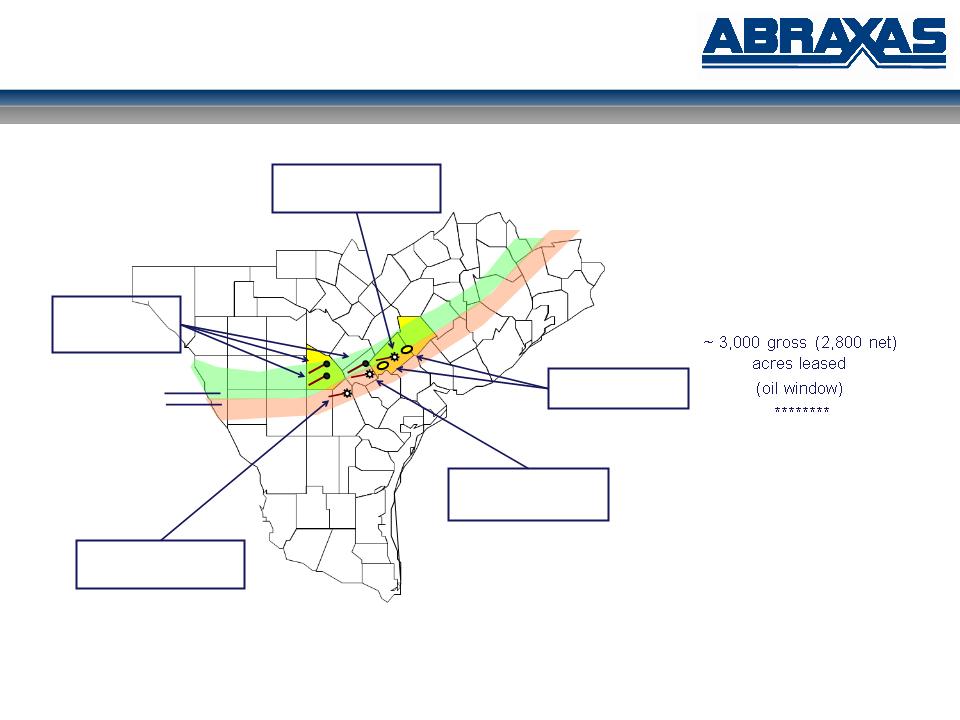
Eagle Ford Shale
AXAS:
~ 3,200 gross (2,900 net)
acres HBP
acres HBP
(gas/condensate window)
~1,800 gross/net acres
leased
(gas window)
********
Leasing geologically /
geophysically controlled
geophysically controlled
******
No expensive trend acreage
South Texas
gas window
oil window
PXD:
Eagle Ford Discovery
Enduring:
Eagle Ford Discovery
AXAS:
HBP acreage
PXD:
Eagle Ford Discovery
EOG:
Eagle Ford Oil
Discoveries
gas/condensate
window
6
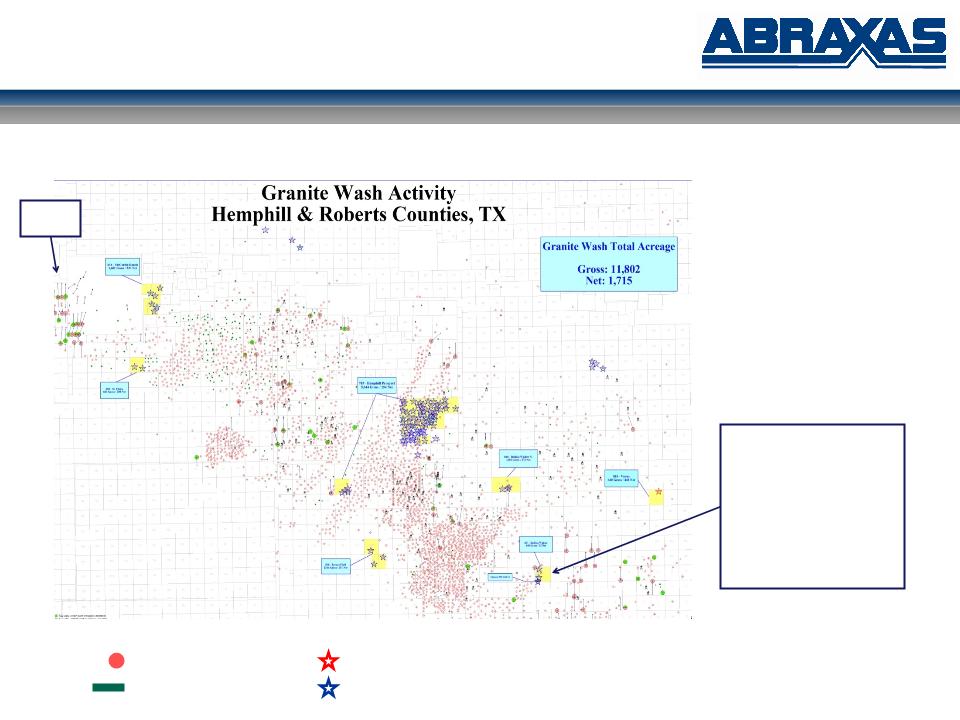
Granite Wash
AXAS:
Acreage - HBP
11,802 gross
1,715 net
8% Non-Op WI
XEC Huff 16-5H
Hemphill Co., TX
Texas Panhandle
XEC:
Huff 16-5H
1st 60 day average:
15.8 MMcfpd, 350 Bopd
(17.9 MMcfepd)
1st 60 day CUM:
947 MMcf, 21 MBO
(1.07 Bcfe)
CHK
Granite Wash producers Abraxas operated wells
GW horizontal lateral Abraxas non-operated wells
7
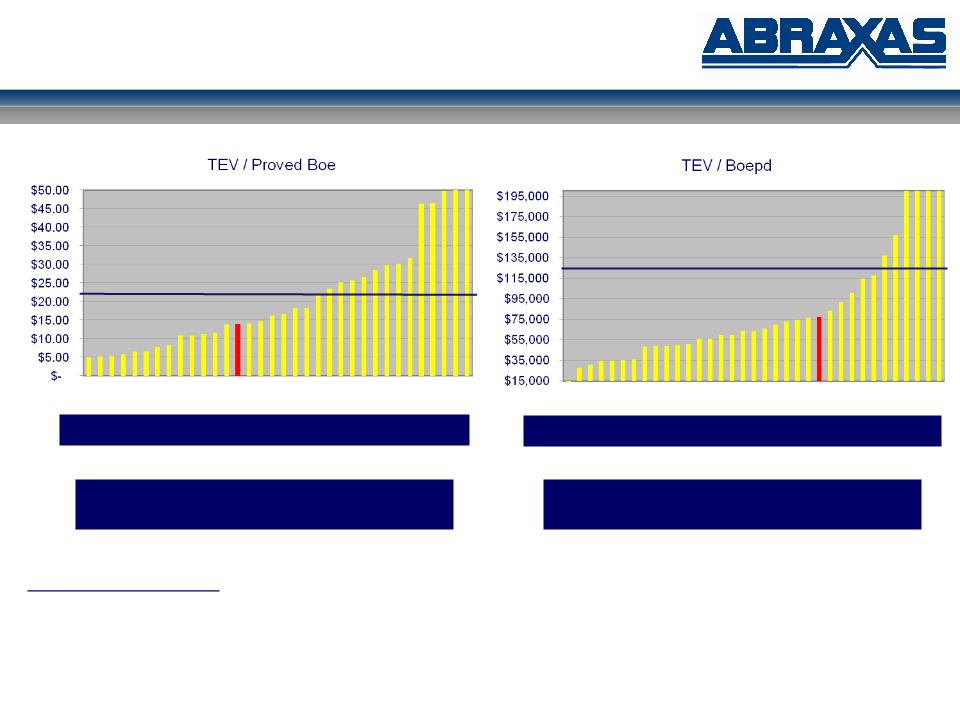
Peer Group Analysis
Source: Company filings with the SEC and market capitalization on May 14, 2010
E&P analysis includes market capitalization < $1B (AEZ, AREX, ATPG, AXAS, CFW, CPE, CRZO, CWEI, DBLE, DNE, DPTR, END, EPM, FXEN, GDP, GEOI, GMET, GMXR, GPOR,
GPR, GST, GSX, KOG, MCF, MHR, NGAS, NOG, PETD, PHX, PINN, PQ, RAME, REXX, SGY, VQ, WRES)
GPR, GST, GSX, KOG, MCF, MHR, NGAS, NOG, PETD, PHX, PINN, PQ, RAME, REXX, SGY, VQ, WRES)
35% undervalued compared to E&P in analysis
Mean equates to an AXAS share price of:
$5.14
Mean equates to an AXAS share price of:
$5.71
40% undervalued compared to E&P in analysis
8
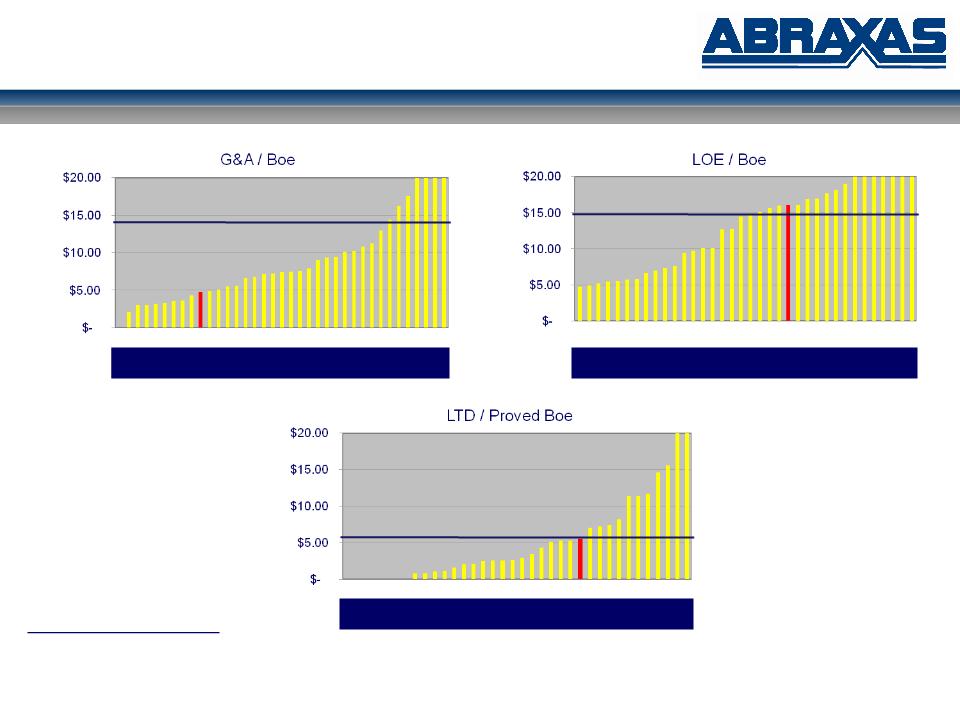
Peer Group Analysis
Source: Company filings with the SEC
E&P analysis includes market capitalization < $1B (AEZ, AREX, ATPG, AXAS, CFW, CPE, CRZO, CWEI, DBLE, DNE, DPTR, END, EPM, FXEN, GDP, GEOI, GMET, GMXR, GPOR,
GPR, GST, GSX, KOG, MCF, MHR, NGAS, NOG, PETD, PHX, PINN, PQ, RAME, REXX, SGY, VQ, WRES)
GPR, GST, GSX, KOG, MCF, MHR, NGAS, NOG, PETD, PHX, PINN, PQ, RAME, REXX, SGY, VQ, WRES)
67% under average of E&P in analysis
8% over average of E&P in analysis
In-line with average of E&P in analysis

9
AXAS Highlights
§ NASDAQ: AXAS
§ Fully diluted shares outstanding: ~76 million
§ ~50% institutional
§ ~10% insider
§ Current average trading volume: ~500,000 shares per day
§ Market capitalization: ~$230 million
§ Total long-term debt: ~$138 million
§ Re-paid term loan portion (March-10)
§ High quality assets
§ Unparalleled upside opportunities
§ 85% of PDP hedged through 2012 and 70% in 2013
§ $74.96 per barrel and $6.38 per Mmbtu
§ 2010 Guidance:
§ Production: 1.7 - 2.0 MMBoe
§ EBITDA: $38 - 45 Million
§ CapEx: $30 Million

10
Operational Highlights
Ø Predictable, long-lived production
§ R/P ratio of 15.3 years
§ Conventional and unconventional reservoirs
Ø 1,828 gross (405 net) producing wells: average working interest 22%
§ ~690 gross (250 net) wells/units comprise top 90% by PV
Ø Substantial inventory: 152 proved undeveloped locations
§ Numerous additional identified locations
Ø 307,625 gross (160,542 net) acres
§ No material lease expiry issues or drilling commitments
Ø Operational control - over 80% of PV10
§ Over 30 years of operational history
§ Efficient, low-cost operator
§ Long history of drilling success
Net proved reserves and R/P ratio as of December 31, 2009
Well count and acreage as of December 31, 2009
11
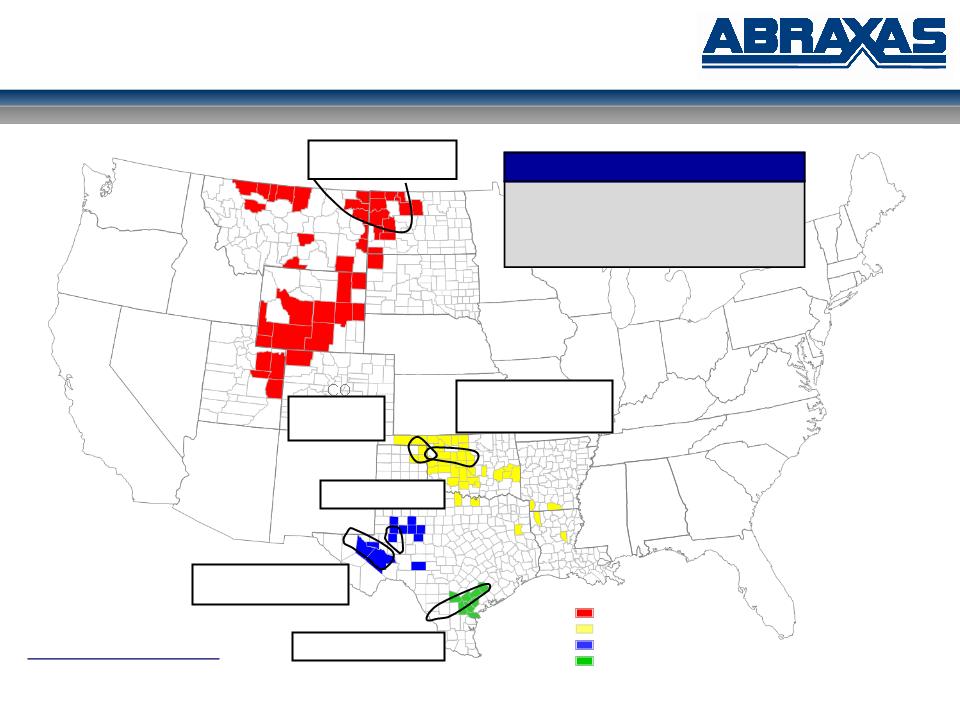
High Quality Assets
ND
SD
MT
WY
UT
TX
OK
AR
LA
Proved Reserves (MMBoe): 24.9
- Proved Developed: 56%
- Gas/Oil %: 65/35%
- Operated: 82%
Abraxas Petroleum Corporation
Net proved reserves as of December 31, 2009
Bakken / Three Forks
Play
Central Anadarko
Cana - Woodford
Shale Play
Barnett / Woodford
Shale Play
Wolfberry Trend
Rocky Mountain
Mid-Continent
Permian Basin
Gulf Coast
Eagle Ford Shale Play
Granite Wash
Play
12
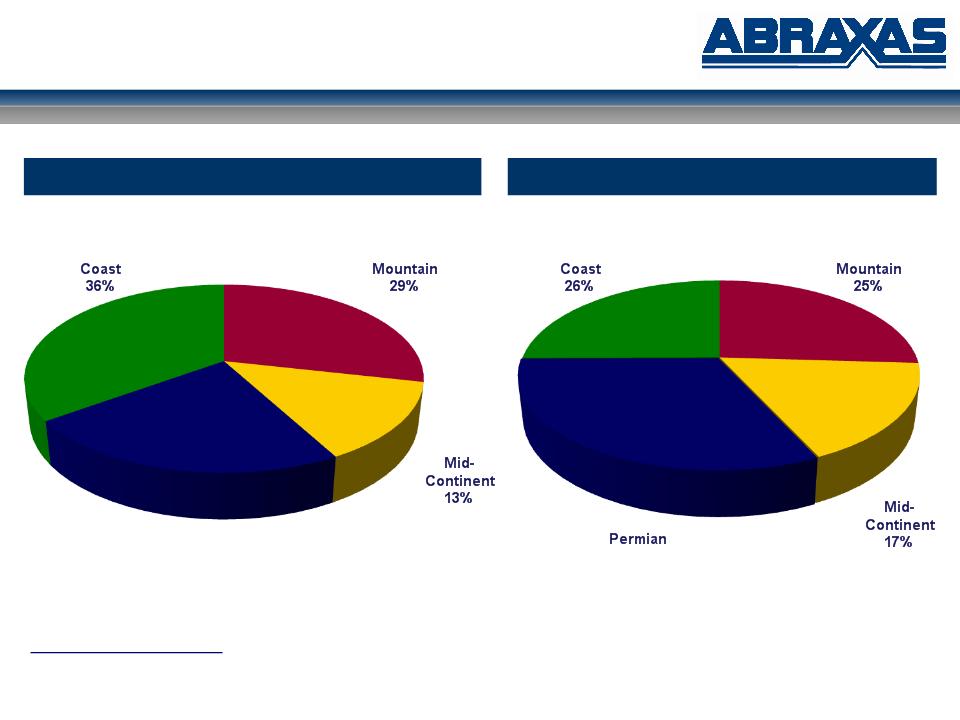
Reserve / Production Summary
Proved Reserves - 24.9 MMBoe
Production - 4,028 Boepd
Net proved reserves as of December 31, 2009
Daily net production for the quarter ended March 31, 2010
Rocky
Permian
Basin
22%
Gulf
Rocky
Basin
32%
Gulf
13
Near-Term Drilling Catalysts
|
AXAS OPERATED:
|
OUTSIDE OPERATED:
|
|
Bakken/Three Forks, North Dakota
• 2+ horizontal oil wells
• Permitting
• AXAS ~40% WI
West Texas
• 5 vertical oil wells
• 1 horizontal oil well
|
Bakken/Three Forks, North Dakota
• Continental operated
• Flowing back (TF)
• AXAS 2% WI
• Oasis operated
• On production (Bakken)
• AXAS 2% WI
|
|
• Permitting
• AXAS 100%
|
• Continental operated
• Summer 2010
|
|
Eagle Ford, South Texas
• First horizontal well
• End of summer (2010)
• Oil window
• AXAS 100%
|
• ECO-Pad ™
• 4 wells (2-Bakken, 2-TF)
• AXAS 4% WI
|
|
Canada
• 2 horizontal oil wells
• Summer 2010
• CANAXAS 100%
|
|

14
Business Plan
§ Allocate portion of 2010 CapEx to Bakken
§ Investigate Bakken acceleration
§ Increase Eagle Ford position
§ Principally in oil leg
§ Non-core asset sales: >$40 MM - principally non-op
§ Pay down debt
§ Accelerate CapEx: 1/2 of sales above $10 MM
§ Target 50/50 oil/gas production mix by end of 2010
§ Target greater than 90% operated by end of 2010
§ NOL preservation
§ Increase investor interest
§ Increase analyst coverage
§ 3 new equity analyst since year-end ‘09

15
NASDAQ: AXAS

16
Appendix
17
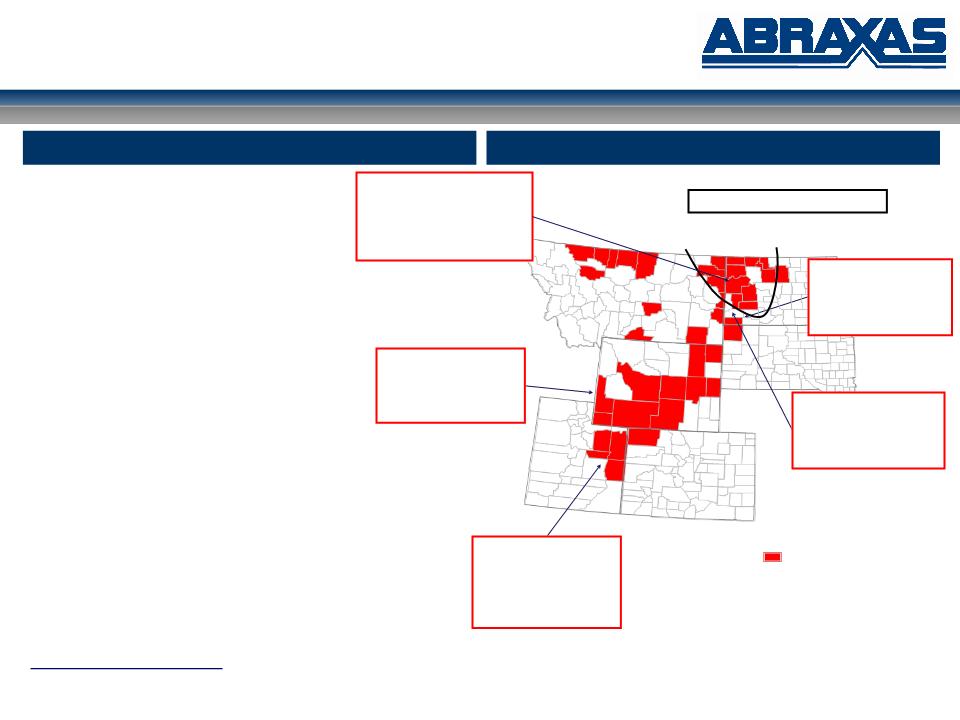
Rocky Mountain
Ø 7.2 MMBoe of proved reserves
Ø 63% proved developed
Ø 82% crude oil
Ø 1,045 Boepd of production
Ø 19.0 R/P ratio
Ø 900 gross (110 net) producing wells
Ø 66 PUD locations
Ø 90,362 net acres
Ø Primary producing basins include:
§ Williston Basin (MT and ND)
§ Powder River & Green River Basins (WY)
§ Unita Basin (UT)
Ø Bakken / Three Forks - HBP
Rocky Mountain
ND
SD
MT
WY
CO
UT
Medicine Pole Hills Unit
Bowman Co., ND
3 PUD
Red River B: 9,350’
Operator: Continental
Natural Buttes Field
(Chapita Wells Unit)
Uintah Co., UT
27 PUD
Wasatch: 7,000’
Operator: EOG Resources
Cow Hollow Field
Lincoln Co., WY
8 PUD
Frontier: 11,000’
Operator: Kerr-McGee
Bakken Play / Three Forks / Sanish
Area of Operations
Overview
Roosevelt Field
Billings Co., ND
3 PUD
Nisku: 10,000’
Operator: Abraxas/Summit
North Fork / Nesson Fields
McKenzie / Williams Co., ND
21 PUD
Bakken: 10,000’
Operator: Abraxas
Net proved reserves, well count and acreage as of December 31, 2009
Daily net production for the quarter ended March 31, 2010
18
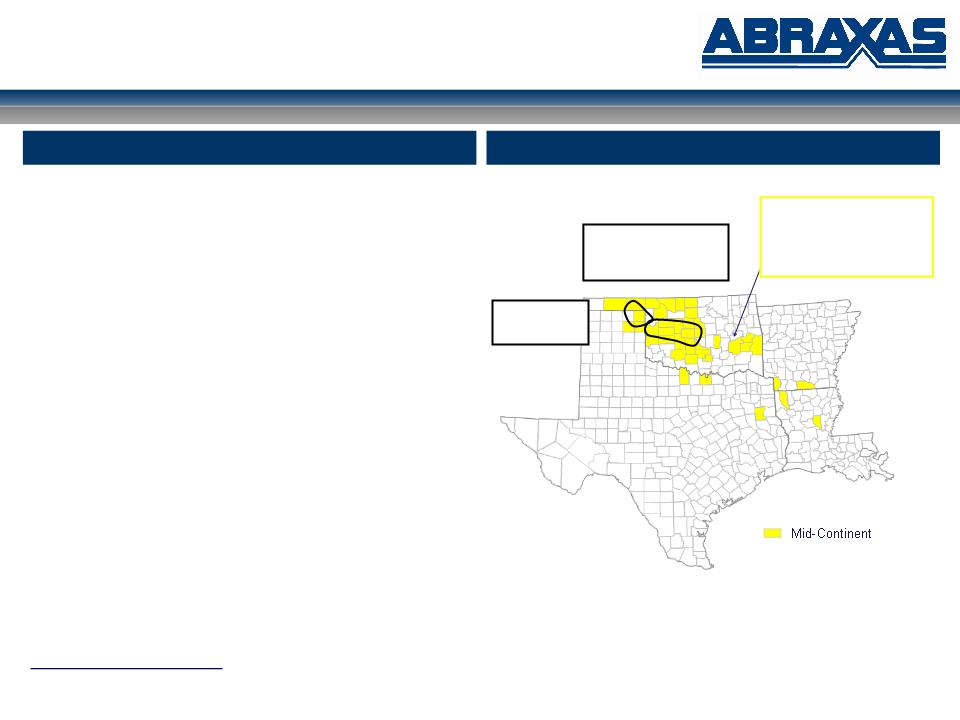
Mid-Continent
Ø 3.1 MMBoe of proved reserves
Ø 72% proved developed
Ø 84% natural gas
Ø 692 Boepd of production
Ø 12.3 R/P ratio
Ø 617 gross (89 net) producing wells
Ø 56 PUD locations
Ø 22,703 net acres
Ø Primary producing basins include:
§ Anadarko Basin (Western OK)
§ Arkoma Basin (Eastern OK)
§ ARK-LA-TEX
Ø Cana Shale (Cimarex, Devon, Chesapeake) - HBP
Ø Granite Wash (Forest, Newfield, Cimarex) - HBP
TX
OK
AR
LA
Central Anadarko
Cana - Woodford
Shale Play
Pittsburg County CBM
Pittsburg Co., OK
53 PUD
Hartshorne Coal: 3,000’
Operator: Chesapeake / AXAS
Area of Operations
Overview
Net proved reserves, well count and acreage as of December 31, 2009
Daily net production for the quarter ended March 31, 2010
Granite Wash
Play
19
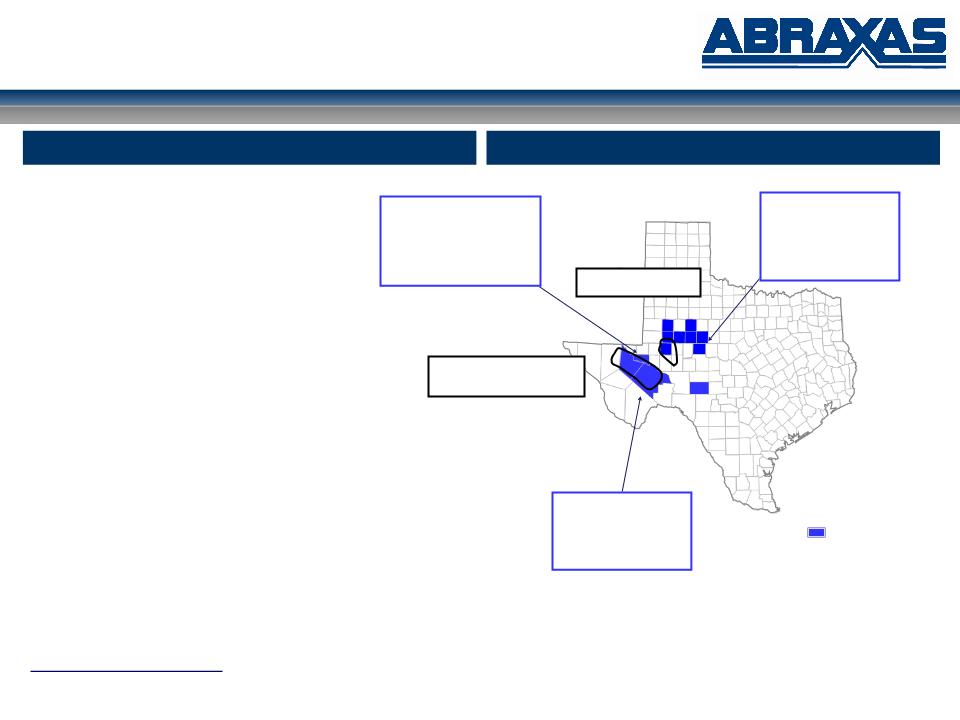
Permian Basin
Permian Basin
Ø 5.6 MMBoe of proved reserves
Ø 66% proved developed
Ø 70% natural gas
Ø 1,281 Boepd of production
Ø 11.9 R/P ratio
Ø 237 gross (158 net) producing wells
Ø 13 PUD locations
Ø 36,064 net acres
Ø Primary producing sub-basins:
§ Delaware Basin
§ Eastern Shelf
Ø Barnett / Woodford Shale - fee minerals
TX
Oates SW
Pecos Co., TX
1 PUD
Devonian: 14,000’
Operator: Abraxas
Operator: Abraxas
ROC Complex
Ward Co., TX
2 PUD
Devonian: 13,000’
Montoya: 14,000’
Operator: Abraxas
Area of Operations
Overview
Beulah Coleman
Midland Co., TX
8 PUD
Wolfberry: 9,000’
Devonian: 11,500’
Operator: Abraxas
Barnett / Woodford
Shale Play
Wolfberry Trend
Net proved reserves, well count and acreage as of December 31, 2009
Daily net production for the quarter ended March 31, 2010
20
Gulf Coast
Gulf Coast
Ø 9.0 MMBoe of proved reserves
Ø 38% proved developed
Ø 91% natural gas
Ø 1,010 Boepd of production
Ø 24.5 R/P ratio
Ø 74 gross (48 net) producing wells
Ø 17 PUD locations
Ø 11,414 net acres
Ø Primary producing sub-basin:
§ Onshore Gulf Coast
Ø Eagle Ford Shale - HBP
§ Currently leasing additional acreage
TX
Portilla Field
San Patricio Co., TX
3 PUD (2 PDNP)
Frio: 7,000’
Vicksburg: 9,000’
Vicksburg: 9,000’
Operator: Abraxas
Edwards Trend
DeWitt / Lavaca Co., TX
11 PUD (3 PDNP)
Edwards: 13,500’
Operator: Abraxas
Area of Operations
Overview
Eagle Ford
Shale Play
Net proved reserves, well count and acreage as of December 31, 2009
Daily net production for the quarter ended March 31, 2010

21
NASDAQ: AXAS