Attached files
| file | filename |
|---|---|
| 8-K - 8-K - Encompass Health Corp | form_8k-06232010presentation.htm |
1
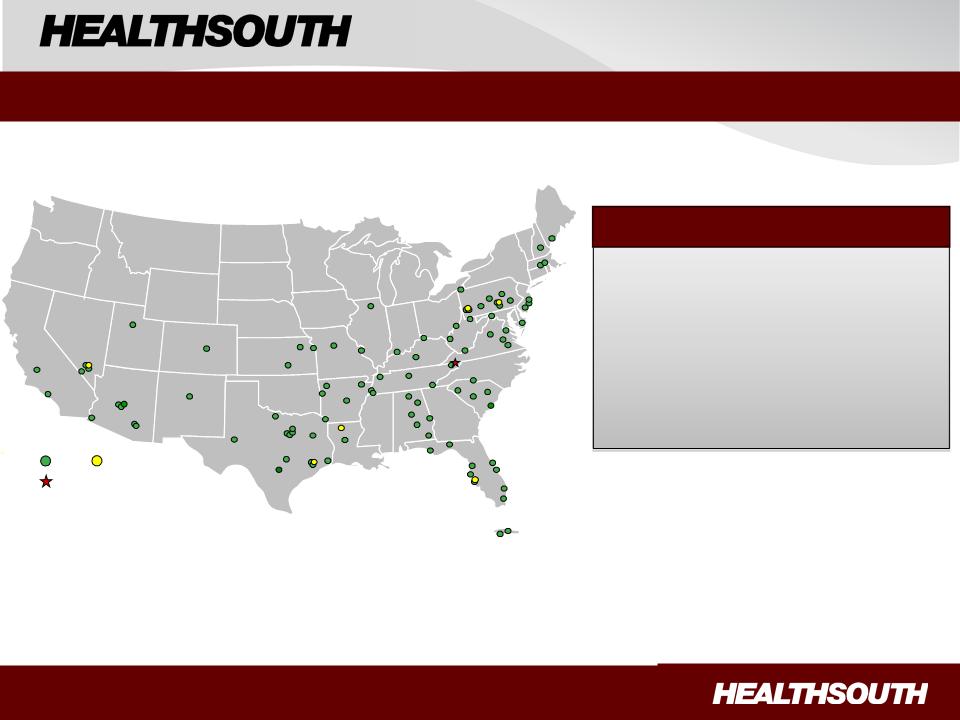
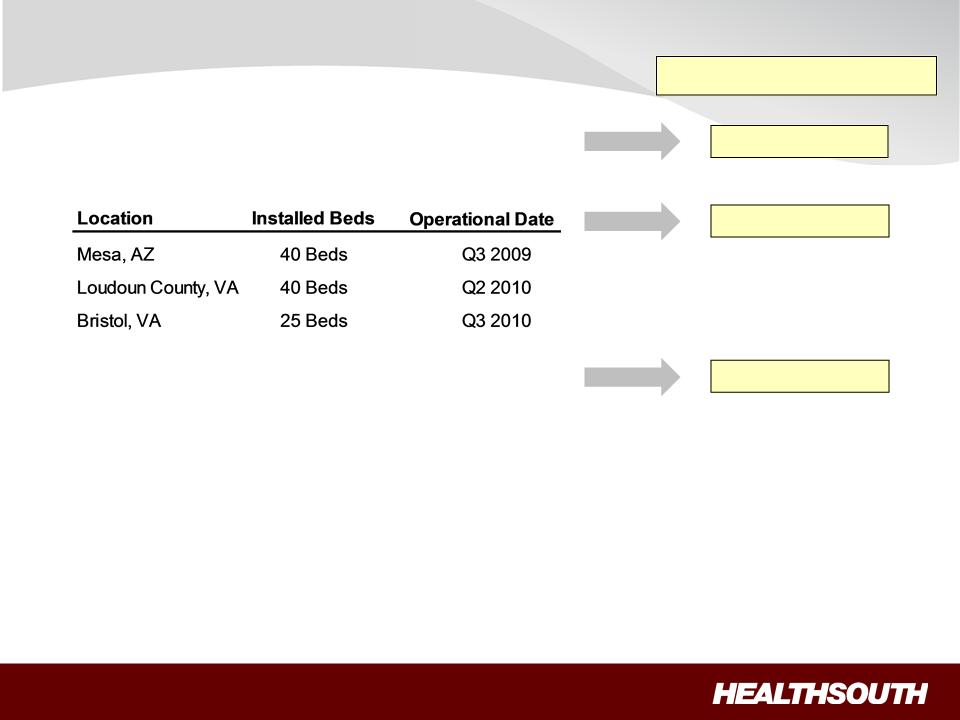
IRH
LTCH
Sites under construction
Wells Fargo Healthcare Conference
June 23-24, 2010
95 Rehabilitation Hospitals
38 Outpatient Rehab Satellite Clinics
6 Long-Term Acute Care Hospitals
25 Hospital-Based Home Health
Agencies
Agencies
22,000 Employees
Portfolio
Largest Provider of Inpatient Rehabilitative Healthcare Services in the U.S.
Exhibit 99.1
Exhibit 99.1

2
Note Regarding Forward-Looking Statements
The information contained in this presentation includes certain estimates, projections and other forward-looking information
that reflect our current views with respect to future events and financial performance. These estimates, projections and other
forward-looking information are based on assumptions that HealthSouth believes, as of the date hereof, are reasonable.
Inevitably, there will be differences between such estimates and actual results, and those differences may be material.
There can be no assurance that any estimates, projections or forward-looking information will be realized. All such estimates,
projections and forward-looking information speak only as of the date hereof. HealthSouth undertakes no duty to publicly
update or revise the information contained herein.
projections and forward-looking information speak only as of the date hereof. HealthSouth undertakes no duty to publicly
update or revise the information contained herein.
This presentation also includes estimates and projections published by the Centers for Medicare and Medicaid Services
(“CMS”). We are not able to verify those estimates or projections or the detailed calculations thereof by CMS which are not
made public. Any changes or errors in those calculations, among other uncertainties such as those referred to below and
changes in CMS’s own rules and policies, could cause actual results to differ materially from CMS’s projections.
Furthermore, we do not believe that CMS numbers are consistent with financial reporting results. CMS data and projections
should not be used as an indication of financial performance.
You are cautioned not to place undue reliance on the estimates, projections and other forward-looking information in this
presentation as they are based on current expectations and general assumptions and are subject to various risks,
uncertainties and other factors, including those set forth in our Form 10-K for the year ended December 31, 2009, and our
Form 10-Q for the quarter ended March 31, 2010, and in other documents we previously filed with the SEC, many of which
are beyond our control, that may cause actual results to differ materially from the views, beliefs and estimates expressed
herein.
Note Regarding Presentation of Non-GAAP Financial Measures
The following presentation includes certain “non-GAAP financial measures” as defined in Regulation G under the Securities
Exchange Act of 1934. The Appendix at the end of this presentation includes reconciliations of the non-GAAP financial
measures found in the following presentation to the most directly comparable financial measures calculated and presented in
accordance with Generally Accepted Accounting Principles in the United States. Our Form 8-K, dated June 23, 2010,
provides further explanation and disclosure regarding our use of non-GAAP financial measures and should be read in
conjunction with these presentation slides. Our SEC filings, including that Form 8-K, can be found on our website at
http://investor.healthsouth.com/.
Cautionary Statements
Exhibit 99.1

3
Strategy Recap
ü Priority: Reduce our leverage and strengthen our balance sheet
- No obvious near-term debt repayment opportunities
- 10 ¾ Senior Notes callable June 2011 at 105 ⅜
- 2010 focus: growing Adjusted Consolidated EBITDA (1) to reduce leverage
ü Near-term: Capitalize on our market-leading position in inpatient
rehabilitation
rehabilitation
- Continue to increase market share
- Break ground on a minimum of two new rehabilitation hospitals each year
- Acquire or joint venture a minimum of two IRFs per year
ü Longer-term: Prepare for potential expansion into complementary
post-acute services
post-acute services
(1) Reconciliation to GAAP provided on slides 35 and 36.
Exhibit 99.1
4
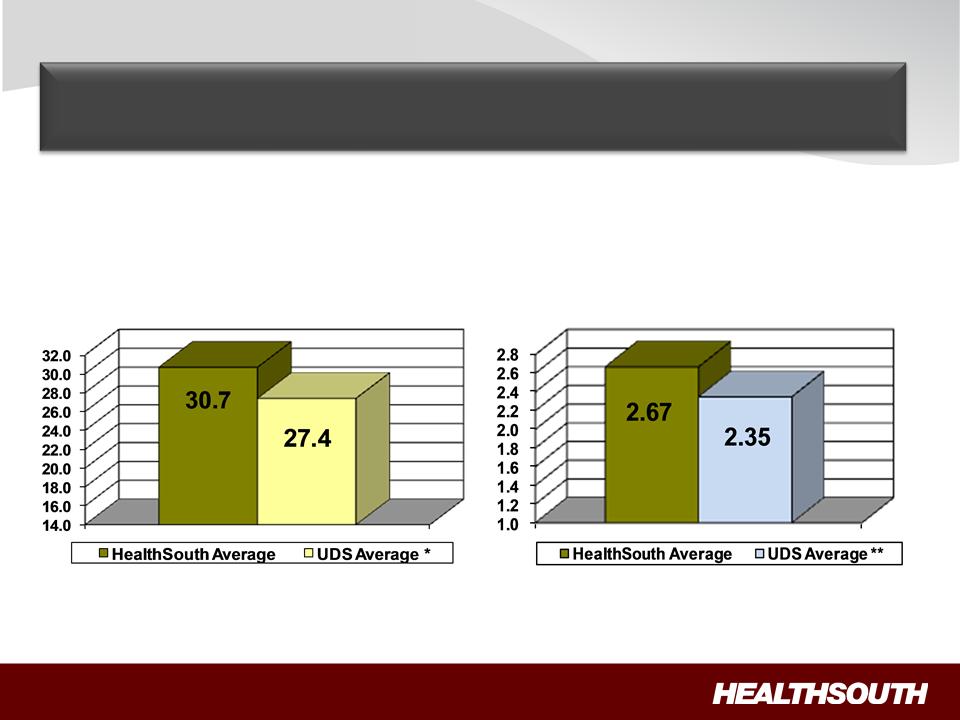
FIM Gain
LOS Efficiency
LOS Efficiency = Functional gain
divided by length of stay
divided by length of stay
Source: UDSmr Database - On Demand
Reports: Q1 2010 Report
Reports: Q1 2010 Report
FIM Gain = Change in Functional
Independent Measurement (based
Independent Measurement (based
on an 18 point assessment) from
Admission to Discharge
Admission to Discharge
** Average = Expected, Risk-adjusted LOS Efficiency
* Average = Expected, Risk-adjusted FIM Change Average
Our Differentiation: High-Quality Care
Goal: Teach patients to walk, dress, bathe, eat and
manage daily life in the community.
manage daily life in the community.
Exhibit 99.1

5
Our Differentiation: Cost-Effective Care
CMS Fiscal Year 2010 IRF Rate Setting File Analysis (1)
|
|
Freestanding
(2) |
Units (2)
|
Total
|
|
HealthSouth
|
|
|
Hospitals (2)
|
||||
|
Number of IRFs
|
228
|
953
|
1,181
|
|
94
|
|
Average # of Discharges per IRF
|
649
|
237
|
316
|
|
822
|
|
Outlier Payments as % of Total
Payments |
1.32%
|
4.08%
|
3.00%
|
|
0.43%
|
|
Average Estimated Total Payment
per Discharge for FY 2010 |
$16,452
|
$16,741
|
$16,626
|
|
$15,996
|
|
Average Estimated Cost per
Discharge for FY 2010 |
$14,021
|
$17,207
|
$15,945
|
|
$12,633
|
Notes:
(1) All data provided was filtered and compiled from the Centers for Medicare and Medicaid Services (CMS) Fiscal Year 2010 IRF rate setting final
rule file found at http://www.cms.hhs.gov/InpatientRehabFacPPS/07_DataFiles.asp#TopOfPage. The data presented was developed entirely by
CMS and is based on its definitions which are different in form and substance from the criteria HealthSouth uses for external reporting purposes.
Because CMS does not provide its detailed methodology, HealthSouth is not able to reconstruct the CMS projections or the calculation.
(2) The CMS file contains data for each of the 1,181 inpatient rehabilitation facilities used to estimate the policy updates for the FY 2010 Final IRF-
PPS Rule. Most of the data represents historical information from the CMS fiscal year 2008 period and does not reflect the same HealthSouth
hospitals in operation today. The data presented was separated into three categories: Freestanding, Units, and HealthSouth. HealthSouth is a
subset of Freestanding and the Total.
Exhibit 99.1
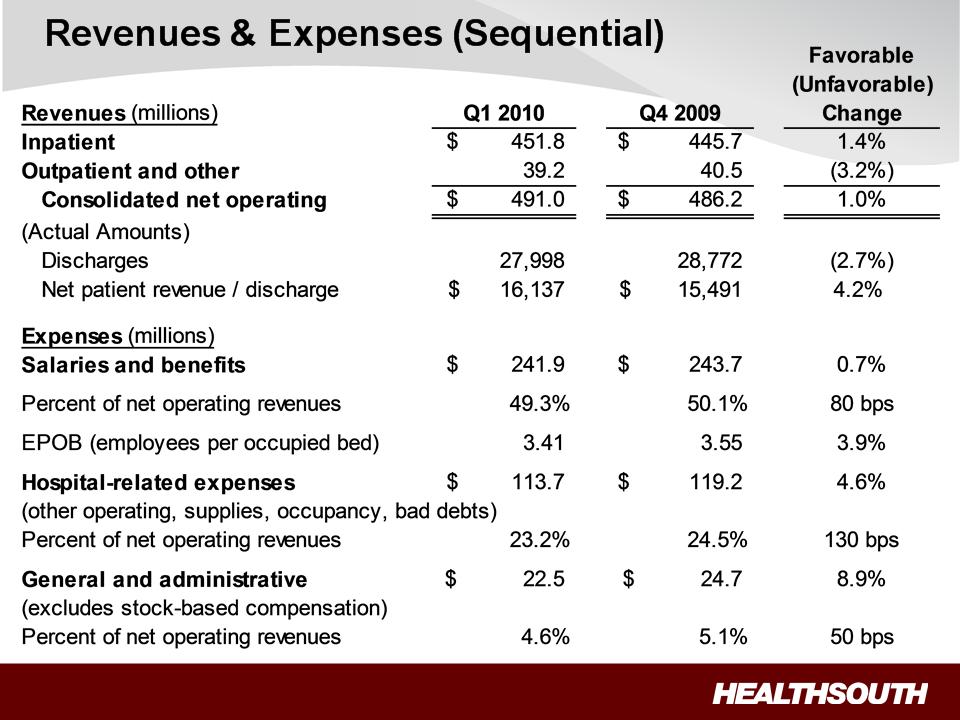
6
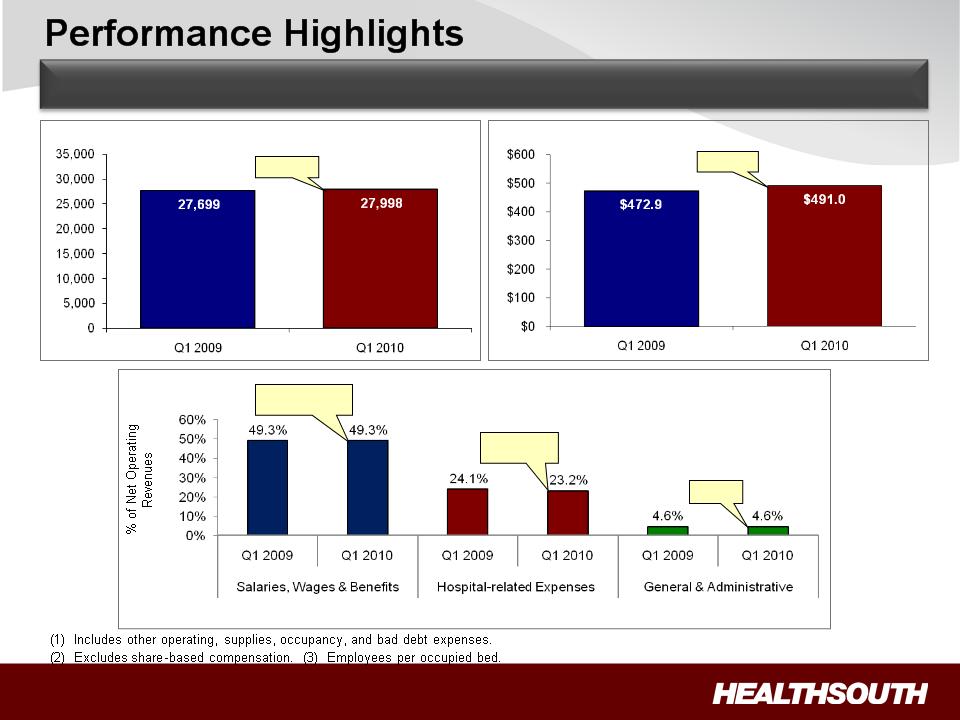
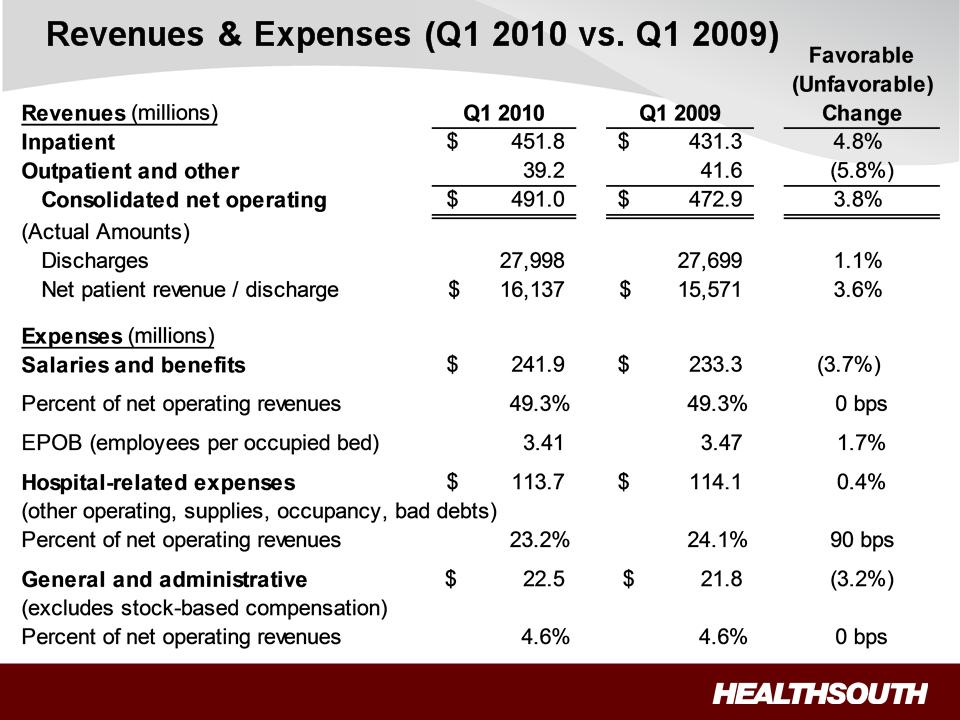
Discharges
Consolidated Net Operating Revenues
($ Millions)
+3.8%
+1.1%
Dollar Amounts $233.3 $241.9 $114.1 $113.7 $21.8 $22.5
EPOB (3) 3.47 3.41
Flat despite
wage increase
wage increase
Flat
90 bps
Improvement
Improvement
Expenses
(1)
(2)
Solid, Sustained Operating Results
Exhibit 99.1
7
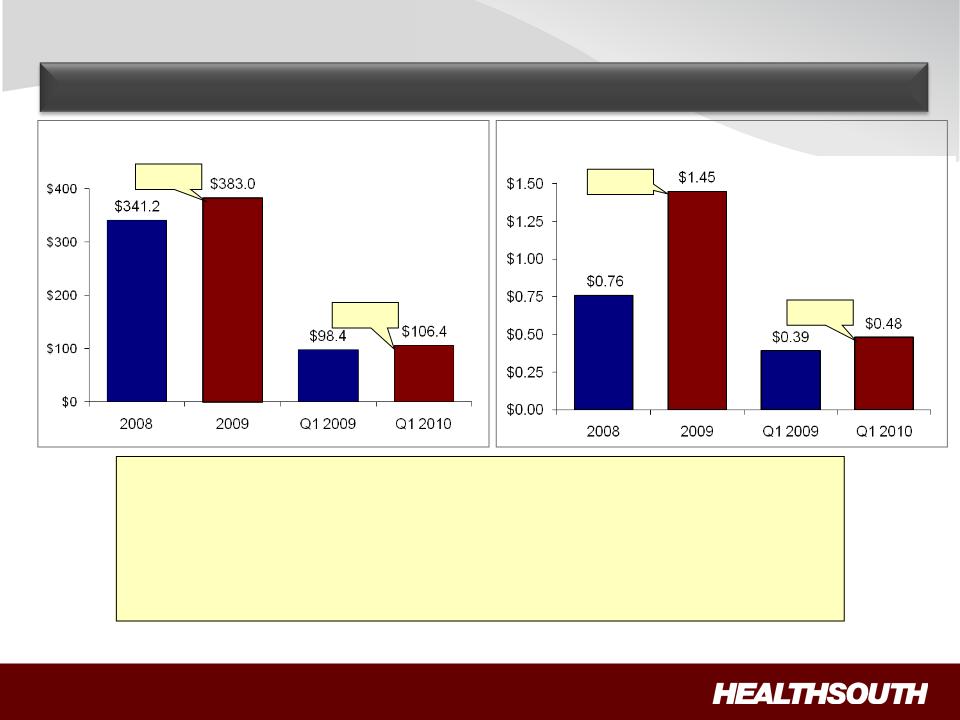
Adjusted Income from Continuing
Operations per Diluted Share (1)
Adjusted Consolidated EBITDA (1)
($ Millions)
+12.3%
(1) Reconciliation to GAAP provided on slides 35 and 36.
Performance Highlights
Solid EBITDA and EPS Growth
+8.1%
+90.8%
+23.1%
Key Drivers:
ü2.5% Medicare market basket increase effective October 1, 2009
üDischarge growth of 1.1% quarter over quarter
üDisciplined expense management
üSolid labor productivity as reflected by EPOB
Exhibit 99.1
8
(1) Notes on page 36.
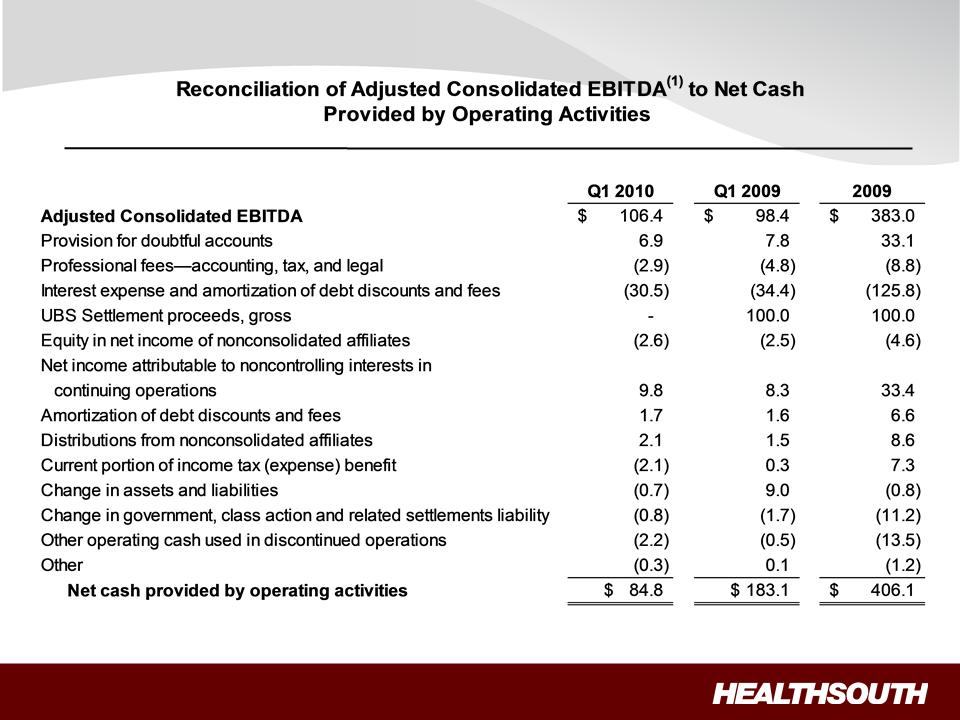
Performance Highlights: Strong Free Cash Flow
Exhibit 99.1
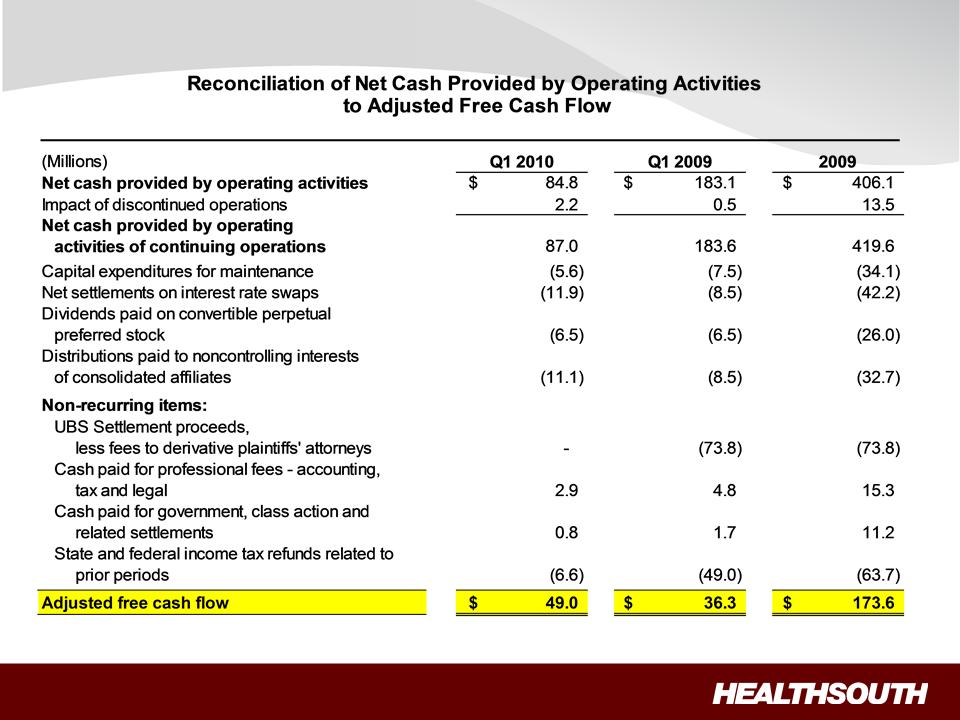
9
Performance Highlights: Strong Free Cash Flow
Exhibit 99.1

10
• Reminder: On May 4, 2010, based on the results of Q1, the Company
raised its 2010 full-year performance forecast to the high end of the
guidance ranges.
raised its 2010 full-year performance forecast to the high end of the
guidance ranges.
• Good performance through May (volume, expense management and
pricing) compared to same period last year.
pricing) compared to same period last year.
§ Volume: solid in April, soft in May, appears to be rebounding in June
§ Expenses: continue to be aggressively managed
§ Pricing: favorable trend
• New Hospitals:
§ Began integration of Desert Canyon Rehabilitation Hospital on June 1, 2010
§ Began taking patients at HealthSouth Rehabilitation Hospital of Northern
Virginia on June 14, 2010
Virginia on June 14, 2010
• As is our policy, full-year guidance will be addressed as part of our
quarterly earnings release.
quarterly earnings release.
Performance Update
Exhibit 99.1
11
Summary
ü Strong Cash Flows: Directed toward debt reduction and growth.
ü Continued Deleveraging: Reduce leverage to between 3.5x and 4.0x
no later than YE 2011.
no later than YE 2011.
ü Growth: Above industry volume growth, enhanced by capacity
expansions and adding new hospitals in underserved markets.
expansions and adding new hospitals in underserved markets.
ü Opportunistic, Disciplined Acquisitions: Complementary IRF
acquisitions and JVs in a fragmented market.
acquisitions and JVs in a fragmented market.
ü Well Positioned: High-quality + cost-effective provider; proven track
record of adapting to regulatory changes.
record of adapting to regulatory changes.
Value Proposition
Business Model:
• 5 - 8 % annual Adjusted Consolidated EBITDA growth (1)
• 15 - 20% annual Adjusted EPS growth (1) (2)
(1) For reconciliation to GAAP, see slides 35 and 36.
(2) Based on adjusted income from continuing operations per diluted share.
Exhibit 99.1

12
Appendix
Exhibit 99.1

13
• Patients come to HealthSouth with diagnoses of
stroke, brain injury, trauma, neurological conditions,
pulmonary/cardiac disease, amputations and
orthopedic conditions/surgeries.
stroke, brain injury, trauma, neurological conditions,
pulmonary/cardiac disease, amputations and
orthopedic conditions/surgeries.
• ~ 72% of inpatient rehabilitation patients are over 65.
• Patients receive 24 hour nursing care, seven days
a week, with at least three hours of therapeutic
intervention, including physical, occupational and
speech therapy.
a week, with at least three hours of therapeutic
intervention, including physical, occupational and
speech therapy.
• Our team includes rehabilitative physicians, physical
therapists, occupational therapists, speech-language
pathologists, rehabilitative nurses, pharmacists,
dieticians and case managers.
therapists, occupational therapists, speech-language
pathologists, rehabilitative nurses, pharmacists,
dieticians and case managers.
• Our goal is to teach patients to walk, dress, bathe,
eat and manage daily life in their community.
eat and manage daily life in their community.
About HealthSouth
Our Patients, Our Care and Our Team
Exhibit 99.1
14
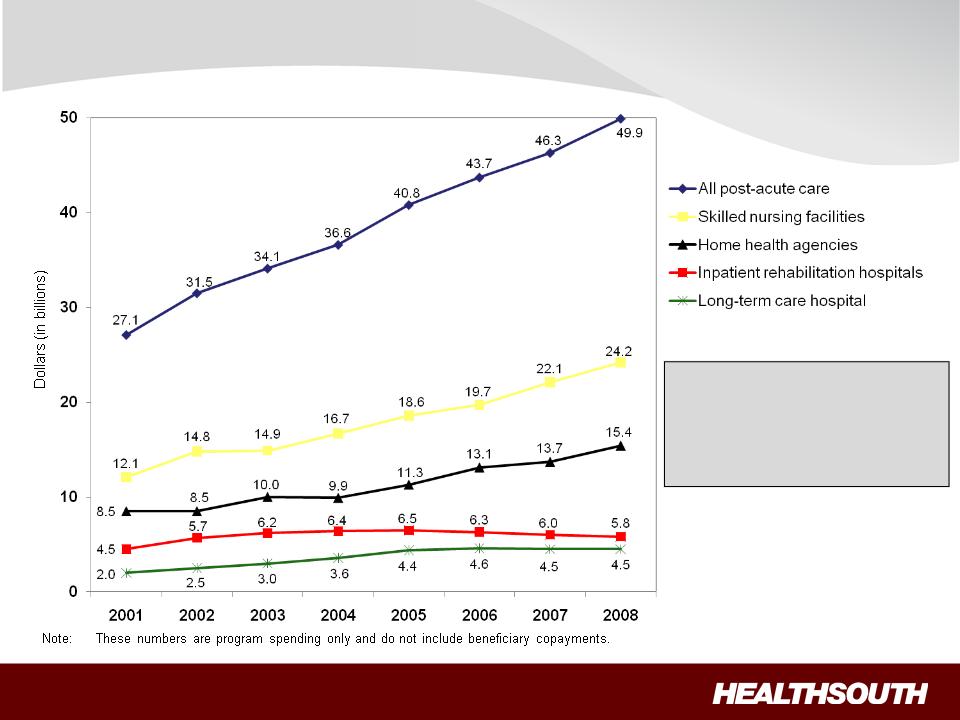
Source: Centers for Medicare and Medicaid Services, Office of the Actuary (MedPAC June 2009 Data Book - Page 124)
“The Basics”: Medicare Spending on Post-Acute
Services
Services
• Inpatient rehabilitation
is less than 12% of
Medicare post-acute
spending.
is less than 12% of
Medicare post-acute
spending.
Exhibit 99.1
15
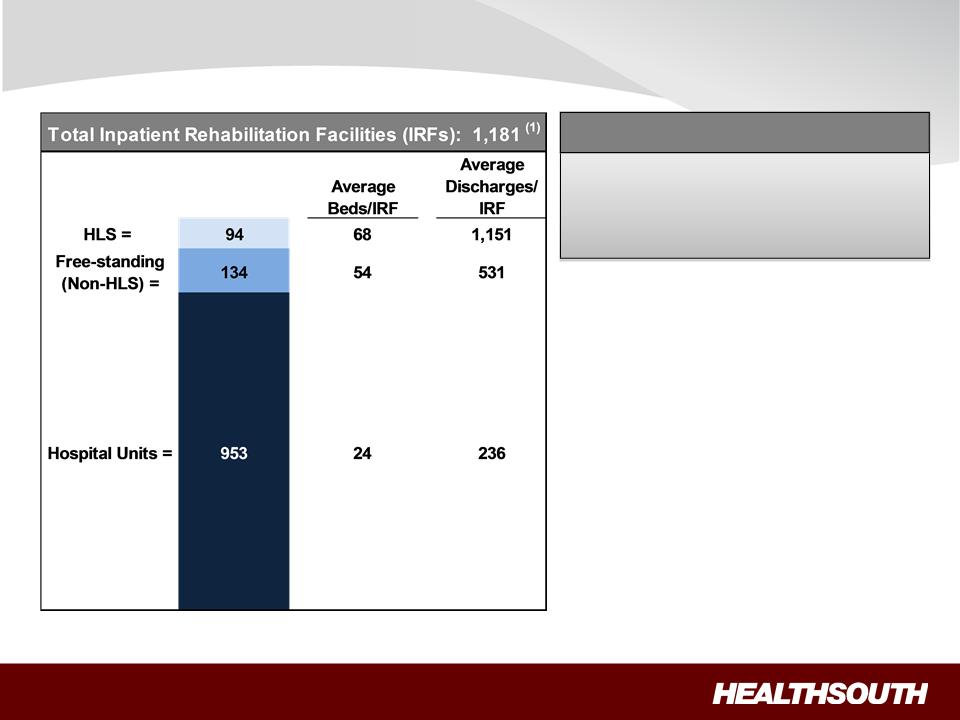
“The Basics”: Our Industry
Sources: FY 2010 CMS Rate Setting File and MedPAC March 2009 report; Internal HLS reports for HLS data
(1) Does not include HealthSouth Rehabilitation Hospital of Northern Virginia.
ü Highly fragmented industry
• ~ 81% Units
• ~ 19% Free-standing
ü Industry mainly nonprofit
• ~ 62% Nonprofit
• ~ 14% Government
• ~ 24% For-profit
ü On average, HLS hospitals tend to
be larger and treat more patients.
be larger and treat more patients.
~ 8% of IRFs
~ 18% of Licensed Beds
~ 21% of Patients Served
HealthSouth Market Share
Exhibit 99.1
16
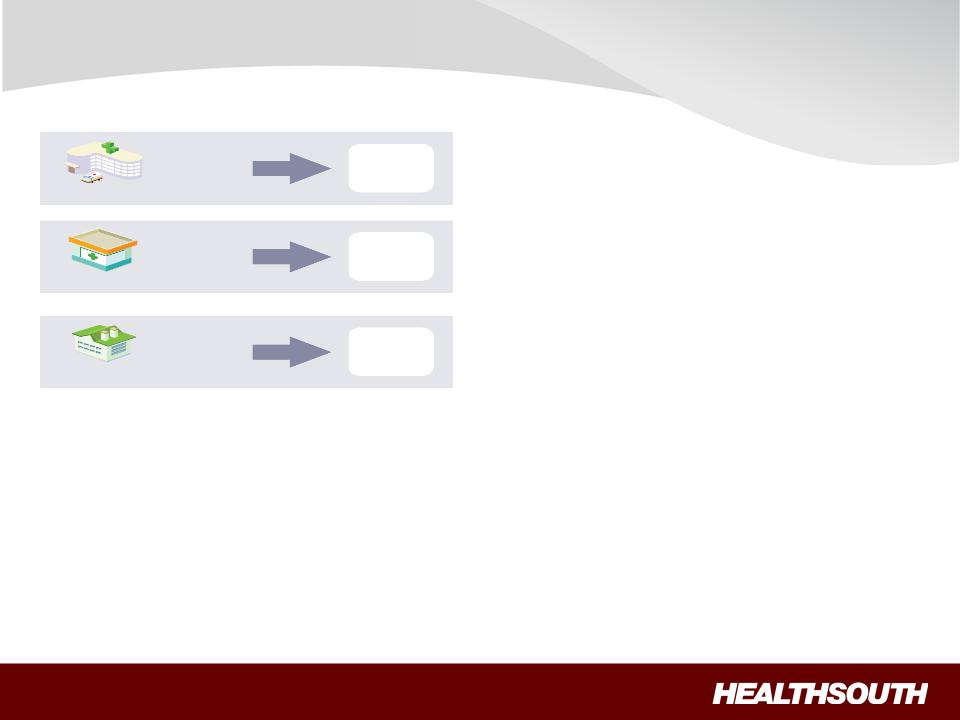
“The Basics”: Our Patients (~ 72% are > 65 years old)
94%
5%
1%
Referral Sources
Acute Care Hospitals
Physician Offices
Skilled Nursing Facilities
Admission to an IRF:
Most Common Cases (2009)
1. Stroke 17.5%
2. Neurological 13.3%
3. Fracture of the lower extremity 11.7%
4. Debility 11.5%
5. Knee/Hip replacement 9.6%
6. Other orthopedic conditions 9.5%
7. Brain injury 7.4%
8. Cardiac conditions 4.7%
9. Spinal cord injury 3.6%
10. All other 11.2%
ü Physicians and acute care hospital case managers are key decision-makers.
ü All IRF patients must meet reasonable and necessary criteria and are admitted by a
physician.
physician.
ü All IRF patients must be medically stable and have potential to tolerate three hours of
therapy per day (minimum).
therapy per day (minimum).
ü Receive 24 hour, 7 days a week nursing care.
Exhibit 99.1
17
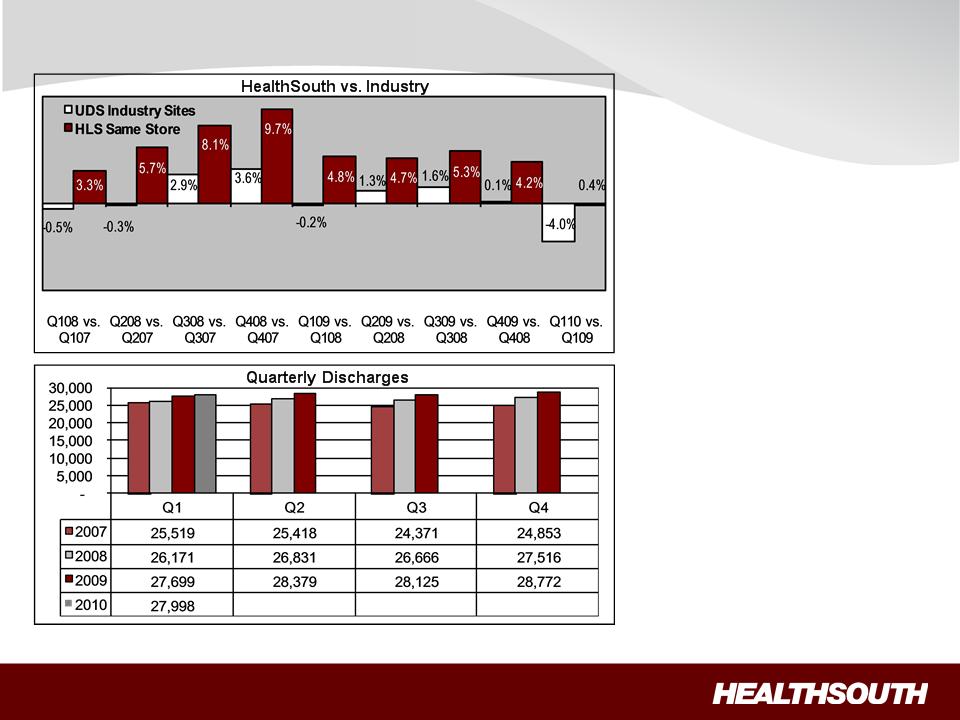
(1) Data provided by UDSMR, a data gathering and analysis organization for the rehabilitation industry; represents ~ 65-70% of industry, including 89 HealthSouth sites.
(2) Includes 89 consolidated HealthSouth inpatient rehab hospitals and six long-term acute-care hospitals.
“The Basics”: Discharge Growth - Historical
ü HealthSouth’s volume
growth has outpaced
competitors’
growth has outpaced
competitors’
ü TeamWorks =
standardized sales &
marketing
standardized sales &
marketing
ü Capacity expansions will
help facilitate organic
growth:
help facilitate organic
growth:
• ~ 100+ beds will be added
in 2010
in 2010
(1)
(2)
Exhibit 99.1
18
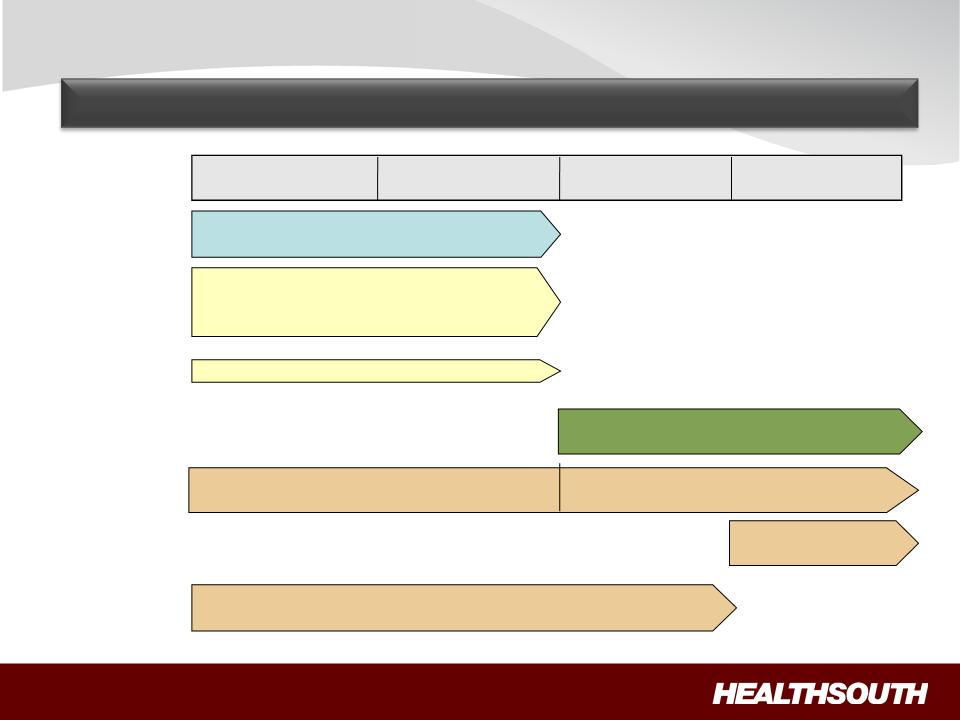
Business Outlook
3.5x to 4.0x Debt to EBITDA (by YE 2011)
(Exclusive of any E&Y settlement)
Organic growth through capacity
expansion and de novos
expansion and de novos
($60+ million in 2010)
IRF acquisitions/joint ventures
Deleveraging
Growth
Acquisitions of other,
complementary post-acute services
complementary post-acute services
Reform
1. Pricing
2. Bundling
Sector
Regulation
Regulation
Pilot/Demonstration
Projects
Projects
• LTCH: admission criteria; 25% Rule; MMSEA extension
• Home Health: outliers; reimbursement methodology
Deleveraging, Growth, Reform and Sector Regulation
Market basket minus 25 bps Market basket minus 10 bps
and productivity adjustment
and productivity adjustment
2010 2011 2012 2013
Exhibit 99.1

19
|
Future Regulatory Risk
|
|
IRF
|
SNF
|
LTCH
|
HH
|
|
|
|
|
|
|
|
|
1. Re-basing payment system
|
|
No
|
Yes; RUGS IV
delayed until 10/01/11
(per PPACA) |
No
|
Yes; would be required as part of
PPACA starting in 2014 |
|
2. Major outlier payment adjustments
|
|
No
|
No
|
Yes; will occur when
MMSEA relief expires (short stay outliers) |
Yes; 10% cap per agency; 2.5%
taken out of outlier pool (per PPACA) |
|
3. Upcoding adjustments
|
|
No
|
Yes; occurring in
FY 2010 |
Yes; occurring in FY
2010 and proposed (-2.5%) for FY 2011 |
Yes; occurring in CYs 2010
and 2011 |
|
4. Patient criteria
|
|
No; 60% Rule
already in place
|
No
|
Study dictated as
part of MMSEA |
PPACA requires a “face-to-face”
encounter between physicians (or clinicians working with them) and patients before HH services are prescribed |
|
5. Healthcare Reform
|
|
|
|
|
|
|
– Market basket update reductions
|
|
– Known
|
– Known
|
– Known
|
– Known
|
|
– Productivity adjustments
|
|
– Begins 2012
|
– Begins 2012
|
– Begins 2012
|
– Begins 2015
|
|
– Bundling
|
|
– Pilot to be
established by 2013 |
– Pilot to be
established by 2013 |
– Pilot to be
established by 2013 |
– Pilot to be
established by 2013
|
|
– Independent Medicare Advisory Board
|
|
– FY 2019
|
– FY 2015
|
– FY 2019
|
– CY 2015
|
|
– New quality reporting requirements
|
|
– Begins 2014
|
– N/A
|
– Begins 2014
|
– N/A
|
|
– Value based purchasing
|
|
– Pilot begins 2016
|
– Post 2012
|
– Pilot begins 2016
|
– Post 2012
|
|
6. Other
|
|
N/A
|
N/A
|
25% Rule will be
reinstituted when MMSEA moratorium expires |
N/A
|
Regulatory Uncertainty
Sources: Healthcare Reform Bill (PPACA, HERA),CMS Regulatory published rules and MMSEA
Exhibit 99.1
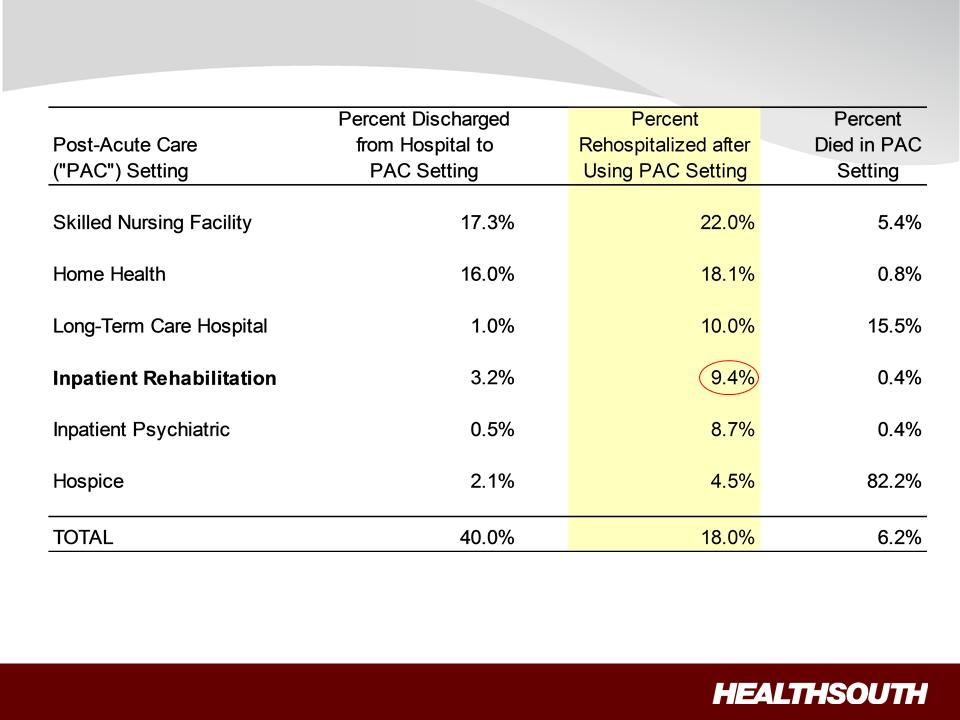
20
Readmission Rates
Note: Use of home health care and hospice is based on care that starts within three days of discharge. Other PAC care starts within one day of
discharge. Home health use includes episodes that overlap an inpatient stay.
discharge. Home health use includes episodes that overlap an inpatient stay.
Source: Medicare Payment Advisory Commission, “A Data Book: Healthcare spending and the Medicare program,” Chart 9-3 (June 2008)
Exhibit 99.1
21
Capacity Expansions:
• ~ 100+ beds 2010
De novos:
Acquisitions/Joint Ventures:
• Acquired the rehabilitation unit in Altoona, PA, through a
newly formed joint venture and relocated its operations to
one of our hospitals. (Q4 2009)
newly formed joint venture and relocated its operations to
one of our hospitals. (Q4 2009)
• Expanded joint venture with St. Vincent Health System
in Little Rock, AR, through the purchase of a 23-bed
rehabilitation unit. (Q1 2010)
in Little Rock, AR, through the purchase of a 23-bed
rehabilitation unit. (Q1 2010)
• Purchased Desert Canyon Rehabilitation Hospital, a 50-bed
inpatient rehabilitation hospital located in southwest Las
Vegas, NV. (Q2 2010)
inpatient rehabilitation hospital located in southwest Las
Vegas, NV. (Q2 2010)
Growth
6 - 7 years (2)
2 - 4 years (1)
(1) Average investment per bed: $100K to $250K.
(2) Average investment per bed: ~ $450K.
6 - 7 years
Target Cash pay-back
Exhibit 99.1
22
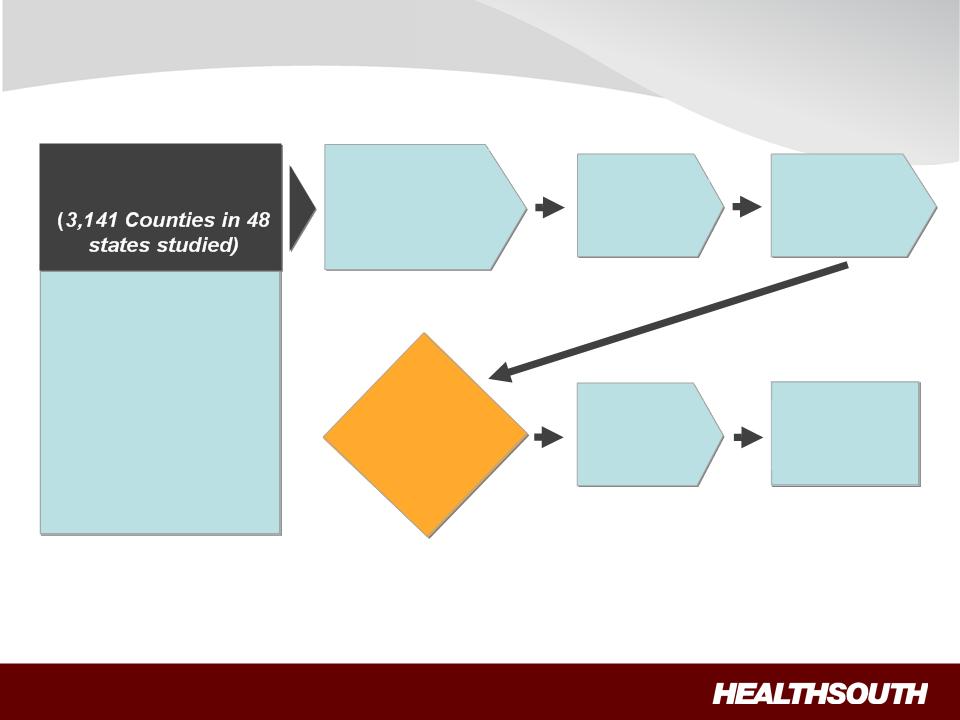
• Population and
Demographics
Demographics
• Acute Care Referral
Sources
Sources
• Inpatient Rehab
Competition
Competition
• SNF Presence
• Payor Environment
• CON/Non-CON
National Market
Assessment
Assessment
Target
Opportunity
Opportunity
List
(160 Opportunities
Identified)
Identified)
Existing IRF
Assessment
Assessment
Corporate
Priority
Assessment
Priority
Assessment
Active
Development
List
Development
List
Growth: Market Assessment Process
Strategic
Approach
Approach
• Buy
• JV
• Build
Regional
President
Assessment
President
Assessment
Exhibit 99.1
23
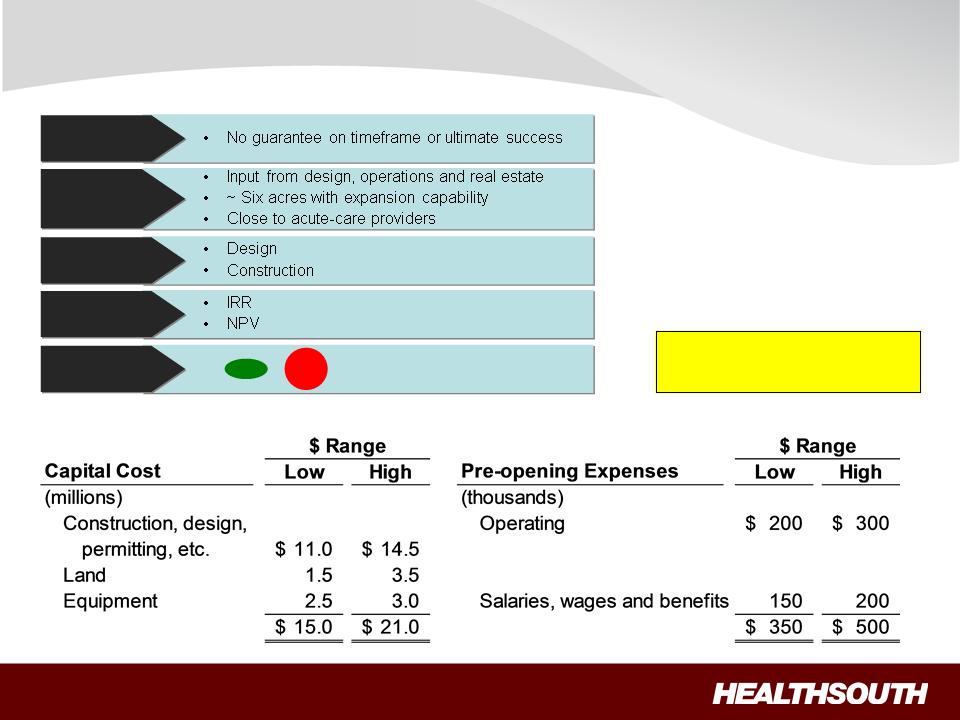
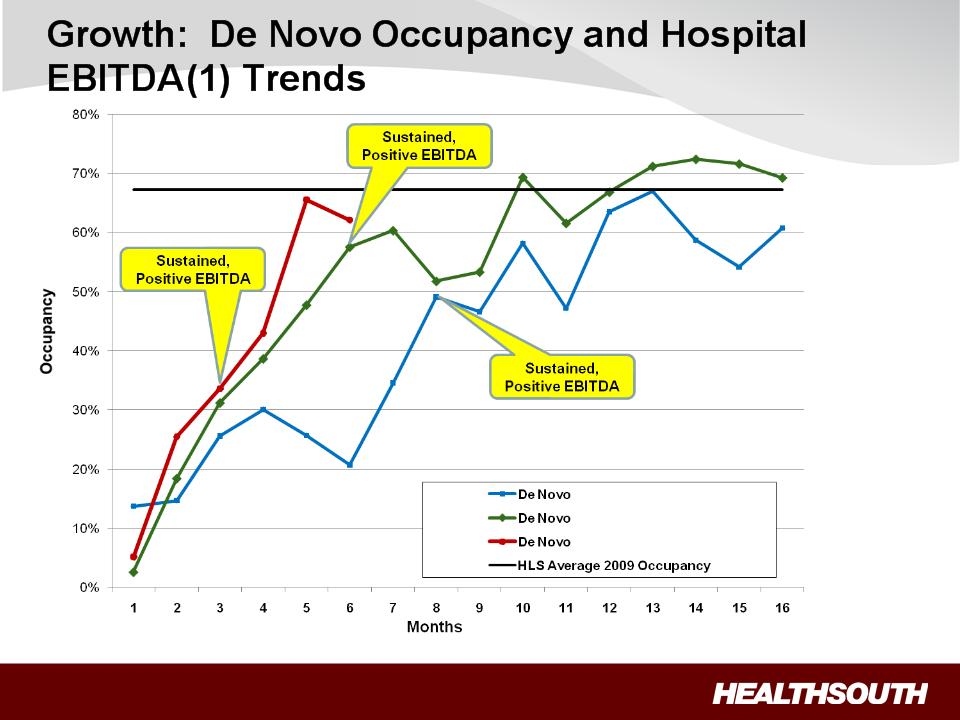
Growth: De Novo Evaluation Process and Cost
CON
Approval
Approval
Site
Selection
Selection
Cost
Assessment
Assessment
Proforma
Financials
Financials
Execution
• Permitting
• Contract for land
NO
GO
GO
• Cash payback analysis
Target Cash Pay-back
6-7 years
6-7 years
Exhibit 99.1
24
(1) Hospital EBITDA = earnings before interest, taxes, depreciation and amortization directly attributable to the related hospital.
Exhibit 99.1
25
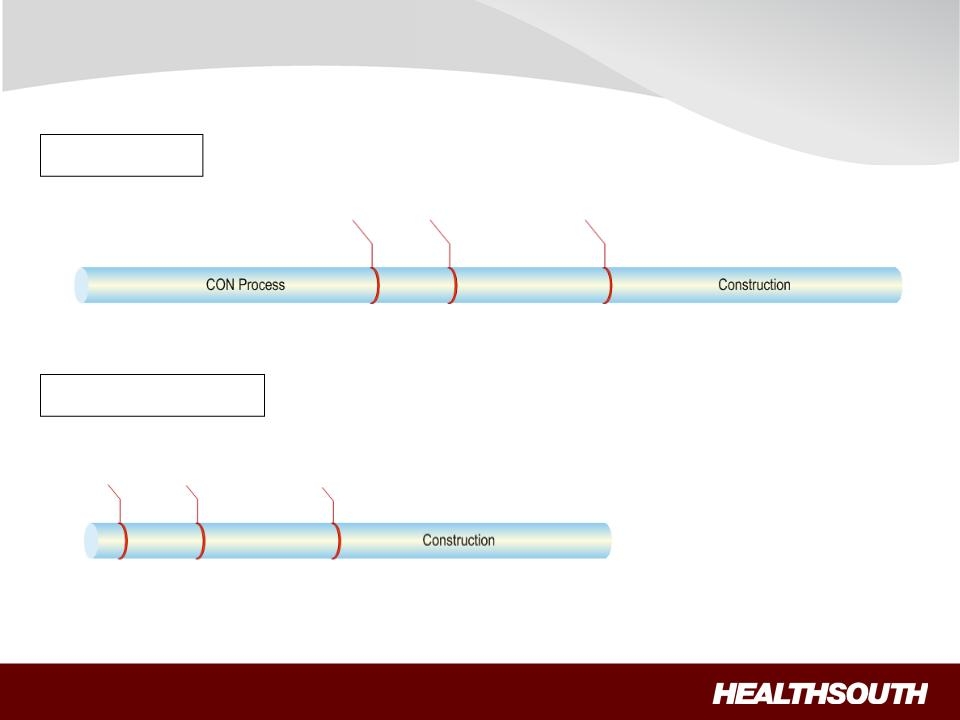
Growth: De Novo Timeline
With CON
Without CON
Internal Approval
Day 1
Internal Approval
Day 1
Design
Planning &
Zoning
Groundbreaking
Month 20
Opening
Month 32
Month 32
Design
Planning &
Zoning
Groundbreaking
Opening
Month 20
Month 20
Month 11
Exhibit 99.1
26
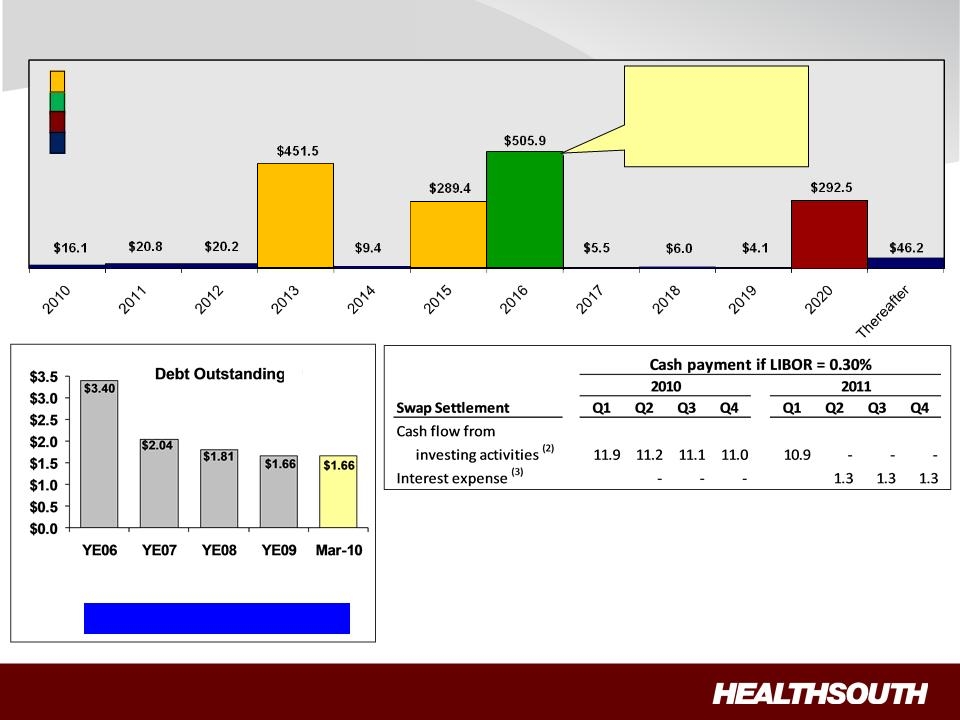
Debt Profile and Swap Settlement
Debt Maturities
As of March 31, 2010
= Term Loan maturities
= 10.75% Fixed
= 8.125% Fixed
= Capital leases & term
loan amortization
loan amortization
(1) Based on trailing four quarter Adjusted Consolidated EBITDA of $391.0 million;
reconciliation to GAAP provided on slides 35 and 36.
reconciliation to GAAP provided on slides 35 and 36.
(2) Cash settlements flow through investing activities for swaps that do not qualify for
hedge accounting. Notional amount of $884 million receives 3 month LIBOR and
pays 5.22% fixed until expiration in March of 2011.
hedge accounting. Notional amount of $884 million receives 3 month LIBOR and
pays 5.22% fixed until expiration in March of 2011.
(3) Forward-starting interest rate swaps (designated as cash flow hedges). Cash
settlements will flow through operating activities as part of interest expense.
Notional amounts of $100 million and $100 million receive LIBOR and pay 2.6%
and 2.9% fixed respectively.
settlements will flow through operating activities as part of interest expense.
Notional amounts of $100 million and $100 million receive LIBOR and pay 2.6%
and 2.9% fixed respectively.
3 month
LIBOR
plus
225 bps
3 month
LIBOR
plus
375 bps
Call Schedule
Date Price
June 15, 2011 105.375
June 15, 2012 103.583
June 15, 2013 101.792
June 15, 2014 100.000
and thereafter
Debt to
EBITDA 6.3x 6.3x 5.3x 4.3x 4.2x (1)
($ Billions)
Year-End 2011 Goal: 3.5x to 4.0x
Exhibit 99.1
27
Exhibit 99.1
28
Exhibit 99.1
29
Adjusted Consolidated EBITDA(1) (Q1 2010 vs. Q1 2009)
(1) Reconciliation to GAAP provided on slides 35 and 36.
In arriving at Adjusted Consolidated EBITDA, the following were excluded from line items:
(2) Restructuring charges associated with closed outpatient satellite clinics of $0.0, $0.0, and $0.3 million, respectively, which reduced occupancy
costs.
costs.
(3) Stock-based compensation expense of $3.8, $3.7, and $13.4 million, respectively, which reduced general and administrative expenses.
(4) Impairments related to investments of $0.0, $0.7 and $1.4 million, respectively, which increased other income.
(5) Noncontrolling interests related to discontinued operations of $0.0, $0.3 and $0.6 million, respectively, which reduced noncontrolling interests expense.
Adjusted Consolidated EBITDA increased $8.0 million, or 8.1%, Q1 2010 vs. Q1 2009
|
(Millions)
|
|
Q1 2010
|
|
Q1 2009
|
|
2009
|
|
Net operating revenues
|
|
$ 491.0
|
|
$ 472.9
|
|
$ 1,911.1
|
|
Operating expenses:
|
|
|
|
|
|
|
|
Salaries and benefits
|
|
241.9
|
|
233.3
|
|
948.8
|
|
Hospital-related expenses:
|
|
|
|
|
|
|
|
Other operating expenses
|
|
66.9
|
|
66.9
|
|
271.4
|
|
Supplies
|
|
28.3
|
|
27.4
|
|
112.4
|
|
Occupancy costs (2)
|
|
11.6
|
|
12.0
|
|
47.3
|
|
Provision for doubtful accounts
|
|
6.9
|
|
7.8
|
|
33.1
|
|
|
|
113.7
|
|
114.1
|
|
464.2
|
|
General and administrative expenses (3)
|
|
22.5
|
|
21.8
|
|
91.1
|
|
Equity in nonconsolidated affiliates
|
|
2.6
|
|
2.5
|
|
4.6
|
|
Other income (4)
|
|
0.7
|
|
0.5
|
|
4.8
|
|
Noncontrolling interests (5)
|
|
(9.8)
|
|
(8.3)
|
|
(33.4)
|
|
Adjusted Consolidated EBITDA
|
|
$ 106.4
|
|
$ 98.4
|
|
$ 383.0
|
Exhibit 99.1
30
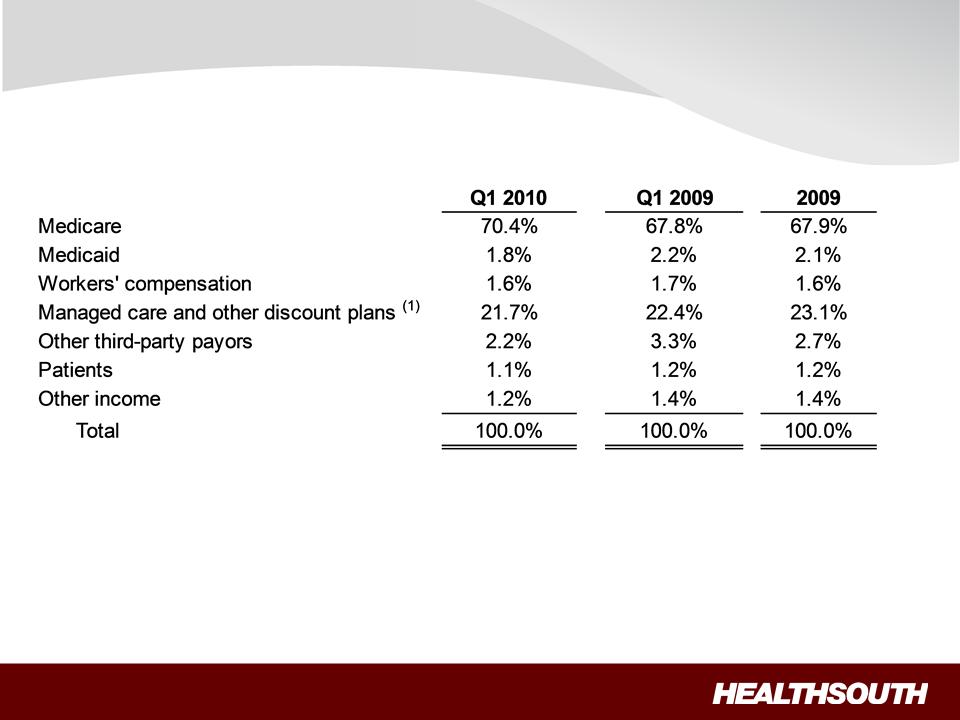
Payment Sources (Q1 2010 vs. Q1 2009)
(1) Managed Medicare revenues represent ~ 7%, 8% and 8% of total revenues for Q1 2010, Q1 2009 and 2009, respectively, and are included
in “Managed care and other discount plans.”
in “Managed care and other discount plans.”
Exhibit 99.1
31
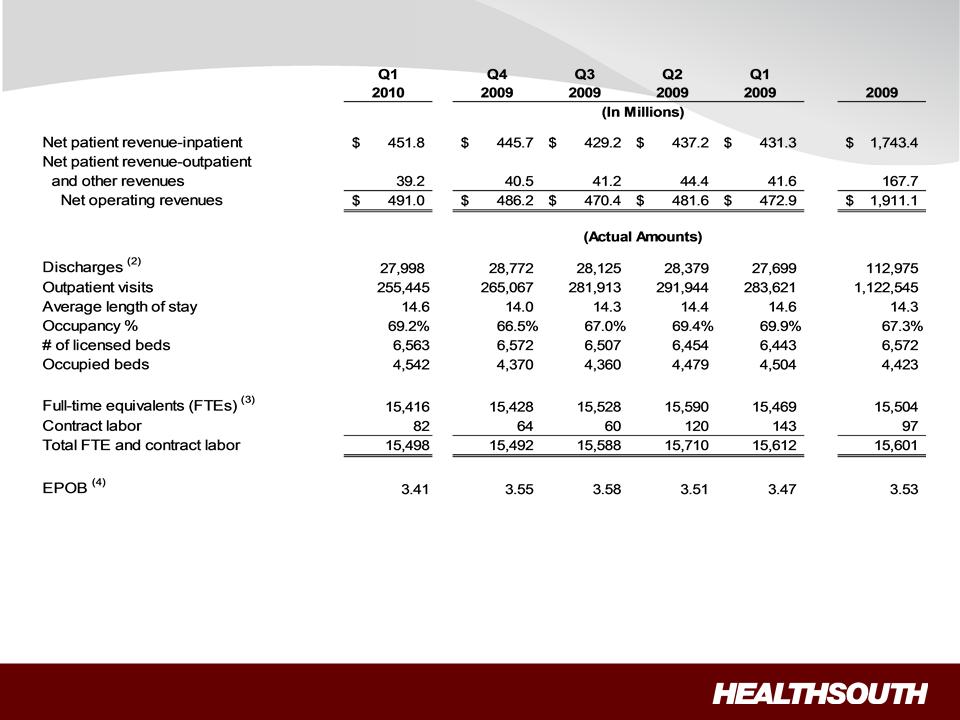
Operational and Labor Metrics (1)
(1) Numbers have been reclassified to reflect current continuing operations.
(2) Represents discharges from HealthSouth’s 90 consolidated hospitals and 6 LTCHs.
(3) Excludes approximately 400 full-time equivalents, who are considered part of corporate overhead with their salaries and benefits included in
general and administrative expenses in the Company’s consolidated statements of operations. Full-time equivalents included in the above table
represent HealthSouth employees who participate in or support the operations of the Company’s hospitals.
general and administrative expenses in the Company’s consolidated statements of operations. Full-time equivalents included in the above table
represent HealthSouth employees who participate in or support the operations of the Company’s hospitals.
(4) Employees per occupied bed, or “EPOB,” is calculated by dividing the number of full-time equivalents, including an estimate of full-time
equivalents from the utilization of contract labor, by the number of occupied beds during each period. The number of occupied beds is determined
by multiplying the number of licensed beds by the Company’s occupancy percentage.
equivalents from the utilization of contract labor, by the number of occupied beds during each period. The number of occupied beds is determined
by multiplying the number of licensed beds by the Company’s occupancy percentage.
Exhibit 99.1
32
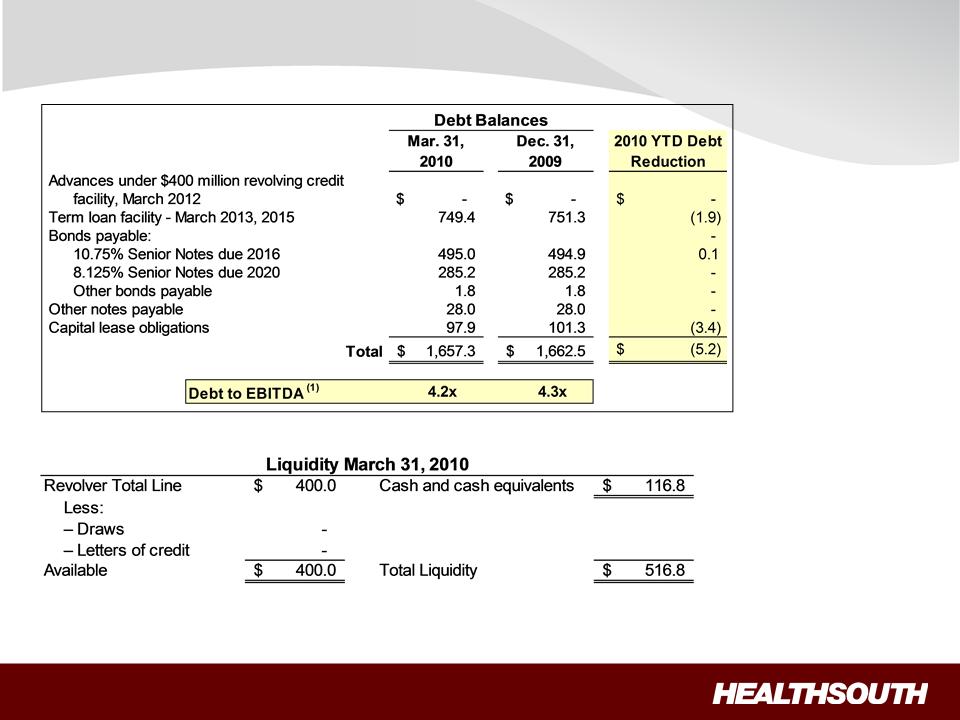
Debt Schedule and Liquidity
(Millions)
(1) Based on trailing four quarter Adjusted Consolidated EBITDA of $391.0 million; reconciliation to GAAP provided on slides 35 and 36.
Exhibit 99.1

33
Non-Operating Cash/Tax Position
Cash Refunds as of Mar. 31, 2010
• Federal tax recoveries virtually complete.
• State tax refunds in progress.
– Approx. $6.5 million received in Q1
2010.
2010.
– Approx. $1.1 million net receivable on
the balance sheet.
Future Cash Tax Payments
• Expect to pay about $5-7 million per year of income
tax.
tax.
– State income tax.
– Alternative Minimum Tax (AMT).
• The Company does not expect to pay significant
federal income taxes for the next 10-12 years, due
to approximately $905 million in deferred tax assets
as of 12/31/09 outlined in the 2009 Form 10-K. The
majority of the deferred tax assets is related to
NOLs.
federal income taxes for the next 10-12 years, due
to approximately $905 million in deferred tax assets
as of 12/31/09 outlined in the 2009 Form 10-K. The
majority of the deferred tax assets is related to
NOLs.
– At this time, we do not believe the use
of NOLs will be limited before they
expire, however, no assurances can
be provided.
• HealthSouth is not currently subject to an annual
use limitation (AUL) under the Internal Revenue
Code section 382.
use limitation (AUL) under the Internal Revenue
Code section 382.
• If we experienced a “change of ownership” as
defined by the Internal Revenue Code section 382,
we would be subject to an AUL, which is equal to
the value of the company at the time of the “change
of ownership” multiplied by the long-term tax exempt
rate.
defined by the Internal Revenue Code section 382,
we would be subject to an AUL, which is equal to
the value of the company at the time of the “change
of ownership” multiplied by the long-term tax exempt
rate.
GAAP Considerations
• HealthSouth’s balance sheet currently
reflects a valuation allowance for the
potential value of NOLs and future
deductions. The valuation allowance is
approximately $893 million.
reflects a valuation allowance for the
potential value of NOLs and future
deductions. The valuation allowance is
approximately $893 million.
• GAAP tax rate will net to small amount for
foreseeable future as there will be a
reduction in the valuation allowance when
NOLs are utilized.
foreseeable future as there will be a
reduction in the valuation allowance when
NOLs are utilized.
Exhibit 99.1
34
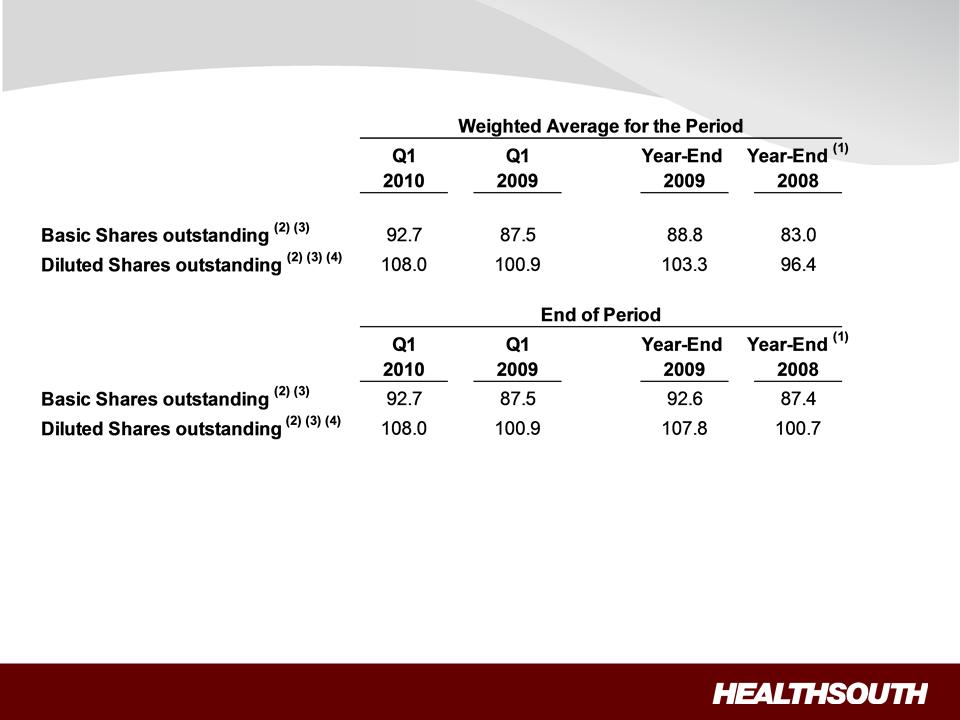
Outstanding Share Summary
(Millions)
(Millions)
Notes:
(1) Completed an equity offering for 8.8 million shares on June 27, 2008.
(2) Does not include 2.0 million warrants issued in connection with a January 2004 loan repaid to Credit Suisse First Boston. In connection with this
transaction, we issued warrants to the lender to purchase two million shares of our common stock. Each warrant has a term of ten years from the
date of issuance and an exercise price of $32.50 per share. The warrants were not assumed exercised for dilutive shares outstanding because
they were antidilutive in the periods presented.
(3) The agreement to settle our class action securities litigation received final court approval in January 2007. These shares of common stock and
warrants were issued on September 30, 2009. The 5.0 million of common shares are now included in the outstanding shares. The warrants at a
strike price of $41.40 were not assumed exercised for the dilutive shares outstanding because they are anti-dilutive in the periods presented.
warrants were issued on September 30, 2009. The 5.0 million of common shares are now included in the outstanding shares. The warrants at a
strike price of $41.40 were not assumed exercised for the dilutive shares outstanding because they are anti-dilutive in the periods presented.
(4) The difference between the basic and diluted shares outstanding is primarily related to our convertible perpetual preferred stock.
Exhibit 99.1
35
Exhibit 99.1

36
Reconciliation Notes
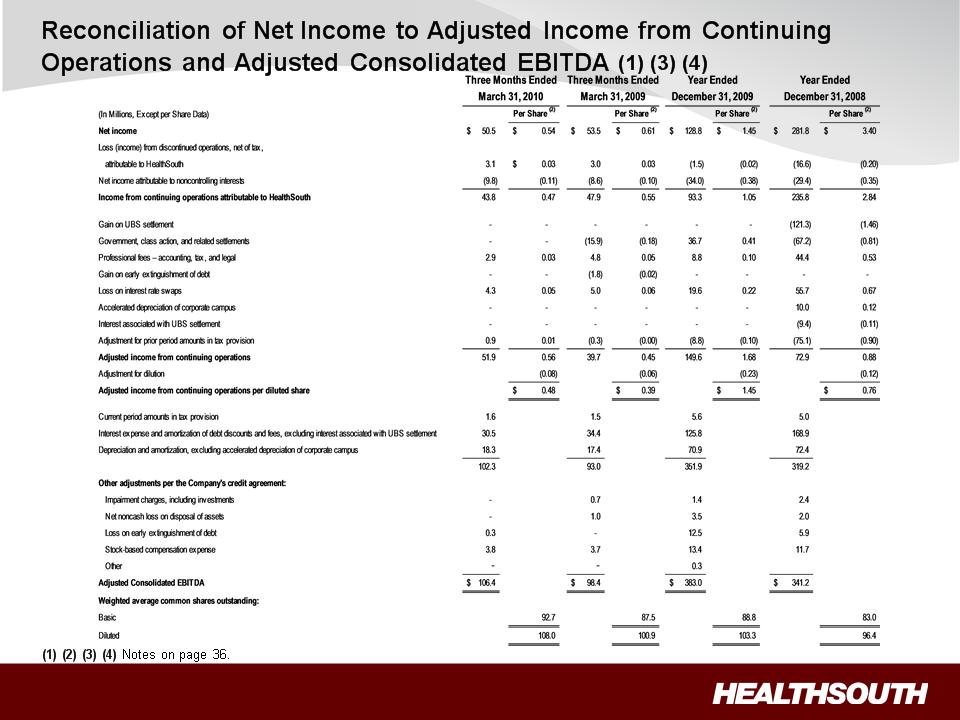
1. Adjusted income from continuing operations and Adjusted Consolidated EBITDA are
non-GAAP financial measures. The Company’s leverage ratio (Total Consolidated Debt
to Adjusted Consolidated EBITDA for the trailing four quarters) is, likewise, a non-GAAP
financial measure. Management and some members of the investment community
utilize adjusted income from continuing operations as a financial measure and Adjusted
Consolidated EBITDA and leverage ratio as liquidity measures on an ongoing basis.
These measures are not recognized in accordance with GAAP and should not be
viewed as an alternative to GAAP measures of performance or liquidity. In evaluating
these adjusted measures, the reader should be aware that in the future HealthSouth
may incur expenses similar to the adjustments set forth above.
2. Per share amounts for each period presented are based on basic weighted average
common shares outstanding for all amounts except adjusted income from continuing
operations per diluted share, which is based on diluted weighted average shares
outstanding. The difference in shares between the basic and diluted shares outstanding
is primarily related to our convertible perpetual preferred stock.
3. Adjusted income from continuing operations per diluted share and Adjusted
Consolidated EBITDA are two components of our guidance.
Consolidated EBITDA are two components of our guidance.
4. The Company’s Credit Agreement allows certain other items to be added to arrive at
Adjusted Consolidated EBITDA, and there may be certain other deductions required.
Adjusted Consolidated EBITDA, and there may be certain other deductions required.