Attached files
Table of Contents
UNITED STATES
SECURITIES AND EXCHANGE COMMISSION
WASHINGTON, D.C. 20549
FORM 10-K/A
Amendment No. 1
| x | ANNUAL REPORT PURSUANT TO SECTION 13 OR 15(d) OF THE SECURITIES EXCHANGE ACT OF 1934 |
For the fiscal year ended December 31, 2009
or
| ¨ | TRANSITION REPORT PURSUANT TO SECTION 13 OR 15(d) OF THE SECURITIES EXCHANGE ACT OF 1934 |
For the transition period from to
Commission File Number: 001-32726
POWERSHARES DB COMMODITY INDEX TRACKING FUND
(Exact name of Registrant as specified in its charter)
| Delaware | 32-6042243 | |
| (State or Other Jurisdiction of Incorporation or Organization) |
(I.R.S. Employer Identification No.) |
| c/o DB Commodity Services LLC 60 Wall Street New York, New York |
10005 | |
| (Address of Principal Executive Offices) | (Zip Code) |
DB COMMODITY INDEX TRACKING MASTER FUND
(Exact name of Co-Registrant as specified in its charter)
| Delaware | 30-0317551 | |
| (State or Other Jurisdiction of Incorporation or Organization) |
(I.R.S. Employer Identification No.) |
| c/o DB Commodity Services LLC 60 Wall Street New York, New York |
10005 | |
| (Address of Principal Executive Offices) | (Zip Code) |
Registrant’s telephone number, including area code: (212) 250-5883
Securities registered pursuant to Section 12(b) of the Act:
| Title of Each Class |
Name of Each Exchange on Which Registered | |
| Common Units of Beneficial Interest | NYSE Arca, Inc. |
Securities registered pursuant to Section 12(g) of the Act: None
Indicate by check mark if the registrant is a well-known seasoned issuer, as defined in Rule 405 of the Securities Act. Yes x No ¨
Indicate by check mark if the registrant is not required to file reports pursuant to Section 13 or Section 15(d) of the Act. Yes ¨ No x
Indicate by check mark whether the registrant: (1) has filed all reports required to be filed by Section 13 or 15(d) of the Securities Exchange Act of 1934 during the preceding 12 months (or for such shorter period that the registrant was required to file such reports), and (2) has been subject to such filing requirements for the past 90 days. Yes x No ¨
Indicate by check mark whether the Registrant has submitted electronically and posted on its corporate Web site, if any, every Interactive Data File required to be submitted and posted pursuant to Rule 405 of Regulation S-T (§232.405 of this chapter) during the preceding 12 months (or for such shorter period that the Registrant was required to submit and post such files). Yes ¨ No ¨
Indicate by check mark if disclosure of delinquent filers pursuant to Item 405 of Regulation S-K (§229.405 of this chapter) is not contained herein, and will not be contained, to the best of registrant’s knowledge, in definitive proxy or information statements incorporated by reference in Part III of this Form 10-K or any amendment to this Form 10-K. x
Indicate by check mark whether the registrant is a large accelerated filer, an accelerated filer, a non-accelerated filer, or a smaller reporting company. See definition of “accelerated filer,” “large accelerated filer,” and “smaller reporting company” in Rule 12b-2 of the Exchange Act. (Check one):
| Large Accelerated Filer | x | Accelerated Filer | ¨ | |||
| Non-Accelerated Filer | ¨ (Do not check if a smaller reporting company) | Smaller reporting company | ¨ | |||
Indicate by check mark whether the registrant is a shell company (as defined in Rule 12b-2 of the Exchange Act). Yes ¨ No x
State the market value of the voting and non-voting common equity held by non-affiliates computed by reference to the price at which the common equity was last sold, or the average bid and asked price of such common equity, as of the last business day of the registrant’s most recently completed second fiscal quarter. $2,999,412,000
Number of Common Units of Beneficial Interest outstanding as of February 8, 2010: 185,600,000
Table of Contents
EXPLANATORY NOTE:
On February 24, 2010, we filed an Annual Report on Form 10-K for the year ended December 31, 2009 (the “Original Report”) with the Securities and Exchange Commission (the “SEC”). On May 27, 2010, we received comments from the SEC on our Original Report. We are filing this amendment to file separate Master Fund financials and to incorporate our responses to these comments. For avoidance of doubt, the Fund financials included herein continue to be presented on a consolidated basis with the Master Fund and remain unchanged as filed in the Original Report. Disclosures in this Form 10-K/A affected by our responses to the SEC’s comments and amended by this filing are:
| 1. | Business; Fund Investment Overview—to add explanatory language regarding the Master Fund in the master feeder structure; |
| 2. | Management’s Discussion and Analysis of Financial Condition and Results of Operations—Overview/Introduction—to add explanatory language regarding the Master Fund in the master feeder structure; |
| 3. | Report of Management on Internal Control Over Financial Reporting—to include management’s report on internal control over financial reporting of Master Fund; |
| 4. | Report of Independent Registered Public Accounting Firm—to include report of independent registered public accounting firm on internal control over financial reporting; |
| 5. | Report of Independent Registered Public Accounting Firm—to include report of independent registered public accounting firm; |
| 6. | Financial Statements—to include the financial statements of the Master Fund; |
| 7. | Notes to the Consolidated Financial Statements—to add explanatory language regarding the Master Fund financial statements; |
| 8. | Controls and Procedures—to add explanatory language that disclosures under Item 9A include both the Fund and the Master Fund; and |
| 9. | Certifications—to add separate certifications for the Master Fund. |
Except as stated herein, this Form 10-K/A does not reflect events occurring after the filing of the Original Filing and no attempt has been made in this Annual Report on Form 10-K/A to materially modify or update other disclosures as presented in the Original Filing. Accordingly, this Form 10-K/A should be read in conjunction with our filings with the SEC subsequent to the filing of the Original Filing.
Table of Contents
iii
Table of Contents
CAUTIONARY STATEMENT CONCERNING FORWARD-LOOKING INFORMATION
This report includes forward-looking statements within the meaning of Section 27A of the Securities Act of 1933, as amended (the “Securities Act”), and Section 21E of the Securities Exchange Act of 1934, as amended (the “Exchange Act”), that involve substantial risks and uncertainties. These forward-looking statements are based on the registrant’s current expectations, estimates and projections about the registrant’s business and industry and its beliefs and assumptions about future events. These forward-looking statements are subject to known and unknown risks, uncertainties and assumptions about the registrant that may cause our actual results, levels of activity, performance or achievements to be materially different from any future results, levels of activity, performance or achievements expressed or implied by such forward-looking statements. In some cases, investors can identify forward-looking statements by terminology such as “may,” “should,” “could,” “would,” “expect,” “plan,” “anticipate,” “believe,” “estimate,” “continue,” or the negative of such terms or other similar expressions. Factors that might cause or contribute to such a discrepancy include, but are not limited to, those described in this report, including in “Item 1A. Risk Factors”, and our other Securities and Exchange Commission (the “SEC”) filings.
iv
Table of Contents
| ITEM 1. | BUSINESS |
Organization
PowerShares DB Commodity Index Tracking Fund (the “Fund”; “Fund” may also refer to the Fund and the Master Fund, collectively, as the context requires) and its subsidiary, DB Commodity Index Tracking Master Fund (the “Master Fund”), were formed as Delaware statutory trusts on May 23, 2005. DB Commodity Services LLC (“DBCS” or the “Managing Owner”) funded both the Fund and the Master Fund with a capital contribution of $1,000 to each fund in exchange for 40 General Shares of each fund. The Fund was originally named “DB Commodity Index Tracking Fund”. The Fund changed its name to “PowerShares DB Commodity Index Tracking Fund” effective August 10, 2006. The fiscal year end of the Fund is December 31st. DBCS, a Delaware limited liability company, is the Managing Owner of the Fund and the Master Fund. The term of the Fund is perpetual (unless terminated earlier in certain circumstances) as provided in the Amended and Restated Declaration of Trust and Trust Agreement of the Fund and the Master Fund (each a “Trust Agreement” and collectively the “Trust Agreements”).
The Fund offers common units of beneficial interest (the “Shares”) only to certain eligible financial institutions (the “Authorized Participants”) in one or more blocks of 200,000 Shares, called a Basket. The proceeds from the offering of Shares are invested in the Master Fund. The Fund commenced trading on the American Stock Exchange (now known as the NYSE Alternext US LLC (the “NYSE Alternext”)) on February 3, 2006 and, as of November 25, 2008, is listed on the NYSE Arca, Inc. (the “NYSE Arca”).
Fund Investment Overview
The Fund invests substantially all of its assets in the Master Fund in a master-feeder structure. The Fund holds no investment assets other than Master Fund Units. The Master Fund is wholly-owned by the Fund and the Managing Owner. Each Share issued by the Fund correlates with a Master Fund Unit issued by the Master Fund and held by the Fund.
During the period from January 31, 2006 (commencement of investment operations) to May 23, 2006, the Master Fund invested with a view to tracking changes, whether positive or negative, in the level of the Deutsche Bank Liquid Commodity Index—Excess Return™ over time, plus the excess, if any, of the Master Fund’s income from its holdings of United States Treasury Obligations and other high credit quality short-term fixed income securities over the expenses of the Fund and the Master Fund. During the period from May 24, 2006 to October 16, 2009, the Master Fund invested with a view to tracking changes, whether positive or negative, in the level of the Deutsche Bank Liquid Commodity Index—Optimum Yield Excess Return™, over time, plus the excess, if any, of the Master Fund’s income from its holdings of United States Treasury Obligations and other high credit quality short-term fixed income securities over the expenses of the Fund and the Master Fund. The commodities comprising the Deutsche Bank Liquid Commodity Index—Optimum Yield Excess Return™ are Light Sweet Crude Oil (WTI), Heating Oil, Aluminum, Gold, Corn and Wheat. Commencing October 19, 2009, the Master Fund invested with a view to tracking changes, whether positive or negative, in the level of the Deutsche Bank Liquid Commodity Index-Optimum Yield Diversified Excess Return™ (the “Index”) over time, plus the excess, if any, of the Master Fund’s income from its holdings of United States Treasury Obligations and other high credit quality short-term fixed income securities over the expenses of the Fund and the Master Fund. The Index is intended to reflect the change in market value of certain commodities. The commodities comprising the Index are Light Sweet Crude Oil (WTI), Heating Oil, Aluminum, Gold, Corn, Wheat, Brent Crude, Copper Grade A, Natural Gas, RBOB Gasoline, Silver, Soybeans, Sugar and Zinc (the “Index Commodities”). The Master Fund holds United States Treasury Obligations and other high credit quality short-term fixed income securities for deposit with the Master Fund’s commodity broker as margin.
1
Table of Contents
The following table reflects the Fund weights of each Index Commodity as of December 31, 2009:
| Index Commodity |
Fund Weight (%) | |
| Light Sweet Crude Oil (WTI) |
12.17 | |
| Heating Oil |
12.24 | |
| RBOB Gasoline |
12.33 | |
| Natural Gas |
5.75 | |
| Brent Crude |
12.23 | |
| Gold |
7.92 | |
| Silver |
1.88 | |
| Aluminum |
4.74 | |
| Zinc |
4.96 | |
| Copper Grade A |
4.73 | |
| Corn |
4.88 | |
| Wheat |
2.56 | |
| Soybeans |
5.23 | |
| Sugar |
6.60 | |
| Soymeal |
0.85 | |
| Soybean Oil |
0.67 | |
| Mill Wheat |
0.26 | |
| Closing Level |
100.00 | |
The Fund does not employ leverage. As of December 31, 2009 and 2008, the Fund had $4,390,953,240 (or 100%) and $1,199,951,828 (or 100%), respectively, of its holdings of cash, United States Treasury Obligations and unrealized appreciation/depreciation of futures contracts on deposit with its Commodity Broker. Of this, $288,167,861 (or 6.56%) and $154,620,803 (or 12.88%), of the Fund’s holdings of cash and United States Treasury Obligations are required to be deposited as margin in support of the Fund’s long futures positions as of December 31, 2009 and 2008, respectively. For additional information, please see the audited Consolidated Schedule of Investments as of December 31, 2009 and 2008 for a breakdown of the Fund’s portfolio holdings.
If the Managing Owner determines in its commercially reasonable judgment that it has become impracticable or inefficient for any reason for the Master Fund to gain full or partial exposure to any Index Commodity by investing in a specific futures contract that is a part of the Index, the Master Fund may invest in a futures contract referencing the particular Index Commodity other than the specific contract that is a part of the Index or, in the alternative, invest in other futures contracts not based on the particular Index Commodity if, in the commercially reasonable judgment of the Managing Owner, such futures contracts tend to exhibit trading prices that correlate with a futures contract that is a part of the Index.
DBLCI™ and Deutsche Bank Liquid Commodity Index™ are trademarks of Deutsche Bank AG London (the “Index Sponsor”). Trademark applications in the United States are pending with respect to both the Fund and the Index. Any use of these trademarks must be with the consent of or under license from the Index Sponsor. The Fund, Master Fund and the Managing Owner have been licensed to use DBLCI™ and Deutsche Bank Liquid Commodity Index™. The Index Sponsor does not approve, endorse or recommend the Fund, the Master Fund or the Managing Owner.
The Index Sponsor obtains information for inclusion in, or for use in the calculation of, the Index from sources the Index Sponsor considers reliable. None of the Index Sponsor, the Managing Owner, the Fund, the Master Fund or any of their respective affiliates accepts responsibility for or guarantees the accuracy and/or completeness of the Index or any data included in the Index.
Index Composition
The Index is composed of notional amounts of each of the Index Commodities. The notional amounts of each Index Commodity included in the Index are broadly in proportion to historical levels of the world’s production and supplies of the Index Commodities. The closing level of the Index is calculated on each business day by the Index Sponsor based on the closing price of the futures contracts for each of the Index Commodities and the notional amount of such Index Commodity.
2
Table of Contents
The Index is rebalanced annually in November to ensure that each of the Index Commodities is weighted in the same proportion that such Index Commodities were weighted on September 3, 1997* (the “Base Date”). The following table reflects the index base weights of each Index Commodity on the Base Date (the “Index Base Weights”):
| Index Commodity |
Index Base Weight (%) | |
| Light Sweet Crude Oil (WTI) |
12.375 | |
| Heating Oil |
12.375 | |
| RBOB Gasoline |
12.375 | |
| Natural Gas |
5.500 | |
| Brent Crude |
12.375 | |
| Gold |
8.000 | |
| Silver |
2.000 | |
| Aluminum |
4.167 | |
| Zinc |
4.167 | |
| Copper Grade A |
4.167 | |
| Corn |
5.625 | |
| Wheat |
5.625 | |
| Soybeans |
5.625 | |
| Sugar |
5.625 | |
| Closing Level on Base Date: |
100.000 | |
| * | From May 24, 2006 to October 16, 2009, the Master Fund invested with a view to tracking the changes, whether positive or negative, in the level of the Deutsche Bank Liquid Commodity Index - Optimum Yield Excess Return™. As of July 31, 1988, the base date of the Deutsche Bank Liquid Commodity Index - Optimum Yield Excess Return™, the index base weights of each index commodity was: Light Sweet Crude Oil (WTI) - 35.00%; Heating Oil - 20.00%; Aluminum; - 12.50%; Gold - 10.00%; Corn -11.25%; and Wheat - 11.25%. Accordingly, the closing level on the base date was 100.00%. |
The Index has been calculated back to the Base Date. On the Base Date, the closing level was 100.
The Index Commodities are traded on the following futures exchanges: Light Sweet Crude Oil (WTI), Heating Oil, RBOB Gasoline and Natural Gas: New York Mercantile Exchange; Brent Crude: ICE Futures Europe; Gold and Silver: Commodity Exchange Inc., New York; Aluminum, Zinc and Copper Grade A: The London Metal Exchange Limited; Corn, Wheat and Soybeans: Board of Trade of the City of Chicago Inc.; and Sugar: ICE Futures U.S., Inc.
The composition of the Index may be adjusted in the event that the Index Sponsor is not able to calculate the closing prices of the Index Commodities.
The Index includes provisions for the replacement of futures contracts as they approach maturity. This replacement takes place over a period of time in order to lessen the impact on the market for the futures contracts being replaced. With respect to each Index Commodity, the Master Fund employs a rule-based approach when it ‘rolls’ from one futures contract to another. Rather than select a new futures contract based on a predetermined schedule (e.g., monthly), each Index Commodity rolls to the futures contract which generates the best possible ‘implied roll yield.’ The futures contract with a delivery month within the next thirteen months which generates the best possible implied roll yield will be included in the Index. As a result, each Index Commodity is able to potentially maximize the roll benefits in backwardated markets and minimize the losses from rolling in contangoed markets.
In general, as a futures contract approaches its expiration date, its price will move towards the spot price in a contangoed market. Assuming the spot price does not change, this would result in the futures contract price decreasing and a negative implied roll yield. The opposite is true in a backwardated market. Rolling in a
3
Table of Contents
contangoed market will tend to cause a drag on an Index Commodity’s contribution to the Fund’s return while rolling in a backwardated market will tend to cause a push on an Index Commodity’s contribution to the Fund’s return.
If the Managing Owner determines in its commercially reasonable judgment that it has become impracticable or inefficient for any reason for the Master Fund to gain full or partial exposure to any Index Commodity by investing in a specific futures contract that is a part of the Index, the Master Fund may invest in a futures contract referencing the particular Index Commodity other than the specific contract that is a part of the Index or, in the alternative, invest in other futures contracts not based on the particular Index Commodity if, in the commercially reasonable judgment of the Managing Owner, such futures contracts tend to exhibit trading prices that correlate with a futures contract that is a part of the Index. Please see http://dbfunds.db.com/dbc/weights.aspx with respect to the most recently available weighted composition of the DBC Fund and http://dbfunds.db.com/dbc/index.aspx with respect to the composition of the DBC Fund’s index on the Base Date.
The Deutsche Bank Liquid Commodity Index-Optimum Yield Total Return™ and the Index are calculated in USD on both an excess return (unfunded) and total return (funded) basis.
The futures contract price for each Index Commodity will be the exchange closing prices for such Index Commodity on each weekday when banks in New York, New York, are open (the “Index Business Days”). If a weekday is not an Exchange Business Day (as defined in the following sentence) but is an Index Business Day, the exchange closing price from the previous Index Business Day will be used for each Index Commodity. “Exchange Business Day” means, in respect of an Index Commodity, a day that is a trading day for such Index Commodity on the relevant exchange (unless either an Index disruption event or force majeure event has occurred).
On the first New York business day (the “Verification Date”) of each month, each Index Commodity futures contract will be tested in order to determine whether to continue including it in the Index. If the Index Commodity futures contract requires delivery of the underlying commodity in the next month, known as the Delivery Month, a new Index Commodity futures contract will be selected for inclusion in the Index. For example, if the first New York business day is October 1, 2010, and the Delivery Month of the Index Commodity futures contract currently in the Index is November 2010, a new Index Commodity futures contract with a later Delivery Month will be selected.
For each underlying Index Commodity in the Index, the new Index Commodity futures contract selected will be the Index Commodity futures contract with the best possible “implied roll yield” based on the closing price for each eligible Index Commodity futures contract. Eligible Index Commodity futures contracts are any Index Commodity futures contracts having a Delivery Month (i) no sooner than the month after the Delivery Month of the Index Commodity futures contract currently in the Index, and (ii) no later than the 13th month after the Verification Date. For example, if the first New York business day is October 1, 2010 and the Delivery Month of an Index Commodity futures contract currently in the Index is November 2010, the Delivery Month of an eligible new Index Commodity futures contract must be between December 2010 and October 2011. The implied roll yield is then calculated and the futures contract on the Index Commodity with the best possible implied roll yield is then selected. If two futures contracts have the same implied roll yield, the futures contract with the minimum number of months prior to the Delivery Month is selected.
After the futures contract selection, the monthly roll for each Index Commodity subject to a roll in that particular month unwinds the old futures contract and enters a position in the new futures contract. This takes place between the 2nd and 6th Index Business Day of the month.
On each day during the roll period, new notional holdings are calculated. The calculations for the old Index Commodities that are leaving the Index and the new Index Commodities are then calculated.
On all days that are not monthly index roll days, the notional holdings of each Index Commodity future remains constant.
The Index is re-weighted on an annual basis on the 6th Index Business Day of each November.
The calculation of the Index is expressed as the weighted average return of the Index Commodities.
4
Table of Contents
The Trustee
Under the Trust Agreements, Wilmington Trust Company, the Trustee of the Fund and the Master Fund, has delegated to the Managing Owner the exclusive management and control of all aspects of the business of the Fund and the Master Fund. The Trustee will have no duty or liability to supervise or monitor the performance of the Managing Owner, nor will the Trustee have any liability for the acts or omissions of the Managing Owner. The Trustee is compensated by the Managing Owner. Under the Trust Agreements, the Managing Owner, from the assets of the Fund or the Master Fund, will indemnify the Trustee for any liability or expense relating to the formation, operations and termination of the Funds incurred without gross negligence or willful misconduct of the Trustee.
The Managing Owner
The Managing Owner was formed on May 23, 2005. The Managing Owner is an indirect wholly owned subsidiary of Deutsche Bank AG. The Managing Owner serves as the commodity pool operator and commodity trading advisor of the Fund and the Master Fund. The Managing Owner was formed to be the managing owner of investment vehicles such as the Fund and the Master Fund and has been managing such investment vehicles since January 2006. The Managing Owner is registered as a commodity pool operator and commodity trading advisor with the Commodity Futures Trading Commission (the “CFTC”) and is a member of the National Futures Association (the “NFA”). As a registered commodity pool operator and commodity trading advisor, with respect to both the Fund and the Master Fund, the Managing Owner must comply with various regulatory requirements under the Commodity Exchange Act (the “CEAct”) and the rules and regulations of the CFTC and the NFA, including investor protection requirements, antifraud prohibitions, disclosure requirements, and reporting and recordkeeping requirements. The Managing Owner is also subject to periodic inspections and audits by the CFTC and NFA.
The Managing Owner’s main business offices are located at 60 Wall Street, New York, New York 10005, telephone (212) 250-5883.
The Master Fund pays the Managing Owner a management fee (the “Management Fee”)1, monthly in arrears, in an amount equal to 0.85% per annum of the daily net asset value of the Master Fund. No separate fee is paid by the Fund. The Management Fee is paid in consideration of the Managing Owner’s commodity futures trading advisory services.
Pursuant to the Trust Agreements, the Fund and the Master Fund will indemnify the Managing Owner against any losses, judgments, liabilities, expenses and amounts paid in settlement of any claims sustained by it in connection with its activities on behalf of the Master Fund and the Fund incurred without negligence or misconduct.
The Commodity Broker
Deutsche Bank Securities Inc., a Delaware corporation, serves as the Master Fund’s clearing broker (the “Commodity Broker”). The Commodity Broker is also an indirect wholly-owned subsidiary of Deutsche Bank AG and an affiliate of the Managing Owner. In its capacity as clearing broker, the Commodity Broker executes and clears each of the Master Fund’s futures transactions and performs certain administrative and custodial services for the Master Fund. As custodian of the Master Fund’s assets, the Commodity Broker is responsible, among other things, for providing periodic accountings of all dealings and actions taken by the Master Fund during the reporting period, together with an accounting of all securities, cash or other indebtedness or obligations held by it or its nominees for or on behalf of the Master Fund.
| 1 | From July 12, 2006 through January 3, 2010, the Management Fee payable by the Master Fund was 0.75% per annum of the daily net asset value of the Master Fund. Effective January 4, 2010, the Management Fee payable by the Master Fund was increased from 0.75% to 0.85% per annum of the daily net asset value of the Master Fund. |
5
Table of Contents
A variety of executing brokers execute futures transactions on behalf of the Master Fund. Such executing brokers “give-up”, or transfer for clearing, all such transactions to the Commodity Broker. The Commodity Broker is registered with the CFTC as a futures commission merchant and is a member of the NFA in such capacity.
The Master Fund pays to the Commodity Broker all brokerage commissions, including applicable exchange fees, NFA fees, give-up fees, pit brokerage fees and other transaction related fees and expenses charged in connection with trading activities. The Commodity Broker’s brokerage commissions and trading fees are determined on a contract-by-contract basis. Brokerage commissions and fees in any future fiscal year or any part of any future fiscal year may be greater. On average, total charges paid to the Commodity Broker were less than $10.00 per round-turn trade for the Years Ended December 31, 2009, 2008 and 2007.
A round-turn trade is a completed transaction involving both a purchase and a liquidating sale, or a sale followed by a covering purchase.
The Administrator
The Managing Owner, on behalf of the Fund and the Master Fund, has appointed The Bank of New York Mellon as the administrator (the “Administrator”) of the Fund and the Master Fund and has entered into an Administration Agreement in connection therewith. The Bank of New York Mellon serves as custodian of the Fund (the “Custodian”) and has entered into a Global Custody Agreement (the “Custody Agreement”) in connection therewith. The Bank of New York Mellon serves as the transfer agent (the “Transfer Agent”) of the Fund and has entered into a Transfer Agency and Service Agreement in connection therewith.
The Bank of New York Mellon, a banking corporation organized under the laws of the State of New York with trust powers, has an office at 2 Hanson Place, 12th Floor, Brooklyn, New York 11217. The Bank of New York Mellon is subject to supervision by the New York State Banking Department and the Board of Governors of the Federal Reserve System.
Pursuant to the Administration Agreement, the Administrator performs or supervises the performance of services necessary for the operation and administration of the Fund and the Master Fund (other than making investment decisions), including receiving and processing orders from Authorized Participants to create and redeem Baskets, net asset value calculations, accounting and other fund administrative services. The Administrator retains certain financial books and records, including: Basket creation and redemption books and records, fund accounting records, ledgers with respect to assets, liabilities, capital, income and expenses, the registrar, transfer journals and related details, and trading and related documents received from futures commission merchants.
The Administration Agreement will continue in effect from the commencement of trading operations unless terminated on at least 90 days’ prior written notice by either party to the other party. Notwithstanding the foregoing, the Administrator may terminate the Administration Agreement upon 30 days’ prior written notice if the Fund and/or Master Fund has materially failed to perform its obligations under the Administration Agreement.
The Administration Agreement provides for the exculpation and indemnification of the Administrator from and against any costs, expenses, damages, liabilities or claims (other than those resulting from the Administrator’s own bad faith, negligence or willful misconduct) which may be imposed on, incurred by or asserted against the Administrator in performing its obligations or duties under the Administration Agreement.
The Administrator’s monthly fees are paid on behalf of the Fund and the Master Fund by the Managing Owner out of the Management Fee.
The Administrator and any of its affiliates may from time-to-time purchase or sell Shares for their own account, as agent for their customers and for accounts over which they exercise investment discretion.
The Administrator receives a transaction processing fee in connection with orders from Authorized Participants to create or redeem Baskets in the amount of $500 per order. These transaction processing fees are paid indirectly by the Authorized Participants and not by the Fund or the Master Fund.
6
Table of Contents
The Distributor
ALPS Distributors, Inc. (the “Distributor”) provides certain distribution services to the Fund. Pursuant to the Distribution Services Agreement between the Managing Owner, in its capacity as managing owner of the Fund, the Fund and the Distributor, the Distributor assists the Managing Owner and the Administrator with certain functions and duties relating to distribution and marketing services to the Fund including reviewing and approving marketing materials.
The Distribution Services Agreement is terminable without penalty on sixty days’ written notice by the Managing Owner or by the Distributor. The Distribution Services Agreement will automatically terminate in the event of its assignment.
Pursuant to the Distribution Services Agreement, the Fund will indemnify and hold harmless the Distributor and each of its directors and officers and each person, if any, who controls the Distributor within the meaning of Section 15 of the 1933 Act, against any loss, liability, claim, damages or expenses (including the reasonable cost of investigating or defending any alleged loss, liability, claim, damages or expense and reasonable counsel fees incurred in connection therewith) arising by reason of any person acquiring any Shares, based upon the ground that the registration statement, prospectus, statement of additional information, shareholder reports or other information filed or made public by the Fund (as from time-to-time amended) included an untrue statement of a material fact or omitted to state a material fact required to be stated or necessary in order to make the statements not misleading under the 1933 Act or any other statute or the common law.
Invesco Powershares Capital Management LLC
Under the License Agreement among Invesco Powershares Capital Management LLC (the “Licensor”), and the Managing Owner in its own capacity and in its capacity as managing owner of the Fund (the Fund and the Managing Owner, collectively, the “Licensees”), the Licensor granted to each Licensee a non-exclusive license to use the “PowerShares®” trademark (the “Trademark”) anywhere in the world, solely in connection with the marketing and promotion of the Fund and to use or refer to the Trademark in connection with the issuance and trading of the Fund as necessary.
Invesco Aim Distributors, Inc.
Through a marketing agreement between the Managing Owner and Invesco Aim Distributors, Inc. (“Invesco Aim Distributors”), an affiliate of Invesco PowerShares Capital Management LLC (“Invesco PowerShares”), the Managing Owner, on behalf of the Fund and the Master Fund, has appointed Invesco Aim Distributors as a marketing agent. Invesco Aim Distributors assists the Managing Owner and the Administrator with certain functions and duties such as providing various educational and marketing activities regarding the Fund, primarily in the secondary trading market, which activities include, but are not limited to, communicating the Fund’s name, characteristics, uses, benefits, and risks, consistent with the prospectus. Invesco Aim Distributors will not open or maintain customer accounts or handle orders for the Fund. Invesco Aim Distributors engages in public seminars, road shows, conferences, media interviews, and distributes sales literature and other communications (including electronic media) regarding the Fund.
Tax Reporting
The Fund has retained the services of PricewaterhouseCoopers LLP to assist with certain tax reporting requirements of the Fund and its Shareholders.
7
Table of Contents
Regulation
Futures exchanges in the United States are subject to regulation under the CEAct by the CFTC, the governmental agency having responsibility for regulation of futures exchanges and trading on those exchanges. No U.S. governmental agency regulates the over-the-counter (the “OTC”) foreign exchange markets.
The CEAct and the CFTC also regulate the activities of “commodity trading advisors” and “commodity pool operators” and the CFTC has adopted regulations with respect to certain of such persons’ activities. Pursuant to its authority, the CFTC requires a commodity pool operator (such as the Managing Owner) to keep accurate, current and orderly records with respect to each pool it operates. The CFTC may suspend the registration of a commodity pool operator if the CFTC finds that the operator has violated the CEAct or regulations thereunder and in certain other circumstances. Suspension, restriction or termination of the Managing Owner’s registration as a commodity pool operator would prevent it, until such time (if any) as such registration were to be reinstated, from managing, and might result in the termination of, the Fund and the Master Fund. The CEAct gives the CFTC similar authority with respect to the activities of commodity trading advisors, such as the Managing Owner. If the registration of a managing owner as a commodity trading advisor were to be terminated, restricted or suspended, the managing owner would be unable, until such time (if any) as such registration were to be reinstated, to render trading advice to the Fund and the Master Fund. The Fund and the Master Fund themselves are not registered with the CFTC in any capacity.
The CEAct requires all “futures commission merchants,” such as the Commodity Broker, to meet and maintain specified fitness and financial requirements, segregate customer funds from proprietary funds and account separately for all customers’ funds and positions, and to maintain specified books and records open to inspection by the staff of the CFTC.
The CEAct also gives the states certain powers to enforce its provisions and the regulations of the CFTC.
Shareholders are afforded certain rights for reparations under the CEAct. Shareholders may also be able to maintain a private right of action for certain violations of the CEAct. The CFTC has adopted rules implementing the reparation provisions of the CEAct which provide that any person may file a complaint for a reparations award with the CFTC for violation of the CEAct against a floor broker, futures commission merchant, introducing broker, commodity trading advisor, commodity pool operator, and their respective associated persons.
Pursuant to authority in the CEAct, the NFA has been formed and registered with the CFTC as a “registered futures association.” At the present time, the NFA is the only non-exchange self-regulatory organization for commodities professionals. NFA members are subject to NFA standards relating to fair trade practices, financial condition, and consumer protection. As the self-regulatory body of the commodities industry, the NFA promulgates rules governing the conduct of commodity professionals and disciplines those professionals who do not comply with such standards. The CFTC has delegated to the NFA responsibility for the registration of commodity trading advisors, commodity pool operators, futures commission merchants, introducing brokers and their respective associated persons and floor brokers. The Commodity Broker and the Managing Owner are members of the NFA (the Fund and the Master Fund themselves are not required to become members of the NFA).
The CFTC has no authority to regulate trading on foreign commodity exchanges and markets.
Employees
The Fund and the Master Fund have no employees.
Available Information
The Fund files with or submits to the SEC annual, quarterly and current reports and other information meeting the informational requirements of the Exchange Act. These reports are available on the Managing Owner’s website at http://dbfunds.db.com. Investors may also inspect and copy these reports, proxy statements and other information, and related exhibits and schedules, at the Public Reference Room of the SEC at 100 F Street, NE,
8
Table of Contents
Washington, D.C. 20549. Investors may obtain information on the operation of the Public Reference Room by calling the SEC at 1-800-SEC-0330. In addition, the SEC maintains an Internet site that contains reports, proxy and information statements and other information filed electronically by us with the SEC which are available on the SEC’s Internet site at http://www.sec.gov.
The Fund also posts monthly performance reports and its annual report, as required by the CFTC, on the Managing Owner’s website at the address listed above.
| ITEM 1A. | RISK FACTORS |
An investment in the securities of the Fund involves a high degree of risk. Investors should consider carefully all of the risks described below, together with the other information contained in this report and the Prospectus, before making a decision to invest in the securities of the Fund. If any of the following risks occur, the business, financial condition and results of operations of the Fund may be adversely affected.
Investment and Trading Related Risks
The Value of the Shares Relates Directly to the Value of the Commodity Futures Contracts and Other Assets Held by the Master Fund and Fluctuations in the Price of These Assets Could Materially Adversely Affect an Investment in the Fund’s Shares.
The Shares are designed to reflect as closely as possible the changes, positive or negative, in the level of the Index over time through the Master Fund’s portfolio of exchange-traded futures contracts on the Index Commodities. The value of the Shares relates directly to the value of the portfolio, less the liabilities (including estimated accrued but unpaid expenses) of the Fund and the Master Fund. The price of the Index Commodities may fluctuate widely. Several factors may affect the prices of the Index Commodities, including, but not limited to:
| • | Global supply and demand of each of the Index Commodities, which may be influenced by such factors as forward selling by the various commodities producers, purchases made by the commodities’ producers to unwind their hedge positions and production and cost levels in the major markets of each of the Index Commodities; |
| • | Domestic and foreign interest rates and investors’ expectations concerning interest rates; |
| • | Domestic and foreign inflation rates and investors’ expectations concerning inflation rates; |
| • | Investment and trading activities of mutual funds, hedge funds and commodity funds; and |
| • | Global or regional political, economic or financial events and situations. |
Net Asset Value May Not Always Correspond to Market Price and, as a Result, Baskets may be Created or Redeemed at a Value that Differs from the Market Price of the Shares.
The net asset value per Share will change as fluctuations occur in the market value of the Master Fund’s portfolio. Investors should be aware that the public trading price of a Basket may be different from the net asset value of a Basket (i.e., 200,000 Shares may trade at a premium over, or a discount to, net asset value of a Basket) and similarly the public trading price per Share may be different from the net asset value per Share. Consequently, an Authorized Participant may be able to create or redeem a Basket at a discount or a premium to the public trading price per Share. This price difference may be due, in large part, to the fact that supply and demand forces at work in the secondary trading market for Shares is closely related, but not identical to, the same forces influencing the prices of the Index Commodities trading individually or in the aggregate at any point in time. Investors also should note that the size of the Fund in terms of total assets held may change substantially over time and from time-to-time as Baskets are created and redeemed.
Authorized Participants or their clients or customers may have an opportunity to realize a riskless profit if they can purchase a Creation Basket at a discount to the public trading price of the Shares or can redeem a
9
Table of Contents
Redemption Basket at a premium over the public trading price of the Shares. The Managing Owner expects that the exploitation of such arbitrage opportunities by Authorized Participants and their clients and customers will tend to cause the public trading price to track net asset value per Share closely over time.
The value of a Share may be influenced by non-concurrent trading hours between the NYSE Arca and the various futures exchanges on which the Index Commodities are traded. While the Shares trade on the NYSE Arca from 9:30 a.m. to 4:00 p.m. Eastern Standard Time, the below table lists the trading hours for each of the Index Commodities which trades on the futures exchange set forth in the table:
| Index Commodity |
Exchange1 |
Trading Hours2 | ||
| Corn Soybeans Wheat |
CBOT | 10:30 am – 2:15 pm | ||
| Sugar #11 | ICE US | 3:30 am – 2:00 pm | ||
| Aluminum | LME | 6:55 am – 7:00 am 7:55 am – 8:00 am 8:20 am – 9:45 am 10:15 am – 10:20 am 10:55 am – 11:00 am 11:15 am – 12:00 pm | ||
| Copper – Grade A | LME | 7:00 am – 7:05 am 7:30 am – 7:35 am 8:20 am – 9:45 am 10:10 am – 10:15 am 10:50 am – 10:55 am 11:15 am – 12:00 pm | ||
| Zinc | LME | 7:10 am – 7:15 am 7:50 am – 7:55 am 8:20 am – 9:45 am 10:05 am – 10:10 am 10:45 am – 10:50 am 11:15 am – 12:00 pm | ||
| Light Sweet Crude Oil (WTI) Heating Oil Natural Gas RBOB |
NYMEX | 9:00 am – 2:30 pm | ||
| Brent Crude Oil | ICE EUR | 8:00 pm – 6:00 pm3 | ||
| Silver | COMEX | 9:00 am – 2:30 pm | ||
| Gold | COMEX | 8:20 am – 1:30 pm |
| 1 |
Legend: |
“CBOT” means the Board of Trade of the City of Chicago Inc., or its successor.
“ICE US” means ICE Futures U.S., Inc. or its successor (formerly traded on NYBOT, or Board of Trade of the City of New York, Inc. or its successor.)
“LME” means The London Metal Exchange Limited or its successor.
“NYMEX” means the New York Mercantile Exchange or its successor.
“ICE EUR” means ICE Futures Europe, or its successor.
“COMEX” means the Commodity Exchange Inc., New York or its successor.
| 2. | All trading hours are as of Eastern Standard Time. All trading occurs on Monday – Friday, unless otherwise specified. |
| 3. | Trading occurs on Sunday – Friday and ends on the next day. |
For example, while the Shares trade on the NYSE Arca until 4:00 p.m. Eastern Standard Time, liquidity in the global gold market will be reduced after the close of the COMEX division of the New York Mercantile Exchange at 1:30 p.m. Eastern Standard Time. As a result, during periods when the NYSE Arca is open and the futures exchanges on which the Index Commodities are traded are closed, trading spreads and the resulting premium or discount on the Shares may widen and, therefore, increase the difference between the price of the Shares and the net asset value of the Shares.
10
Table of Contents
Regulatory and Exchange Position Limits and Other Rules May Restrict the Creation of Baskets and the Operation of the Master Fund.
CFTC and commodity exchange rules impose speculative position limits on market participants, including the Master Fund, trading in certain commodities. These position limits prohibit any person from holding a position of more than a specific number of such futures contracts.
The Index is composed of 14 Index Commodities, of which 9 Index Commodities (Light Sweet crude oil (WTI), heating oil, natural gas, gold, silver, corn, wheat, soybeans and sugar) (the “Affected Index Commodities”) are subject to speculative position limits imposed by either the CFTC or the rules of the futures exchanges on which the futures contracts for the applicable Index Commodities are traded. The purposes of speculative position limits are to diminish, eliminate or prevent sudden or unreasonable fluctuations or unwarranted changes in the prices of futures contracts. Currently, speculative position limits (i) for corn, oats, wheat, soybean, soybean oil and cotton are determined by the CFTC and (ii) for all other commodities are determined by the futures exchanges. Generally, speculative position limits in the physical delivery markets are set at a stricter level during the spot month, when the futures contract matures and becomes deliverable, versus the limits set for all other months. Subject to any relevant exemptions, traders, such as the Master Fund, may not exceed speculative position limits, either individually, or in the aggregate with other persons with whom they are under common control or ownership. If the Managing Owner determines that the Master Fund’s trading may be approaching any of these speculative position limits, the Master Fund may reduce its trading in that commodity or trade in other commodities or instruments that the Index Sponsor determines comply with the rules and goals of the Index. Below is a chart that sets forth certain relevant information, including current speculative position limits for each Affected Index Commodity that any person may hold, separately or in combination, net long or net short, for the purchase or sale of any commodity futures contract or, on a futures-equivalent basis, options thereon. Speculative position limit levels are subject to change by the CFTC or the relevant exchanges.
| Affected Index Commodity |
Exchange (Symbol)1 |
Exchange Position Limits | ||
| Corn | CBOT (C) | 600 – Spot Month 13,500 – Single Month 22,000 – All Months Combined | ||
| Soybeans | CBOT (S) | 600 – Spot Month 6,500 – Single Month 10,000 – All Months Combined | ||
| Wheat | CBOT (W) | 600 – Spot Month 5,000 – Single Month. Additional futures contracts may be held outside of the spot month as part of futures/futures spreads within a crop year provided that the total of such positions, when combined with outright positions, does not exceed the all months combined limit. 6,500 – All Months Combined | ||
| Sugar #11 | ICE US (SB) | 5,000 – Spot Month | ||
| Light Sweet Crude Oil (WTI) | NYMEX (CL) | 10,000 – Single Month 20,000 – All Months Combined But not to exceed 3,000 contracts in the last three days of trading in the spot month | ||
| Heating Oil | NYMEX (HO) | 7,000 – All Months Combined But not to exceed 1,000 in the last three days of trading in the spot month. | ||
| Natural Gas | NYMEX (NG) | 12,000 – Single Month 12,000 – All Months Combined But not to exceed 1,000 in the last three days of trading in the spot month. |
11
Table of Contents
| Affected Index Commodity |
Exchange (Symbol)1 |
Exchange Position Limits | ||
| Silver | COMEX (SI) | 1,500 – Spot Month 6,000 – Single Month 6,000 – All Months Combined | ||
| Gold | COMEX (GC) | 3,000 – Spot Month 6,000 – Single Month 6,000 – All Months Combined |
| 1 |
Legend: |
“CBOT” means the Board of Trade of the City of Chicago Inc., or its successor.
“ICE US” means ICE Futures U.S., Inc. or its successor.
“NYMEX” means the New York Mercantile Exchange or its successor.
“LME” means The London Metal Exchange Limited or its successor.
“COMEX” means the Commodity Exchange Inc., New York or its successor.
Because the Master Fund is subject to position limits, consequently, the Fund’s ability to issue new Baskets, or the Master Fund’s ability to reinvest income in additional futures contracts corresponding to the Affected Index Commodities may be limited to the extent these activities would cause the Master Fund to exceed its applicable position limits. Limiting the size of the Fund may affect the correlation between the price of the Shares, as traded on the NYSE Arca, and the net asset value of the Fund. That is, the inability to create additional Baskets could result in Shares trading at a premium or discount to net asset value of the Fund.
It is possible that in the future, the CFTC may propose new rules with respect to position limits in agricultural, energy and any other commodities for traders engaged in indexed-based trading, such as the trading engaged in by the Master Fund. Depending on the outcome of any future CFTC rulemaking, the rules concerning position limits may be amended in a manner that is either detrimental or favorable to the Fund. For example, if the amended rules are detrimental to the Master Fund, the Fund’s ability to issue new Baskets, or the Master Fund’s ability to reinvest income in additional futures contracts corresponding to the Affected Index Commodities, may be limited to the extent these activities would cause the Master Fund to exceed the applicable position limits.
The Fund’s Performance May Not Always Replicate Exactly the Changes in the Levels of its Index.
It is possible that the Fund’s performance may not fully replicate the changes in levels of the Index due to disruptions in the markets for the relevant Index Commodities, the imposition of speculative position limits (as discussed in the above risk factor Regulatory and Exchange Position Limits and Other Rules May Restrict the Creation of Baskets and the Operation of the Master Fund”), or due to other extraordinary circumstances. As the Master Fund approaches or reaches position limits with respect to certain futures contracts comprising the Index, the Master Fund may commence investing in other futures contracts based on commodities that comprise the Index and in futures contracts based on commodities other than commodities that comprise the Index that, in the commercially reasonable judgment of the Managing Owner, tend to exhibit trading prices that correlate with a futures contract that comprises the Index. In addition, the Fund is not able to replicate exactly the changes in the levels of the Index because the total return generated by the Master Fund is reduced by expenses and transaction costs, including those incurred in connection with the Master Fund’s trading activities, and increased by interest income from the Master Fund’s holdings of short-term high credit quality fixed income securities. Tracking the Index requires trading of the Master Fund’s portfolio with a view to tracking the Index over time and is dependent upon the skills of the Managing Owner and its trading principals, among other factors.
The Master Fund Is Not Actively Managed and Tracks the Index During Periods in which the Index Is Flat or Declining as well as when the Index Is Rising.
The Master Fund is not actively managed by traditional methods. Therefore, if positions in any one or more of the Index Commodities are declining in value, the Master Fund will not close out such positions, except in connection with a change in the composition or weighting of the Index. The Managing Owner seeks to cause the net asset value to track the Index during periods in which the Index is flat or declining as well as when the Index is rising.
12
Table of Contents
The NYSE Arca May Halt Trading in the Shares Which Would Adversely Impact Your Ability to Sell Shares.
The Shares are listed for trading on the NYSE Arca under the market symbol “DBC”. Trading in Shares may be halted due to market conditions or, in light of NYSE Arca rules and procedures, for reasons that, in the view of the NYSE Arca, make trading in Shares inadvisable. In addition, trading is subject to trading halts caused by extraordinary market volatility pursuant to “circuit breaker” rules that require trading to be halted for a specified period based on a specified market decline. There can be no assurance that the requirements necessary to maintain the listing of the Shares will continue to be met or will remain unchanged. The Fund and the Master Fund will be terminated if the Shares are delisted.
The Lack of An Active Trading Market for the Shares May Result in Losses on Your Investment in the Fund at the Time of Disposition of Your Shares.
Although the Shares are listed and traded on the NYSE Arca, there can be no guarantee that an active trading market for the Shares will be maintained. If you need to sell your Shares at a time when no active market for them exists, the price you receive for your Shares, assuming that you are able to sell them, likely will be lower than the price you would receive if an active market did exist.
The Shares Are a New Securities Product and Their Value Could Decrease if Unanticipated Operational or Trading Problems Arise.
The mechanisms and procedures governing the creation, redemption and offering of the Shares have been developed specifically for this securities product. Consequently, there may be unanticipated problems or issues with respect to the mechanics of the operations of the Fund and the Master Fund and the trading of the Shares that could have a material adverse effect on an investment in the Shares. In addition, although the Master Fund is not actively “managed” by traditional methods, to the extent that unanticipated operational or trading problems or issues arise, the Managing Owner’s past experience and qualifications may not be suitable for solving these problems or issues.
As the Managing Owner and its Principals have Been Operating Investment Vehicles like the Fund or the Master Fund Since January 2006, their Experience May be Inadequate or Unsuitable to Manage the Fund or the Master Fund.
The Managing Owner was formed to be the managing owner of investment vehicles such as the Fund and the Master Fund and has been managing such investment vehicles since January 2006. The past performances of the Managing Owner’s management of other commodity pools are no indication of its ability to manage investment vehicles such as the Fund or the Master Fund. If the experience of the Managing Owner and its principals is not adequate or suitable to manage investment vehicles such as the Fund and the Master Fund, the operations of the Fund and the Master Fund may be adversely affected.
You May Not Rely on Past Performance or Index Results in Deciding Whether to Buy Shares.
The Fund and the Master Fund have a limited performance history upon which to evaluate your investment in the Fund and the Master Fund. Although past performance is not necessarily indicative of future results, if the Fund and the Master Fund had a longer performance history, such performance history might (or might not) provide you with more information on which to evaluate an investment in the Fund and the Master Fund. Likewise, the Index has a limited history which might (or might not) be indicative of the future Index results, or of the future performance of the Fund or the Master Fund. Therefore, you will have to make your decision to invest in the Fund on the basis of limited information.
Fewer Representative Commodities May Result In Greater Index Volatility.
The Index Commodities are Light Sweet Crude Oil (WTI), Heating Oil, RBOB Gasoline, Natural Gas, Brent Crude, Gold, Silver, Aluminum, Zinc, Copper Grade A, Corn, Wheat, Soybeans, and Sugar. Accordingly, the Index is concentrated in terms of the number of commodities represented. You should be aware that other commodities indexes are more diversified in terms of both the number and variety of commodities included. Concentration in fewer commodities may result in a greater degree of volatility in the Index and the net asset value of the Fund and the Master Fund which track the Index under specific market conditions and over time.
13
Table of Contents
Price Volatility May Possibly Cause the Total Loss of Your Investment.
Futures contracts have a high degree of price variability and are subject to occasional rapid and substantial changes. Consequently, you could lose all or substantially all of your investment in the Fund.
The following table reflects various measures of volatility* of the Index as calculated on an excess return basis:
| Volatility Type |
Volatility | ||
| Daily volatility over full history |
16.29 | % | |
| Average rolling 3 month daily volatility |
15.37 | % | |
| Monthly return volatility |
19.09 | % | |
| Average annual volatility |
15.26 | % |
The following table reflects the daily volatility on an annual basis of the Index:
| Year |
Daily Volatility |
||
| 1997** |
8.07 | % | |
| 1998 |
11.88 | % | |
| 1999 |
12.78 | % | |
| 2000 |
14.74 | % | |
| 2001 |
13.40 | % | |
| 2002 |
12.37 | % | |
| 2003 |
13.74 | % | |
| 2004 |
15.93 | % | |
| 2005 |
14.71 | % | |
| 2006 |
16.30 | % | |
| 2007 |
13.96 | % | |
| 2008 |
28.39 | % | |
| 2009*** |
22.08 | % |
| * | Volatility, for these purposes, means the following: |
Daily Volatility: The relative rate at which the price of the Index moves up and down, found by calculating the annualized standard deviation of the daily change in price.
Monthly Return Volatility: The relative rate at which the price of the Index moves up and down, found by calculating the annualized standard deviation of the monthly change in price.
Average Annual Volatility: The average of yearly volatilities for a given sample period. The yearly volatility is the relative rate at which the price of the Index moves up and down, found by calculating the annualized standard deviation of the daily change in price for each business day in the given year.
| ** | As of September 3, 1997. |
| *** | As of December 31, 2009. |
Past Index levels are not necessarily indicative of future changes, positive or negative, in the Index levels.
14
Table of Contents
Fees and Commissions are Charged Regardless of Profitability and May Result in Depletion of Assets.
The Fund is indirectly subject to the fees and expenses described herein which are payable irrespective of profitability. Such fees and expenses include asset-based fees of 0.85% per annum.2 Additional charges include brokerage fees of approximately 0.08% per annum in the aggregate and selling commissions. The Fund is expected to earn interest income at an annual rate of 0.08% per annum, based upon the yield on 3-month U.S. Treasury bills as of February 9, 2010. Because the Fund’s current interest income does not exceed its fees and expenses (other than selling commissions), the Fund will need to have a positive performance that exceeds the difference between the Fund’s interest income and its fees and expenses (other than selling commissions) in order to break even. If the aggregate of the Fund’s performance and interest income do not exceed the Fund’s fees and expenses described herein, then, the expenses of the Master Fund could, over time, result in losses to your investment therein. You may never achieve profits, significant or otherwise.
You Cannot Be Assured of the Managing Owner’s Continued Services, Which Discontinuance May Be Detrimental to the Fund.
You cannot be assured that the Managing Owner will be willing or able to continue to service the Fund and the Master Fund for any length of time. If the Managing Owner discontinues its activities on behalf of the Fund and the Master Fund, the Fund and the Master Fund may be adversely affected.
Possible Illiquid Markets May Exacerbate Losses.
Futures positions cannot always be liquidated at the desired price. It is difficult to execute a trade at a specific price when there is a relatively small volume of buy and sell orders in a market. A market disruption, such as when foreign governments may take or be subject to political actions which disrupt the markets in their currency or major exports, can also make it difficult to liquidate a position.
There can be no assurance that market illiquidity will not cause losses for the Fund. The large size of the positions which the Master Fund may acquire on behalf of the Fund increases the risk of illiquidity by both making its positions more difficult to liquidate and increasing the losses incurred while trying to do so.
You May Be Adversely Affected by Redemption Orders that Are Subject To Postponement, Suspension or Rejection Under Certain Circumstances.
The Fund may, in its discretion, suspend the right of redemption or postpone the redemption settlement date, (1) for any period during which an emergency exists as a result of which the redemption distribution is not reasonably practicable, or (2) for such other period as the Managing Owner determines to be necessary for the protection of the Shareholders of the Fund. In addition, the Fund will reject a redemption order if the order is not in proper form as described in the participant agreement among the Authorized Participant, the Managing Owner and the Managing Owner in its capacity as managing owner of the Fund or if the fulfillment of the order, in the opinion of its counsel, might be unlawful. Any such postponement, suspension or rejection could adversely affect a redeeming Authorized Participant. For example, the resulting delay may adversely affect the value of the Authorized Participant’s redemption proceeds if the net asset value of the Fund declines during the period of delay. The Fund disclaims any liability for any loss or damage that may result from any such suspension or postponement.
Because the Futures Contracts Have No Intrinsic Value, the Positive Performance of Your Investment Is Wholly Dependent Upon an Equal and Offsetting Loss.
Futures trading is a risk transfer economic activity. For every gain there is an equal and offsetting loss rather than an opportunity to participate over time in general economic growth. Unlike most alternative investments, an investment in Shares does not involve acquiring any asset with intrinsic value. Overall stock and bond prices could rise significantly and the economy as a whole prosper while Shares trade unprofitably.
| 2 | From July 12, 2006 through January 3, 2010, the Management Fee payable by the Master Fund was 0.75% per annum of the daily net asset value of the Master Fund. Effective January 4, 2010, the Management Fee payable by the Master Fund was increased from 0.75% to 0.85% per annum of the daily net asset value of the Master Fund. |
15
Table of Contents
Failure of Commodity Futures Markets to Exhibit Low to Negative Correlation to General Financial Markets Will Reduce Benefits of Diversification and May Exacerbate Losses to Your Portfolio.
Historically, commodity futures’ returns have tended to exhibit low to negative correlation with the returns of other assets such as stocks and bonds. Although commodity futures trading can provide a diversification benefit to investor portfolios because of its low to negative correlation with other financial assets, the fact that the Index is not 100% negatively correlated with financial assets such as stocks and bonds means the Fund cannot be expected to be automatically profitable during unfavorable periods for the stock or bond market, or vice versa. If the Shares perform in a manner that correlates with the general financial markets or do not perform successfully, you will obtain no diversification benefits by investing in the Shares and the Shares may produce no gains to offset your losses from other investments.
Shareholders Do Not Have the Protections Associated With Ownership of Shares in an Investment Company Registered Under the Investment Company Act of 1940.
Neither the Fund nor the Master Fund is registered as an investment company under the Investment Company Act of 1940 and is not required to register under such Act. Consequently, Shareholders do not have the regulatory protections provided to the investors in registered and regulated investment companies.
Trading on Commodity Exchanges Outside the United States is Not Subject to U.S. Regulation.
Some of the Master Fund’s trading is expected to be conducted on commodity exchanges outside the United States. Trading on such exchanges is not regulated by any United States governmental agency and may involve certain risks not applicable to trading on United States exchanges, including different or diminished investor protections. In trading contracts denominated in currencies other than U.S. dollars, Shares are subject to the risk of adverse exchange-rate movements between the dollar and the functional currencies of such contracts. Investors could incur substantial losses from trading on foreign exchanges which such Investors would not have otherwise been subject had the Master Fund’s trading been limited to U.S. markets.
Aluminum, Zinc, Copper Grade A and Brent Crude are the only Index Commodities that are currently traded on foreign exchanges and such contracts are denominated in USD. The Managing Owner estimates that approximately 25% of the Master Fund’s assets will be allocated for investment in Aluminum, Zinc, Copper Grade A and Brent Crude.
The above range is only an approximation. The actual percentage may be either lesser or greater than above-listed.
Various Actual and Potential Conflicts of Interest May Be Detrimental to Shareholders.
The Fund and the Master Fund are subject to actual and potential conflicts of interest involving the Managing Owner, various commodity futures brokers and Authorized Participants. The Managing Owner and its principals, all of whom are engaged in other investment activities, are not required to devote substantially all of their time to the business of the Fund and the Master Fund, which also presents the potential for numerous conflicts of interest with the Fund and the Master Fund. As a result of these and other relationships, parties involved with the Fund and the Master Fund have a financial incentive to act in a manner other than in the best interests of the Fund, the Master Fund and the Shareholders. The Managing Owner has not established any formal procedure to resolve conflicts of interest. Consequently, investors are dependent on the good faith of the respective parties subject to such conflicts to resolve them equitably. Although the Managing Owner attempts to monitor these conflicts, it is extremely difficult, if not impossible, for the Managing Owner to ensure that these conflicts do not, in fact, result in adverse consequences to the Shareholders.
The Fund and the Master Fund may be subject to certain conflicts with respect to the Commodity Broker, including, but not limited to, conflicts that result from receiving greater amounts of compensation from other clients, or purchasing opposite or competing positions on behalf of third party accounts traded through the Commodity Broker.
16
Table of Contents
Tax Related Risks
Shareholders of the Fund Will Be Subject to Taxation on Their Share of the Fund’s Taxable Income (Including the Fund’s Share of the Master Fund’s Taxable Income), Whether or Not They Receive Cash Distributions.
Shareholders of the Fund will be subject to U.S. federal income taxation and, in some cases, state, local, or foreign income taxation on their share of the Fund’s taxable income (including the Master Fund’s taxable income allocable to the Fund), whether or not they receive cash distributions from the Fund. Shareholders of the Fund may not receive cash distributions equal to their share of the Fund’s taxable income (including the Master Fund’s taxable income) or even the tax liability that results from such income.
Items of Income, Gain, Loss and Deduction With Respect to Shares Could Be Reallocated if the IRS Does Not Accept the Assumptions or Conventions Used by the Fund or the Master Fund in Allocating Such Tax Items.
U.S. federal income tax rules applicable to partnerships are complex and often difficult to apply to publicly traded partnerships. The Fund and the Master Fund will apply certain assumptions and conventions in an attempt to comply with the applicable rules and to report items of income, gain, loss and deduction to Shareholders of the Fund in a manner that reflects the Shareholders’ beneficial interest in such tax items, but these assumptions and conventions may not be considered to be in compliance with all aspects of the applicable tax requirements. It is possible that the IRS will successfully assert that the conventions and assumptions used by the Fund or the Master Fund do not satisfy the technical requirements of the Code and/or Treasury regulations and could require that items of income, gain, loss or deduction be adjusted or reallocated in a manner that adversely affects one or more Shareholders.
The Current Treatment of Long-Term Capital Gains Under Current U.S. Federal Income Tax Law May Be Adversely Affected, Changed or Repealed in the Future.
Under current law, long-term capital gains are taxed to non-corporate investors at a maximum U.S. federal income tax rate of 15%. This tax treatment may be adversely affected, changed or repealed by future changes in tax laws at any time and is currently scheduled to expire for tax years beginning after December 31, 2010.
PROSPECTIVE INVESTORS ARE STRONGLY URGED TO CONSULT THEIR OWN TAX ADVISERS AND COUNSEL WITH RESPECT TO THE POSSIBLE TAX CONSEQUENCES TO THEM OF AN INVESTMENT IN THE SHARES; SUCH TAX CONSEQUENCES MAY DIFFER IN RESPECT OF DIFFERENT INVESTORS.
Other Risks
Failure of Futures Commission Merchants or Commodity Brokers to Segregate Assets May Increase Losses; Despite Segregation of Assets, the Master Fund Remains at Risk of Significant Losses Because the Master Fund May Only Receive a Pro-Rata Share of the Assets, or No Assets at All.
The CEAct requires a clearing broker to segregate all funds received from customers from such broker’s proprietary assets. If the Commodity Broker fails to do so, the assets of the Master Fund might not be fully protected in the event of the Commodity Broker’s bankruptcy. Furthermore, in the event of the Commodity Broker’s bankruptcy, the Master Fund Units could be limited to recovering either a pro rata share of all available funds segregated on behalf of the Commodity Broker’s combined customer accounts or the Master Fund Units may not recover any assets at all, even though certain property specifically traceable to the Master Fund was held by the Commodity Broker. The Commodity Broker may, from time-to-time, have been the subject of certain regulatory and private causes of action.
In the event of a bankruptcy or insolvency of any exchange or a clearing house, the Master Fund could experience a loss of the funds deposited through its Commodity Broker as margin with the exchange or clearing house, a loss of any unrealized profits on its open positions on the exchange, and the loss of profits on its closed positions on the exchange.
17
Table of Contents
Regulatory Changes or Actions May Alter the Nature of an Investment in the Fund.
Considerable regulatory attention has been focused on non-traditional investment pools which are publicly distributed in the United States. There is a possibility of future regulatory changes altering, perhaps to a material extent, the nature of an investment in the Fund or the ability of the Fund to continue to implement its investment strategy.
The futures markets are subject to comprehensive statutes, regulations, and margin requirements. In addition, the CFTC and the exchanges are authorized to take extraordinary actions in the event of a market emergency, including, for example, the retroactive implementation of speculative position limits or higher margin requirements, the establishment of daily price limits and the suspension of trading. The regulation of futures transactions in the United States is a rapidly changing area of law and is subject to modification by government and judicial action. The effect of any future regulatory change on the Fund is impossible to predict, but could be substantial and adverse.
Lack of Independent Advisers Representing Investors.
The Managing Owner has consulted with counsel, accountants and other advisers regarding the formation and operation of the Fund and the Master Fund. No counsel has been appointed to represent you in connection with the offering of the Shares. Accordingly, you should consult your own legal, tax and financial advisers regarding the desirability of an investment in the Shares.
Possibility of Termination of the Fund or Master Fund May Adversely Affect Your Portfolio.
The Managing Owner may withdraw from the Fund upon 120 days’ notice, which would cause the Fund and the Master Fund to terminate unless a substitute managing owner were obtained. Owners of 50% of the Shares have the power to terminate the Fund. If it is so exercised, investors who may wish to continue to invest in a vehicle that tracks the Fund’s Index will have to find another vehicle, and may not be able to find another vehicle that offers the same features as the Fund. Such detrimental developments could cause you to liquidate your own investments and upset the overall maturity and timing of your investment portfolio. If the registrations with the CFTC or memberships in the NFA of the Managing Owner or the Commodity Broker were revoked or suspended, such entity would no longer be able to provide services to the Fund and the Master Fund.
Shareholders Do Not Have the Rights Enjoyed by Investors in Certain Other Vehicles.
As interests in an investment trust, the Shares have none of the statutory rights normally associated with the ownership of shares of a corporation (including, for example, the right to bring “oppression” or “derivative” actions). In addition, the Shares have limited voting and distribution rights (for example, Shareholders do not have the right to elect directors and the Fund is not required to pay regular distributions, although the Fund may pay distributions in the discretion of the Managing Owner).
An Investment in the Shares May Be Adversely Affected by Competition From Other Methods of Investing in Commodities.
The Fund and the Master Fund constitute a relatively new, and thus initially untested, type of investment vehicle. They compete with other financial vehicles, including other commodity pools, hedge funds, traditional debt and equity securities issued by companies in the commodities industry, other securities backed by or linked to such commodities, and direct investments in the underlying commodities or commodity futures contracts. Market and financial conditions, and other conditions beyond the Managing Owner’s control, may make it more attractive to invest in other financial vehicles or to invest in such commodities directly, which could limit the market for the Shares and reduce the liquidity of the Shares.
Competing Claims Over Ownership of Intellectual Property Rights Related to the Fund Could Adversely Affect the Fund and an Investment in the Shares.
While the Managing Owner believes that all intellectual property rights needed to operate the Fund and the Master Fund are either owned by or licensed to the Managing Owner or have been obtained, third parties may allege
18
Table of Contents
or assert ownership of intellectual property rights which may be related to the design, structure and operations of the Fund and the Master Fund. To the extent any claims of such ownership are brought or any proceedings are instituted to assert such claims, the negotiation, litigation or settlement of such claims, or the ultimate disposition of such claims in a court of law if a suit is brought, may adversely affect the Fund and the Master Fund and an investment in the Shares, for example, resulting in expenses or damages or the termination of the Fund and the Master Fund.
“Backwardation” or “Contango” in the Market Prices of the Index Commodities Will Affect the Value of The Shares.
As the futures contracts that underlie the Index near expiration, they are replaced by contracts that have a later expiration. Thus, for example, a contract purchased and held in August 2011 may specify an October 2011 expiration. As that contract nears expiration, it may be replaced by selling the October 2011 contract and purchasing the contract expiring in December 2011. This process is referred to as “rolling.” Historically, the prices of Light Sweet Crude Oil (WTI) and Heating Oil have frequently been higher for contracts with shorter-term expirations than for contracts with longer-term expirations, which is referred to as “backwardation.” In these circumstances, absent other factors, the sale of the October 2011 contract would take place at a price that is higher than the price at which the December 2011 contract is purchased, thereby creating a gain in connection with rolling. While Light Sweet Crude Oil (WTI) and Heating Oil have historically exhibited consistent periods of backwardation, backwardation will likely not exist in these markets at all times. The absence of backwardation in Light Sweet Crude Oil (WTI) and Heating Oil will adversely affect the value of the Index and, accordingly, decrease the value of the Shares.
Conversely, certain of the Index Commodities historically exhibit “contango” markets rather than backwardation. Contango markets are those in which the prices of contracts are higher in the distant delivery months than in the nearer delivery months due to the costs of long-term storage of a physical commodity prior to delivery or other factors. Although certain of the Index Commodities may have historically exhibited consistent periods of contango, contango will likely not exist in these markets at all times. Contango in certain of the Index Commodities will adversely affect the value of the Index and, accordingly, decrease the value of the Shares.
Although the roll method of the Index may minimize the roll losses due to contango and may maximize the roll benefits due to backwardation, there can be no assurance that this outcome will occur.
The Value of the Shares Will be Adversely Affected if the Fund or the Master Fund is Required to Indemnify the Trustee or the Managing Owner.
Under the Trust Agreements, the Trustee and the Managing Owner have the right to be indemnified for any liability or expense either incurs without negligence or misconduct. That means the Managing Owner may require the assets of the Master Fund to be sold in order to cover losses or liability suffered by it or by the Trustee. Any sale of that kind would reduce the net asset value of the Master Fund and the value of the Shares.
The Net Asset Value Calculation of the Master Fund May Be Overstated or Understated Due to the Valuation Method Employed When a Settlement Price is not Available on the Date of Net Asset Value Calculation.
Calculating the net asset value of the Master Fund (and, in turn, the Fund) includes, in part, any unrealized profits or losses on open commodity futures contracts. Under normal circumstances, the net asset value of the Master Fund reflects the settlement price of open commodity futures contracts on the date when the net asset value is being calculated. However, if a commodity futures contract traded on an exchange (both U.S. and non-U.S. exchanges) could not be liquidated on such day (due to the operation of daily limits or other rules of the exchange upon which that position is traded or otherwise), the settlement price on the most recent day on which the position could have been liquidated will be the basis for determining the market value of such position for such day. In such a situation, there is a risk that the calculation of the net asset value of the Master Fund on such day will not accurately reflect the realizable market value of such commodity futures contract. For example, daily limits are generally triggered in the event of a significant change in market price of a commodity futures contract. Therefore, as a result of the daily limit, the current settlement price is unavailable. Because the settlement price on the most recent day on which the position could have been liquidated would be used in lieu of the actual settlement price on the date of determination, there is a risk that the resulting calculation of the net asset value of the Master Fund (and, in turn, the Fund) could be under or overstated, perhaps to a significant degree.
19
Table of Contents
Although the Shares are Limited Liability Investments, Certain Circumstances such as Bankruptcy of the Fund or Indemnification of the Fund by the Shareholders will Increase a Shareholder’s Liability.
The Shares are limited liability investments; investors may not lose more than the amount that they invest plus any profits recognized on their investment. However, Shareholders could be required, as a matter of bankruptcy law, to return to the estate of the Fund any distribution they received at a time when the Fund was in fact insolvent or in violation of its Trust Agreement. In addition, although the Managing Owner is not aware of this provision ever having been invoked in the case of any public futures fund, Shareholders agree in the Trust Agreement that they will indemnify the Fund for any harm suffered by it as a result of
| • | Shareholders’ actions unrelated to the business of the Fund, or |
| • | Taxes imposed on the Shares by the states or municipalities in which such investors reside. |
| ITEM 1B. | UNRESOLVED STAFF COMMENTS |
None.
| ITEM 2. | PROPERTIES |
The Fund and the Master Fund do not own or use physical properties in the conduct of their business. Their assets consist of futures contracts, cash, United States Treasury Obligations and may consist of other high credit quality short-term fixed income securities. The Managing Owner’s headquarters are located at 60 Wall Street, New York, New York 10005.
| ITEM 3. | LEGAL PROCEEDINGS |
None.
| ITEM 4. | SUBMISSION OF MATTERS TO A VOTE OF SECURITY HOLDERS |
None.
| ITEM 5. | MARKET FOR REGISTRANT’S COMMON EQUITY, RELATED STOCKHOLDER MATTERS AND ISSUER PURCHASES OF EQUITY SECURITIES |
Market Information
The Shares of the Fund traded on the NYSE Alternext from February 3, 2006 to November 25, 2008 and have been trading on the NYSE Arca since November 25, 2008 under the symbol “DBC.”
The following table sets forth, for the calendar quarters indicated, the high and low sales prices per Share, as reported on the applicable exchange.
| Shares | ||||||
| Quarter ended |
High | Low | ||||
| March 31, 2009 |
$ | 22.74 | $ | 18.15 | ||
| June 30, 2009 |
$ | 24.19 | $ | 19.44 | ||
| September 30, 2009 |
$ | 23.95 | $ | 20.74 | ||
| December 31, 2009 |
$ | 24.84 | $ | 21.70 | ||
| Quarter ended |
High | Low | ||||
| March 31, 2008 |
$ | 38.95 | $ | 30.72 | ||
| June 30, 2008 |
$ | 45.59 | $ | 35.57 | ||
| September 30, 2008 |
$ | 46.44 | $ | 32.28 | ||
| December 31, 2008 |
$ | 33.10 | $ | 19.69 | ||
20
Table of Contents
Holders
As of December 31, 2009, the Fund had 311,077 holders of record for its Shares.
Distributions
The Managing Owner has sole discretion in determining what distributions, if any, the Fund will make to Shareholders.
The Fund paid no distributions for the year ended December 31, 2009.
On December 30, 2008, the Fund paid $0.34 per General Share to the Managing Owner, a total distribution of $13.60. On December 30, 2008, the Fund paid $0.34 per Share to each Shareholder of record on December 17, 2008, a total distribution of $17,748,000. All distributions were made from net investment income.
Sales of Unregistered Securities and Use of Proceeds of Registered Securities
(a) There have been no unregistered sales of the Fund’s securities. No Fund securities are authorized for issuance by the Fund under equity compensation plans.
(b) The Registrant’s Registration Statement on Form S-1 (Registration No.: 333-125325) was declared effective on January 17, 2006 with information with respect to the use of proceeds from the sale of the Shares being disclosed therein. A Post-Effective Amendment No. 1 to the Registrant’s Registration Statement on Form S-1 was declared effective on August 14, 2006, which also contained this information. The Registrant’s Registration Statement on Form S-1 (Registration No.: 333-141631) was declared effective on May 1, 2007 with information with respect to the use of proceeds from the sale of the Shares being disclosed therein. The Registrant’s Registration Statement on Form S-1 (Registration No.: 333-150217) was declared effective on May 1, 2008 with information with respect to the use of proceeds from the sale of the Shares being disclosed therein. Post-Effective Amendment No. 1 to a Registration Statement on Form S-1 on Form S-3 was filed on February 5, 2009 (Registration No. 333-150217) with information with respect to the use of proceeds from the sale of the Limited Shares being disclosed therein. Accordingly, upon effectiveness, the Post-Effective Amendment No. 1 to a Registration Statement on Form S-1 on Form S-3 (Registration No. 333-150217) will also act as Post-Effective Amendment No. 2 to File No. 333-141631 and as a Post-Effective Amendment No. 1 to File No. 333-150217, which also contained this information. The Registrant’s Registration Statement on Form S-3 (Registration No.: 333-158733) was declared effective upon filing on April 23, 2009 with information with respect to the use of proceeds from the sale of the Shares being disclosed therein. A Post-Effective Amendment No. 1 to the Registrant’s Registration Statement on Form S-3 was declared effective upon filing on January 4, 2010, which also contained this information. The Shares began trading on the NYSE Alternext on February 3, 2006 and are now traded on the NYSE Arca as of November 25, 2008.
The proceeds from the sale of the Shares are used to purchase Master Fund Limited Units. The Master Fund uses the proceeds from the sale of the Master Fund Limited Units for general corporate purposes in accordance with its investment objectives and policies.
During the Year Ended December 31, 2009, 130.0 million Shares were created for $2,882.1 million and 8.0 million Shares were redeemed for $174.5 million. For the Three Months Ended December 31, 2009, 25.0 million Shares were created for $603.3 million and 3.0 million Shares were redeemed for $68.6 million. On December 31, 2009, 178.0 million Shares of the Fund were outstanding for a market capitalization of $4,382.4 million.
21
Table of Contents
During the Year Ended December 31, 2008, 37.0 million Shares were created for $1,213.1 million and 30.0 million Shares were redeemed for $1,102.0 million. For the Three Months Ended December 31, 2008, 9.2 million Shares were created for $203.1 million and 6.6 million Shares were redeemed for $184.1 million. On December 31, 2008, 56.0 million Shares of the Fund were outstanding for a market capitalization of $1,186.6 million.
During the Year Ended December 31, 2007, 22.6 million Shares were created for $610.9 million and 2.6 million Shares were redeemed for $74.8 million. For the Three Months Ended December 31, 2007, 7.4 million Shares were created for $223.3 million and 1.8 million Shares were redeemed for $54.4 million. On December 31, 2007, 49.0 million Shares of the Fund were outstanding for a market capitalization of $1,546.4 million.
(c) The following table summarizes the redemptions by Authorized Participants during the Years Ended December 31, 2009, 2008 and 2007:
| Period of Redemption |
Total Number of Shares Redeemed |
Average Price Paid per Share | |||
| Year Ended December 31, 2009 |
8,000,000 | $ | 21.81 | ||
| Year Ended December 31, 2008 |
30,000,000 | $ | 36.73 | ||
| Year Ended December 31, 2007 |
2,600,000 | $ | 28.77 | ||
| ITEM 6. | SELECTED FINANCIAL DATA |
The following table summarizes the relevant 2009, 2008, 2007 and 2006 financial data for the Fund and should be read in conjunction with the Fund’s financial statements, and the notes and schedules related thereto, which are included in this report. The Fund commenced investment operations on January 31, 2006; therefore, no operating results occurred prior to that date. As a result, there is no comparable financial data presented below for 2005.
22
Table of Contents
| YEAR ENDED | PERIOD
ENDED December 31, 2006 |
|||||||||||||||
| December 31, 2009 | December 31, 2008 | December 31, 2007 | ||||||||||||||
| Interest Income |
$ | 3,427,808 | $ | 35,937,704 | $ | 46,678,838 | $ | 22,735,035 | ||||||||
| Net investment income |
$ | (18,760,783 | ) | $ | 20,224,319 | $ | 38,609,893 | $ | 18,451,405 | |||||||
| Net realized and net change in unrealized gains/(losses) on United States Treasury Obligations and futures |
$ | 499,850,835 | $ | (456,010,180 | ) | $ | 291,658,800 | $ | (1,454,764 | ) | ||||||
| Net Income (Loss) |
$ | 481,090,052 | $ | (435,785,861 | ) | $ | 330,268,693 | $ | 16,996,641 | |||||||
| Net Income (Loss) per Share |
$ | 3.23 | $ | (9.70 | ) | $ | 7.67 | $ | 0.91 | |||||||
| Distribution per Share |
$ | — | $ | 0.34 | $ | 0.76 | $ | 0.61 | ||||||||
| Net increase (decrease) in cash |
$ | (1,471,361,635 | ) | $ | 1,713,943,642 | $ | (42,580,605 | ) | $ | 42,579,605 | ||||||
| As of December 31, 2009 |
As of December 31, 2008 |
As of December 31, 2007 |
As of December 31, 2006 |
|||||||||||||
| Total Assets |
$ | 4,390,954,240 | $ | 1,199,952,828 | $ | 1,748,716,168 | $ | 712,360,005 | ||||||||
| Shares NAV |
$ | 24.65 | $ | 21.42 | $ | 31.46 | $ | 24.55 | ||||||||
| General Shares NAV |
$ | 24.65 | $ | 21.43 | $ | 31.48 | $ | 24.55 | ||||||||
| Selected Quarterly Financial Data (Unaudited) |
| |||||||||||||||
| For
the Three Months Ended March 31, 2009 |
For
the Three Months Ended June 30, 2009 |
For
the Three Months Ended September 30, 2009 |
For
the Three Months Ended December 31, 2009 |
|||||||||||||
| Interest income |
$ | 376,713 | $ | 901,785 | $ | 1,310,739 | $ | 838,571 | ||||||||
| Net investment income |
$ | (2,219,631 | ) | $ | (3,826,786 | ) | $ | (5,025,958 | ) | $ | (7,688,408 | ) | ||||
| Net realized and net change in unrealized gains/(losses) on United States Treasury Obligations and futures |
$ | (73,156,602 | ) | $ | 217,993,749 | $ | (44,752,453 | ) | $ | 399,766,141 | ||||||
| Net income/(loss) |
$ | (75,376,233 | ) | $ | 214,166,963 | $ | (49,778,411 | ) | $ | 392,077,733 | ||||||
| Increase/(decrease) in Net Asset Value |
$ | 513,263,839 | $ | 1,266,144,511 | $ | 482,543,851 | $ | 926,755,307 | ||||||||
| Net Income (Loss) per Share |
$ | (1.23 | ) | $ | 2.27 | $ | (0.27 | ) | $ | 2.46 | ||||||
| For the Three Months Ended March 31, 2008 |
For the Three Months Ended June 30, 2008 |
For the Three Months Ended September 30, 2008 |
For the Three Months Ended December 31, 2008 |
|||||||||||||
| Interest income |
$ | 12,923,071 | $ | 10,202,048 | $ | 9,811,634 | $ | 3,000,951 | ||||||||
| Net investment income |
$ | 9,186,425 | $ | 4,979,069 | $ | 5,468,131 | $ | 590,694 | ||||||||
| Net realized and net change in unrealized gains/(losses) on United States Treasury Obligations and futures |
$ | 230,265,425 | $ | 583,923,615 | $ | (672,699,995 | ) | $ | (597,499,225 | ) | ||||||
| Net income/(loss) |
$ | 239,451,850 | $ | 588,902,684 | $ | (667,231,864 | ) | $ | (596,908,531 | ) | ||||||
| Increase/(decrease) in Net Asset Value |
$ | 705,941,512 | $ | 718,716,078 | $ | (1,171,386,954 | ) | $ | (595,703,121 | ) | ||||||
| Net Income (Loss) per Share |
$ | 4.44 | $ | 9.04 | $ | (11.33 | ) | $ | (11.85 | ) | ||||||
23
Table of Contents
| ITEM 7. | MANAGEMENT’S DISCUSSION AND ANALYSIS OF FINANCIAL CONDITION AND RESULTS OF OPERATIONS |
This information should be read in conjunction with the consolidated financial statements and notes included in Item 8 of Part I of this Annual Report (the “Report”). The discussion and analysis which follows may contain trend analysis and other forward-looking statements within the meaning of Section 21E of the Securities Exchange Act of 1934 which reflect our current views with respect to future events and financial results. Words such as “anticipate,” “expect,” “intend,” “plan,” “believe,” “seek,” “outlook” and “estimate” as well as similar words and phrases signify forward-looking statements. PowerShares DB Commodity Index Tracking Fund’s forward-looking statements are not guarantees of future results and conditions and important factors, risks and uncertainties may cause our actual results to differ materially from those expressed in our forward-looking statements.
You should not place undue reliance on any forward-looking statements. Except as expressly required by the Federal securities laws, DB Commodity Services LLC (the “Managing Owner”), undertakes no obligation to publicly update or revise any forward-looking statements or the risks, uncertainties or other factors described in this Report, as a result of new information, future events or changed circumstances or for any other reason after the date of this Report.
Overview/Introduction
The Fund invests substantially all of its assets in the Master Fund in a master-feeder structure. The Fund holds no investment assets other than Master Fund Units. The Master Fund is wholly-owned by the Fund and the Managing Owner. Each Share issued by the Fund correlates with a Master Fund Unit issued by the Master Fund and held by the Fund.
During the period from January 31, 2006 (commencement of investment operations) to May 23, 2006, the Master Fund invested with a view to tracking changes, whether positive or negative, in the level of the Deutsche Bank Liquid Commodity Index—Excess Return™ over time, plus the excess, if any, of the Master Fund’s income from its holdings of United States Treasury Obligations and other high credit quality short-term fixed income securities over the expenses of the Fund and the Master Fund. During the period from May 24, 2006 to October 16, 2009, the Master Fund invested with a view to tracking changes, whether positive or negative, in the level of the Deutsche Bank Liquid Commodity Index—Optimum Yield Excess Return™ over time, plus the excess, if any, of the Master Fund’s income from its holdings of United States Treasury Obligations and other high credit quality short-term fixed income securities over the expenses of the Fund and the Master Fund. The commodities comprising the Deutsche Bank Liquid Commodity Index—Optimum Yield Excess Return™ are Light Sweet Crude Oil (WTI), Heating Oil, Aluminum, Gold, Corn and Wheat. Commencing October 19, 2009, the Master Fund invested with a view to tracking changes, whether positive or negative, in the level of the Deutsche Bank Liquid Commodity Index-Optimum Yield Diversified Excess Return™ (the “Index”) over time, plus the excess, if any, of the Master Fund’s income from its holdings of United States Treasury Obligations and other high credit quality short-term fixed income securities over the expenses of the Fund and the Master Fund. The Index is intended to reflect the change in market value of certain commodities. The commodities comprising the Index are Light Sweet Crude Oil (WTI), Heating Oil, Aluminum, Gold, Corn, Wheat, Brent Crude, Copper Grade A, Natural Gas, RBOB Gasoline, Silver, Soybeans, Sugar and Zinc (the “Index Commodities”). The Master Fund holds United States Treasury Obligations and other high credit quality short-term fixed income securities for deposit with the Master Fund’s commodity broker as margin.
The Fund pursues its investment objective by investing substantially all of its assets in the Master Fund. The Master Fund pursues its investment objective by investing in a portfolio of exchange-traded futures contracts in the Index Commodities. The notional amounts of each Index Commodity included in the Index are broadly in proportion to historic levels of the world’s production and stocks of the Index Commodities. The Master Fund holds United States Treasury Obligations and other high credit quality short-term fixed income securities for deposit with the Master Fund’s Commodity Broker as margin. The sponsor of the Index is Deutsche Bank AG London (the “Index Sponsor”). DBLCI™ and Deutsche Bank Liquid Commodity Index™ are trademarks of Deutsche Bank AG. Trademark applications in the United States are pending with respect to both the Fund and the Index. Deutsche Bank AG London is an affiliate of the Fund, the Master Fund and the Managing Owner.
Under the Trust Agreements of each of the Fund and the Master Fund, Wilmington Trust Company, the Trustee of the Fund and the Master Fund, has delegated to the Managing Owner the exclusive management and control of all aspects of the business of the Fund and the Master Fund. The Trustee will have no duty or liability to
24
Table of Contents
supervise or monitor the performance of the Managing Owner, nor will the Trustee have any liability for the acts or omissions of the Managing Owner.
The Index Sponsor obtains information for inclusion in, or for use in the calculation of, the Index from sources the Index Sponsor considers reliable. None of the Index Sponsor, the Managing Owner, the Fund, the Master Fund or any of their respective affiliates accepts responsibility for or guarantees the accuracy and/or completeness of the Index or any data included in the Index.
The Shares are intended to provide investment results that generally correspond to the changes, positive or negative, in the levels of the Index over time. The value of the Shares is expected to fluctuate in relation to changes in the value of the Master Fund’s portfolio. The market price of the Shares may not be identical to the net asset value per Share, but these two valuations are expected to be very close.
Performance Summary
This Report covers the three months ended December 31, 2009, 2008 and 2007 ((herein referred to as the “Three Months Ended December 31, 2009”, the “Three Months Ended December 31, 2008” and the “Three Months Ended December 31, 2007”, respectively), and the years ended December 31, 2009, 2008 and 2007 (herein referred to as the “Year Ended December 31, 2009”, the “Year Ended December 31, 2008” and the “Year Ended December 31, 2007”, respectively).
Performance of the Fund and the exchange traded Shares is detailed below in “Results of Operations”. Past performance of the Fund is not necessarily indicative of future performance.
The Index is intended to reflect the change in market value of the Index Commodities. In turn, the notional amounts of each Index Commodity are broadly in proportion to historic levels of the world’s production and stocks of such Index Commodities. The Deutsche Bank Liquid Commodity Index-Optimum Yield Total Return™, or DBCLI-OYTR™ consists of the Index plus 3-month United States Treasury Obligations returns. (Because the Master Fund invested with a view to tracking the changes, whether positive or negative, in the level of the Deutsche Bank Liquid Commodity-Index Optimum Yield Excess Return™ (“DBLCI-OY ER™”) to October 19, 2009, references to the DBLCI-OY TR™ and the DBLCI Diversified TR™ have been included). Past Index results are not necessarily indicative of future changes, positive or negative, in the Index closing levels. Deutsche Bank Liquid Commodity Index-Optimum Yield Diversified Total Return™, or DBLCI–OY Diversified TR™, consists of the Index plus 3-month United States Treasury Obligations returns. Past Index results are not necessarily indicative of future changes, positive or negative, in the Index closing levels.
The section “Summary of DBLCI-OYTR™ and Underlying Index Commodity Returns for the Three Months Ended December 31, 2009, 2008 and 2007 and the Years Ended December 31, 2009, 2008, and 2007 and Summary of DBLCI–OY Diversified TR™ and Underlying Index Commodity Returns for the Three Months Ended December 31, 2009 and the Year Ended December 31, 2009” below provides an overview of the changes in the closing levels of DBLCI–OY Diversified TR™ by disclosing the change in market value of each underlying component Index Commodity through a “surrogate” (and analogous) index plus 3-month United States Treasury Obligations returns. Please note also that the Fund’s objective is to track the Index (not the DBLCI-OYTR™ or the DBLCI–OY Diversified TR™), and the Fund does not attempt to outperform or underperform the Index.
25
Table of Contents
Summary of DBLCI-OYTR™ and Underlying Index Commodity Returns for the Three Months Ended December 31, 2009, 2008 and 2007 and the Years Ended December 31, 2009, 2008, and 2007 and Summary of DBLCI–OY Diversified TR™ and Underlying Index Commodity Returns for the Three Months Ended December 31, 2009 and the Year Ended December 31, 2009
| Underlying Index |
AGGREGATE RETURNS FOR INDEX IN THE | |||||||||||
| DBLCI-OYTR™ * | DBLCI–OY Diversified TR™ |
|||||||||||
| Three Months Ended December 31, 2009 |
Three Months Ended December 31, 2008 |
Three Months Ended December 31, 2007 |
Three Months Ended December 31, 2009 |
|||||||||
| DB Crude Oil Indices |
10.47 | % | -46.86 | % | 23.40 | % | 10.47 | % | ||||
| DB Heating Oil Indices |
9.21 | % | -47.66 | % | 20.93 | % | 9.21 | % | ||||
| DB Aluminum Indices |
15.57 | % | -36.85 | % | -3.95 | % | 15.57 | % | ||||
| DB Gold Indices |
8.53 | % | -0.06 | % | 11.62 | % | 8.53 | % | ||||
| DB Corn Indices |
13.62 | % | -20.77 | % | 13.75 | % | 13.62 | % | ||||
| DB Wheat Indices |
12.48 | % | -12.97 | % | 14.87 | % | 12.48 | % | ||||
| RBOB Gasoline Indices |
N/A | N/A | N/A | 11.26 | % | |||||||
| Natural Gas Indices |
N/A | N/A | N/A | -7.10 | % | |||||||
| Brent Crude Indices |
N/A | N/A | N/A | 9.59 | % | |||||||
| Silver Indices |
N/A | N/A | N/A | 1.05 | % | |||||||
| Zinc Indices |
N/A | N/A | N/A | 29.32 | % | |||||||
| Copper Grade A Indices |
N/A | N/A | N/A | 19.56 | % | |||||||
| Soybeans Indices |
N/A | N/A | N/A | 9.25 | % | |||||||
| Sugar Indices |
N/A | N/A | N/A | 2.01 | % | |||||||
| AGGREGATE RETURNS |
11.31 | % | -35.47 | % | 16.14 | % | 10.08 | % | ||||
| Underlying Index |
AGGREGATE RETURNS FOR INDEX IN THE | |||||||||||
| DBLCI-OYTR™ * | DBLCI–OY Diversified TR™ |
|||||||||||
| Year Ended December 31, 2009 |
Year Ended December 31, 2008 |
Year Ended December 31, 2007 |
Year Ended December 31, 2009 |
|||||||||
| DB Crude Oil Indices |
36.28 | % | -40.80 | % | 39.15 | % | 36.28 | % | ||||
| DB Heating Oil Indices |
15.44 | % | -36.34 | % | 45.76 | % | 15.44 | % | ||||
| DB Aluminum Indices |
32.58 | % | -38.78 | % | -7.00 | % | 32.58 | % | ||||
| DB Gold Indices |
22.95 | % | 3.15 | % | 29.02 | % | 22.95 | % | ||||
| DB Corn Indices |
-13.32 | % | -17.35 | % | 17.32 | % | -13.32 | % | ||||
| DB Wheat Indices |
-21.84 | % | -25.43 | % | 57.16 | % | -21.84 | % | ||||
| RBOB Gasoline Indices |
N/A | N/A | N/A | 51.86 | % | |||||||
| Natural Gas Indices |
N/A | N/A | N/A | -44.29 | % | |||||||
| Brent Crude Indices |
N/A | N/A | N/A | 29.09 | % | |||||||
| Silver Indices |
N/A | N/A | N/A | 48.75 | % | |||||||
| Zinc Indices |
N/A | N/A | N/A | 97.61 | % | |||||||
| Copper Grade A Indices |
N/A | N/A | N/A | 133.81 | % | |||||||
| Soybeans Indices |
N/A | N/A | N/A | 0.73 | % | |||||||
| Sugar Indices |
N/A | N/A | N/A | 63.01 | % | |||||||
| AGGREGATE RETURNS |
16.15 | % | -30.94 | % | 32.57 | % | 27.87 | % | ||||
26
Table of Contents
| * | During the period from October 19, 2009 to December 31, 2009, the Fund tracked the Deutsche Bank Liquid Commodity Index-Optimum Yield Diversified Excess Return™. During this same period, the Fund did not track the changes in closing levels of DBLCI–OY ER™. |
If the Fund’s interest income from its holdings of fixed income securities were to exceed the Fund’s fees and expenses, the aggregate return on an investment in the Fund is expected to outperform the DBLCI–OY Diversified ER™ (the DBLCI OYER™ prior to October 19, 2009) and underperform the DBLCI–OY Diversified TR™ (the DBLCI OYTR™ prior to October 19, 2009). The only difference between (i) the Index and the DBLCI OYER™ (collectively referred to as the “Excess Return Indexes”) and (ii) the DBLCI–OY Diversified TR™ and the DBLCI OYTR™ (collectively referred to as the “Total Return Indexes”) is that the Excess Return Indexes do not include interest income from a hypothetical basket of fixed income securities while the Total Return Indexes do include such a component. The difference between the Excess Return Indexes and the Total Return Indexes is attributable entirely to the hypothetical interest income from this hypothetical basket of fixed income securities. If the Fund’s interest income from its holdings of fixed-income securities exceeds the Fund’s fees and expenses, then the amount of such excess is expected to be distributed periodically. The market price of the Shares is expected to closely track the Index (or prior to October 19, 2009, the DBLCI OYER™). The aggregate return on an investment in the Fund over any period is the sum of the capital appreciation or depreciation of the Shares over the period, plus the amount of any distributions during the period. Consequently, the Fund’s aggregate return is expected to outperform the Excess Return Indexes by the amount of the excess, if any, of its interest income over its fees and expenses but, as a result of the Fund’s fees and expenses, the aggregate return on the Fund is expected to underperform the Total Return Indexes. If the Fund’s fees and expenses were to exceed the Fund’s interest income from its holdings of fixed income securities, the aggregate return on an investment in the Fund is expected to underperform the Excess Return Indexes.
Net Asset Value
Net asset value means the total assets of the Master Fund, including, but not limited to, all futures, cash and investments less total liabilities of the Master Fund, each determined on the basis of U.S. generally accepted accounting principles, consistently applied under the accrual method of accounting. In particular, net asset value includes any unrealized appreciation or depreciation on open commodity futures contracts, and any other credit or debit accruing to the Master Fund but unpaid or not received by the Master Fund. All open commodity futures contracts will be calculated at their then current market value, which will be based upon the settlement price for that particular commodity futures contract traded on the applicable exchange on the date with respect to which net asset value is being determined; provided, that if a commodity futures contract could not be liquidated on such day, due to the operation of daily limits or other rules of the exchange upon which that position is traded or otherwise, the settlement price on the most recent day on which the position could have been liquidated will be the basis for determining the market value of such position for such day. The Managing Owner may in its discretion (and only under extraordinary circumstances, including, but not limited to, periods during which a settlement price of a futures contract is not available due to exchange limit orders or force majeure type events such as systems failure, natural or man-made disaster, act of God, armed conflict, act of terrorism, riot or labor disruption or any similar intervening circumstance) value any asset of the Master Fund pursuant to such other principles as the Managing Owner deems fair and equitable so long as such principles are consistent with normal industry standards. Interest earned on the Master Fund’s brokerage account is accrued monthly. The amount of any distribution is a liability of the Master Fund from the day when the distribution is declared until it is paid.
The Fund invests substantially all of its assets in the Master Fund in a master-feeder structure. The Fund holds no investment assets other than Master Fund Limited Units. The Fund is the majority Master Fund Limited Unit owner and the Managing Owner holds a non-controlling interest in the Master Fund. Each Share issued by the Fund correlates with the Master Fund Limited Unit issued by the Master Fund and held by the Fund.
Net asset value per Master Fund Limited Unit and Master Fund General Unit (collectively, “Master Fund Units”) is the net asset value of the Master Fund divided by the number of outstanding Master Fund Units. Because
27
Table of Contents
there is a one-to-one correlation between Shares of the Fund and Master Fund Limited Units, the net asset value per Share of the Fund and the net asset value per Master Fund Limited Unit are equal.
Critical Accounting Policies
The Fund’s and Master Fund’s critical accounting policies are as follows:
Preparation of the financial statements and related disclosures in conformity with U.S. generally accepted accounting principles requires the application of appropriate accounting rules and guidance, as well as the use of estimates, and requires management to make estimates and assumptions that affect the reported amounts of assets and liabilities, revenue and expense and related disclosure of contingent assets and liabilities during the reporting period of the consolidated financial statements and accompanying notes. Both the Fund’s and the Master Fund’s application of these policies involve judgments and actual results may differ from the estimates used.
The Master Fund holds a significant portion of its assets in futures contracts and United States Treasury Obligations, both of which are recorded on a trade date basis and at fair value in the consolidated financial statements, with changes in fair value reported in the consolidated statement of income and expenses.
The use of fair value to measure financial instruments, with related unrealized gains or losses recognized in earnings in each period is fundamental to the Fund’s financial statements. The fair value of a financial instrument is the amount that would be received to sell an asset or paid to transfer a liability in an orderly transaction between market participants at the measurement date (the exit price).
In determining fair value of United States Treasury Obligations and commodity futures contracts, the Fund uses unadjusted quoted market prices in active markets. FASB fair value measurement and disclosure guidance requires a fair value hierarchy that prioritizes the inputs to valuation techniques used to measure fair value. The objective of a fair value measurement is to determine the price that would be received to sell an asset or paid to transfer a liability in an orderly transaction between market participants at the measurement date (an exit price). The hierarchy gives the highest priority to unadjusted quoted prices for identical assets or liabilities (Level 1 measurements) and the lowest priority to unobservable inputs (Level 3 measurements). Assets and liabilities are classified in their entirety based on the lowest level of input that is significant to the fair value measurement. See Note 4(c) within the financial statements in Item 8 for further information.
When market closing prices are not available, the Managing Owner may value an asset of the Master Fund pursuant to policies the Managing Owner has adopted, which are consistent with normal industry standards.
Realized gains (losses) and changes in unrealized gain (loss) on open positions are determined on a specific identification basis and recognized in the consolidated statement of income and expenses in the period in which the contract is closed or the changes occur, respectively.
Interest income on United States Treasury Obligations is recognized on an accrual basis when earned. Premiums and discounts are amortized or accreted over the life of the United States Treasury Obligations.
Market Risk
Trading in futures contracts involves the Master Fund entering into contractual commitments to purchase a particular commodity at a specified date and price. The market risk associated with the Master Fund’s commitments to purchase commodities is limited to the gross or face amount of the contracts held.
The Master Fund’s exposure to market risk is also influenced by a number of factors including the volatility of interest rates and foreign currency exchange rates, the liquidity of the markets in which the contracts are traded and the relationships among the contracts held. The inherent uncertainty of the Master Fund’s trading as well as the development of drastic market occurrences could ultimately lead to a loss of all or substantially all of the investors’ capital.
28
Table of Contents
Credit Risk
When the Master Fund enters into futures contracts, the Master Fund is exposed to credit risk that the counterparty to the contract will not meet its obligations. The counterparty for futures contracts traded on United States and on most of foreign futures exchanges is the clearing house associated with the particular exchange. In general, clearing houses are backed by their corporate members who may be required to share in the financial burden resulting from the nonperformance by one of their members and, as such, should significantly reduce this credit risk. In cases where the clearing house is not backed by the clearing members (i.e., some foreign exchanges), it may be backed by a consortium of banks or other financial institutions. There can be no assurance that any counterparty, clearing member or clearinghouse will meet its obligations to the Master Fund.
The Commodity Broker, when acting as the Master Fund’s futures commission merchant in accepting orders for the purchase or sale of domestic futures contracts, is required by CFTC regulations to separately account for and segregate as belonging to the Master Fund all assets of the Master Fund relating to domestic futures trading and the Commodity Broker is not allowed to commingle such assets with other assets of the Commodity Broker. In addition, CFTC regulations also require the Commodity Broker to hold in a secure account assets of the Master Fund related to foreign futures trading. Also see Item 1A.—Risk Factors—“Failure of Futures Commission Merchants or Commodity Brokers to Segregate Assets May Increase Losses; Despite Segregation of Assets, the Master Fund Remains at Risk of Significant Losses Because the Master Fund May Only Receive a Pro-Rata Share of the Assets.”
Liquidity
All of the Master Fund’s source of capital is derived from the Fund through the Fund’s offering of Shares to Authorized Participants. Authorized Participants may then subsequently redeem such Shares. The Master Fund in turn allocates its net assets to commodities trading. A significant portion of the net asset value is held in United States Treasury Obligations and cash, which are used as margin for the Master Fund’s trading in commodities. The percentage that United States Treasury Obligations bear to the total net assets will vary from period to period as the market values of the Master Fund’s commodity interests change. The balance of the net assets are held in the Master Fund’s commodity trading account. Interest earned on the Master Fund’s interest-bearing funds is paid to the Master Fund.
The Master Fund’s commodity contracts may be subject to periods of illiquidity because of market conditions, regulatory considerations or for other reasons. For example, commodity exchanges may limit fluctuations in certain commodity futures contract prices during a single day by regulations referred to as “daily limits.” During a single day, no trades may be executed at prices beyond the daily limit. Once the price of a futures contract for a particular commodity has increased or decreased by an amount equal to the daily limit, positions in the commodity can neither be taken nor liquidated unless the traders are willing to effect trades at or within the limit. Commodity futures prices have occasionally moved the daily limit for several consecutive days with little or no trading. Such market conditions could prevent the Master Fund from promptly liquidating its commodity futures positions.
Because the Master Fund trades futures contracts, its capital is at risk due to changes in the value of futures contracts (market risk) or the inability of counterparties to perform under the terms of the contracts (credit risk).
On any business day, an Authorized Participant may place an order with the Managing Owner to redeem one or more Baskets. Redemption orders must be placed by 10:00 a.m., New York time. The day on which the Managing Owner receives a valid redemption order is the redemption order date. Redemption orders are irrevocable. The redemption procedures allow Authorized Participants to redeem Baskets. Individual Shareholders may not redeem directly from the Fund. By placing a redemption order, an Authorized Participant agrees to deliver the Baskets to be redeemed through DTC’s book-entry system to the Fund not later than noon, New York time, on the business day immediately following the redemption order date. By placing a redemption order, and prior to receipt of the redemption proceeds, an Authorized Participant’s DTC account is charged the non-refundable transaction fee due for the redemption order.
29
Table of Contents
Cash Flows
The primary cash flow activities of the Fund are to raise capital from Authorized Participants through the issuance of Shares. This cash is invested into the Master Fund where it is used to invest in United States Treasury Obligations and to meet margin requirements as a result of the positions taken in futures contracts to match the fluctuations of the Index the Fund is tracking.
Operating Activities
Net cash flow provided by and (used for) operating activities was $4,179 million, $1,621 million and $(542) million during the Years Ended December 31, 2009, 2008 and 2007, respectively. These amounts primarily include net purchases and sales of United States Treasury Obligations which are held at fair value on the statement of financial condition.
During the Year Ended December 31, 2009, $11,956 million was paid to purchase United States Treasury Obligations and $8,225 million was received from sales and maturing contracts. During the Year Ended December 31, 2008, $7,618 million was paid to purchase United States Treasury Obligations and $8,950 million was received from sales and maturing contracts. During the Year Ended December 31, 2007, $4,526 million was paid to purchase United States Treasury Obligations and $3,802 million was received from sales and maturing contracts. Unrealized appreciation on futures increased by $910 million, decreased by $959 million and increased by $305 million during the Years Ended December 31, 2009, 2008 and 2007, respectively.
Financing Activities
The Fund’s net cash flow provided by financing activities was $2,708 million, $93 million and $500 million during the Years Ended December 31, 2009, 2008 and 2007, respectively. This included $2,882 million, $1,213 million and $611 million from the sale of Shares to Authorized Participants during the Years Ended December 31, 2009, 2008 and 2007, respectively.
Results of Operations
FOR THE THREE MONTHS ENDED DECEMBER 31, 2009, 2008 AND 2007 AND FOR THE YEARS ENDED DECEMBER 31, 2009, 2008 AND 2007
The Fund was launched on January 31, 2006 at $25.00 per Share. The Shares of the Fund traded on the NYSE Alternext from February 3, 2006 to November 25, 2008 and have been trading on the NYSE Arca since November 25, 2008.
The Fund and the Master Fund seek to track changes in the closing levels of the Deutsche Bank Liquid Commodity Index–Optimum Yield Diversified Excess Return™ (the “Index”) over time, plus the excess, if any, of the Master Fund’s interest income from its holdings of United States Treasury Obligations and other high credit quality short-term fixed income securities over the expenses of the Fund and the Master Fund. The following graphs illustrate changes in (i) the price of the Shares (as reflected by the graph “DBC”), (ii) the Fund’s NAV (as reflected by the graph “DBCNAV”), and (iii) the closing levels of the Index (as reflected by the graph “DBLCIX”). The price of the Shares generally has exceeded the levels of the Index primarily because the Share price reflects interest income from the Master Fund’s collateral holdings whereas the Index does not consider such interest income. There can be no assurances that the price of the Shares will continue to exceed the Index levels.
The Index is a set of rules applied to a body of data and does not represent the results of actual investment or trading. The Index is frictionless, in that it does not take into account fees or expenses associated with investing in the Fund. Also, because it does not represent actual futures positions, the Index is not subject to, and does not take into account the impact of, speculative position limits or certain other similar limitations on the ability of the Fund to trade the Index Commodities. The “TR” version of the Index includes an assumed amount of interest income based on prevailing rates that is adjusted from time to time. The Fund, by contrast, invests actual money and
30
Table of Contents
trades actual futures contracts. As a result, the performance of the Fund involves friction, in that fees and expenses impose a drag on performance. The Fund may be subject to speculative position limits and certain other limitations on its ability to trade the Index Commodities, which may compel the Fund to trade futures or other instruments that are not Index Commodities as proxies for the Index Commodities. The interest rate actually earned by the Fund over any period may differ from the assumed amount of interest income factored into the “TR” version of the Index over the same period. All of these factors can contribute to discrepancies between changes in net asset value per Share and changes in the level of the Index over any period of time. Fees and expenses always will tend to cause changes in the net asset value per Share to underperform changes in the value of the Index over any given period, all other things being equal. Actual interest income could be higher or lower than the assumed interest income factored into the “TR” version of the Index, and therefore could cause changes in the net asset value per Share to outperform or underperform changes in the value of the Index over any given period, all other things being equal. Similarly, trading futures or other instruments that are not the Index Commodities as proxies for Index Commodities could cause changes in the net asset value per Share to outperform or underperform changes in the value of the Index over any given period, all other things being equal.
31
Table of Contents
COMPARISON OF DBC, DBCNAV AND DBLCIX FOR THE YEARS ENDED
DECEMBER 31, 2009, 2008 AND 2007, AND
FOR THE THREE MONTHS ENDED DECEMBER 31, 2009, 2008, AND 2007
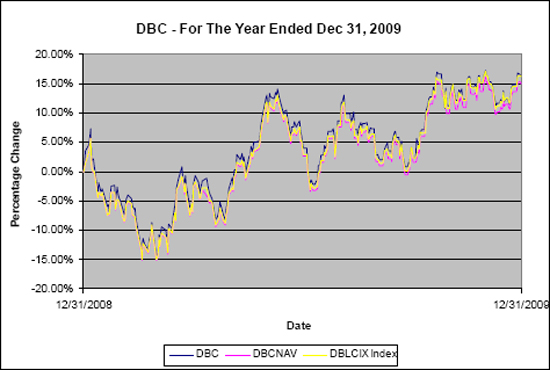
NEITHER THE PAST PERFORMANCE OF THE FUND NOR THE PRIOR INDEX LEVELS AND CHANGES,
POSITIVE OR NEGATIVE, SHOULD BE TAKEN AS AN INDICATION OF THE FUND’S FUTURE PERFORMANCE.
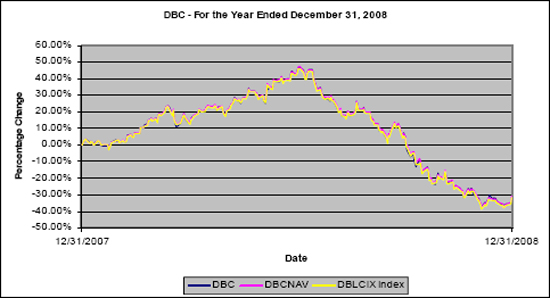
NEITHER THE PAST PERFORMANCE OF THE FUND NOR THE PRIOR INDEX LEVELS AND CHANGES,
POSITIVE OR NEGATIVE, SHOULD BE TAKEN AS AN INDICATION OF THE FUND’S FUTURE PERFORMANCE.
See Additional Legends Below
32
Table of Contents
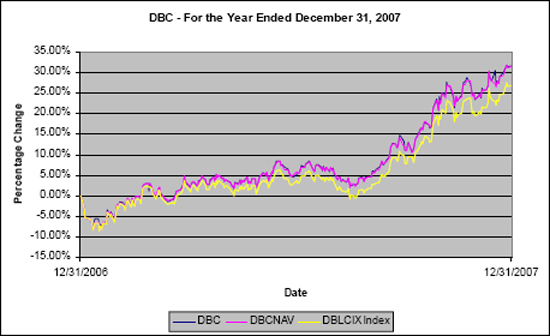
NEITHER THE PAST PERFORMANCE OF THE FUND NOR THE PRIOR INDEX LEVELS AND CHANGES,
POSITIVE OR NEGATIVE, SHOULD BE TAKEN AS AN INDICATION OF THE FUND’S FUTURE PERFORMANCE.
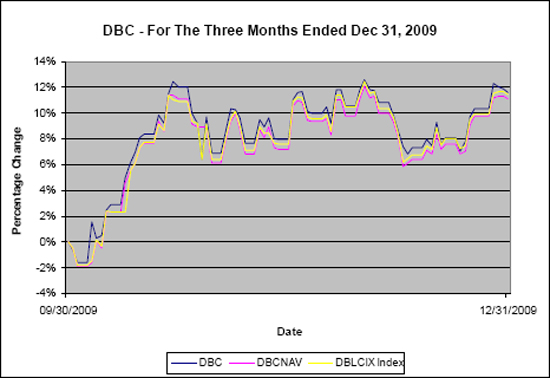
NEITHER THE PAST PERFORMANCE OF THE FUND NOR THE PRIOR INDEX LEVELS AND CHANGES,
POSITIVE OR NEGATIVE, SHOULD BE TAKEN AS AN INDICATION OF THE FUND’S FUTURE PERFORMANCE.
See Additional Legends Below
33
Table of Contents
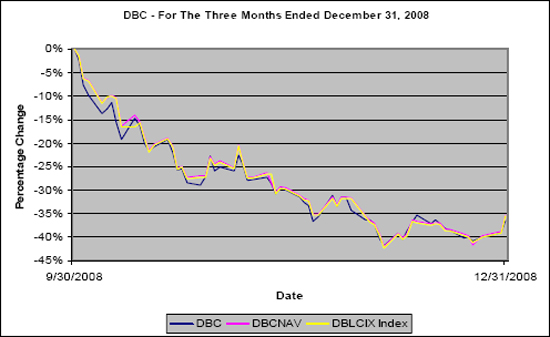
NEITHER THE PAST PERFORMANCE OF THE FUND NOR THE PRIOR INDEX LEVELS AND CHANGES,
POSITIVE OR NEGATIVE, SHOULD BE TAKEN AS AN INDICATION OF THE FUND’S FUTURE PERFORMANCE.
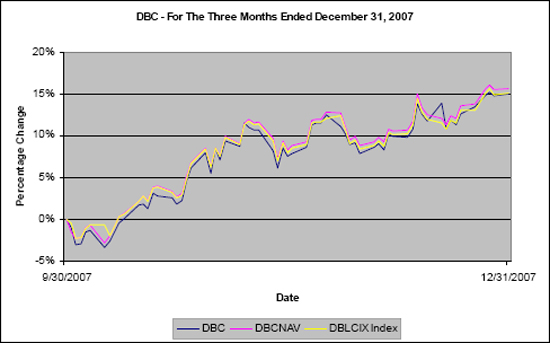
NEITHER THE PAST PERFORMANCE OF THE FUND NOR THE PRIOR INDEX LEVELS AND CHANGES,
POSITIVE OR NEGATIVE, SHOULD BE TAKEN AS AN INDICATION OF THE FUND’S FUTURE PERFORMANCE.
See Additional Legends Below
34
Table of Contents
Additional Legends
Deutsche Bank Liquid Commodity Index-Optimum Yield Diversified Excess Return™ is an index and does not reflect (i) actual trading and (ii) any fees or expenses. During the period from May 24, 2006 to October 16, 2009, the Master Fund invested with a view to tracking changes, whether positive or negative, in the level of the Deutsche Bank Liquid Commodity Index—Optimum Yield Excess Return™. The commodities comprising the Deutsche Bank Liquid Commodity Index—Optimum Yield Excess Return™ are Light Sweet Crude Oil (WTI), Heating Oil, Aluminum, Gold, Corn and Wheat. Commencing October 19, 2009, the Master Fund invested with a view to tracking changes, whether positive or negative, in the level of the Deutsche Bank Liquid Commodity Index-Optimum Yield Diversified Excess Return™ (the “Index”) over time, plus the excess, if any, of the Master Fund’s income from its holdings of United States Treasury Obligations and other high credit quality short-term fixed income securities over the expenses of the Fund and the Master Fund. The Index is intended to reflect the change in market value of certain commodities. The commodities comprising the Index are Light Sweet Crude Oil (WTI), Heating Oil, Aluminum, Gold, Corn, Wheat, Brent Crude, Copper Grade A, Natural Gas, RBOB Gasoline, Silver, Soybeans, Sugar and Zinc. Therefore, with respect to the above graph For the Year Ended December 31, 2009, DBLCIX reflects Deutsche Bank Liquid Commodity Index—Optimum Yield Excess Return™ from January 1, 2009 to the close of business on October 16, 2009, and DBLCIX reflects Deutsche Bank Liquid Commodity Index–Optimum Yield Diversified Excess Return™ from October 19, 2009 to the close of business on December 31, 2009. With respect to the above graphs For the Years Ended December 31, 2008 and 2007, DBLCIX reflects Deutsche Bank Liquid Commodity Index-Optimum Yield Excess Return™.
WHILE THE FUND’S OBJECTIVE IS NOT TO GENERATE PROFIT THROUGH ACTIVE PORTFOLIO MANAGEMENT, BUT IS TO TRACK THE INDEX, BECAUSE THE INDEX WAS ESTABLISHED IN JANUARY 2007, CERTAIN INFORMATION RELATING TO THE INDEX CLOSING LEVELS MAY BE CONSIDERED TO BE “HYPOTHETICAL.” HYPOTHETICAL INFORMATION MAY HAVE CERTAIN INHERENT LIMITATIONS, SOME OF WHICH ARE DESCRIBED BELOW.
WITH RESPECT TO INDEX DATA, NO REPRESENTATION IS BEING MADE THAT THE INDEX WILL OR IS LIKELY TO ACHIEVE ANNUAL OR CUMULATIVE CLOSING LEVELS CONSISTENT WITH OR SIMILAR TO THOSE SET FORTH HEREIN. SIMILARLY, NO REPRESENTATION IS BEING MADE THAT THE FUND WILL GENERATE PROFITS OR LOSSES SIMILAR TO THE FUND’S PAST PERFORMANCE OR THE HISTORICAL ANNUAL OR CUMULATIVE CHANGES IN THE INDEX CLOSING LEVELS. IN FACT, THERE ARE FREQUENTLY SHARP DIFFERENCES BETWEEN HYPOTHETICAL RESULTS AND THE ACTUAL RESULTS SUBSEQUENTLY ACHIEVED BY INVESTMENT METHODOLOGIES, WHETHER ACTIVE OR PASSIVE.
WITH RESPECT TO INDEX DATA, ONE OF THE LIMITATIONS OF HYPOTHETICAL INFORMATION IS THAT IT IS GENERALLY PREPARED WITH THE BENEFIT OF HINDSIGHT. TO THE EXTENT THAT INFORMATION PRESENTED HEREIN RELATES TO THE PERIOD SEPTEMBER 1997 THROUGH DECEMBER 2006, THE INDEX CLOSING LEVELS REFLECT THE APPLICATION OF THE INDEX METHODOLOGY, AND SELECTION OF INDEX COMMODITIES, IN HINDSIGHT.
NO HYPOTHETICAL RECORD CAN COMPLETELY ACCOUNT FOR THE IMPACT OF FINANCIAL RISK IN ACTUAL TRADING. FOR EXAMPLE, THERE ARE NUMEROUS FACTORS, INCLUDING THOSE DESCRIBED UNDER ITEM 1A: “RISK FACTORS” SET FORTH HEREIN, RELATED TO THE COMMODITIES MARKETS IN GENERAL OR TO THE IMPLEMENTATION OF THE FUND’S EFFORTS TO TRACK THE INDEX OVER TIME WHICH CANNOT BE, AND HAVE NOT BEEN, ACCOUNTED FOR IN THE PREPARATION OF THE INDEX INFORMATION SET FORTH ON THE FOLLOWING PAGES, ALL OF WHICH CAN ADVERSELY AFFECT ACTUAL PERFORMANCE RESULTS FOR THE FUND. FURTHERMORE, THE INDEX INFORMATION DOES NOT INVOLVE FINANCIAL RISK OR ACCOUNT FOR THE IMPACT OF FEES AND COSTS ASSOCIATED WITH THE FUND.
THE MANAGING OWNER, AN INDIRECT WHOLLY OWNED SUBSIDIARY OF DEUTSCHE BANK AG, COMMENCED OPERATIONS IN JANUARY 2006. AS MANAGING OWNER, THE MANAGING OWNER AND ITS TRADING PRINCIPALS HAVE BEEN MANAGING THE DAY-TO-DAY OPERATIONS FOR THE
35
Table of Contents
FUND AND RELATED PRODUCTS AND MANAGING FUTURES ACCOUNTS. BECAUSE THERE ARE LIMITED ACTUAL TRADING RESULTS TO COMPARE TO THE INDEX CLOSING LEVELS SET FORTH HEREIN, PROSPECTIVE INVESTORS SHOULD BE PARTICULARLY WARY OF PLACING UNDUE RELIANCE ON THE ANNUAL OR CUMULATIVE INDEX RESULTS.
FOR THE YEARS ENDED DECEMBER 31, 2009, 2008 AND 2007
Fund Share Price Performance
For the Year Ended December 31, 2009, the NYSE Arca market value of each Share increased 16.19% from $21.19 per Share to $24.62 per Share. The Share price low and high for the Year Ended December 31, 2009 and related change from the Share price from December 31, 2008 was as follows: Shares traded from a low of $18.15 per Share (-14.35%) on March 2, 2009 to a high of $24.84 per Share (+17.23%) on December 1, 2009. No distributions were paid to Shareholders during the Year Ended December 31, 2009. Therefore, the total return for the Fund, on a market value basis, was 16.19%.
For the Year Ended December 31, 2008, the NYSE Arca market value of each Share decreased 32.86% from $31.56 per Share to $21.19 per Share. The Share price high and low for the Year Ended December 31, 2008 and related change from the Share price from December 31, 2007 was as follows: Shares traded from a high of $46.44 per Share (+47.15%) on July 2, 2008 to a low of $19.69 per Share (-37.61%) on December 24, 2008. Therefore, the total return for the Fund, on a market value basis, was -31.78%, including the distribution noted below.
On December 30, 2008, the Fund made a $0.34 per Share distribution to Shareholders of record as of December 17, 2008.
For the Year Ended December 31, 2007, the NYSE Alternext market value of each Share increased 28.40% from $24.58 per Share to $31.56 per Share. The Share price high and low for the Year Ended December 31, 2007 and related change from the Share price from December 31, 2006 was as follows: Shares traded from a low of $22.61 per Share (-8.01%) on January 18, 2007 to a high of $31.99 per Share (+30.15%) on December 12, 2007. Therefore, the total return for the Fund, on a market value basis, was 31.49%, including the distribution noted below.
On December 28, 2007, the Fund made a $0.76 per Share distribution to Shareholders of record as of December 19, 2007.
Fund Share Net Asset Performance
For the Year Ended December 31, 2009, the net asset value of each Share increased 15.08% from $21.42 per Share to $24.65 per Share. Appreciation in futures contracts prices for Copper, Zinc, Sugar, RBOB Gasoline, Silver, Crude Oil, Brent Crude, Aluminum, Gold and Heating Oil during the Year Ended December 31, 2009 more than offset falling prices for Natural Gas, Wheat and Corn during that same period, contributing to an overall 27.87% increase in the level of the DBLCI–OY Diversified TR™.3 No distributions were paid to Shareholders during the Year Ended December 31, 2009. Therefore, the total return for the Fund on a net asset value basis was 15.08%.
Net income for the Year Ended December 31, 2009 was $481.1 million, resulting from $3.4 million of interest income, net realized losses of $410.3 million, net unrealized gains of $910.2 million and operating expenses of $22.2 million.
| 3 | As more fully detailed above, from May 24, 2006 to October 16, 2009, the Master Fund invested with a view to tracking changes, whether positive or negative, in the level of the Deutsche Bank Liquid Commodity Index—Optimum Yield Excess Return™. Commencing October 19, 2009, the Master Fund invested with a view to tracking changes, whether positive or negative, in the level of the Deutsche Bank Liquid Commodity Index—Optimum Yield Diversified Excess Return™. |
36
Table of Contents
For the Year Ended December 31, 2008, the net asset value of each Share decreased 31.91% from $31.46 per Share to $21.42 per Share. Falling futures contracts prices for crude oil, heating oil, aluminum, corn and wheat during the Year Ended December 31, 2008 more than offset appreciation in prices for gold during that same period, contributing to an overall 30.94% decrease in the level of the DBLCI-OYTR™. On December 30, 2008, the Fund made a $0.34 per Share distribution to Shareholders of record as of December 17, 2008. Therefore, the total return for the Fund on a net asset value basis, including the above noted distribution, was -30.83%.
Net loss for the Year Ended December 31, 2008 was $435.8 million, resulting from $35.9 million of interest income, net realized gains of $503.1 million, net unrealized losses of $959.1 million and operating expenses of $15.7 million.
For the Year Ended December 31, 2007, the net asset value of each Share increased 28.15% from $24.55 per Share to $31.46 per Share. Appreciation in futures contract prices for crude oil, heating oil, gold, corn and wheat during the Year Ended December 31, 2007 more than offset falling prices for aluminum during that same period, contributing to an overall 32.57% increase in the level of the DBLCI-OYTR™. On December 28, 2007, the Fund made a $0.76 per Share distribution to Shareholders of record as of December 19, 2007. Therefore, the total return for the Fund on a net asset value basis, including the distribution, was 31.24%.
Net income for the Year Ended December 31, 2007 was $330.3 million, resulting from $46.7 million of interest income, net realized loss of $13.1 million, net unrealized gains of $304.8 million and operating expenses of $8.1 million.
FOR THE THREE MONTHS ENDED DECEMBER 31, 2009, 2008 AND 2007
Fund Share Price Performance
For the Three Months Ended December 31, 2009, the NYSE Arca market value of each Share increased 11.60% from $22.06 per Share to $24.62 per Share. The Share price low and high for the Three Months Ended December 31, 2009 and related change from the Share price on September 30, 2009 was as follows: Shares traded from a low of $21.70 per Share (-1.63%) on October 2, 2009 to a high of $24.84 per Share (+12.60%) on December 1, 2009. No distributions were paid to Shareholders during the Year Ended December 31, 2009. Therefore, the total return for the Fund, on a market value basis, was 11.60%.
For the Three Months Ended December 31, 2008, the NYSE Arca market value of each Share decreased 37.47% from $33.89 per Share to $21.19 per Share. The Share price high and low for the Three Months Ended December 31, 2008 and related change from the Share price on September 30, 2008 was as follows: Shares traded from a high of $33.10 per Share (-2.33%) on October 1, 2008 to a low of $19.69 per Share (-41.90%) on December 24, 2008. Therefore, the total return for the Fund, on a market value basis including the below noted distribution, was -36.47%.
On December 30, 2008, the Fund made a $0.34 per Share distribution to Shareholders of record as of December 17, 2008.
For the Three Months Ended December 31, 2007, the NYSE Alternext market value of each Share increased 12.27% from $28.11 per Share to $31.56 per Share. The Share price high and low for the Three Months Ended December 31, 2007 and related change from the Share price on September 30, 2007 was as follows: Shares traded from a low of $27.17 per Share (-3.34%) on October 8, 2007 to a high of $31.99 per Share (+13.8%) on December 12, 2007. Therefore, the total return for the Fund, on a market value basis including the below noted distribution, was 14.98%.
On December 28, 2007, the Fund made a $0.76 per Share distribution to Shareholders of record as of December 19, 2007.
37
Table of Contents
Fund Share Net Asset Performance
For the Three Months Ended December 31, 2009, the net asset value of each Share increased 11.09% from $22.19 per Share to $24.65 per Share. Appreciation in futures contracts prices for Zinc, Copper, Aluminum, Corn, RBOB Gasoline, Crude Oil, Brent Crude, Wheat, Soybeans, Heating Oil, Sugar, Gold and Silver during the Three Months Ended December 31, 2009 more than offset falling futures contract prices for Natural Gas contributing to an overall 10.08% increase in the level of the DBLCI–OY Diversified TR™.4 No distributions were paid to Shareholders during the Year Ended December 31, 2009. Therefore, the total return for the Fund, on a net asset value basis, was 11.09%.
Net income for the Three Months Ended December 31, 2009 was $392.0 million, resulting from $0.8 million of interest income, net realized gains of $34.3 million, net unrealized gains of $365.4 million and operating expenses of $8.5 million.
For the Three Months Ended December 31, 2008, the net asset value of each Share decreased 36.27% from $33.61 per Share to $21.42 per Share. Falling futures contracts prices for crude oil, heating oil, aluminum, gold, corn and wheat during the Three Months Ended December 31, 2008 contributed to an overall 35.47% decrease in the level of the DBLCI-OYTR™. On December 30, 2008, the Fund made a $0.34 per Share distribution to Shareholders of record as of December 17, 2008. Therefore, the total return for the Fund on a net asset value basis, including the above noted distribution, was -35.26%.
Net loss for the Three Months Ended December 31, 2008 was $596.9 million, resulting from $3.0 million of interest income, net realized losses of $159.8 million, net unrealized losses of $437.7 million and operating expenses of $2.4 million.
For the Three Months Ended December 31, 2007, the net asset value of each Share increased 12.96% from $27.85 per Share to $31.46 per Share. Appreciation in the futures contracts prices of crude oil, heating oil, gold, corn and wheat during the Three Months Ended December 31, 2007 more than offset falling futures contract prices for aluminum during that same period, contributing to an overall 16.14% increase in the level of the DBLCI-OYTR™. On December 28, 2007, the Fund made a $0.76 per Share distribution to Shareholders of record as of December 19, 2007. Therefore, the total return for the Fund on a net asset value basis, including the above noted distribution, was 15.70%.
Net income for the Three Months Ended December 31, 2007 was $200.9 million, resulting from $13.6 million of interest income, net realized gains of $20.1 million, net unrealized gains of $169.7 million and operating expenses of $2.5 million.
Off-Balance Sheet Arrangements and Contractual Obligations
In the normal course of its business, the Master Fund is party to financial instruments with off-balance sheet risk. The term “off-balance sheet risk” refers to an unrecorded potential liability that, even though it does not appear on the balance sheet, may result in a future obligation or loss. The financial instruments used by the Master Fund are commodity futures, whose values are based upon an underlying asset and generally represent future commitments which have a reasonable possibility to be settled in cash or through physical delivery. The financial instruments are traded on an exchange and are standardized contracts.
The Fund and the Master Fund have not utilized, nor do they expect to utilize in the future, special purpose entities to facilitate off-balance sheet financing arrangements and have no loan guarantee arrangements or off-balance sheet arrangements of any kind, other than agreements entered into in the normal course of business noted above, which may include indemnification provisions related to certain risks service providers undertake in performing services which are in the best interests of the Fund and the Master Fund. While the Fund’s and the
| 4 | As more fully detailed above, from May 24, 2006 to October 16, 2009, the Master Fund invested with a view to tracking changes, whether positive or negative, in the level of the Deutsche Bank Liquid Commodity Index - Optimum Yield Excess Return™. Commencing October 19, 2009, the Master Fund invested with a view to tracking changes, whether positive or negative, in the level of the Deutsche Bank Liquid Commodity Index - Optimum Yield Diversified Excess Return™. |
38
Table of Contents
Master Fund’s exposure under such indemnification provisions cannot be estimated, these general business indemnifications are not expected to have a material impact on either the Fund’s or the Master Fund’s financial position.
The Fund and Master Fund’s contractual obligations are with the Managing Owner and the Commodity Broker. Management Fee payments made to the Managing Owner are calculated as a fixed percentage of the Master Fund’s net asset value. Commission payments to the Commodity Broker are on a contract-by-contract, or round-turn, basis. As such, the Managing Owner cannot anticipate the amount of payments that will be required under these arrangements for future periods as net asset values are not known until a future date. These agreements are effective for one year terms, renewable automatically for additional one year terms unless terminated. Additionally, these agreements may be terminated by either party for various reasons.
| ITEM 7A. | QUANTITATIVE AND QUALITATIVE DISCLOSURES ABOUT MARKET RISK |
INTRODUCTION
The Fund is designed to replicate positions in a commodity index. The market sensitive instruments held by it are subject to the risk of trading loss. Unlike an operating company, the risk of market sensitive instruments is integral, not incidental, to the Fund’s main line of business.
Market movements can produce frequent changes in the fair market value of the Fund’s open positions and, consequently, in its earnings and cash flow. The Fund’s market risk is primarily influenced by changes in the price of commodities.
Standard of Materiality
Materiality as used in this section, “Quantitative and Qualitative Disclosures About Market Risk,” is based on an assessment of reasonably possible market movements and the potential losses caused by such movements, taking into account the effects of margin, and any other multiplier features, as applicable, of the Fund’s market sensitive instruments.
QUANTIFYING THE FUND’S TRADING VALUE AT RISK
Quantitative Forward-Looking Statements
The following quantitative disclosures regarding the Fund’s market risk exposures contain “forward-looking statements” within the meaning of the safe harbor from civil liability provided for such statements by the Private Securities Litigation Reform Act of 1995 (set forth in Section 27A of the Securities Act of 1933 and Section 21E of the Securities Exchange Act of 1934). All quantitative disclosures in this section are deemed to be forward-looking statements for purposes of the safe harbor, except for statements of historical fact (such as the dollar amount of maintenance margin required for market risk sensitive instruments held at the end of the reporting period).
Value at risk (VaR) is a statistical measure of the value of losses that would not be expected to be exceeded over a given time horizon and at a given probability level arising from movement of underlying risk factors. Loss is measured as a decline in the fair value of the portfolio as a result of changes in any of the material variables by which fair values are determined. VaR is measured over a specified holding period (1 day) and to a specified level of statistical confidence (99th percentile). However, the inherent uncertainty in the markets in which the Fund trades and the recurrence in the markets traded by the Fund of market movements far exceeding expectations could result in actual trading or non-trading losses far beyond the indicated VaR or the Fund’s experience to date (i.e., “risk of ruin”). In light of this, as well as the risks and uncertainties intrinsic to all future projections, the inclusion of the quantification included in this section should not be considered to constitute any assurance or representation that the Fund’s losses in any market sector will be limited to VaR or by the Fund’s attempts to manage its market risk.
39
Table of Contents
THE FUND’S TRADING VALUE AT RISK
Commencing December 31, 2009 the Fund is reporting VaR computed using the actual historical market movements of the Fund’s total assets, as opposed to the previous methodology of using the historical market movements of the underlying futures contracts in connection with the Index Commodity only. Prior to the current reporting period, the historical market movements of the underlying futures contracts were used because the actual historical market movements of the Fund were not sufficient.
The following table indicates the trading VaR associated with the Fund’s total assets as of December 31, 2009.
| Description |
Total Assets | Daily Volatility | VaR* (99 Percentile) |
Number of times VaR Exceeded | |||||||
| PowerShares DB Commodity Index Tracking Fund |
$ | 4,390,954,240 | 1.66 | % | $ | 169,685,563 | 0 | ||||
| * | The VaR represents the one day downside risk, under normal market conditions, with a 99% confidence level. It is calculated using historical market moves of the Fund’s total assets and uses a one year look-back. |
The following table indicates the trading VaR associated with the Fund’s total assets as of December 31, 2008.
| Description |
Total Assets | Daily Volatility | VaR* (99 Percentile) |
Number of times VaR Exceeded | |||||||
| PowerShares DB Commodity Index Tracking Fund |
$ | 1,199,952,828 | 2.19 | % | $ | 61,326,782 | 16 | ||||
| * | The VaR represents the one day downside risk, under normal market conditions, with a 99% confidence level. It is calculated using historical market moves of the Fund’s total assets and uses a one year look-back. |
The following table indicates the trading VaR associated with the Fund’s open positions by market category as of December 31, 2008 as reported under the VaR methodology in effect until December 31, 2008.
| Market Sector |
Delivery Month | VaR $ Value* |
VaR* % of Net Assets |
Number of times VaR Exceeded | |||||
| Corn |
December 2009 | 8,458,411 | 0.71 | % | 8 | ||||
| WTI Crude Oil |
June 2009 | 33,189,511 | 2.77 | % | 11 | ||||
| Gold |
June 2009 | 5,485,483 | 0.46 | % | 9 | ||||
| Heating Oil |
May 2009 | 15,326,574 | 1.28 | % | 9 | ||||
| Aluminum |
November 2009 | 6,599,504 | 0.55 | % | 9 | ||||
| Wheat |
July 2009 | 9,917,241 | 0.83 | % | 9 | ||||
| Aggregate/Total |
61,867,926 | 5.16 | % | 9 |
| * | The VaR for a contract represents the one-day, downside risk, under normal market conditions, with a 99% confidence level. It is calculated using the variance/co-variance methodology taking historical market moves for the contract and using a one-year look-back. The aggregate VaR for the Fund represents the VaR of the Fund’s open positions across all contracts and is less than the sum of VaRs for each individual contract due to the diversification benefit across the contracts. |
40
Table of Contents
NON-TRADING RISK
The Fund has non-trading market risk as a result of investing in short-term United States Treasury Obligations. The market risk represented by these investments is expected to be immaterial.
QUALITATIVE DISCLOSURES REGARDING PRIMARY TRADING RISK EXPOSURES
The following qualitative disclosures regarding the Fund’s market risk exposures—except for those disclosures that are statements of historical fact—constitute forward-looking statements within the meaning of Section 27A of the Securities Act and Section 21E of the Securities Exchange Act. The Fund’s primary market risk exposures are subject to numerous uncertainties, contingencies and risks. Government interventions, defaults and expropriations, illiquid markets, the emergence of dominant fundamental factors, political upheavals, changes in historical price relationships, an influx of new market participants, increased regulation and many other factors could result in material losses as well as in material changes to the risk exposures of the Fund. There can be no assurance that the Fund’s current market exposure will not change materially. Investors may lose all or substantially all of their investment in the Fund.
The following were the primary trading risk exposures of the Fund as of December 31, 2009 by market sector.
ENERGY
Light Sweet Crude Oil
The price of light sweet crude oil is volatile and is affected by numerous factors. The level of global industrial activity influences the demand for light sweet crude oil. In addition, various other factors can affect the demand for light sweet crude oil, such as weather, political events and labor activity. The supply of light sweet crude oil can be affected by many events, in particular, the meetings of the Organization of Petroleum Exporting Countries. Market expectations about events that will influence either demand or supply can cause prices for light sweet crude oil to fluctuate greatly. A significant amount of the world oil production capacity is controlled by a relatively small number of producers. Any large change in production by one of these producers could have a substantial effect on the price of light sweet crude oil.
Heating Oil
The price of heating oil is volatile and is affected by numerous factors. The level of global industrial activity influences the demand for heating oil. In addition, the seasonal temperatures in countries throughout the world can also heavily influence the demand for heating oil. Heating oil is derived from crude oil and as such, any factors that influence the supply of crude oil may also influence the supply of heating oil.
Brent Crude Oil
The price of Brent crude oil is volatile and is affected by numerous factors. The price of Brent crude oil is influenced by many factors, including, but not limited to, the amount of output by oil producing nations, worldwide supply/stockpiles, weather, various geopolitical factors that cause supply disruptions (e.g., war, terrorism), global demand (particularly from emerging nations), currency fluctuations, and activities of market participants such as hedgers and speculators.
RBOB Gasoline
The price of RBOB Gasoline is volatile and is affected by numerous factors. The level of global industrial activity influences the demand for RBOB Gasoline. In addition, the demand has seasonal variations, which occur during “driving seasons” usually considered the summer months in North America and Europe. RBOB Gasoline is derived from crude oil and as such, any factors that influence the supply of crude oil may also influence the supply of RBOB Gasoline.
41
Table of Contents
Natural Gas
The price of natural gas is volatile and is affected by numerous factors. The level of global industrial activity influences the demand for natural gas. In addition to the seasonal temperatures in countries throughout the world, any fluctuations in temperature may also heavily influence the demand for natural gas.
METALS
Gold
The price of gold is volatile and is affected by numerous factors. Gold prices float freely in accordance with supply and demand. The price movement of gold may be influenced by a variety of factors, including announcements from central banks regarding reserve gold holdings, agreements among central banks, purchases and sales of gold by central banks, other governmental agencies that hold large supplies of gold, political uncertainties, economic concerns such as an increase or decrease in confidence in the global monetary system, the relative strength of the U.S. dollar, interest rates and numerous other factors. Gold prices may also be affected by industry factors such as industrial and jewelry demand.
Silver
The price of silver is volatile and is affected by numerous factors. The largest industrial users of silver (e.g., photographic, jewelry, and electronic industries) may influence its price. A change in economic conditions, such as a recession, can adversely affect industries which are dependent upon the use of silver. In turn, such a negative economic impact may decrease demand for silver, and, consequently, its price. Worldwide speculation and hedging activity by silver producers may also impact its price.
Aluminum
The price of aluminum is volatile. The price movement of aluminum may be influenced by a variety of factors, including the level of global industrial activity and demand, especially relating to the transportation, packaging and building sectors, each of which significantly influences the demand, and in turn, the price of aluminum. Prices for aluminum are influenced by a number of factors including the level of economic activity in large aluminum consuming markets, political uncertainties, economic concerns and the rate of supply of new metal from producers. The production of aluminum is a power intensive process that requires large amounts of inexpensive power. Disruptions in the amount of energy available to aluminum producers could affect the supply of aluminum.
Zinc
The price of zinc is volatile and is affected by numerous factors. The price of zinc is primarily affected by the global demand for and supply of zinc. Demand for zinc is significantly influenced by the level of global industrial economic activity. The galvanized steel industrial sector is particularly important given that the use of zinc in the manufacture of galvanized steel accounts for approximately 50% of world-wide zinc demand. The galvanized steel sector is in turn heavily dependent on the automobile and construction sectors. An additional, but highly volatile component of demand, is adjustments to inventory in response to changes in economic activity and/or pricing levels. The supply of zinc concentrate (the raw material) is dominated by China, Australia, North America and Latin America. The supply of zinc is also affected by current and previous price levels, which will influence investment decisions in new mines and smelters. It is not possible to predict the aggregate effect of all or any combination of these factors.
Copper
The price of copper is volatile. The price of copper is primarily affected by the global demand for and supply of copper. Demand for copper is significantly influenced by the level of global industrial economic activity. Industrial sectors which are particularly important include the electrical and construction sectors. In recent years demand has been supported by strong consumption from newly industrializing countries, which continue to be in a copper-intensive period of economic growth as they develop their infrastructure (such as China). An additional, but
42
Table of Contents
highly volatile, component of demand is adjustments to inventory in response to changes in economic activity and/or pricing levels. Apart from the United States, Canada and Australia, the majority of copper concentrate supply (the raw material) comes from outside the Organization for Economic Cooperation and Development countries. Chile is the largest producer of copper concentrate. In previous years, copper supply has been affected by strikes, financial problems and terrorist activity. Output has fallen particularly sharply in the “African Copperbelt” and in Bougainville, Papua New Guinea. Any political turmoil in these countries may cause copper supply to fall.
AGRICULTURAL
Corn
The price of corn is volatile. The price movement of corn may be influenced by three primary supply factors: farmer planting decisions, climate, and government agricultural policies and three major market demand factors: livestock feeding, shortages or surpluses of world grain supplies, and domestic and foreign government policies and trade agreements. Additionally, the price movement of corn may be influenced by a variety of other factors, including weather conditions, disease, transportation costs, political uncertainties and economic concerns.
Wheat
The price of wheat is volatile. The price movement of wheat may be influenced by three primary supply factors: farmer planting decisions, climate, and government agricultural policies and three major market demand factors: food, shortages or surpluses of world grain supplies, and domestic and foreign government policies and trade agreements. Additionally, the price movement of wheat may be influenced by a variety of other factors, including weather conditions, disease, transportation costs, political uncertainties and economic concerns.
Soybeans
The price of soybeans is volatile. The price movement of soybeans may be influenced by a variety of factors, including demand, weather conditions, disease, crop production, transportation costs, political uncertainties and economic concerns.
Sugar
The price of sugar is volatile. The price movement of sugar may be influenced by a variety of factors, including demand, weather conditions, disease, crop production, transportation costs, political uncertainties and economic concerns.
QUALITATIVE DISCLOSURES REGARDING NON-TRADING RISK EXPOSURE
General
The Fund is unaware of any (i) anticipated known demands, commitments or capital expenditures; (ii) material trends, favorable or unfavorable, in its capital resources; or (iii) trends or uncertainties that will have a material effect on operations.
QUALITATIVE DISCLOSURES REGARDING MEANS OF MANAGING RISK EXPOSURE
Under ordinary circumstances, the Managing Owner’s discretionary power is limited to determining whether the Fund will make a distribution. Under emergency or extraordinary circumstances, the Managing Owner’s discretionary powers increase, but remain circumscribed. These special circumstances, for example, include the unavailability of the Index or certain natural or man-made disasters. The Managing Owner does not apply risk management techniques. The Fund initiates positions only on the “long” side of the market and does not employ “stop-loss” techniques.
43
Table of Contents
| ITEM 8. | FINANCIAL STATEMENTS AND SUPPLEMENTARY DATA |
44
Table of Contents
Report of Management on Internal Control
Over Financial Reporting
Management of DB Commodity Services LLC, as managing owner (the “Managing Owner”) of PowerShares DB Commodity Index Tracking Fund and Subsidiary (the “Fund”), is responsible for establishing and maintaining adequate internal control over financial reporting, as defined under Rules 13a-15(f) and 15d-15(f) of the Securities Exchange Act of 1934, as amended (the “Exchange Act”). Internal control over financial reporting is a process designed to provide reasonable assurance regarding the reliability of financial reporting and the preparation of financial statements for external purposes in accordance with U.S. generally accepted accounting principles. Internal control over financial reporting includes those policies and procedures that: (1) pertain to the maintenance of records that, in reasonable detail, accurately and fairly reflect the transactions and dispositions of the assets of the Fund; (2) provide reasonable assurance that transactions are recorded as necessary to permit preparation of financial statements in accordance with generally accepted accounting principles, and that the Fund’s receipts and expenditures are being made only in accordance with appropriate authorizations of management; and (3) provide reasonable assurance regarding prevention or timely detection of unauthorized acquisition, use, or disposition of the Fund’s assets that could have a material effect on the financial statements.
Because of its inherent limitations, internal control over financial reporting may not prevent or detect misstatements, errors or fraud. Also, projections of any evaluation of effectiveness to future periods are subject to the risk that controls may become inadequate because of changes in conditions, or that the degree of compliance with the policies or procedures may deteriorate.
We, Hans Ephraimson, Chief Executive Officer, and Michael Gilligan, Principal Financial Officer of the Managing Owner, assessed the effectiveness of the Fund’s internal control over financial reporting as of December 31, 2009. In making this assessment, we used the criteria set forth by the Committee of Sponsoring Organizations of the Treadway Commission (“COSO”) in Internal Control—Integrated Framework. The assessment included an evaluation of the design of the Fund’s internal control over financial reporting and testing of the operational effectiveness of its internal control over financial reporting. Based on our assessment and those criteria, we have concluded that the Fund maintained effective internal control over financial reporting as of December 31, 2009.
The Fund’s independent registered public accounting firm, KPMG LLP, has audited the Fund’s internal control over financial reporting as of December 31, 2009, as stated in their report on page 47 of the Fund’s Annual Report on Form 10-K.
| By: | /S/ HANS EPHRAIMSON | |
| Name: | Hans Ephraimson | |
| Title: | Chief Executive Officer of | |
| the Managing Owner | ||
| By: | /S/ MICHAEL GILLIGAN | |
| Name: | Michael Gilligan | |
| Title: | Principal Financial Officer | |
| of the Managing Owner | ||
February 24, 2010
45
Table of Contents
Report of Management on Internal Control
Over Financial Reporting
Management of DB Commodity Services LLC, as managing owner (the “Managing Owner”) of DB Commodity Index Tracking Master Fund (the “Master Fund”), is responsible for establishing and maintaining adequate internal control over financial reporting, as defined under Rules 13a-15(f) and 15d-15(f) of the Securities Exchange Act of 1934, as amended (the “Exchange Act”). Internal control over financial reporting is a process designed to provide reasonable assurance regarding the reliability of financial reporting and the preparation of financial statements for external purposes in accordance with U.S. generally accepted accounting principles. Internal control over financial reporting includes those policies and procedures that: (1) pertain to the maintenance of records that, in reasonable detail, accurately and fairly reflect the transactions and dispositions of the assets of the Master Fund; (2) provide reasonable assurance that transactions are recorded as necessary to permit preparation of financial statements in accordance with generally accepted accounting principles, and that the Master Fund’s receipts and expenditures are being made only in accordance with appropriate authorizations of management; and (3) provide reasonable assurance regarding prevention or timely detection of unauthorized acquisition, use, or disposition of the Master Fund’s assets that could have a material effect on the financial statements.
Because of its inherent limitations, internal control over financial reporting may not prevent or detect misstatements, errors or fraud. Also, projections of any evaluation of effectiveness to future periods are subject to the risk that controls may become inadequate because of changes in conditions, or that the degree of compliance with the policies or procedures may deteriorate.
We, Hans Ephraimson, Chief Executive Officer, and Michael Gilligan, Principal Financial Officer of the Managing Owner, assessed the effectiveness of the Master Fund’s internal control over financial reporting as of December 31, 2009. In making this assessment, we used the criteria set forth by the Committee of Sponsoring Organizations of the Treadway Commission (“COSO”) in Internal Control—Integrated Framework. The assessment included an evaluation of the design of the Master Fund’s internal control over financial reporting and testing of the operational effectiveness of its internal control over financial reporting. Based on our assessment and those criteria, we have concluded that the Master Fund maintained effective internal control over financial reporting as of December 31, 2009.
The Master Fund’s independent registered public accounting firm, KPMG LLP, has audited the Master Fund’s internal control over financial reporting as of December 31, 2009, as stated in their report on page 48 of the Master Fund’s Annual Report on Form 10-K.
| By: | /S/ HANS EPHRAIMSON | |
| Name: | Hans Ephraimson | |
| Title: | Chief Executive Officer of | |
| the Managing Owner | ||
| By: | /S/ MICHAEL GILLIGAN | |
| Name: | Michael Gilligan | |
| Title: | Principal Financial Officer | |
| of the Managing Owner | ||
June 18, 2010
46
Table of Contents
Report of Independent Registered Public Accounting Firm
The Board of Managers of DB Commodity Services LLC, and
The Shareholders of PowerShares DB Commodity Index Tracking Fund and Subsidiary:
We have audited PowerShares DB Commodity Index Tracking Fund and Subsidiary’s (the Fund) internal control over financial reporting as of December 31, 2009, based on criteria established in Internal Control—Integrated Framework issued by the Committee of Sponsoring Organizations of the Treadway Commission (COSO). The Fund’s management is responsible for maintaining effective internal control over financial reporting and for its assessment of the effectiveness of internal control over financial reporting included in the accompanying Report of Management on Internal Control over Financial Reporting. Our responsibility is to express an opinion on the Fund’s internal control over financial reporting based on our audit.
We conducted our audit in accordance with the standards of the Public Company Accounting Oversight Board (United States). Those standards require that we plan and perform the audit to obtain reasonable assurance about whether effective internal control over financial reporting was maintained in all material respects. Our audit included obtaining an understanding of internal control over financial reporting, assessing the risk that a material weakness exists, and testing and evaluating the design and operating effectiveness of internal control based on the assessed risk. Our audit also included performing such other procedures as we considered necessary in the circumstances. We believe that our audit provides a reasonable basis for our opinion.
A company’s internal control over financial reporting is a process designed to provide reasonable assurance regarding the reliability of financial reporting and the preparation of financial statements for external purposes in accordance with generally accepted accounting principles. A company’s internal control over financial reporting includes those policies and procedures that (1) pertain to the maintenance of records that, in reasonable detail, accurately and fairly reflect the transactions and dispositions of the assets of the company; (2) provide reasonable assurance that transactions are recorded as necessary to permit preparation of financial statements in accordance with generally accepted accounting principles, and that receipts and expenditures of the company are being made only in accordance with authorizations of management and directors of the company; and (3) provide reasonable assurance regarding prevention or timely detection of unauthorized acquisition, use, or disposition of the company’s assets that could have a material effect on the financial statements.
Because of its inherent limitations, internal control over financial reporting may not prevent or detect misstatements. Also, projections of any evaluation of effectiveness to future periods are subject to the risk that controls may become inadequate because of changes in conditions, or that the degree of compliance with the policies or procedures may deteriorate.
In our opinion, PowerShares DB Commodity Index Tracking Fund and Subsidiary maintained, in all material respects, effective internal control over financial reporting as of December 31, 2009, based on criteria established in Internal Control—Integrated Framework issued by the Committee of Sponsoring Organizations of the Treadway Commission.
We also have audited, in accordance with the standards of the Public Company Accounting Oversight Board (United States), the consolidated statements of financial condition, including the consolidated schedules of investments of PowerShares DB Commodity Index Tracking Fund and Subsidiary as of December 31, 2009 and 2008, and the related consolidated statements of income and expenses, changes in shareholders’ equity, and cash flows for each of the years in the three-year period ended December 31, 2009 and our report dated February 24, 2010 expressed an unqualified opinion on those consolidated financial statements.
| /s/ KPMG LLP |
| New York, New York |
| February 24, 2010 |
47
Table of Contents
Report of Independent Registered Public Accounting Firm
The Board of Managers of DB Commodity Services LLC, and
The Unitholders of DB Commodity Index Tracking Master Fund:
We have audited DB Commodity Index Tracking Master Fund’s (the Master Fund) internal control over financial reporting as of December 31, 2009, based on criteria established in Internal Control—Integrated Framework issued by the Committee of Sponsoring Organizations of the Treadway Commission (COSO). The Master Fund’s management is responsible for maintaining effective internal control over financial reporting and for its assessment of the effectiveness of internal control over financial reporting, included in the accompanying Report of Management on Internal Control over Financial Reporting. Our responsibility is to express an opinion on the Master Fund’s internal control over financial reporting based on our audit.
We conducted our audit in accordance with the standards of the Public Company Accounting Oversight Board (United States). Those standards require that we plan and perform the audit to obtain reasonable assurance about whether effective internal control over financial reporting was maintained in all material respects. Our audit included obtaining an understanding of internal control over financial reporting, assessing the risk that a material weakness exists, and testing and evaluating the design and operating effectiveness of internal control based on the assessed risk. Our audit also included performing such other procedures as we considered necessary in the circumstances. We believe that our audit provides a reasonable basis for our opinion.
A company’s internal control over financial reporting is a process designed to provide reasonable assurance regarding the reliability of financial reporting and the preparation of financial statements for external purposes in accordance with generally accepted accounting principles. A company’s internal control over financial reporting includes those policies and procedures that (1) pertain to the maintenance of records that, in reasonable detail, accurately and fairly reflect the transactions and dispositions of the assets of the company; (2) provide reasonable assurance that transactions are recorded as necessary to permit preparation of financial statements in accordance with generally accepted accounting principles, and that receipts and expenditures of the company are being made only in accordance with authorizations of management and directors of the company; and (3) provide reasonable assurance regarding prevention or timely detection of unauthorized acquisition, use, or disposition of the company’s assets that could have a material effect on the financial statements.
Because of its inherent limitations, internal control over financial reporting may not prevent or detect misstatements. Also, projections of any evaluation of effectiveness to future periods are subject to the risk that controls may become inadequate because of changes in conditions, or that the degree of compliance with the policies or procedures may deteriorate.
In our opinion, DB Commodity Index Tracking Master Fund maintained, in all material respects, effective internal control over financial reporting as of December 31, 2009, based on criteria established in Internal Control—Integrated Framework issued by the Committee of Sponsoring Organizations of the Treadway Commission.
We also have audited, in accordance with the standards of the Public Company Accounting Oversight Board (United States), the statements of financial condition, including the schedules of investments of DB Commodity Index Tracking Master Fund as of December 31, 2009 and 2008, and the related statements of income and expenses, changes in unitholders’ equity, and cash flows for each of the years in the three-year period ended December 31, 2009, and our report dated June 18, 2010 expressed an unqualified opinion on those financial statements.
/s/ KPMG LLP
New York, New York
June 18, 2010
48
Table of Contents
Report of Independent Registered Public Accounting Firm
The Board of Managers of DB Commodity Services LLC, and
The Shareholders of PowerShares DB Commodity Index Tracking Fund and Subsidiary:
We have audited the accompanying consolidated statements of financial condition, including the consolidated schedules of investments of PowerShares DB Commodity Index Tracking Fund and Subsidiary (the Fund) as of December 31, 2009 and 2008, and the related consolidated statements of income and expenses, changes in shareholders’ equity, and cash flows for each of the years in the three-year period ended December 31, 2009. These consolidated financial statements are the responsibility of the Fund’s management. Our responsibility is to express an opinion on these consolidated financial statements based on our audits.
We conducted our audits in accordance with the standards of the Public Company Accounting Oversight Board (United States). Those standards require that we plan and perform the audit to obtain reasonable assurance about whether the financial statements are free of material misstatement. An audit includes examining, on a test basis, evidence supporting the amounts and disclosures in the financial statements. An audit also includes assessing the accounting principles used and significant estimates made by management, as well as evaluating the overall financial statement presentation. We believe that our audits provide a reasonable basis for our opinion.
In our opinion, the consolidated financial statements referred to above present fairly, in all material respects, the financial position of PowerShares DB Commodity Index Tracking Fund and Subsidiary as of December 31, 2009 and 2008, and the results of their operations and their cash flows for each of the years in the three-year period ended December 31, 2009 in conformity with U.S. generally accepted accounting principles.
We also have audited, in accordance with the standards of the Public Company Accounting Oversight Board (United States), PowerShares DB Commodity Index Tracking Fund and Subsidiary’s internal control over financial reporting as of December 31, 2009, based on criteria established in Internal Control—Integrated Framework issued by the Committee of Sponsoring Organizations of the Treadway Commission (COSO), and our report dated February 24, 2010 expressed an unqualified opinion on the effectiveness of the Fund’s internal control over financial reporting.
| /s/ KPMG LLP |
| New York, New York |
| February 24, 2010 |
49
Table of Contents
Report of Independent Registered Public Accounting Firm
The Board of Managers of DB Commodity Services LLC, and
The Unitholders of DB Commodity Index Tracking Master Fund:
We have audited the accompanying statements of financial condition, including the schedules of investments of DB Commodity Index Tracking Master Fund (the Master Fund) as of December 31, 2009 and 2008, and the related statements of income and expenses, changes in unitholders’ equity, and cash flows for each of the years in the three-year period ended December 31, 2009. These financial statements are the responsibility of the Master Fund’s management. Our responsibility is to express an opinion on these financial statements based on our audits.
We conducted our audits in accordance with the standards of the Public Company Accounting Oversight Board (United States). Those standards require that we plan and perform the audit to obtain reasonable assurance about whether the financial statements are free of material misstatement. An audit includes examining, on a test basis, evidence supporting the amounts and disclosures in the financial statements. An audit also includes assessing the accounting principles used and significant estimates made by management, as well as evaluating the overall financial statement presentation. We believe that our audits provide a reasonable basis for our opinion.
In our opinion, the financial statements referred to above present fairly, in all material respects, the financial position of DB Commodity Index Tracking Master Fund as of December 31, 2009 and 2008, and the results of its operations and its cash flows for each of the years in the three-year period ended December 31, 2009, in conformity with U.S. generally accepted accounting principles.
We also have audited, in accordance with the standards of the Public Company Accounting Oversight Board (United States), DB Commodity Index Tracking Master Fund’s internal control over financial reporting as of December 31, 2009, based on criteria established in Internal Control—Integrated Framework issued by the Committee of Sponsoring Organizations of the Treadway Commission (COSO), and our report dated June 18, 2010 expressed an unqualified opinion on the effectiveness of the Master Fund’s internal control over financial reporting.
/s/ KPMG LLP
New York, New York
June 18, 2010
50
Table of Contents
PowerShares DB Commodity Index Tracking Fund and Subsidiary
Consolidated Statements of Financial Condition
December 31, 2009 and 2008
| 2009 | 2008 | |||||||
| Assets |
||||||||
| Equity in broker trading accounts: |
||||||||
| United States Treasury Obligations, at fair value (cost $3,908,543,765 and $174,784,186, respectively) |
$ | 3,908,619,651 | $ | 174,793,945 | ||||
| Cash held by broker (restricted $18,424,838 and $0, respectively) |
261,006,845 | 1,713,943,642 | ||||||
| Net unrealized appreciation (depreciation) on futures contracts |
221,326,744 | (688,785,759 | ) | |||||
| Deposits with broker |
4,390,953,240 | 1,199,951,828 | ||||||
| Other assets |
1,000 | 1,000 | ||||||
| Total assets |
$ | 4,390,954,240 | $ | 1,199,952,828 | ||||
| Liabilities |
||||||||
| Payable to broker |
$ | 298,202 | $ | — | ||||
| Management fee payable |
2,685,593 | 689,981 | ||||||
| Brokerage fee payable |
16,000 | 15,910 | ||||||
| Total liabilities |
$ | 2,999,795 | $ | 705,891 | ||||
| Commitments and Contingencies (Note 9) |
||||||||
| Equity |
||||||||
| Shareholders’ equity |
||||||||
| General shares: |
||||||||
| Paid in capital - 40 shares issued and outstanding as of December 31, 2009 and 2008, respectively |
1,000 | 1,000 | ||||||
| Accumulated deficit |
(14 | ) | (143 | ) | ||||
| Total General shares |
986 | 857 | ||||||
| Shares: |
||||||||
| Paid in capital - 178,000,000 and 56,000,000 redeemable Shares issued and outstanding as of December 31, 2009 and 2008, respectively |
4,067,244,194 | 1,359,626,738 | ||||||
| Accumulated earnings (deficit) |
320,708,279 | (160,381,515 | ) | |||||
| Total Shares |
4,387,952,473 | 1,199,245,223 | ||||||
| Total shareholders’ equity |
4,387,953,459 | 1,199,246,080 | ||||||
| Non-controlling interest in consolidated subsidiary - related party |
986 | 857 | ||||||
| Total equity |
4,387,954,445 | 1,199,246,937 | ||||||
| Total liabilities and equity |
$ | 4,390,954,240 | $ | 1,199,952,828 | ||||
| Net asset value per share |
||||||||
| General shares |
$ | 24.65 | $ | 21.43 | ||||
| Shares |
$ | 24.65 | $ | 21.42 | ||||
See accompanying notes to consolidated financial statements.
51
Table of Contents
PowerShares DB Commodity Index Tracking Fund and Subsidiary
Consolidated Schedule of Investments
December 31, 2009
| Description |
Percentage of Net Assets |
Fair Value | Face Value | |||||||
| United States Treasury Obligations |
||||||||||
| U.S. Treasury Bills, 0.07% due January 7, 2010 |
19.55 | % | $ | 857,999,142 | $ | 858,000,000 | ||||
| U.S. Treasury Bills, 0.07% due January 14, 2010 |
4.30 | 188,498,869 | 188,500,000 | |||||||
| U.S. Treasury Bills, 0.005% due January 21, 2010 |
4.19 | 183,997,608 | 184,000,000 | |||||||
| U.S. Treasury Bills, 0.01% due January 28, 2010 |
4.02 | 176,296,298 | 176,300,000 | |||||||
| U.S. Treasury Bills, 0.025% due February 4, 2010 |
7.20 | 315,990,520 | 316,000,000 | |||||||
| U.S. Treasury Bills, 0.065% due February 11, 2010 |
10.21 | 447,983,424 | 448,000,000 | |||||||
| U.S. Treasury Bills, 0.065% due February 18, 2010 |
3.40 | 148,995,381 | 149,000,000 | |||||||
| U.S. Treasury Bills, 0.04% due February 25, 2010 |
10.37 | 454,972,245 | 455,000,000 | |||||||
| U.S. Treasury Bills, 0.06% due March 4, 2010 |
4.03 | 176,986,902 | 177,000,000 | |||||||
| U.S. Treasury Bills, 0.05% due March 11, 2010 |
5.58 | 244,979,910 | 245,000,000 | |||||||
| U.S. Treasury Bills, 0.04% due March 18, 2010 |
6.86 | 300,969,599 | 301,000,000 | |||||||
| U.S. Treasury Bills, 0.07% due March 25, 2010 |
5.20 | 227,976,288 | 228,000,000 | |||||||
| U.S. Treasury Bills, 0.11% due April 1, 2010 |
4.17 | 182,973,465 | 183,000,000 | |||||||
| Total United States Treasury Obligations (cost $3,908,543,765) |
89.08 | % | $ | 3,908,619,651 | ||||||
|
A portion of the above United States Treasury Obligations are held as initial margin against open futures contracts, as described in Note 4(e). | ||||||||||
| Description |
Percentage of Net Assets |
Fair Value | ||||||||
| Unrealized Appreciation/(Depreciation) on Futures Contracts |
||||||||||
| Aluminum (3,551 contracts, settlement date November 15, 2010) |
0.59 | % | $ | 25,927,112 | ||||||
| Brent Crude (6,396 contracts, settlement date September 15, 2010) |
(0.14 | ) | (6,316,870 | ) | ||||||
| Copper (1,105 contracts, settlement date March 15, 2010) |
0.48 | 21,158,863 | ||||||||
| Corn (3,739 contracts, settlement date March 12, 2010) |
0.13 | 5,759,262 | ||||||||
| Corn (5,938 contracts, settlement date December 14, 2010) |
0.08 | 3,574,425 | ||||||||
| RBOB Gasoline (6,088 contracts, settlement date October 29, 2010) |
(0.07 | ) | (3,068,079 | ) | ||||||
| Light Sweet Crude Oil (6,452 contracts, settlement date June 22, 2010) |
0.85 | 37,393,180 | ||||||||
| Gold (3,148 contracts, settlement date April 28, 2010) |
1.06 | 46,501,740 | ||||||||
| Heating Oil (5,883 contracts, settlement date May 28, 2010) |
1.27 | 55,661,768 | ||||||||
| Mill Wheat (1,712 contracts, settlement date March 10, 2010) |
0.00 | 70,428 | ||||||||
| Natural Gas (4,291 contracts, settlement date August 27, 2010) |
0.09 | 4,100,670 | ||||||||
| Red Wheat (3,054 contracts, settlement date July 14, 2010) |
(0.10 | ) | (4,464,038 | ) | ||||||
| Red Wheat (916 contracts, settlement date December 14, 2010) |
(0.02 | ) | (841,662 | ) | ||||||
| Silver (988 contracts, settlement date December 28, 2010) |
(0.06 | ) | (2,629,890 | ) | ||||||
| Soybean (2,859 contracts, settlement date November 12, 2010) |
0.12 | 5,052,775 | ||||||||
| Soybean (1,539 contracts, settlement date January 14, 2011) |
(0.05 | ) | (2,291,375 | ) | ||||||
| Soybean Meal (1,333 contracts, settlement date December 14, 2010) |
(0.02 | ) | (683,860 | ) | ||||||
| Soybean Oil (1,178 contracts, settlement date December 14, 2010) |
0.02 | 998,874 | ||||||||
| Sugar (10,939 contracts, settlement date June 30, 2010) |
0.65 | 28,316,926 | ||||||||
| Wheat (3,054 contracts, settlement date July 14, 2010) |
(0.41 | ) | (17,774,487 | ) | ||||||
| Wheat (916 contracts, settlement date December 14, 2010) |
0.01 | 482,413 | ||||||||
| Zinc (3,322 contracts, settlement date May 17, 2010) |
0.56 | 24,398,569 | ||||||||
| Net Unrealized Appreciation on Futures Contracts |
5.04 | % | $ | 221,326,744 | ||||||
Net unrealized appreciation is comprised of unrealized gains of $272,825,020 and unrealized losses of $51,498,276.
See accompanying notes to consolidated financial statements.
52
Table of Contents
PowerShares DB Commodity Index Tracking Fund and Subsidiary
Consolidated Schedule of Investments
December 31, 2008
| Description |
Percentage of Net Assets |
Fair Value | Face Value | |||||||
| United States Treasury Obligations |
||||||||||
| U.S. Treasury Bills, 0.95% due January 15, 2009 |
0.79 | % | $ | 9,499,953 | $ | 9,500,000 | ||||
| U.S. Treasury Bills, 0.65% due January 22, 2009 |
3.34 | 39,999,840 | 40,000,000 | |||||||
| U.S. Treasury Bills, 0.03% due January 29, 2009 |
1.78 | 21,299,531 | 21,300,000 | |||||||
| U.S. Treasury Bills, 0.53% due February 5, 2009 |
2.50 | 29,999,190 | 30,000,000 | |||||||
| U.S. Treasury Bills, 0.355% due February 12, 2009 |
0.75 | 8,999,712 | 9,000,000 | |||||||
| U.S. Treasury Bills, 0.15% due February 19, 2009 |
0.33 | 3,999,868 | 4,000,000 | |||||||
| U.S. Treasury Bills, 0.15% due February 26, 2009 |
2.00 | 23,998,944 | 24,000,000 | |||||||
| U.S. Treasury Bills, 0.005% due March 12, 2009 |
2.67 | 31,997,472 | 32,000,000 | |||||||
| U.S. Treasury Bills, 0.04% due March 26, 2009 |
0.42 | 4,999,435 | 5,000,000 | |||||||
| Total United States Treasury Obligations (cost $174,784,186) |
14.58 | % | $ | 174,793,945 | ||||||
|
A portion of the above United States Treasury Obligations are held as initial margin against open futures contracts, as described in Note 4(e) | ||||||||||
| Description |
Percentage of Net Assets |
Fair Value | ||||||||
| Unrealized Appreciation (Depreciation) on Futures Contracts |
||||||||||
| Aluminum (3,212 contracts, settlement date November 16, 2009) |
(4.50 | )% | $ | (54,038,632 | ) | |||||
| Corn (6,854 contracts, settlement date December 14, 2009) |
0.07 | 878,113 | ||||||||
| Light Sweet Crude Oil (7,022 contracts, settlement date June 22, 2009) |
(34.32 | ) | (411,542,490 | ) | ||||||
| Gold (1,823 contracts, settlement date June 26, 2009) |
1.64 | 19,647,490 | ||||||||
| Heating Oil (3,147 contracts, settlement date May 29, 2009) |
(16.39 | ) | (196,562,915 | ) | ||||||
| Wheat (5,413 contracts, settlement date July 14, 2009) |
(3.93 | ) | (47,167,325 | ) | ||||||
| Net Unrealized Depreciation on Futures Contracts |
(57.43 | )% | $ | (688,785,759 | ) | |||||
See accompanying notes to consolidated financial statements.
53
Table of Contents
PowerShares DB Commodity Index Tracking Fund and Subsidiary
Consolidated Statements of Income and Expenses
For the Years Ended December 31, 2009, 2008 and 2007
| 2009 | 2008 | 2007 | ||||||||||
| Income |
||||||||||||
| Interest Income, net |
$ | 3,427,808 | $ | 35,937,704 | $ | 46,678,838 | ||||||
| Expenses |
||||||||||||
| Management Fee |
20,523,877 | 15,177,543 | 7,698,410 | |||||||||
| Brokerage Commissions and Fees |
1,664,714 | 535,842 | 370,535 | |||||||||
| Total Expenses |
22,188,591 | 15,713,385 | 8,068,945 | |||||||||
| Net investment income (loss) |
(18,760,783 | ) | 20,224,319 | 38,609,893 | ||||||||
| Net Realized and Net Change in Unrealized Gain (Loss) on United States Treasury Obligations and Futures |
| |||||||||||
| Net Realized Gain (Loss) on |
||||||||||||
| United States Treasury Obligations |
(13,235 | ) | 942,701 | 14,134 | ||||||||
| Futures |
(410,314,560 | ) | 502,138,330 | (13,140,037 | ) | |||||||
| Net realized gain (loss) |
(410,327,795 | ) | 503,081,031 | (13,125,903 | ) | |||||||
| Net Change in Unrealized Gain (Loss) on |
||||||||||||
| United States Treasury Obligations |
66,127 | (367,061 | ) | 101,830 | ||||||||
| Futures |
910,112,503 | (958,724,150 | ) | 304,682,873 | ||||||||
| Net change in unrealized gain (loss) |
910,178,630 | (959,091,211 | ) | 304,784,703 | ||||||||
| Net realized and net change in unrealized gain (loss) on United States Treasury Obligations and Futures |
499,850,835 | (456,010,180 | ) | 291,658,800 | ||||||||
| Net Income (Loss) |
$ | 481,090,052 | $ | (435,785,861 | ) | $ | 330,268,693 | |||||
| Less: net (income) loss attributed to the non-controlling interest in consolidated subsidiary - related party |
(129 | ) | 143 | — | ||||||||
| Net Income (Loss) Attributable to PowerShares DB Commodity Index Tracking Fund and Subsidiary |
$ | 481,089,923 | $ | (435,785,718 | ) | $ | 330,268,693 | |||||
See accompanying notes to consolidated financial statements.
54
Table of Contents
PowerShares DB Commodity Index Tracking Fund and Subsidiary
Consolidated Statement of Changes in Shareholders’ Equity
For the Year Ended December 31, 2009
| General Shares | Shares | |||||||||||||||||||||||||||||||||||||||
| Shares | Paid in Capital |
Accumulated Earnings (Deficit) |
Total Equity | Shares | Paid in Capital |
Accumulated Earnings (Deficit) |
Total Equity | Total Shareholders’ Equity |
Non-controlling Interest |
Total Equity | ||||||||||||||||||||||||||||||
| Balance at January 1, 2009 |
40 | $ | 1,000 | $ | (143 | ) | $ | 857 | 56,000,000 | $ | 1,359,626,738 | $ | (160,381,515 | ) | $ | 1,199,245,223 | $ | 1,199,246,080 | $ | 857 | $ | 1,199,246,937 | ||||||||||||||||||
| Sale of Shares |
130,000,000 | 2,882,078,200 | 2,882,078,200 | 2,882,078,200 | 2,882,078,200 | |||||||||||||||||||||||||||||||||||
| Redemption of Shares |
(8,000,000 | ) | (174,460,744 | ) | (174,460,744 | ) | (174,460,744 | ) | (174,460,744 | ) | ||||||||||||||||||||||||||||||
| Net Income |
||||||||||||||||||||||||||||||||||||||||
| Net investment loss |
(7 | ) | (7 | ) | (18,760,769 | ) | (18,760,769 | ) | (18,760,776 | ) | (7 | ) | (18,760,783 | ) | ||||||||||||||||||||||||||
| Net realized loss on United States Treasury Obligations and Futures |
(155 | ) | (155 | ) | (410,327,485 | ) | (410,327,485 | ) | (410,327,640 | ) | (155 | ) | (410,327,795 | ) | ||||||||||||||||||||||||||
| Net change in unrealized gain on United States Treasury Obligations and Futures |
291 | 291 | 910,178,048 | 910,178,048 | 910,178,339 | 291 | 910,178,630 | |||||||||||||||||||||||||||||||||
| Net Income |
129 | 129 | 481,089,794 | 481,089,794 | 481,089,923 | 129 | 481,090,052 | |||||||||||||||||||||||||||||||||
| Balance at December 31, 2009 |
40 | $ | 1,000 | $ | (14 | ) | $ | 986 | 178,000,000 | $ | 4,067,244,194 | $ | 320,708,279 | $ | 4,387,952,473 | $ | 4,387,953,459 | $ | 986 | $ | 4,387,954,445 | |||||||||||||||||||
See accompanying notes to consolidated financial statements.
55
Table of Contents
PowerShares DB Commodity Index Tracking Fund and Subsidiary
Consolidated Statement of Changes in Shareholders’ Equity
For the Year Ended December 31, 2008
| General Shares | Shares | |||||||||||||||||||||||||||||||||||||||
| Shares | Paid in Capital |
Accumulated Earnings (Deficit) |
Total Equity | Shares | Paid in Capital |
Accumulated Earnings (Deficit) |
Total Equity | Total Shareholders’ Equity |
Non-controlling Interest |
Total Equity | ||||||||||||||||||||||||||||||
| Balance at January 1, 2008 |
40 | $ | 1,000 | $ | 259 | $ | 1,259 | 49,000,000 | $ | 1,248,525,348 | $ | 293,151,815 | $ | 1,541,677,163 | $ | 1,541,678,422 | $ | 1,000 | $ | 1,541,679,422 | ||||||||||||||||||||
| Sale of Shares |
37,000,000 | 1,213,064,042 | 1,213,064,042 | 1,213,064,042 | 1,213,064,042 | |||||||||||||||||||||||||||||||||||
| Redemption of Shares |
(30,000,000 | ) | (1,101,962,652 | ) | (1,101,962,652 | ) | (1,101,962,652 | ) | (1,101,962,652 | ) | ||||||||||||||||||||||||||||||
| Net Loss |
||||||||||||||||||||||||||||||||||||||||
| Net investment income |
15 | 15 | 20,224,279 | 20,224,279 | 20,224,294 | 25 | 20,224,319 | |||||||||||||||||||||||||||||||||
| Net realized gain on United States Treasury Obligations and Futures |
280 | 280 | 503,080,437 | 503,080,437 | 503,080,717 | 314 | 503,081,031 | |||||||||||||||||||||||||||||||||
| Net change in unrealized loss on United States Treasury Obligations and Futures |
(683 | ) | (683 | ) | (959,090,046 | ) | (959,090,046 | ) | (959,090,729 | ) | (482 | ) | (959,091,211 | ) | ||||||||||||||||||||||||||
| Net Loss |
(388 | ) | (388 | ) | (435,785,330 | ) | (435,785,330 | ) | (435,785,718 | ) | (143 | ) | (435,785,861 | ) | ||||||||||||||||||||||||||
| Distributions of net investment income ($0.34 per Share) |
(14 | ) | (14 | ) | (17,748,000 | ) | (17,748,000 | ) | (17,748,014 | ) | — | (17,748,014 | ) | |||||||||||||||||||||||||||
| Balance at December 31, 2008 |
40 | $ | 1,000 | $ | (143 | ) | $ | 857 | 56,000,000 | $ | 1,359,626,738 | $ | (160,381,515 | ) | $ | 1,199,245,223 | $ | 1,199,246,080 | $ | 857 | $ | 1,199,246,937 | ||||||||||||||||||
See accompanying notes to consolidated financial statements.
56
Table of Contents
PowerShares DB Commodity Index Tracking Fund and Subsidiary
Consolidated Statement of Changes in Shareholders’ Equity
For the Year Ended December 31, 2007
| General Shares | Shares | ||||||||||||||||||||||||||||||||||||||
| Shares | Paid in Capital |
Accumulated Earnings |
Total Equity | Shares | Paid in Capital |
Accumulated Earnings |
Total Equity | Total Shareholders’ Equity |
Non-controlling Interest |
Total Equity | |||||||||||||||||||||||||||||
| Balance at January 1, 2007 |
40 | $ | 1,000 | $ | (18 | ) | $ | 982 | 29,000,000 | $ | 712,388,314 | $ | (484,571 | ) | $ | 711,903,743 | $ | 711,904,725 | $ | 1,000 | $ | 711,905,725 | |||||||||||||||||
| Sale of Shares |
22,600,000 | 610,932,754 | 610,932,754 | 610,932,754 | 610,932,754 | ||||||||||||||||||||||||||||||||||
| Redemption of Shares |
(2,600,000 | ) | (74,795,720 | ) | (74,795,720 | ) | (74,795,720 | ) | (74,795,720 | ) | |||||||||||||||||||||||||||||
| Net Income |
|||||||||||||||||||||||||||||||||||||||
| Net investment income |
42 | 42 | 38,609,851 | 38,609,851 | 38,609,893 | 38,609,893 | |||||||||||||||||||||||||||||||||
| Net realized loss on United States Treasury Obligations and Futures |
(21 | ) | (21 | ) | (13,125,882 | ) | (13,125,882 | ) | (13,125,903 | ) | (13,125,903 | ) | |||||||||||||||||||||||||||
| Net change in unrealized gain on United States Treasury Obligations and Futures |
286 | 286 | 304,784,417 | 304,784,417 | 304,784,703 | 304,784,703 | |||||||||||||||||||||||||||||||||
| Net Income |
307 | 307 | 330,268,386 | 330,268,386 | 330,268,693 | — | 330,268,693 | ||||||||||||||||||||||||||||||||
| Distributions of net investment income ($0.76 per Share) |
(30 | ) | (30 | ) | (36,632,000 | ) | (36,632,000 | ) | (36,632,030 | ) | — | (36,632,030 | ) | ||||||||||||||||||||||||||
| Balance at December 31, 2007 |
40 | $ | 1,000 | $ | 259 | $ | 1,259 | 49,000,000 | $ | 1,248,525,348 | $ | 293,151,815 | $ | 1,541,677,163 | $ | 1,541,678,422 | $ | 1,000 | $ | 1,541,679,422 | |||||||||||||||||||
See accompanying notes to consolidated financial statements.
57
Table of Contents
PowerShares DB Commodity Index Tracking Fund and Subsidiary
Consolidated Statements of Cash Flows
For the Years Ended December 31, 2009, 2008 and 2007
| 2009 | 2008 | 2007 | ||||||||||
| Cash flow provided by and (used for) operating activities: |
||||||||||||
| Net Income (Loss) |
$ | 481,090,052 | $ | (435,785,861 | ) | $ | 330,268,693 | |||||
| Adjustments to reconcile net income (loss) to net cash provided by (used for) operating activities: |
||||||||||||
| Cost of securities purchased |
(11,955,501,698 | ) | (7,617,679,825 | ) | (4,525,600,705 | ) | ||||||
| Proceeds from securities sold and matured |
8,225,164,456 | 8,950,428,075 | 3,801,982,498 | |||||||||
| Net accretion of discount on United States Treasury Obligations |
(3,435,572 | ) | (34,612,996 | ) | (45,737,166 | ) | ||||||
| Net realized (gain) loss on United States Treasury Obligations |
13,235 | (942,701 | ) | (14,134 | ) | |||||||
| Net change in unrealized (gain) loss on United States Treasury Obligations and futures |
(910,178,630 | ) | 959,091,211 | (304,784,703 | ) | |||||||
| (Increase) decrease in restricted cash |
(18,424,838 | ) | 130,678 | 1,509,982 | ||||||||
| Change in operating receivables and liabilities: |
||||||||||||
| Receivable for Shares issued |
— | 6,292,540 | (6,292,540 | ) | ||||||||
| Payable for securities purchased |
— | (5,956,083 | ) | 5,956,083 | ||||||||
| Payable to broker |
298,202 | (200,008,381 | ) | 200,008,381 | ||||||||
| Management fee payable |
1,995,612 | (253,980 | ) | 489,681 | ||||||||
| Brokerage fee payable |
90 | (112,411 | ) | 128,321 | ||||||||
| Net cash provided by and (used for) operating activities |
(4,178,979,091 | ) | 1,620,590,266 | (542,085,609 | ) | |||||||
| Cash flows from financing activities: |
||||||||||||
| Proceeds from sale of Shares |
2,882,078,200 | 1,213,064,042 | 610,932,754 | |||||||||
| Redemption of Shares |
(174,460,744 | ) | (1,101,962,652 | ) | (74,795,720 | ) | ||||||
| Cash distributions paid on Shares and General Shares |
— | (17,748,014 | ) | (36,632,030 | ) | |||||||
| Net cash provided by financing activities |
2,707,617,456 | 93,353,376 | 499,505,004 | |||||||||
| Net change in cash held by broker |
(1,471,361,635 | ) | 1,713,943,642 | (42,580,605 | ) | |||||||
| Unrestricted cash held by broker at beginning of period |
1,713,943,642 | — | 42,580,605 | |||||||||
| Unrestricted cash held by broker at end of period |
$ | 242,582,007 | $ | 1,713,943,642 | $ | — | ||||||
See accompanying notes to consolidated financial statements.
58
Table of Contents
DB Commodity Index Tracking Master Fund
(A majority owned subsidiary of PowerShares DB Commodity Index Tracking Fund)
Statements of Financial Condition
December 31, 2009 and 2008
| 2009 | 2008 | |||||||
| Assets |
||||||||
| Equity in broker trading accounts: |
||||||||
| United States Treasury Obligations, at fair value (cost $3,908,543,765 and $174,784,186, respectively) |
$ | 3,908,619,651 | $ | 174,793,945 | ||||
| Cash held by broker (restricted $18,424,838 and $0, respectively) |
261,006,845 | 1,713,943,642 | ||||||
| Net unrealized appreciation (depreciation) on futures contracts |
221,326,744 | (688,785,759 | ) | |||||
| Deposits with broker |
4,390,953,240 | 1,199,951,828 | ||||||
| Other assets |
1,000 | 1,000 | ||||||
| Total assets |
$ | 4,390,954,240 | $ | 1,199,952,828 | ||||
| Liabilities |
||||||||
| Payable to broker |
$ | 298,202 | $ | — | ||||
| Management fee payable |
2,685,593 | 689,981 | ||||||
| Brokerage fee payable |
16,000 | 15,910 | ||||||
| Total liabilities |
$ | 2,999,795 | $ | 705,891 | ||||
| Commitments and Contingencies (Note 9) |
||||||||
| Equity |
||||||||
| Unitholders’ equity |
||||||||
| General units: |
||||||||
| Paid in capital - 80 units issued and outstanding as of December 31, 2009 and 2008, respectively |
2,000 | 2,000 | ||||||
| Accumulated deficit |
(28 | ) | (286 | ) | ||||
| Total General units |
1,972 | 1,714 | ||||||
| Units: |
||||||||
| Paid in capital - 178,000,000 and 56,000,000 redeemable Units issued and outstanding as of December 31, 2009 and 2008, respectively |
4,067,244,194 | 1,359,626,738 | ||||||
| Accumulated earnings (deficit) |
320,708,279 | (160,381,515 | ) | |||||
| Total Units |
4,387,952,473 | 1,199,245,223 | ||||||
| Total unitholders’ equity |
4,387,954,445 | 1,199,246,937 | ||||||
| Total liabilities and equity |
$ | 4,390,954,240 | $ | 1,199,952,828 | ||||
| Net asset value per unit |
||||||||
| General units |
$ | 24.65 | $ | 21.43 | ||||
| Units |
$ | 24.65 | $ | 21.42 | ||||
See accompanying notes to consolidated financial statements.
59
Table of Contents
DB Commodity Index Tracking Master Fund
(A majority owned subsidiary of PowerShares DB Commodity Index Tracking Fund)
Schedule of Investments
December 31, 2009
| Description |
Percentage of Net Assets |
Fair Value | Face Value | |||||||
| United States Treasury Obligations |
||||||||||
| U.S. Treasury Bills, 0.07% due January 7, 2010 |
19.55 | % | $ | 857,999,142 | $ | 858,000,000 | ||||
| U.S. Treasury Bills, 0.07% due January 14, 2010 |
4.30 | 188,498,869 | 188,500,000 | |||||||
| U.S. Treasury Bills, 0.005% due January 21, 2010 |
4.19 | 183,997,608 | 184,000,000 | |||||||
| U.S. Treasury Bills, 0.01% due January 28, 2010 |
4.02 | 176,296,298 | 176,300,000 | |||||||
| U.S. Treasury Bills, 0.025% due February 4, 2010 |
7.20 | 315,990,520 | 316,000,000 | |||||||
| U.S. Treasury Bills, 0.065% due February 11, 2010 |
10.21 | 447,983,424 | 448,000,000 | |||||||
| U.S. Treasury Bills, 0.065% due February 18, 2010 |
3.40 | 148,995,381 | 149,000,000 | |||||||
| U.S. Treasury Bills, 0.04% due February 25, 2010 |
10.37 | 454,972,245 | 455,000,000 | |||||||
| U.S. Treasury Bills, 0.06% due March 4, 2010 |
4.03 | 176,986,902 | 177,000,000 | |||||||
| U.S. Treasury Bills, 0.05% due March 11, 2010 |
5.58 | 244,979,910 | 245,000,000 | |||||||
| U.S. Treasury Bills, 0.04% due March 18, 2010 |
6.86 | 300,969,599 | 301,000,000 | |||||||
| U.S. Treasury Bills, 0.07% due March 25, 2010 |
5.20 | 227,976,288 | 228,000,000 | |||||||
| U.S. Treasury Bills, 0.11% due April 1, 2010 |
4.17 | 182,973,465 | 183,000,000 | |||||||
| Total United States Treasury Obligations (cost $3,908,543,765) |
89.08 | % | $ | 3,908,619,651 | ||||||
|
A portion of the above United States Treasury Obligations are held as initial margin against open futures contracts, as described in Note 4(e). | ||||||||||
| Description |
Percentage of Net Assets |
Fair Value | ||||||||
| Unrealized Appreciation/(Depreciation) on Futures Contracts |
||||||||||
| Aluminum (3,551 contracts, settlement date November 15, 2010) |
0.59 | % | $ | 25,927,112 | ||||||
| Brent Crude (6,396 contracts, settlement date September 15, 2010) |
(0.14 | ) | (6,316,870 | ) | ||||||
| Copper (1,105 contracts, settlement date March 15, 2010) |
0.48 | 21,158,863 | ||||||||
| Corn (3,739 contracts, settlement date March 12, 2010) |
0.13 | 5,759,262 | ||||||||
| Corn (5,938 contracts, settlement date December 14, 2010) |
0.08 | 3,574,425 | ||||||||
| RBOB Gasoline (6,088 contracts, settlement date October 29, 2010) |
(0.07 | ) | (3,068,079 | ) | ||||||
| Light Sweet Crude Oil (6,452 contracts, settlement date June 22, 2010) |
0.85 | 37,393,180 | ||||||||
| Gold (3,148 contracts, settlement date April 28, 2010) |
1.06 | 46,501,740 | ||||||||
| Heating Oil (5,883 contracts, settlement date May 28, 2010) |
1.27 | 55,661,768 | ||||||||
| Mill Wheat (1,712 contracts, settlement date March 10, 2010) |
0.00 | 70,428 | ||||||||
| Natural Gas (4,291 contracts, settlement date August 27, 2010) |
0.09 | 4,100,670 | ||||||||
| Red Wheat (3,054 contracts, settlement date July 14, 2010) |
(0.10 | ) | (4,464,038 | ) | ||||||
| Red Wheat (916 contracts, settlement date December 14, 2010) |
(0.02 | ) | (841,662 | ) | ||||||
| Silver (988 contracts, settlement date December 28, 2010) |
(0.06 | ) | (2,629,890 | ) | ||||||
| Soybean (2,859 contracts, settlement date November 12, 2010) |
0.12 | 5,052,775 | ||||||||
| Soybean (1,539 contracts, settlement date January 14, 2011) |
(0.05 | ) | (2,291,375 | ) | ||||||
| Soybean Meal (1,333 contracts, settlement date December 14, 2010) |
(0.02 | ) | (683,860 | ) | ||||||
| Soybean Oil (1,178 contracts, settlement date December 14, 2010) |
0.02 | 998,874 | ||||||||
| Sugar (10,939 contracts, settlement date June 30, 2010) |
0.65 | 28,316,926 | ||||||||
| Wheat (3,054 contracts, settlement date July 14, 2010) |
(0.41 | ) | (17,774,487 | ) | ||||||
| Wheat (916 contracts, settlement date December 14, 2010) |
0.01 | 482,413 | ||||||||
| Zinc (3,322 contracts, settlement date May 17, 2010) |
0.56 | 24,398,569 | ||||||||
| Net Unrealized Appreciation on Futures Contracts |
5.04 | % | $ | 221,326,744 | ||||||
Net unrealized appreciation is comprised of unrealized gains of $272,825,020 and unrealized losses of $51,498,276.
See accompanying notes to consolidated financial statements.
60
Table of Contents
DB Commodity Index Tracking Master Fund
(A majority owned subsidiary of PowerShares DB Commodity Index Tracking Fund)
Schedule of Investments
December 31, 2008
| Description |
Percentage of Net Assets |
Fair Value | Face Value | |||||||
| United States Treasury Obligations |
||||||||||
| U.S. Treasury Bills, 0.95% due January 15, 2009 |
0.79 | % | $ | 9,499,953 | $ | 9,500,000 | ||||
| U.S. Treasury Bills, 0.65% due January 22, 2009 |
3.34 | 39,999,840 | 40,000,000 | |||||||
| U.S. Treasury Bills, 0.03% due January 29, 2009 |
1.78 | 21,299,531 | 21,300,000 | |||||||
| U.S. Treasury Bills, 0.53% due February 5, 2009 |
2.50 | 29,999,190 | 30,000,000 | |||||||
| U.S. Treasury Bills, 0.355% due February 12, 2009 |
0.75 | 8,999,712 | 9,000,000 | |||||||
| U.S. Treasury Bills, 0.15% due February 19, 2009 |
0.33 | 3,999,868 | 4,000,000 | |||||||
| U.S. Treasury Bills, 0.15% due February 26, 2009 |
2.00 | 23,998,944 | 24,000,000 | |||||||
| U.S. Treasury Bills, 0.005% due March 12, 2009 |
2.67 | 31,997,472 | 32,000,000 | |||||||
| U.S. Treasury Bills, 0.04% due March 26, 2009 |
0.42 | 4,999,435 | 5,000,000 | |||||||
| Total United States Treasury Obligations (cost $174,784,186) |
14.58 | % | $ | 174,793,945 | ||||||
|
A portion of the above United States Treasury Obligations are held as initial margin against open futures contracts, as described in Note 4(e) | ||||||||||
| Description |
Percentage of Net Assets |
Fair Value | ||||||||
| Unrealized Appreciation (Depreciation) on Futures Contracts |
||||||||||
| Aluminum (3,212 contracts, settlement date November 16, 2009) |
(4.50 | )% | $ | (54,038,632 | ) | |||||
| Corn (6,854 contracts, settlement date December 14, 2009) |
0.07 | 878,113 | ||||||||
| Light Sweet Crude Oil (7,022 contracts, settlement date June 22, 2009) |
(34.32 | ) | (411,542,490 | ) | ||||||
| Gold (1,823 contracts, settlement date June 26, 2009) |
1.64 | 19,647,490 | ||||||||
| Heating Oil (3,147 contracts, settlement date May 29, 2009) |
(16.39 | ) | (196,562,915 | ) | ||||||
| Wheat (5,413 contracts, settlement date July 14, 2009) |
(3.93 | ) | (47,167,325 | ) | ||||||
| Net Unrealized Depreciation on Futures Contracts |
(57.43 | )% | $ | (688,785,759 | ) | |||||
See accompanying notes to consolidated financial statements.
61
Table of Contents
DB Commodity Index Tracking Master Fund
(A majority owned subsidiary of PowerShares DB Commodity Index Tracking Fund)
Statements of Income and Expenses
For the Years Ended December 31, 2009, 2008 and 2007
| 2009 | 2008 | 2007 | ||||||||||
| Income |
||||||||||||
| Interest Income, net |
$ | 3,427,808 | $ | 35,937,704 | $ | 46,678,838 | ||||||
| Expenses |
||||||||||||
| Management Fee |
20,523,877 | 15,177,543 | 7,698,410 | |||||||||
| Brokerage Commissions and Fees |
1,664,714 | 535,842 | 370,535 | |||||||||
| Total Expenses |
22,188,591 | 15,713,385 | 8,068,945 | |||||||||
| Net investment income (loss) |
(18,760,783 | ) | 20,224,319 | 38,609,893 | ||||||||
| Net Realized and Net Change in Unrealized Gain (Loss) on United States Treasury Obligations and Futures |
| |||||||||||
| Net Realized Gain (Loss) on |
||||||||||||
| United States Treasury Obligations |
(13,235 | ) | 942,701 | 14,134 | ||||||||
| Futures |
(410,314,560 | ) | 502,138,330 | (13,140,037 | ) | |||||||
| Net realized gain (loss) |
(410,327,795 | ) | 503,081,031 | (13,125,903 | ) | |||||||
| Net Change in Unrealized Gain (Loss) on |
||||||||||||
| United States Treasury Obligations |
66,127 | (367,061 | ) | 101,830 | ||||||||
| Futures |
910,112,503 | (958,724,150 | ) | 304,682,873 | ||||||||
| Net change in unrealized gain (loss) |
910,178,630 | (959,091,211 | ) | 304,784,703 | ||||||||
| Net realized and net change in unrealized gain (loss) on United States Treasury Obligations and Futures |
499,850,835 | (456,010,180 | ) | 291,658,800 | ||||||||
| Net Income (Loss) |
$ | 481,090,052 | $ | (435,785,861 | ) | $ | 330,268,693 | |||||
See accompanying notes to consolidated financial statements.
62
Table of Contents
DB Commodity Index Tracking Master Fund
(A majority owned subsidiary of PowerShares DB Commodity Index Tracking Fund)
Statement of Changes in Unitholders’ Equity
For the Year Ended December 31, 2009
| General Units | Units | |||||||||||||||||||||||||||||||
| Units | Paid in Capital |
Accumulated Earnings (Deficit) |
Total Equity | Units | Paid in Capital |
Accumulated Earnings (Deficit) |
Total Equity | Total Unitholders’ Equity |
||||||||||||||||||||||||
| Balance at January 1, 2009 |
80 | $ | 2,000 | $ | (286 | ) | $ | 1,714 | 56,000,000 | $ | 1,359,626,738 | $ | (160,381,515 | ) | $ | 1,199,245,223 | $ | 1,199,246,937 | ||||||||||||||
| Sale of Units |
130,000,000 | 2,882,078,200 | 2,882,078,200 | 2,882,078,200 | ||||||||||||||||||||||||||||
| Redemption of Units |
(8,000,000 | ) | (174,460,744 | ) | (174,460,744 | ) | (174,460,744 | ) | ||||||||||||||||||||||||
| Net Income |
||||||||||||||||||||||||||||||||
| Net investment loss |
(14 | ) | (14 | ) | (18,760,769 | ) | (18,760,769 | ) | (18,760,783 | ) | ||||||||||||||||||||||
| Net realized loss on United States Treasury Obligations and Futures |
(310 | ) | (310 | ) | (410,327,485 | ) | (410,327,485 | ) | (410,327,795 | ) | ||||||||||||||||||||||
| Net change in unrealized gain on United States Treasury Obligations and Futures |
582 | 582 | 910,178,048 | 910,178,048 | 910,178,630 | |||||||||||||||||||||||||||
| Net Income |
258 | 258 | 481,089,794 | 481,089,794 | 481,090,052 | |||||||||||||||||||||||||||
| Balance at December 31, 2009 |
80 | $ | 2,000 | $ | (28 | ) | $ | 1,972 | 178,000,000 | $ | 4,067,244,194 | $ | 320,708,279 | $ | 4,387,952,473 | $ | 4,387,954,445 | |||||||||||||||
See accompanying notes to consolidated financial statements.
63
Table of Contents
DB Commodity Index Tracking Master Fund
(A majority owned subsidiary of PowerShares DB Commodity Index Tracking Fund)
Statement of Changes in Unitholders’ Equity
For the Year Ended December 31, 2008
| General Units | Units | |||||||||||||||||||||||||||||||
| Units | Paid in Capital |
Accumulated Earnings (Deficit) |
Total Equity | Units | Paid in Capital |
Accumulated Earnings (Deficit) |
Total Equity | Total Unitholders’ Equity |
||||||||||||||||||||||||
| Balance at January 1, 2008 |
80 | $ | 2,000 | $ | 259 | $ | 2,259 | 49,000,000 | $ | 1,248,525,348 | $ | 293,151,815 | $ | 1,541,677,163 | $ | 1,541,679,422 | ||||||||||||||||
| Sale of Units |
37,000,000 | 1,213,064,042 | 1,213,064,042 | 1,213,064,042 | ||||||||||||||||||||||||||||
| Redemption of Units |
(30,000,000 | ) | (1,101,962,652 | ) | (1,101,962,652 | ) | (1,101,962,652 | ) | ||||||||||||||||||||||||
| Net Loss |
||||||||||||||||||||||||||||||||
| Net investment income |
40 | 40 | 20,224,279 | 20,224,279 | 20,224,319 | |||||||||||||||||||||||||||
| Net realized gain on United States Treasury Obligations and Futures |
594 | 594 | 503,080,437 | 503,080,437 | 503,081,031 | |||||||||||||||||||||||||||
| Net change in unrealized loss on United States Treasury Obligations and Futures |
(1,165 | ) | (1,165 | ) | (959,090,046 | ) | (959,090,046 | ) | (959,091,211 | ) | ||||||||||||||||||||||
| Net Loss |
(531 | ) | (531 | ) | (435,785,330 | ) | (435,785,330 | ) | (435,785,861 | ) | ||||||||||||||||||||||
| Distributions of net investment income |
(14 | ) | (14 | ) | (17,748,000 | ) | (17,748,000 | ) | (17,748,014 | ) | ||||||||||||||||||||||
| Balance at December 31, 2008 |
80 | $ | 2,000 | $ | (286 | ) | $ | 1,714 | 56,000,000 | $ | 1,359,626,738 | $ | (160,381,515 | ) | $ | 1,199,245,223 | $ | 1,199,246,937 | ||||||||||||||
See accompanying notes to consolidated financial statements.
64
Table of Contents
DB Commodity Index Tracking Master Fund
(A majority owned subsidiary of PowerShares DB Commodity Index Tracking Fund)
Statement of Changes in Unitholders’ Equity
For the Year Ended December 31, 2007
| General Units | Units | |||||||||||||||||||||||||||||||
| Units | Paid in Capital |
Accumulated Earnings |
Total Equity | Units | Paid in Capital |
Accumulated Earnings |
Total Equity | Total Unitholders’ Equity |
||||||||||||||||||||||||
| Balance at January 1, 2007 |
80 | $ | 2,000 | $ | (18 | ) | $ | 1,982 | 29,000,000 | $ | 712,388,314 | $ | (484,571 | ) | $ | 711,903,743 | $ | 711,905,725 | ||||||||||||||
| Sale of Units |
22,600,000 | 610,932,754 | 610,932,754 | 610,932,754 | ||||||||||||||||||||||||||||
| Redemption of Units |
(2,600,000 | ) | (74,795,720 | ) | (74,795,720 | ) | (74,795,720 | ) | ||||||||||||||||||||||||
| Net Income |
||||||||||||||||||||||||||||||||
| Net investment income |
42 | 42 | 38,609,851 | 38,609,851 | 38,609,893 | |||||||||||||||||||||||||||
| Net realized loss on United States Treasury Obligations and Futures |
(21 | ) | (21 | ) | (13,125,882 | ) | (13,125,882 | ) | (13,125,903 | ) | ||||||||||||||||||||||
| Net change in unrealized gain on United States Treasury Obligations and Futures |
286 | 286 | 304,784,417 | 304,784,417 | 304,784,703 | |||||||||||||||||||||||||||
| Net Income |
307 | 307 | 330,268,386 | 330,268,386 | 330,268,693 | |||||||||||||||||||||||||||
| Distributions of net investment income |
(30 | ) | (30 | ) | (36,632,000 | ) | (36,632,000 | ) | (36,632,030 | ) | ||||||||||||||||||||||
| Balance at December 31, 2007 |
80 | $ | 2,000 | $ | 259 | $ | 2,259 | 49,000,000 | $ | 1,248,525,348 | $ | 293,151,815 | $ | 1,541,677,163 | $ | 1,541,679,422 | ||||||||||||||||
See accompanying notes to consolidated financial statements.
65
Table of Contents
DB Commodity Index Tracking Master Fund
(A majority owned subsidiary of PowerShares DB Commodity Index Tracking Fund)
Statements of Cash Flows
For the Years Ended December 31, 2009, 2008 and 2007
| 2009 | 2008 | 2007 | ||||||||||
| Cash flow provided by and (used for) operating activities: |
||||||||||||
| Net Income (Loss) |
$ | 481,090,052 | $ | (435,785,861 | ) | $ | 330,268,693 | |||||
| Adjustments to reconcile net income (loss) to net cash provided by (used for) operating activities: |
||||||||||||
| Cost of securities purchased |
(11,955,501,698 | ) | (7,617,679,825 | ) | (4,525,600,705 | ) | ||||||
| Proceeds from securities sold and matured |
8,225,164,456 | 8,950,428,075 | 3,801,982,498 | |||||||||
| Net accretion of discount on United States Treasury Obligations |
(3,435,572 | ) | (34,612,996 | ) | (45,737,166 | ) | ||||||
| Net realized (gain) loss on United States Treasury Obligations |
13,235 | (942,701 | ) | (14,134 | ) | |||||||
| Net change in unrealized (gain) loss on United States Treasury Obligations and futures |
(910,178,630 | ) | 959,091,211 | (304,784,703 | ) | |||||||
| (Increase) decrease in restricted cash |
(18,424,838 | ) | 130,678 | 1,509,982 | ||||||||
| Change in operating receivables and liabilities: |
||||||||||||
| Receivable for Units issued |
— | 6,292,540 | (6,292,540 | ) | ||||||||
| Payable for securities purchased |
— | (5,956,083 | ) | 5,956,083 | ||||||||
| Payable to broker |
298,202 | (200,008,381 | ) | 200,008,381 | ||||||||
| Management fee payable |
1,995,612 | (253,980 | ) | 489,681 | ||||||||
| Brokerage fee payable |
90 | (112,411 | ) | 128,321 | ||||||||
| Net cash provided by and (used for) operating activities |
(4,178,979,091 | ) | 1,620,590,266 | (542,085,609 | ) | |||||||
| Cash flows from financing activities: |
||||||||||||
| Proceeds from sale of Units |
2,882,078,200 | 1,213,064,042 | 610,932,754 | |||||||||
| Redemption of Units |
(174,460,744 | ) | (1,101,962,652 | ) | (74,795,720 | ) | ||||||
| Cash distributions paid on Units and General Units |
— | (17,748,014 | ) | (36,632,030 | ) | |||||||
| Net cash provided by financing activities |
2,707,617,456 | 93,353,376 | 499,505,004 | |||||||||
| Net change in cash held by broker |
(1,471,361,635 | ) | 1,713,943,642 | (42,580,605 | ) | |||||||
| Unrestricted cash held by broker at beginning of period |
1,713,943,642 | — | 42,580,605 | |||||||||
| Unrestricted cash held by broker at end of period |
$ | 242,582,007 | $ | 1,713,943,642 | $ | — | ||||||
See accompanying notes to consolidated financial statements.
66
Table of Contents
PowerShares DB Commodity Index Tracking Fund and Subsidiary
Notes to Consolidated Financial Statements
December 31, 2009
(1) Organization
PowerShares DB Commodity Index Tracking Fund (the “Fund”; “Fund” may also refer to the Fund and the Master Fund, collectively, as the context requires) and its subsidiary, DB Commodity Index Tracking Master Fund (the “Master Fund”), were formed as Delaware statutory trusts on May 23, 2005. DB Commodity Services LLC, a Delaware Limited Liability Company (“DBCS” or the “Managing Owner”), funded both the Fund and the Master Fund with a capital contribution of $1,000 to each fund in exchange for 40 General Shares of the Fund and 40 General Units of the Master Fund. The Fund was originally named “DB Commodity Index Tracking Fund”. The Fund changed its name to “PowerShares DB Commodity Index Tracking Fund” effective August 10, 2006. The fiscal year end of the Fund is December 31st. The term of the Fund is perpetual (unless terminated earlier in certain circumstances) as provided in the Amended and Restated Declaration of Trust and Trust Agreement of the Fund and the Master Fund (each a “Trust Agreement”, and collectively, the “Trust Agreements”).
The Fund offers common units of beneficial interest (the “Shares”) only to certain eligible financial institutions (the “Authorized Participants”) in one or more blocks of 200,000 Shares, called a Basket. The proceeds from the offering of Shares are invested in the Master Fund. The Fund and the Master Fund commenced investment operations on January 31, 2006. The Fund commenced trading on the American Stock Exchange (now known as the NYSE Alternext US LLC (the “NYSE Alternext”)) on February 3, 2006 and, as of November 25, 2008, is listed on the NYSE Arca, Inc. (the “NYSE Arca”).
This Report covers the years ended December 31, 2009, 2008 and 2007 (herein referred to, as the “Year Ended December 31, 2009”, the “Year Ended December 31, 2008” and the “Year Ended December 31, 2007”, respectively).
Separate financial statements of the Master Fund are presented to comply with SEC reporting requirements as the Master Fund is a separate SEC registrant. The Master Fund is wholly-owned by the Fund and the Managing Owner.
Unless otherwise indicated, the notes to the consolidated financial statements apply to both the Fund and the Master Fund.
(2) Fund Investment Overview
During the period from May 24, 2006 to October 16, 2009, the Master Fund invested with a view to tracking changes, whether positive or negative, in the level of the Deutsche Bank Liquid Commodity Index—Optimum Yield Excess Return™ over time, plus the excess, if any, of the Master Fund’s income from its holdings of United States Treasury Obligations and other high credit quality short-term fixed income securities over the expenses of the Fund and the Master Fund. The commodities comprising the Deutsche Bank Liquid Commodity Index—Optimum Yield Excess Return™ are Light Sweet Crude Oil, Heating Oil, Aluminum, Gold, Corn and Wheat. Commencing October 19, 2009, the Master Fund invested with a view to tracking changes, whether positive or negative, in the level of the Deutsche Bank Liquid Commodity Index-Optimum Yield Diversified Excess Return™ (the “Index”) over time, plus the excess, if any, of the Master Fund’s income from its holdings of United States Treasury Obligations and other high credit quality short-term fixed income securities over the expenses of the Fund and the Master Fund.
The Index is intended to reflect the change in market value of certain commodities. The commodities comprising the Index are Light Sweet Crude Oil, Heating Oil, Aluminum, Gold, Corn, Wheat, Brent Crude, Copper Grade A, Natural Gas, RBOB Gasoline, Silver, Soybeans, Sugar and Zinc (the “Index Commodities”). The Master Fund holds United States Treasury Obligations and other high credit quality short-term fixed income securities for deposit with the Master Fund’s commodity broker as margin. The Commodity Futures Trading Commission (the “CFTC”) and commodity exchanges impose position limits on market participants trading in certain commodities included in the Index. The Index is comprised of futures contracts on the Index Commodities that expire in a specific month and trade on a specific exchange (the “Index Contracts”). As disclosed in the Fund’s Prospectus, if the Managing Owner determines in its commercially reasonable judgment that it has become impracticable or inefficient for any reason for the Master Fund to gain full or partial exposure to any Index Commodity by investing in a specific Index Contract, the Master Fund may invest in a futures contract referencing the particular Index Commodity other than the Index Contract or, in the alternative, invest in other futures contracts not based on the particular Index Commodity if, in the commercially reasonable judgment of the Managing Owner, such futures contracts tend to exhibit trading prices that correlate with such Index Commodity. Because the Master Fund is
67
Table of Contents
PowerShares DB Commodity Index Tracking Fund and Subsidiary
Notes to Consolidated Financial Statements—(Continued)
December 31, 2009
approaching or has reached position limits with respect to certain futures contracts comprising the Index, the Master Fund has commenced investing in other futures contracts based on commodities that comprise the Fund’s Index and in futures contracts based on commodities other than commodities that comprise the Fund’s Index.
The Fund does not employ leverage. As of December 31, 2009 and 2008, the Fund had $4,390,953,240 (or 100%) and $1,199,951,828 (or 100%), respectively, of its holdings of cash, United States Treasury Obligations and unrealized appreciation/depreciation of futures contracts on deposit with its Commodity Broker. Of this, $288,167,861 (or 6.56%) and $154,620,803 (or 12.88%) of the Fund’s holdings of cash and United States Treasury Obligations are required to be deposited as margin in support of the Fund’s long futures positions as of December 31, 2009 and 2008, respectively. For additional information, please see the audited Consolidated Schedule of Investments as of December 31, 2009 and 2008 for a breakdown of the Fund’s portfolio holdings.
DBLCI™ and Deutsche Bank Liquid Commodity Index™ are trademarks of Deutsche Bank AG London (the “Index Sponsor”). Trademark applications in the United States are pending with respect to both the Fund and the Index. The Fund and the Master Fund have been licensed by the Index Sponsor to use the above noted trademarks. Deutsche Bank AG London is an affiliate of the Fund, the Master Fund and the Managing Owner.
(3) Service Providers and Related Party Agreements
The Trustee
Under the Trust Agreements, Wilmington Trust Company, the trustee of the Fund and Master Fund (the “Trustee”), has delegated to the Managing Owner the exclusive management and control of all aspects of the business of the Fund and the Master Fund. The Trustee will have no duty or liability to supervise or monitor the performance of the Managing Owner, nor will the Trustee have any liability for the acts or omissions of the Managing Owner.
The Managing Owner
The Managing Owner serves the Fund and Master Fund as commodity pool operator, commodity trading advisor, and managing owner, and is an indirect wholly-owned subsidiary of Deutsche Bank AG. During the Year Ended December 31, 2009, the Fund and Master Fund incurred Management Fees of $20,523,877, of which $2,685,593 was payable at December 31, 2009. During the Year Ended December 31, 2008, the Fund and Master Fund incurred Management Fees of $15,177,543, of which $689,981 was payable at December 31, 2008. During the Year Ended December 31, 2007, the Fund and Master Fund incurred Management Fees of $7,698,410.
The Commodity Broker
Deutsche Bank Securities Inc., a Delaware corporation, serves as the Master Fund’s clearing broker (the “Commodity Broker”). The Commodity Broker is an indirect wholly-owned subsidiary of Deutsche Bank AG and is an affiliate of the Managing Owner. In its capacity as clearing broker, the Commodity Broker executes and clears each of the Master Fund’s futures transactions and performs certain administrative and custodial services for the Master Fund. As custodian of the Master Fund’s assets, the Commodity Broker is responsible, among other things, for providing periodic accountings of all dealings and actions taken by the Master Fund during the reporting period, together with an accounting of all securities, cash or other indebtedness or obligations held by it or its nominees for or on behalf of the Master Fund. During the Year Ended December 31, 2009, the Fund and Master Fund incurred brokerage fees of $1,664,714, of which $16,000 is payable at December 31, 2009. During the Year Ended December 31, 2008, the Fund and Master Fund incurred brokerage fees of $535,842, of which $15,910 is payable at December 31, 2008. During the Year Ended December 31, 2007, the Fund and Master Fund incurred brokerage fees of $370,535.
The Administrator
The Bank of New York Mellon (the “Administrator”) has been appointed by the Managing Owner as the administrator, custodian and transfer agent of the Master Fund and the Fund, and has entered into separate administrative, custodian, transfer agency and service agreements (collectively referred to as the “Administration Agreement”).
68
Table of Contents
PowerShares DB Commodity Index Tracking Fund and Subsidiary
Notes to Consolidated Financial Statements—(Continued)
December 31, 2009
Pursuant to the Administration Agreement, the Administrator performs or supervises the performance of services necessary for the operation and administration of the Fund and the Master Fund (other than making investment decisions), including receiving and processing orders from Authorized Participants to create and redeem Baskets, net asset value calculations, accounting and other fund administrative services. The Administrator retains certain financial books and records, including: Basket creation and redemption books and records, fund accounting records, ledgers with respect to assets, liabilities, capital, income and expenses, the registrar, transfer journals and related details, and trading and related documents received from futures commission merchants.
The Distributor
ALPS Distributors, Inc. (the “Distributor”) provides certain distribution services to the Fund. Pursuant to the Distribution Services Agreement between the Managing Owner in its capacity as managing owner of the Fund and the Distributor, the Distributor assists the Managing Owner and the Administrator with certain functions and duties relating to distribution and marketing services to the Fund including reviewing and approving marketing materials.
Invesco Powershares Capital Management LLC
Under the License Agreement among Invesco Powershares Capital Management LLC (the “Licensor”), and the Managing Owner in its own capacity and in its capacity as managing owner of the Fund (the Fund and the Managing Owner, collectively, the “Licensees”), the Licensor granted to each Licensee a non-exclusive license to use the “PowerShares®” trademark (the “Trademark”) anywhere in the world, solely in connection with the marketing and promotion of the Fund and to use or refer to the Trademark in connection with the issuance and trading of the Fund as necessary.
Invesco Aim Distributors, Inc.
Through a marketing agreement between the Managing Owner and Invesco Aim Distributors, Inc. (“Invesco Aim Distributors”), an affiliate of Invesco PowerShares Capital Management LLC (“Invesco PowerShares”), the Managing Owner, on behalf of the Fund and the Master Fund, has appointed Invesco Aim Distributors as a marketing agent. Invesco Aim Distributors assists the Managing Owner and the Administrator with certain functions and duties such as providing various educational and marketing activities regarding the Fund, primarily in the secondary trading market, which activities include, but are not limited to, communicating the Fund’s name, characteristics, uses, benefits, and risks, consistent with the prospectus. Invesco Aim Distributors will not open or maintain customer accounts or handle orders for the Fund. Invesco Aim Distributors engages in public seminars, road shows, conferences, media interviews, and distributes sales literature and other communications (including electronic media) regarding the Fund.
(4) Summary of Significant Accounting Policies
(a) Basis of Presentation and Consolidation
The consolidated financial statements of the Fund have been prepared using U.S. generally accepted accounting principles, and they include the consolidated financial statement balances of the Fund and the Master Fund. Upon the initial offering of the Shares on January 31, 2006, the capital raised by the Fund was used to purchase 100% of the common units of beneficial interest of the Master Fund (the “Master Fund Limited Units”) (excluding common units of beneficial interest of the Master Fund held by the Managing Owner (the “Master Fund General Units”)). The Master Fund Limited Units owned by the Fund provide the Fund and its investors certain controlling rights and abilities over the Master Fund. Consequently, the financial statement balances of the Master Fund have been consolidated with the Fund’s financial statement balances and all significant inter-company balances and transactions have been eliminated. Separate financial statements of the Master Fund are presented to comply with SEC reporting requirements as the Master Fund is a separate SEC registrant. Certain amounts in the 2008 and 2007 financial statements have been reclassified to conform to the 2009 presentation.
69
Table of Contents
PowerShares DB Commodity Index Tracking Fund and Subsidiary
Notes to Consolidated Financial Statements—(Continued)
December 31, 2009
(b) Use of Estimates
The preparation of the consolidated financial statements in conformity with U.S. generally accepted accounting principles requires management to make estimates and assumptions that affect the reported amounts of assets and liabilities, revenues and expenses and related disclosure of contingent assets and liabilities during the reporting period of the consolidated financial statements and accompanying notes. Actual results could differ from those estimates.
(c) Financial Instruments and Fair Value
United States Treasury Obligations and commodity futures contracts are recorded in the consolidated statements of financial condition on a trade date basis at fair value with changes in fair value recognized in earnings in each period. The fair value of a financial instrument is the amount that would be received to sell an asset or paid to transfer a liability in an orderly transaction between market participants at the measurement date (the exit price).
Financial Accounting Standards Board (FASB) fair value measurement and disclosure guidance requires a fair value hierarchy that prioritizes the inputs to valuation techniques used to measure fair value. The hierarchy gives the highest priority to unadjusted quoted prices in active markets for identical assets and liabilities (Level 1 measurements) and the lowest priority to unobservable inputs (Level 3 measurements). The three levels of the fair value hierarchy are described below:
Basis of Fair Value Measurement
| Level 1: | Unadjusted quoted prices in active markets that are accessible at the measurement date for identical, unrestricted assets or liabilities; |
| Level 2: | Quoted prices in markets that are not active or financial instruments for which all significant inputs are observable, either directly or indirectly; |
| Level 3: | Prices or valuations that require inputs that are both significant to the fair value measurement and unobservable. |
A financial instrument’s level within the fair value hierarchy is based on the lowest level of any input that is significant to the fair value measurement.
In determining fair value of United States Treasury Obligations and commodity futures contracts, the Fund uses unadjusted quoted market prices in active markets. United States Treasury Obligations and commodity futures contracts are classified within Level 1 of the fair value hierarchy. The Fund does not adjust the quoted prices for United States Treasury Obligations and commodity futures contracts.
(d) Deposits with Broker
The Fund deposits cash and United States Treasury Obligations with its Commodity Broker subject to Commodity Futures Trading Commission (the “CFTC”) regulations and various exchange and broker requirements. The combination of the Fund’s deposits with its Commodity Broker of cash and United States Treasury Obligations and the unrealized profit or loss on open futures contracts (variation margin) represents the Fund’s overall equity in its broker trading account. To meet the Fund’s initial margin requirements, the Fund holds United States Treasury Obligations. The Fund uses its cash held by the Commodity Broker to satisfy variation margin requirements. The Fund earns interest on its cash deposited with the Commodity Broker.
(e) United States Treasury Obligations
The Fund records purchases and sales of United States Treasury Obligations on a trade date basis. These holdings are marked to market based on quoted market closing prices. The Fund holds United States Treasury Obligations for deposit with the Master Fund’s Commodity Broker to meet margin requirements and for trading
70
Table of Contents
PowerShares DB Commodity Index Tracking Fund and Subsidiary
Notes to Consolidated Financial Statements—(Continued)
December 31, 2009
purposes. Interest income is recognized on an accrual basis when earned. Premiums and discounts are amortized or accreted over the life of the United States Treasury Obligations. Included in the United States Treasury Obligations as of December 31, 2009 and 2008 were holdings of $288,167,861 and $154,620,803, respectively, which are restricted and held against initial margin of the open futures contracts.
(f) Cash Held by Broker
The Fund’s arrangement with the Commodity Broker requires the Fund to meet its variation margin requirement related to the price movements, both positive and negative, on futures contracts held by the Fund by keeping cash on deposit with the Commodity Broker. The Fund defines cash and cash equivalents held by the Commodity Broker to be highly liquid investments with original maturities of three months or less, when purchased. As of December 31, 2009, the Fund had cash held by the Commodity Broker of $261,006,845 of which $18,424,838 was restricted. Restrictions on cash held by broker pertain to the settlement of closed futures contracts traded on the London Metals Exchange. As of December 31, 2008, the Fund had cash held by the Commodity Broker of $1,713,943,642, of which $688,785,759 was on deposit to satisfy the Fund’s negative variation margin on open futures contracts. There were no cash equivalents held by the Fund as of December 31, 2009 and 2008.
(g) Income Taxes
The Fund and the Master Fund are classified as partnerships for U.S. federal income tax purposes. Accordingly, neither the Fund nor the Master Fund will incur U.S. federal income taxes. No provision for federal, state, and local income taxes has been made in the accompanying consolidated financial statements, as investors are individually liable for income taxes, if any, on their allocable share of the Fund’s share of the Master Fund’s income, gain, loss, deductions and other items.
The major tax jurisdiction for the Fund and the earliest tax year subject to examination: United States 2007.
(h) Futures Contracts
All commodity futures contracts are held and used for trading purposes. The commodity futures are recorded on a trade date basis and open contracts are recorded in the consolidated statement of financial condition at fair value on the last business day of the period, which represents market value for those commodity futures for which market quotes are readily available. However, when market closing prices are not available, the Managing
71
Table of Contents
PowerShares DB Commodity Index Tracking Fund and Subsidiary
Notes to Consolidated Financial Statements—(Continued)
December 31, 2009
Owner may value an asset of the Master Fund pursuant to policies the Managing Owner has adopted, which are consistent with normal industry standards. Realized gains (losses) and changes in unrealized appreciation (depreciation) on open positions are determined on a specific identification basis and recognized in the consolidated statement of income and expenses in the period in which the contract is closed or the changes occur, respectively. As of December 31, 2009 and 2008, the futures contracts held by the Fund were in a net unrealized appreciation position of $221,326,744 and a net unrealized depreciation position of $688,785,759, respectively.
(i) Management Fee
The Master Fund pays the Managing Owner a management fee (the “Management Fee”), monthly in arrears, in an amount equal to 0.75% per annum of the daily net asset value of the Master Fund. No separate Management Fee is paid by the Fund. The Management Fee is paid in consideration of the Managing Owner’s commodity futures trading advisory services.
(j) Brokerage Commissions and Fees
The Master Fund incurs all brokerage commissions, including applicable exchange fees, NFA fees, give-up fees, pit brokerage fees and other transaction related fees and expenses charged in connection with trading activities by the Commodity Broker. These costs are recorded as brokerage commissions and fees in the consolidated statement of income and expenses as incurred. The Commodity Broker’s brokerage commissions and trading fees are determined on a contract-by-contract basis. On average, total charges paid to the Commodity Broker were less than $10.00 per round-turn trade for the Years Ended December 31, 2009, 2008 and 2007.
(k) Routine Operational, Administrative and Other Ordinary Expenses
The Managing Owner assumes all routine operational, administrative and other ordinary expenses of the Fund and the Master Fund, including, but not limited to, computer services, the fees and expenses of the Trustee, legal and accounting fees and expenses, tax preparation expenses, filing fees and printing, mailing and duplication costs. Accordingly, all such expenses are not reflected in the consolidated statement of income and expenses of the Fund.
(l) Organizational and Offering Costs
All organizational and offering expenses of the Fund and its Master Fund are incurred and assumed by the Managing Owner. Neither the Fund nor its Master Fund are, or will be, responsible to the Managing Owner for the reimbursement of organizational and offering costs. Expenses incurred in connection with the continuous offering of Shares also will be paid by the Managing Owner.
(m) Non-Recurring and Unusual Fees and Expenses
The Master Fund pays all fees and expenses, if any, of the Fund and the Master Fund, which are non-recurring and unusual in nature. Such expenses include legal claims and liabilities, litigation costs or indemnification or other unanticipated expenses. Such fees and expenses, by their nature, are unpredictable in terms of timing and amount. For the Years Ended December 31, 2009, 2008 and 2007, the Fund and the Master Fund did not incur such expenses.
(5) Fair Value Measurements
The Fund’s assets and liabilities recorded at fair value have been categorized based upon the fair value hierarchy discussed in Note 4(c).
Assets and Liabilities Measured at Fair Value were as follows:
| December 31, 2009 | December 31, 2008 | ||||||
| United States Treasury Obligations (Level 1) |
$ | 3,908,619,651 | $ | 174,793,945 | |||
| Commodity Futures Contracts (Level 1) |
$ | 221,326,744 | $ | (688,785,759 | ) | ||
72
Table of Contents
PowerShares DB Commodity Index Tracking Fund and Subsidiary
Notes to Consolidated Financial Statements—(Continued)
December 31, 2009
There were no Level 2 or Level 3 holdings as of December 31, 2009 and December 31, 2008.
(6) Financial Instrument Risk
In the normal course of its business, the Master Fund is party to financial instruments with off-balance sheet risk. The term “off-balance sheet risk” refers to an unrecorded potential liability that, even though it does not appear on the balance sheet, may result in a future obligation or loss. The financial instruments used by the Master Fund are commodity futures, whose values are based upon an underlying asset and generally represent future commitments that have a reasonable possibility of being settled in cash or through physical delivery. The financial instruments are traded on an exchange and are standardized contracts.
Market risk is the potential for changes in the value of the financial instruments traded by the Master Fund due to market changes, including fluctuations in commodity prices. In entering into these futures contracts, there exists a market risk that such futures contracts may be significantly influenced by adverse market conditions, resulting in such futures contracts being less valuable. If the markets should move against all of the futures contracts at the same time, the Master Fund could experience substantial losses.
Credit risk is the possibility that a loss may occur due to the failure of an exchange clearinghouse to perform according to the terms of a futures contract. Credit risk with respect to exchange-traded instruments is reduced to the extent that an exchange or clearing organization acts as a counterparty to the transactions. The Master Fund’s risk of loss in the event of counterparty default is typically limited to the amounts recognized in the consolidated statement of financial condition and not represented by the futures contract or notional amounts of the instruments.
The Fund and the Master Fund have not utilized, nor do they expect to utilize in the future, special purpose entities to facilitate off-balance sheet financing arrangements and have no loan guarantee arrangements or off-balance sheet arrangements of any kind, other than agreements entered into in the normal course of business noted above.
(7) Share Purchases and Redemptions
(a) Purchases
Shares may be purchased from the Fund only by Authorized Participants in one or more blocks of 200,000 Shares, called a Basket. The Fund issues Shares in Baskets only to Authorized Participants continuously as of noon, New York time, on the business day immediately following the date on which a valid order to create a Basket is accepted by the Fund, at the net asset value of 200,000 Shares as of the closing time of the NYSE Arca or the last to close of the exchanges on which the Master Fund’s assets are traded, whichever is later, on the date that a valid order to create a Basket is accepted by the Fund.
Each Share issued by the Fund correlates with a Master Fund Unit issued by the Master Fund and held by the Fund. Master Fund Units may only be created by the Fund.
(b) Redemptions
On any business day, an Authorized Participant may place an order with the Managing Owner to redeem one or more Baskets. Redemption orders must be placed by 10:00 a.m., New York time. The day on which the Managing Owner receives a valid redemption order is the redemption order date. Redemption orders are irrevocable. The redemption procedures allow Authorized Participants to redeem Baskets. Individual shareholders may not redeem directly from the Fund.
By placing a redemption order, an Authorized Participant agrees to deliver the Baskets to be redeemed through The Depository Trust Company’s (the “DTC”) book-entry system to the Fund not later than noon, New York time, on the business day immediately following the redemption order date. By placing a redemption order, and prior to receipt of the redemption proceeds, an Authorized Participant’s DTC account is charged the non-refundable transaction fee due for the redemption order.
73
Table of Contents
PowerShares DB Commodity Index Tracking Fund and Subsidiary
Notes to Consolidated Financial Statements—(Continued)
December 31, 2009
The redemption proceeds from the Fund consist of the cash redemption amount. The cash redemption amount is equal to the net asset value of the number of Basket(s) requested in the Authorized Participant’s redemption order as of the closing time of the NYSE Arca or the last to close of the exchanges on which the Master Fund’s assets are traded, whichever is later, on the redemption order date. The Fund will distribute the cash redemption amount at noon, New York time, on the business day immediately following the redemption order date through DTC to the account of the Authorized Participant as recorded on DTC’s book-entry system.
The redemption proceeds due from the Fund are delivered to the Authorized Participant at noon, New York time, on the business day immediately following the redemption order date if, by such time on such business day immediately following the redemption order date, the Fund’s DTC account has been credited with the Baskets to be redeemed. If the Fund’s DTC account has not been credited with all of the Baskets to be redeemed by such time, the redemption proceeds are delivered to the extent of whole Baskets received. Any remainder of the redemption proceeds are delivered on the next business day to the extent of remaining whole Baskets received if the Managing Owner receives the fee applicable to the extension of the redemption distribution date which the Managing Owner may, from time-to-time, determine and the remaining Baskets to be redeemed are credited to the Fund’s DTC account by noon, New York time, on such next business day. Any further outstanding amount of the redemption order will be canceled. The Managing Owner is also authorized to deliver the redemption proceeds notwithstanding that the Baskets to be redeemed are not credited to the Fund’s DTC account by noon, New York time, on the business day immediately following the redemption order date if the Authorized Participant has collateralized its obligation to deliver the Baskets through DTC’s book-entry system on such terms as the Managing Owner may from time-to-time agree upon.
Each Share redeemed by the Fund correlates with a Master Fund Unit redeemed by the Master Fund. Master Fund Units may only be redeemed by the Fund.
(c) Share Transactions
Summary of Share Transactions for the Years Ended December 31, 2009, 2008 and 2007
| Shares | Paid in Capital | ||||||||||||||||||||
| Year Ended | Year Ended | ||||||||||||||||||||
| December 31, 2009 |
December 31, 2008 |
December 31, 2007 |
December 31, 2009 |
December 31, 2008 |
December 31, 2007 |
||||||||||||||||
| Shares Sold* |
130,000,000 | 37,000,000 | 22,600,000 | $ | 2,882,078,200 | $ | 1,213,064,042 | $ | 610,932,754 | ||||||||||||
| Shares Redeemed* |
(8,000,000 | ) | (30,000,000 | ) | (2,600,000 | ) | (174,460,744 | ) | (1,101,962,652 | ) | (74,795,720 | ) | |||||||||
| Net Increase |
122,000,000 | 7,000,000 | 20,000,000 | $ | 2,707,617,456 | $ | 111,101,390 | $ | 536,137,034 | ||||||||||||
| * | Each Share sold and redeemed by the Fund correlates with a Master Fund Unit issued and redeemed by the Master Fund. Master Fund Units may be created or redeemed only by the Fund. |
(8) Profit and Loss Allocations and Distributions
The Master Fund is wholly-owned by the Fund and the Managing Owner. Each Share issued by the Fund correlates with a Master Fund Unit issued by the Master Fund and held by the Fund.
Pursuant to the Amended and Restated Declaration of Trust and Trust Agreement of the Master Fund, income and expenses are allocated pro rata to the Managing Owner as holder of the General Shares and to the Shareholders monthly based on their respective percentage interests as of the close of the last trading day of the preceding month. Any losses allocated to the Managing Owner (as the owner of the General Shares) which are in excess of the Managing Owner’s capital balance are allocated to the Shareholders in accordance with their respective interest in the Master Fund as a percentage of total shareholders’ equity. Distributions (other than redemption of units) may be made at the sole discretion of the Managing Owner on a pro rata basis in accordance with the respective capital balances of the shareholders.
No distributions were paid for the Year Ended December 31, 2009.
A distribution of $0.34 per Share from net investment income was declared on December 12, 2008 to Shareholders of record as of the close of business on December 17, 2008, payable on December 30, 2008. On December 30, 2008, the total distribution to Shareholders of $17,748,000 was paid. On December 30, 2008, the Fund paid $0.34 per General Share, a total distribution of $13.60.
74
Table of Contents
PowerShares DB Commodity Index Tracking Fund and Subsidiary
Notes to Consolidated Financial Statements—(Continued)
December 31, 2009
A distribution of $0.76 per Share from net investment income was declared on December 14, 2007 to Shareholders of record as of the close of business on December 19, 2007, payable on December 28, 2007. On December 28, 2007, the total distribution to Shareholders of $36,632,000 was paid. On December 28, 2007, the Fund paid $0.76 per General Share, a total distribution of $30.40.
(9) Commitments and Contingencies
The Managing Owner, either in its own capacity or in its capacity as the Managing Owner and on behalf of the Fund and the Master Fund, has entered into various service agreements that contain a variety of representations, or provide indemnification provisions related to certain risks service providers undertake in performing services which are in the best interests of the Fund and the Master Fund. As of December 31, 2009 and 2008 no claims had been received by the Fund or the Master Fund and it was therefore not possible to estimate the Fund’s and the Master Fund’s potential future exposure under such indemnification provisions.
(10) Net Asset Value and Financial Highlights
The Fund is presenting the following net asset value and financial highlights related to investment performance and operations for a Share outstanding for the Years Ended December 31, 2009, 2008 and 2007. The net investment income and total expense ratios are calculated using average net asset value. The net asset value presentation is calculated using daily Shares outstanding. The net investment income and total expense ratios have been annualized. The total return is based on the change in net asset value of the Shares during the period. An individual investor’s return and ratios may vary based on the timing of capital transactions.
The Fund invests substantially all of its assets in the Master Fund in a master-feeder structure. The Fund holds no investment assets other than Master Fund Limited Units. The Fund is the majority Master Fund Limited Unit owner and the Managing Owner holds a non-controlling interest in the Master Fund. Each Share issued by the Fund correlates with the Master Fund Limited Unit issued by the Master Fund and held by the Fund.
Net asset value per Master Fund Limited Unit and Master Fund General Unit (collectively, “Master Fund Units”) is the net asset value of the Master Fund divided by the number of outstanding Master Fund Units. Because there is a one-to-one correlation between Shares and the Master Fund Limited Units, the net asset value per Share and the net asset value per Master Fund Limited Unit are equal.
75
Table of Contents
PowerShares DB Commodity Index Tracking Fund and Subsidiary
Notes to Consolidated Financial Statements—(Continued)
December 31, 2009
| Year Ended | ||||||||||||
| December 31, 2009 |
December 31, 2008 |
December 31, 2007 |
||||||||||
| Net Asset Value |
||||||||||||
| Net asset value per share, beginning of period |
$ | 21.42 | $ | 31.46 | $ | 24.55 | ||||||
| Net realized and change in unrealized gain (loss) on United States Treasury Obligations and Futures |
3.38 | (10.05 | ) | 6.67 | ||||||||
| Net investment income (loss) |
(0.15 | ) | 0.35 | 1.00 | ||||||||
| Net income (loss) |
3.23 | (9.70 | ) | 7.67 | ||||||||
| Distributions of net investment income on Shares |
— | (0.34 | ) | (0.76 | ) | |||||||
| Net increase (decrease) |
3.23 | (10.04 | ) | 6.91 | ||||||||
| Net asset value per Share, end of period |
$ | 24.65 | $ | 21.42 | $ | 31.46 | ||||||
| Market value per Share, beginning of period |
$ | 21.19 | $ | 31.56 | $ | 24.58 | ||||||
| Market value per Share, end of period |
$ | 24.62 | $ | 21.19 | $ | 31.56 | ||||||
| Ratio to average Shares* |
||||||||||||
| Net investment income (loss) |
(0.68 | )% | 1.00 | % | 3.75 | % | ||||||
| Total expenses |
0.81 | % | 0.78 | % | 0.78 | % | ||||||
| Total Return, at net asset value** |
15.08 | % | (30.83 | )% | 31.24 | % | ||||||
| Total Return, at market value** |
16.19 | % | (31.78 | )% | 31.49 | % | ||||||
| * | Percentages are annualized. |
| ** | Percentages are not annualized. |
(11) Subsequent Events
The Fund evaluated the need for disclosures and/or adjustments resulting from subsequent events through the date the financial statements were issued. This evaluation did not result in any subsequent events that necessitated disclosures and/or adjustments, other than the event disclosed below.
Effective January 4, 2010, the Management Fee was increased to 0.85% from 0.75% per annum of the daily net asset value of the Master Fund.
76
Table of Contents
| ITEM 9. | CHANGES IN AND DISAGREEMENTS WITH ACCOUNTANTS ON ACCOUNTING AND FINANCIAL DISCLOSURE |
None.
| ITEM 9A. | CONTROLS AND PROCEDURES |
For purposes of this Item 9A, all references to the “Fund” shall be read to specifically include the Fund and the Master Fund.
Evaluation of Disclosure Controls and Procedures
Under the supervision and with the participation of the management of the Managing Owner, including Hans Ephraimson, its Chief Executive Officer, and Michael Gilligan, its Principal Financial Officer, the Fund carried out an evaluation of the effectiveness of the design and operation of its disclosure controls and procedures (as defined in Rule 13a-15(e) or 15d-15(e) of the Securities Exchange Act of 1934, as amended (the “Exchange Act”)) as of the end of the period covered by this annual report, and, based upon that evaluation, Hans Ephraimson, the Chief Executive Officer, and Michael Gilligan, the Principal Financial Officer, of the Managing Owner, concluded that the Fund’s disclosure controls and procedures were effective to ensure that information the Fund is required to disclose in the reports that it files or submits with the Securities and Exchange Commission (the “SEC”) under the Exchange Act is recorded, processed, summarized and reported, within the time periods specified in the SEC’s rules and forms, and to ensure that information required to be disclosed by the Fund in the reports that it files or submits under the Exchange Act is accumulated and communicated to management of the Managing Owner, including its Chief Executive Officer and Principal Financial Officer, as appropriate to allow timely decisions regarding required disclosure.
Changes in Internal Control Over Financial Reporting
There has been no change in internal control over financial reporting (as defined in the Rules 13a-15(f) and 15d-15(f) of the Exchange Act) that occurred during the Fund’s last fiscal quarter that has materially affected, or is reasonably likely to materially affect, the Fund’s internal control over financial reporting.
Management’s Annual Report on Internal Control Over Financial Reporting
Management of the Managing Owner is responsible for establishing and maintaining adequate internal control over financial reporting, as defined under Rules 13a-15(f) and 15d-15(f) of the Exchange Act, for the Fund. Hans Ephraimson, the Chief Executive Officer, and Michael Gilligan, the Principal Financial Officer, of the Managing Owner, assessed the effectiveness of the Fund’s internal control over financial reporting as of December 31, 2009. Their reports in connection with their assessment may be found in the “Report of Management on Internal Control Over Financial Reporting” on pages 45 and 46 of this Annual Report on Form 10-K.
The Fund’s independent registered public accounting firm, KPMG LLP, has audited the Fund’s internal control over financial reporting as of December 31, 2009, as stated in their report on pages 47 and 48 of this Form 10-K.
| ITEM 9B. | OTHER INFORMATION |
None.
77
Table of Contents
| ITEM 10. | DIRECTORS AND EXECUTIVE OFFICERS OF THE REGISTRANT AND CORPORATE GOVERNANCE |
Board of Directors and Executive Officers
The Fund has no directors or executive officers and also does not have any employees. It is managed by the Managing Owner.
The current board of managers and executive officers of the Managing Owner are as follows:
| Name |
Age | Position | ||
| Hans Ephraimson |
45 | Managing Director, Chief Executive Officer and Member of the Board of Managers | ||
| Michael Gilligan |
43 | Principal Financial Officer | ||
| Martin Kremenstein |
33 | Chief Operating Officer, Chief Investment Officer, Director and Member of the Board of Managers | ||
| Alex Depetris |
29 | Vice President and Member of the Board of Managers |
Hans Ephraimson joined Deutsche Bank AG in June 1986 and is a Managing Director in the North American Structured Sales and the DBX Group. Mr. Ephraimson has also been a Desk Head for foreign exchange in Deutsche Bank AG’s Institutional Clients Group for North America since January 1999. Mr. Ephraimson serves as a member of the Board of Managers and Chief Executive Officer of the Managing Owner. Mr. Ephraimson has been a principal and associated person of the Managing Owner since July 9, 2008 and June 25, 2009, respectively, and a member of the NFA since June 25, 2009. Mr. Ephraimson received his Bachelors of Science from Syracuse University in 1986 and an MBA from Columbia University in 1995.
Michael Gilligan joined Deutsche Bank AG in March 2008 and is a Director in the Finance Group. Mr. Gilligan serves as a principal and Principal Financial Officer of the Managing Owner. Mr. Gilligan has been a principal of the Managing Owner since April 29, 2008. Prior to joining Deutsche Bank, Mr. Gilligan worked for Credit Suisse, a large international financial institution, from September 1998 to March 2008 and held a number of positions in finance, including Controller of their residential and commercial real estate business; immediately prior to joining Deutsche Bank, Mr. Gilligan was the Chief Operating Officer of the Americas Credit Trading Group, a business group within Credit Suisse, from May 2007 to March 2008 with responsibility for the U.S. High Grade bond trading and Emerging Markets credit trading desks and his duties included business planning and management. Mr. Gilligan is a Chartered Accountant and received his Bachelors of Science in Management from Trinity College in 1989 and his Post Graduate Diploma in Professional Accounting from University College Dublin in 1990.
Martin Kremenstein joined Deutsche Bank AG in August 2006, and serves as a Director in the DBX Group with responsibility for providing currency and commodity-based investor solutions to the DB sales force in the Americas. Mr. Kremenstein serves as the Chief Operating Officer, Chief Investment Officer and Director of the Managing Owner. Mr. Kremenstein has been a principal and associated person of the Managing Owner since November 1, 2006 and November 3, 2006, respectively, and a member of the NFA since November 3, 2006. Prior to joining Deutsche Bank, Mr. Kremenstein worked for JPMorgan Chase, a large international financial institution, from September 1998 to August 2006, initially in London and then, from June 2003, in New York. From February 2005 to August 2006, Mr. Kremenstein worked in Market Risk Management, covering the Credit Portfolio division
78
Table of Contents
initially as an Associate, and later as a Vice President. From September 1998 to February 2005, Mr. Kremenstein worked in various roles in Operations at JPMorgan Chase, including managing the Credit Portfolio Credit Hedge Analysis team, managing projects for the Credit Portfolio Market Hedge team, and managing P&L production for the Counterparty Risk Book (London). Mr. Kremenstein received his B.A. from the University of Leeds in 1998.
Alex Depetris joined Deutsche Bank AG in June 2008 and serves as a Vice President in the DBX Group with responsibility for providing currency and commodity-based investor solutions to the DB sales force in the Americas. Mr. Depetris serves as a Vice President of the Managing Owner. Mr. Depetris has been a principal and associated person of the Managing Owner since April 13, 2009 and June 17, 2009, respectively, and a member of the NFA since June 17, 2009. From December 2006 to May 2008, Mr. Depetris was an associate with the law firm of Arnold & Porter LLP in New York, and prior to that he was an associate with the law firm Sullivan & Worcester LLP in Boston, Massachusetts from September 2005 through November 2006. Mr. Depetris received his J.D. from Boston University School of Law in 2005 and his Bachelors of Science in Finance from University of Maryland, College Park in 2002.
Code of Ethics
The Fund has no officers or employees and is managed by DB Commodity Services LLC. DB Commodity Services LLC has adopted the code of ethics of its parent, Deutsche Bank AG, which applies to all of its employees and is available at http://www.deutsche-bank.com/corporate-governance, under the heading “Codes of Ethics”. Other than several nonsubstantive changes made in May 2006, there have been no amendments or waivers to this code of ethics since its adoption. Information regarding any future amendments or waivers will be published on the aforementioned website.
| ITEM 11. | EXECUTIVE COMPENSATION |
The Fund has no employees, officers or directors and is managed by DB Commodity Services LLC. None of the directors or officers of DB Commodity Services LLC receive compensation from the Fund. DB Commodity Services LLC receives a monthly Management Fee of 1/12th of 0.85% (0.85% annually) of the daily net asset value of the Master Fund. In addition, Deutsche Bank Securities Inc., an affiliate of DB Commodity Services LLC, serves as the futures commission merchant and receives brokerage commissions paid by the Fund in connection with its futures trading. Prior to January 4, 2010, the Management Fee payable to DB Commodity Services LLC was 0.75% (0.75% annually) of the daily net asset value of the Master Fund.
As of the Year Ended December 31, 2009, the Fund has incurred Management Fees of $20,523,877 of which $17,838,284 had been paid at December 31, 2009. Management Fees of $2,685,593 were unpaid at December 31, 2009 and are reported as a liability on the consolidated statement of financial condition.
As of the Year Ended December 31, 2009, the Fund has incurred brokerage commissions of $1,664,714 to Deutsche Bank Securities Inc. of which $1,648,714 had been paid at December 31, 2009. Brokerage commissions of $16,000 were unpaid at December 31, 2009 and are reported as a liability on the consolidated statement of financial condition.
As of the Year Ended December 31, 2008, the Fund has incurred Management Fees of $15,177,543 of which $14,487,562 had been paid at December 31, 2008. Management Fees of $689,981 were unpaid at December 31, 2008 and are reported as a liability on the consolidated statement of financial condition.
As of the Year Ended December 31, 2008, the Fund has incurred brokerage commissions of $535,842 to Deutsche Bank Securities Inc. of which $519,932 had been paid at December 31, 2008. Brokerage commissions of $15,910 were unpaid at December 31, 2008 and are reported as a liability on the consolidated statement of financial condition.
79
Table of Contents
As of the Year Ended December 31, 2007, the Fund has incurred Management Fees of $7,698,410 of which $6,754,449 had been paid at December 31, 2007. Management Fees of $943,961 were unpaid at December 31, 2007 and are reported as a liability on the consolidated statement of financial condition.
As of the Year Ended December 31, 2007, the Fund has incurred brokerage commissions of $370,535 to Deutsche Bank Securities Inc. of which $242,214 had been paid at December 31, 2007. Brokerage commissions of $128,321 were unpaid at December 31, 2007 and are reported as a liability on the consolidated statement of financial condition.
| ITEM 12. | SECURITY OWNERSHIP OF CERTAIN BENEFICIAL OWNERS AND MANAGEMENT AND RELATED STOCKHOLDER MATTERS |
The Fund has no officers or directors. The following table sets forth certain information regarding beneficial ownership of our General Shares and Shares as of December 31, 2009, by management. No person is known by us to own beneficially more than 5% of the outstanding shares of such class.
| Title of Class |
Name and Address of Beneficial Owner |
Amount and Nature of Beneficial Ownership |
Percent of Class | |||
| General Shares |
DB Commodity Services LLC 60 Wall Street New York, New York 10005 |
40 | 100% | |||
| Shares |
Martin Kremenstein |
100 | Less than 0.01% | |||
| Directors and Officers of DB Commodity Services LLC as a group | 100 | Less than 0.01% | ||||
The Fund has no securities authorized for issuance under equity compensation plans.
| ITEM 13. | CERTAIN RELATIONSHIPS AND RELATED TRANSACTIONS, AND DIRECTOR INDEPENDENCE |
See Item 11.
| ITEM 14. | PRINCIPAL ACCOUNTANT FEES AND SERVICES |
Audit and Non-Audit Fees
The following table sets forth the fees for professional services rendered by KPMG LLP, the Fund’s independent registered public accounting firm.
| Fiscal Year Ended December 31, 2009 |
Fiscal Year Ended December 31, 2008 | |||||
| Audit Fees |
$ | 149,839 | $ | 146,956 | ||
| Audit-Related Fees |
$ | 0 | $ | 0 | ||
| Tax Fees |
$ | 0 | $ | 0 | ||
| All Other Fees |
$ | 0 | $ | 0 | ||
| Total |
$ | 149,839 | $ | 146,956 | ||
80
Table of Contents
Approval of Independent Registered Public Accounting Firm Services and Fees
The Managing Owner approved all of the services provided by KPMG LLP to the Fund described above. The Managing Owner pre-approves all audit and allowed non-audit services of the Fund’s independent registered public accounting firm, including all engagement fees and terms.
| ITEM 15. | EXHIBITS AND FINANCIAL STATEMENT SCHEDULES |
(a)(1) Financial Statements
See financial statements commencing on page 44 hereof.
(a)(2) Financial Statement Schedules
No financial statement schedules are filed herewith because (i) such schedules are not required or (ii) the information required has been presented in the aforementioned financial statements.
(a)(3) Exhibits
The following documents (unless otherwise indicated) are filed herewith and made a part of this Annual Report:
| EXHIBIT NO. |
DESCRIPTION | |
| 4.1 | Amended and Restated Declaration of Trust and Trust Agreement of the Registrant 3 | |
| 4.1.1 | Amendment No. 1 to Amended and Restated Declaration of Trust and Trust Agreement of the Registrant 5 | |
| 4.1.2 | Amendment No. 2 to Amended and Restated Declaration of Trust and Trust Agreement of the Registrant 5 | |
| 4.1.3 | Amendment No. 3 to Amended and Restated Declaration of Trust and Trust Agreement of the Registrant 5 | |
| 4.1.4 | Amendment No. 4 to Amended and Restated Declaration of Trust and Trust Agreement of the Registrant 7 | |
| 4.2 | Amended and Restated Declaration of Trust and Trust Agreement of the Co-Registrant 4 | |
| 4.2.1 | Amendment No. 1 to Amended and Restated Declaration of Trust and Trust Agreement of the Co- Registrant 5 | |
| 4.2.2 | Amendment No. 2 to Amended and Restated Declaration of Trust and Trust Agreement of the Co- Registrant 5 | |
| 4.2.3 | Amendment No. 3 to Amended and Restated Declaration of Trust and Trust Agreement of the Co-Registrant 7 | |
| 4.2.4 | Amendment No. 4 to Amended and Restated Declaration of Trust and Trust Agreement of the Co-Registrant 8 | |
| 4.3 | Form of Participant Agreement 2 | |
| 10.1 | Form of Escrow Agreement 4 | |
81
Table of Contents
| 10.2 | Form of Customer Agreement between DB Commodity Index Tracking Master Fund and Deutsche Bank Securities Inc. 1 | |
| 10.3 | Form of Administration Agreement 1 | |
| 10.4 | Form of Global Custody Agreement 1 | |
| 10.5 | Form of Transfer Agency and Service Agreement 1 | |
| 10.6 | Form of Distribution Services Agreement 1 | |
| 10.7 | AIM Second Amended and Restated Marketing Agreement 6 | |
| 23.1 | Consent of Independent Registered Public Accounting Firm | |
| 31.1 | Certification required under Exchange Act Rules 13a-14 and 15d-14 (filed herewith) | |
| 31.2 | Certification required under Exchange Act Rules 13a-14 and 15d-14 (filed herewith) | |
| 31.3 | Certification required under Exchange Act Rules 13a-14 and 15d-14 (filed herewith) | |
| 31.4 | Certification required under Exchange Act Rules 13a-14 and 15d-14 (filed herewith) | |
| 32.1 | Certification of Chief Executive Officer pursuant to 18 U.S.C. Section 1350 as adopted pursuant to Section 906 of the Sarbanes-Oxley Act of 2002 (furnished herewith) | |
| 32.2 | Certification of Principal Financial Officer pursuant to 18 U.S.C. Section 1350 as adopted pursuant to Section 906 of the Sarbanes-Oxley Act of 2002 (furnished herewith) | |
| 32.3 | Certification of Chief Executive Officer pursuant to 18 U.S.C. Section 1350 as adopted pursuant to Section 906 of the Sarbanes-Oxley Act of 2002 (furnished herewith) | |
| 32.4 | Certification of Principal Financial Officer pursuant to 18 U.S.C. Section 1350 as adopted pursuant to Section 906 of the Sarbanes-Oxley Act of 2002 (furnished herewith) | |
| 1 | Previously filed as an exhibit to Pre-Effective Amendment No. 2 to Form S-1, SEC Registration Number 333-125325, on August 5, 2005 and incorporated herein by reference. |
| 2 | Previously filed as an exhibit to Pre-Effective Amendment No. 3 to Form S-1, SEC Registration Number 333-125325, on September 13, 2005 and incorporated herein by reference. |
| 3 | Previously filed as an exhibit to Pre-Effective Amendment No. 4 to Form S-1, SEC Registration Number 333-125325, on October 26, 2005 and incorporated herein by reference. |
| 4 | Previously filed as an exhibit to Pre-Effective Amendment No. 5 to Form S-1, SEC Registration Number 333-125325, on December 21, 2005 and incorporated herein by reference. |
| 5 | Previously filed as an exhibit to Post-Effective Amendment No. 1 to Form S-1, SEC Registration Number 333-125325, on August 10, 2006 and incorporated herein by reference. |
| 6 | Previously filed as an exhibit to Registration Statement on Form S-1, SEC Registration Number 333-141631, on March 28, 2007 and incorporated herein by reference. |
| 7 | Previously filed as an exhibit to Form 8-K, SEC Registration Number 001-32726, on September 30, 2009 and incorporated herein by reference. |
| 8 | Previously filed as an exhibit to Post-Effective Amendment No. 1 to Form S-3, SEC Registration Number 333-158733, on January 4, 2010 and incorporated herein by reference. |
82
Table of Contents
SIGNATURES
Pursuant to the requirements of the Securities Exchange Act of 1934, the Registrant has duly caused this report to be signed on its behalf by the undersigned, thereunto duly authorized.
| PowerShares DB Commodity Index Tracking Fund | ||||||
| By: | DB Commodity Services LLC, its Managing Owner | |||||
| By: | /S/ HANS EPHRAIMSON | |||||
| Name: | Hans Ephraimson | |||||
| Title: | Chief Executive Officer | |||||
| By: | /S/ MICHAEL GILLIGAN | |||||
| Name: | Michael Gilligan | |||||
| Title: | Principal Financial Officer | |||||
| DB Commodity Index Tracking Master Fund | ||||||
| By: | DB Commodity Services LLC, its Managing Owner | |||||
| By: | /S/ HANS EPHRAIMSON | |||||
| Name: | Hans Ephraimson | |||||
| Title: | Chief Executive Officer | |||||
| Dated: June 18, 2010 |
By: | /S/ MICHAEL GILLIGAN | ||||
| Name: | Michael Gilligan | |||||
| Title: | Principal Financial Officer | |||||
83