Attached files
| file | filename |
|---|---|
| 8-K - FORM 8-K - TTM TECHNOLOGIES INC | c02216e8vk.htm |
Exhibit 99.1

| UBS Global Technology & Service Conference June 10, 2010 |
| 2 Forward-Looking Statements This presentation contains forward-looking statements that relate to future events or performance. These statements reflect the company's current expectations, and the company does not undertake to update or revise these forward- looking statements, even if experience or future changes make it clear that any projected results expressed or implied in this or other company statements will not be realized. Furthermore, readers are cautioned that these statements involve risks and uncertainties, many of which are beyond the company's control, which could cause actual results to differ materially from the forward-looking statements. These risks and uncertainties include, but are not limited to, risks associated with obtaining regulatory approvals in the U.S. and China, the company's dependence upon the electronics industry, the risks associated with integrating acquisitions, the company's dependence upon a small number of customers, general economic conditions and specific conditions in the markets TTM addresses, the unpredictability of and potential fluctuation in future revenues and operating results, increased competition from low-cost foreign manufacturers, and other "Risk Factors" set forth from time to time in the company's SEC filings. |

| 3 Industry Overview TTM Technologies Overview Meadville Overview TTM - Meadville Combination Financial Information |

| 4 Global PCB Market by Region 2009 Americas 3431 Europe 2035 Japan 8275 China 14251 ROA 13060 Region 2000 2009 2010 2011 2012e CAGR '09-'12 Americas $10.9 $3.4 $3.7 $3.8 $3.6 1.8% Europe $6.7 $2.0 $2.2 $2.2 $2.2 2.6% Japan $11.3 $8.3 $8.7 $9.0 $8.5 1.1% China $3.4 $14.3 $16.6 $18.2 $19.6 11.2% ROA $8.7 $13.1 $15.0 $16.3 $16.0 7.0% World $41.0 $41.1 $46.2 $49.5 $49.9 6.8% Source: Prismark May10 2009 Global Market Share Regional Growth History & Projections ROA = Asia excluding China and Japan $ in billions |
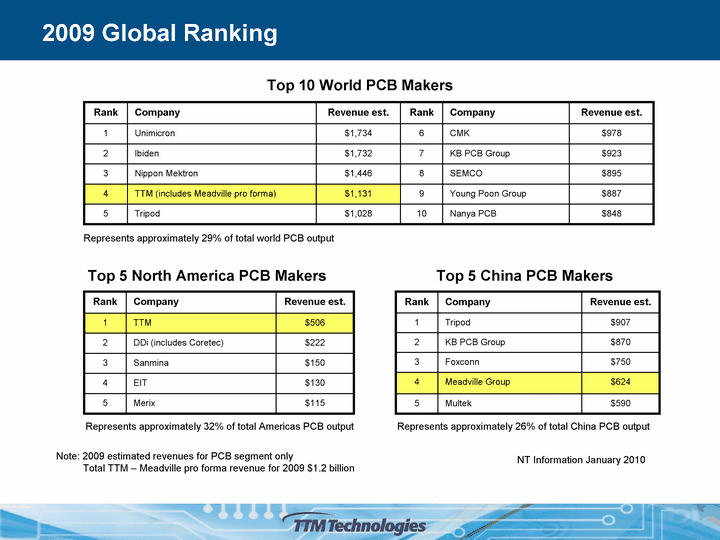
| 2009 Global Ranking Rank Company Revenue est. Rank Company Revenue est. 1 Unimicron $1,734 6 CMK $978 2 Ibiden $1,732 7 KB PCB Group $923 3 Nippon Mektron $1,446 8 SEMCO $895 4 TTM (includes Meadville pro forma) $1,131 9 Young Poon Group $887 5 Tripod $1,028 10 Nanya PCB $848 Rank Company Revenue est. 1 TTM $506 2 DDi (includes Coretec) $222 3 Sanmina $150 4 EIT $130 5 Merix $115 Top 10 World PCB Makers Top 5 North America PCB Makers NT Information January 2010 Represents approximately 32% of total Americas PCB output Represents approximately 26% of total China PCB output Note: 2009 estimated revenues for PCB segment only Total TTM - Meadville pro forma revenue for 2009 $1.2 billion Rank Company Revenue est. 1 Tripod $907 2 KB PCB Group $870 3 Foxconn $750 4 Meadville Group $624 5 Multek $590 Top 5 China PCB Makers Represents approximately 29% of total world PCB output |

| 6 1 2 3 4 5 TTM 20 20 20 20 20 TTM Strategy Aerospace / Defense No. 1 North American supplier Rigid Flex and specialty PCB products Backplane and subassembly Time Dedicated ultra-short lead time capability (<24 hours available) Dedicated, highly flexible, ramp-to- volume production in <10 days High-mix complex technology production with standard delivery Financial Strength Focus on operational excellence Superior asset management and strong balance sheet Strong cash flow generation Successful integration of strategic acquisitions Technology High performance, technologically complex PCBs Advanced manufacturing processes & technology expertise Industry-leading average layer count of 20+ at Chippewa Falls facility Industry-Leading Execution and Financial Results Global Presence - Asian Capacity High volume capability Capture incremental business from existing customers Seamless transition of prototype to volume production Footprint to supply growing Asian demand |

| 7 Total Customer Solution Total Solution Capabilities Engineering support Prototype Low volume / High mix Medium volume / Ramp Volume production Product Life Cycle Advanced Technology & Service Excellence |

| 8 TTM Revenue Trends 1998 1999 2000 2001 2002 2003 2004 2005 2006 2007 2008 2009 2009 Sales 79 106 204 129 89 180 241 240 369 669 681 583 1207 ($ Millions USD) Acquisition Power Circuits (7/14/99) Acquisition Advanced Circuits (12/26/02) Acquisition Tyco PCG (10/27/06) Acquisition Meadville (4/9/2010) (Pro Forma) |
| 9 Industry Overview TTM Technologies Overview Meadville Overview TTM - Meadville Combination Financial Information |

| 10 Meadville PCB Overview Meadville, a leading PCB Manufacturer in Asia Company Facts Established in 1985 FY2009 Sales: $625 million Specializes in manufacturing high-end, advanced technology and complex PCBs Over 13,000 employees located in 8 factories (7 in China and 1 in Hong Kong) Top 5 manufacturer amongst China PCB manufacturers Pioneer in China and manufacturing advanced technology HDI PCBs, Quick Turn Services and IC Substrates in China Average layer count of 7.9 with highest layer count of 12 in China at SYE facility Meadville's footprint of specialized facilities in Hong Kong & China Business Model Grow organically through capacity expansion Invest & Focus on high technology business Able to produce High mix, Low volume & Low Mix, High volume with layer count & ASP improvement YOY 7 Product Strategy Thin & Light - Fine Line product applications Thick & Odd Size - Complex Design for high speed applications 7 IC Substrates Shanghai, SMST 8 Drilling Services Shanghai, SKE 5 6 Guangzhou, GME Shanghai, SME Advanced HDI PCB Flex & Rigid Flex Suzhou, MAS 2 3 High Layer Conventional Dongguan, DMC Dongguan, SYE 1 QTA /Prototype Hong Kong, OPCM Product Applications for 2009 Communications, Networking 40% Handsets 21% Computer 24% Consumer 3% Others (include medical, automotive) 12% Key Customers China - Huawei, ZTE, Longcheer, TCL, DaTang International - AMD, APPLE, Ericsson, Intel, IBM, Alcatel, Fujitsu Competitors China - Multek, Viasystems Japan - Ibiden, CMK, Shinko Taiwan - Nanya, Unimicron, Tripod US - DDI, Merix 4 |
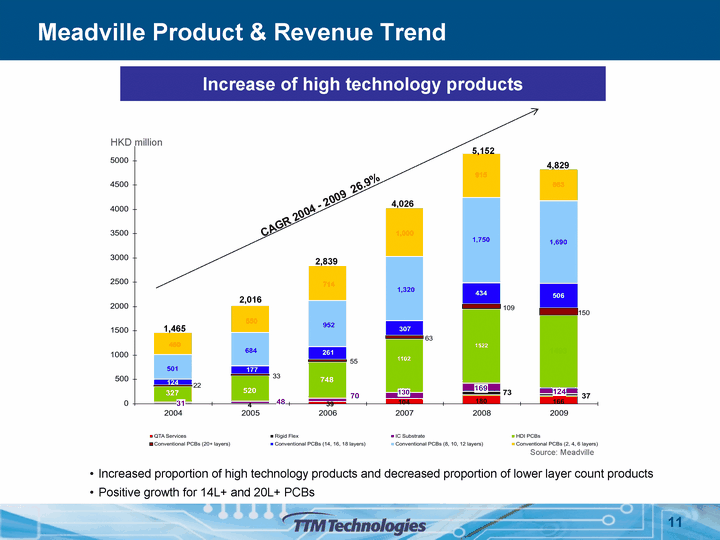
| 11 11 Meadville Product & Revenue Trend Increase of high technology products Increased proportion of high technology products and decreased proportion of lower layer count products Positive growth for 14L+ and 20L+ PCBs Source: Meadville CAGR 2004 - 2009 26.9% |

| 12 Global Manufacturing Footprint Seamless integration across distinct facilities enables successful one-stop shop solution for commercial customers No planned facility closures Integrated manufacturing platform enables TTM to execute a global facility specialization strategy Focused Assembly 8 Shanghai, China 1 Stafford, CT 3 San Diego, CA Aerospace/Defense 5 High Tech/Quick-Turn/High Mix 4 Chippewa Falls, WI 2 Santa Clara, CA Santa Ana, CA 6 Logan, UT 9 Stafford Springs, CT 1 6 2 4 3 9 5 United States China Volume Production Meadville 10 Dongguan - DMC 11 Dongguan - SYE 12 Guangzhou - GME 13 Shanghai - SME 14 Suzhou - MAS Substrate 16 Shanghai - SMST TTM 7 Hong Kong - OPCM Shanghai - SKE 15 16 |

| 13 PCB Product Positioning Low Medium High Volume Standard Advanced Low Technology Aerospace / Defense Consumer Electronics Office Automation Automotive Meadville Focus TTM Focus General Asia/Pacific Supplier Focus Servers / High-end Networking / Medical Instruments Commercial Aerospace Higher-end Computing & Networking Cellular Phone / High-end Consumer |
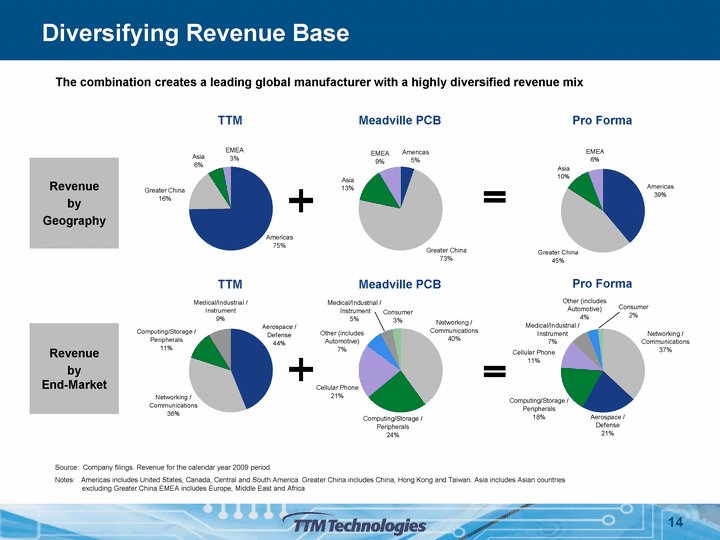
| 14 Diversifying Revenue Base Revenue by Geography Revenue by End-Market TTM Pro Forma Meadville PCB TTM Pro Forma Meadville PCB Source: Company filings. Revenue for the calendar year 2009 period. The combination creates a leading global manufacturer with a highly diversified revenue mix Notes: Americas includes United States, Canada, Central and South America. Greater China includes China, Hong Kong and Taiwan. Asia includes Asian countries excluding Greater China EMEA includes Europe, Middle East and Africa |

| 15 15 Diversifying Customer Base TTM 2009 Revenue Contribution by Customer Meadville PCB 2009 Revenue Contribution by Customer Source: Company filings, Management Apple Ericsson Huawei ZTE Cisco Systems Huawei Juniper Networks Northrop Grumman Raytheon IBM Pro Forma 2009 Revenue Contribution by Customer Apple Ericsson Huawei ZTE Raytheon |

| 16 Industry Overview TTM Technologies Overview Meadville Overview TTM - Meadville Combination Financial Information |

| 17 Transaction Summary Final purchase price $114 million in cash 36.3 million shares of TTM stock Closing market value of $329 million assuming closing market price of $9.06 per share on April 8, 2010 Assumed $433 million of Meadville debt Total: $876 million EBITDA multiple $876 million / $114.6 million adjusted EBITDA = 7.6 implied multiple Leverage ratio Including TTM's convertible debt of $175 million, initial leverage ratio is about 3.3 times combined 2009 EBITDA Goal is to be under 3 times EBITDA within first year following deal close |

| 18 Update on Board & Stockholders Ownership of shares 36.3 million shares issued: 26.2 million to Tang family and 10.1 million to minority shareholders Meadville's minority investors requested to sell approximately 1.3 million shares of TTM stock Tang family, TTM's largest minority shareholder, acquired these shares and holds approximately 35 percent stake in TTM Trading restrictions Tang family agreement prohibits sale of shares for 18 months; credit agreement requires Tangs to hold 20 percent stake in TTM Expansion of board Addition of Tom Tang, Managing Director of Asia Pacific Region Three new Government Security Committee members |

| 19 19 Accretion and Synergies Accretion estimate Transaction expected to be accretive in the third quarter of 2010 Revenue synergies Qualification process varies by customer Asian facilities ran at 75 to 95 percent of capacity in the first quarter Expanding capacity to accommodate growth 2010 potential from "simple qualification" customers Targeting "comprehensive qualification" customers for late 2010 and 2011 Cost synergies Minimal duplicative public company costs Better negotiations on direct materials due to larger scale of combined operations Transfer of best practices |

| 20 20 2009 Pro Forma Combined Income Statement 1 Pro forma adjustments are disclosed in the Form 8-K/A filed with the SEC on April 26, 2010 $ in millions TTM Meadville Pro Forma Combined 1 Net sales 582.5 $ 624.5 $ 1,207.0 $ Gross profit 103.2 121.2 249.6 Gross margin 17.7% 19.4% 20.7% Operating expenses Selling and marketing 26.5 19.0 45.3 General and administrative 36.5 50.3 76.5 Amortization of definite-lived intangibles 3.4 0.2 13.4 Restructuring charges 5.5 - 5.5 Impairment of long-lived assets 12.8 2.8 15.6 Operating income 18.5 48.9 93.3 Net income 4.9 32.3 52.6 Net income attributable to stockholders 4.9 $ 23.2 $ 40.8 $ |
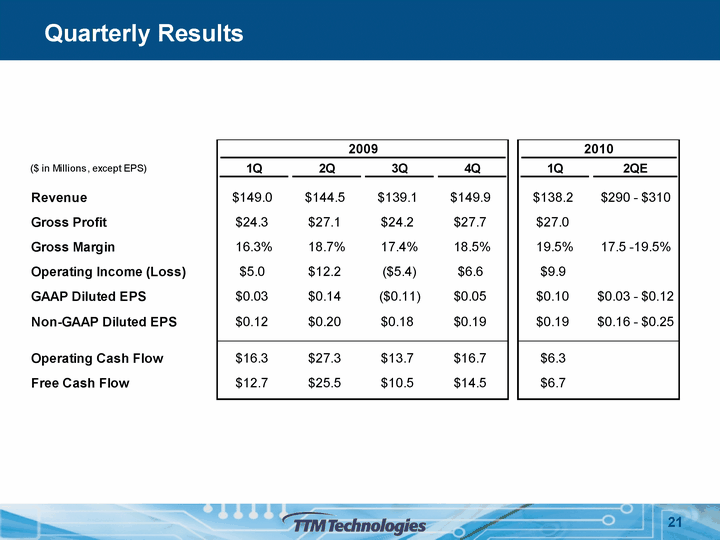
| 21 Quarterly Results |
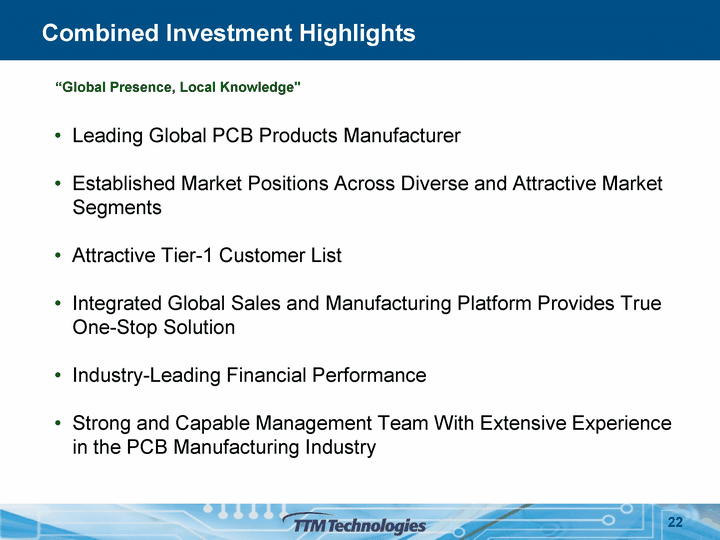
| 22 Combined Investment Highlights Leading Global PCB Products Manufacturer Established Market Positions Across Diverse and Attractive Market Segments Attractive Tier-1 Customer List Integrated Global Sales and Manufacturing Platform Provides True One-Stop Solution Industry-Leading Financial Performance Strong and Capable Management Team With Extensive Experience in the PCB Manufacturing Industry "Global Presence, Local Knowledge" |
