Attached files
| file | filename |
|---|---|
| 8-K - FORM 8-K - Iridium Communications Inc. | d8k.htm |
 Iridium
Communications Inc. RBC 2010 Technology, Media &
Communications Conference
Matt Desch, CEO
June 10, 2010
Exhibit 99.1 |
 Disclaimer
Safe Harbor Statement
This
presentation
contains
statements
about
future
events
and
expectations
known
as
“forward-looking
statements”
within
the
meaning
of
Section
27A
of
the
Securities
Act
of
1933,
as
amended
(the
“Securities
Act”),
and
Section
21E
of
the
Securities
Exchange
Act
of
1934,
as
amended
(the
“Exchange
Act”).
We
have
based
these
statements
on
our
current
expectations
and
the information currently available to us.
Forward-looking
statements
in
this
presentation
include
statements
regarding
the
expected
duration
of
the
existing
constellation;
expected
growth
in
revenue,
subscribers,
Operational
EBITDA
and
Operational
EBITDA
margins;
the
transition
to
the
Iridium
NEXT
constellation;
features
of
the
Iridium
NEXT
system;
expected
Iridium
NEXT
project
costs
and
deployment
schedule;
the
availability,
adequacy
and
terms
of
the
Iridium
NEXT
financing;
and
hosted
payload
opportunities.
Other
forward-looking
statements
can
be
identified
by
the
words
"anticipates,"
"may,"
"can,"
"believes,"
"expects,"
"projects,"
"intends,"
"likely,"
"will,"
"to
be"
and
other
expressions
that
are
predictions
of
or
indicate
future
events,
trends
or
prospects.
These
forward-looking
statements
involve
known
and
unknown
risks,
uncertainties
and
other
factors
that
may
cause
the
actual
results,
performance
or
achievements
of
Iridium
to
differ
materially
from
any
future
results,
performance
or
achievements
expressed
or
implied
by
such
forward-looking
statements.
These
risks
and
uncertainties
include,
but
are
not
limited
to,
uncertainties
regarding
expected
Operational
EBITDA
and
Operational
EBITDA
margins,
growth
in
subscribers
and
revenue,
overall
Iridium
NEXT
costs,
including
Euro
currency
exchange
risks,
the
company’s
ability
to
finalize
the
Iridium
NEXT
financing,
potential
delays
in
the
Iridium
NEXT
deployment,
levels
of
demand
for
mobile
satellite
services
(MSS),
and
the
company’s
ability
to
maintain
the
health,
capacity
and
content
of
its
satellite
constellation,
as
well
as
general
industry
and
economic
conditions,
and
competitive,
legal,
governmental
and
technological
factors.
Other
factors
that
could
cause
actual
results
to
differ
materially
from
those
indicated
by
the
forward-looking
statements
include
those
factors
listed
under
the
caption
"Risk
Factors"
in
the
company's
Annual
Report
on
Form
10-K
for
the
year
ended
December
31,
2009,
filed
with
the
Securities
and
Exchange
Commission
on
March
16,
2010.
There
is
no
assurance
that
Iridium's
expectations
will
be
realized.
If
one
or
more
of
these
risks
or
uncertainties
materialize,
or
if
Iridium's
underlying
assumptions
prove
incorrect,
actual
results
may vary materially from those expected, estimated or projected.
Readers
are
cautioned
not
to
place
undue
reliance
on
these
forward-looking
statements,
which
speak
only
as
of
the
date
hereof.
We
undertake
no
obligation
to
release
publicly
any
revisions
to
any
forward-looking
statements
after
the
date
they
are
made, whether as a result of new information, future events or otherwise.
2
2 |
 Basis of
Presentation 3
3
•
Reporting Entity
For comparison purposes, we have presented the operating results of Iridium Holdings
LLC and Iridium Communications Inc. on a combined basis for the year ended
December 31, 2009 along with the Iridium Holdings LLC operating results for 2008. The combined 2009 presentation is a simple
mathematical addition of the pre-acquisition results of operations of Iridium
Holdings LLC for the period from January 1, 2009 to September 29, 2009 and the
post-acquisition results of operations of Iridium Communications Inc. for the three months ended December 31, 2009. Please note that this
presentation is different from the “combined” presentation that we include in
the ‘Management’s Discussion and Analysis’ section of our Form 8-K
filed on May 10, 2010, which combined the pre-acquisition results of operations of
Iridium Holdings LLC for the period from January 1, 2009 to September 29, 2009
with the full year 2009 results of operations of Iridium Communications Inc., both pre- and post-acquisition. Iridium
Communications Inc. had no material operating activities from the date of formation of
GHL Acquisition Corp. until the acquisition. There are no other adjustments made
in the combined presentation. This presentation is intended to facilitate the evaluation and understanding of the financial
performance of the Iridium business on a year-to-year basis. Management
believes this presentation is useful in providing the users of our financial
information with an understanding of our results of operations because there were no
material changes to the operations or customer relationships of Iridium as a
result of the acquisition of Iridium Holdings LLC by GHL Acquisition Corp. •
Non-GAAP Measures
In addition to disclosing financial results that are determined in accordance with U.S.
GAAP, we disclose Operational EBITDA, which is a non-GAAP financial measure,
as a supplemental measure to help investors evaluate our fundamental operational performance. Operational EBITDA represents
earnings before interest, income taxes, depreciation and amortization, Iridium NEXT
revenue and expenses (for periods prior to the commencement of operations of
Iridium NEXT), stock-based compensation expenses, transaction expenses associated with the acquisition, the impact of purchase
accounting adjustments, and changes in the fair value of warrants. We also present
Operational EBITDA expressed as a percentage of total revenues, or Operational
EBITDA margin. Operational EBITDA does not represent, and should not be considered, an alternative to GAAP measurements such as
net income, and our calculations thereof may not be comparable to similarly entitled
measures reported by other companies. A reconciliation of Operational EBITDA to
net (loss) income, its comparable GAAP financial measure, is in the attached table. By eliminating interest, income taxes,
depreciation and amortization, Iridium NEXT revenue and expenses (for periods prior to
the deployment of Iridium NEXT only), stock-based compensation expenses,
transaction expenses associated with the acquisition, the impact of purchase accounting adjustments and changes in fair
value of the warrants, we believe the result is a useful measure across time in
evaluating our fundamental core operating performance. Management also uses
Operational EBITDA to manage our business, including in preparing its annual operating budget, financial projections and compensation
plans. We believe that Operational EBITDA is also useful to investors because similar
measures are frequently used by securities analysts, investors and other
interested parties in their evaluation of companies in similar industries. As indicated, Operational EBITDA does not include interest expense
on borrowed money or the payment of income taxes or depreciation expense on our capital
assets, which are necessary elements of our operations. It also excludes
expenses in connection with the development, deployment and financing of Iridium NEXT. Since Operational EBITDA does not account
for these and other expenses, its utility as a measure of our operating performance has
material limitations. Due to these limitations, our management does not view
Operational EBITDA in isolation and also uses other measurements, such as net income, revenues and operating profit, to
measure operating performance. |
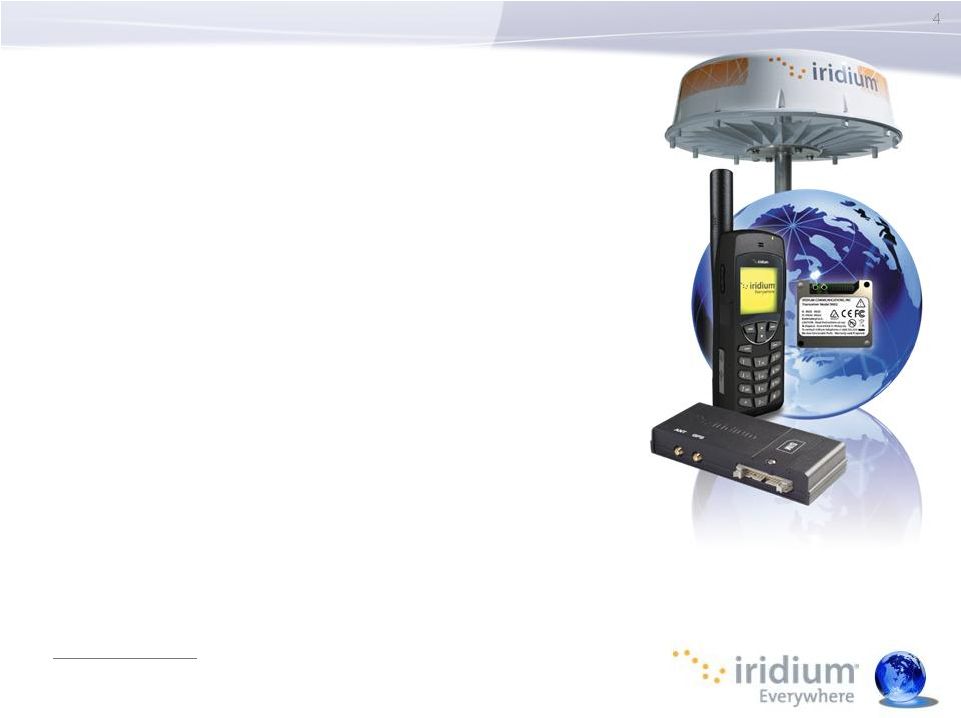 Our
Company •
Satellite voice and data solutions for
enterprise & government
•
The only provider offering 100% worldwide coverage
•
#2 industry player by revenue
•
66 satellite Low Earth Orbit (LEO) constellation plus
in-orbit spares for service through Iridium NEXT
•
~359,000 billable subscribers at March 31, 2010
•
Anchor U.S. DoD
customer –
23% of revenue for
Q1 2010
(1)
4
•
Complements terrestrial communications solutions
•
Less than 10% of the earth’s surface is served by terrestrial wireless and
wireline •
Key Markets: maritime, aviation, handheld, government, machine-to-
machine (M2M)
•
Low and high speed data services growing rapidly
1)
Includes direct and indirect DoD revenues and revenues from certain other
governmental entities through the DoD gateway.
|
 What
Investors Need to Know •
We have unique
service
capabilities
–
unlikely
to
be
replicated –
in
a market projected
to
double
by
2016
•
Our subscribers, service revenue and Operational EBITDA are all
growing rapidly (and did so through the recession)
•
We are a very attractive business with Operational EBITDA margin
over 40% and significant operating leverage which will cause our
margin to expand as we grow
•
We have a French government guarantee on a financing which will
enable us to fully fund our next-generation constellation which is
expected to last through 2030
•
We are currently valued at 3.3x our estimate for 2010 EBITDA as
strong number 2 player (vs. 10.5x for the market share leader)
5
1)
Source: Northern Sky Research and other sources
(1) |
 Unique
Position in the MSS Market - Service Capabilities Not Easily Duplicated
6 |
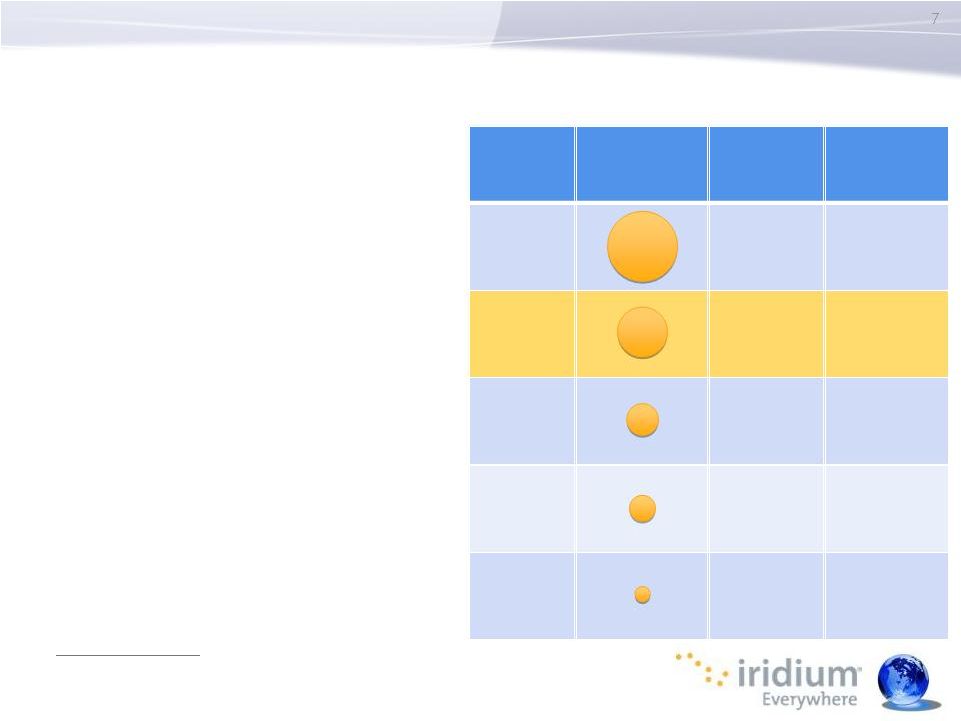 Mobile
Satellite Services (MSS) Market •
MSS market generated ~ $1.2B in
2009 revenue
(1)
•
MSS Industry CAGR of 12% expected
2010 –
2015
(2)
•
Iridium & Inmarsat
are the two
largest providers
•
Thuraya
only offers regional APAC
& EMEA coverage
•
Globalstar
satellites unable to
provide reliable two-way
communication
•
Others (ORBCOMM, SkyTerra, ICO,
Terrestar) serve only specific
segments
(1)
This
estimate
includes
2008
Thuraya
revenues,
as
public
financials
are
not
available
for
2009.
(source:
TMF
Associates)
(2)
Northern Sky Research, 2009
(3)
Based on 2009 revenue
(4)
Inmarsat
Core (excludes Stratos)
MSS
Provider
Relative
Size
(1)(3)
2009
Revenue
2006-2009
Revenue
CAGR
Inmarsat
$695 MM
(4)
12%
Iridium
$319 MM
15%
Thuraya
$127 MM
(1)
N/A
Globalstar
$64 MM
-22%
Orbcomm
$28 MM
4%
7 |
 Iridium
Markets & Illustrative Applications 8 |
 U.S.
Government – The Anchor Customer
•
The U.S. government relies on Iridium for
global communications
•
Significant DoD
investment in proprietary
gateway & equipment
•
DoD
has been our anchor customer since 2001
•
Serves all DoD
branches (Army, Navy, Air Force,
Marines, Special Operations) & many other
government/international users
•
DoD
views our services as being
mission-critical
•
Five year
(1)
contract signed in Q1 08
•
Fixed fee per user (voice)
•
Tiered pricing (data)
•
Opportunities to expand relationship
(Netted, iGPS
& M2M)
•
Other militaries & governments also use our
services (e.g., UK) -
included in commercial
revenues
9
DoD
Revenue
(2)
2004
24%
2009
Total Revenue
$122 million
Total Revenue
$319 million
1)
As is customary for government contracts, Iridium’s DoD contract is structured as
a five year contract with one base year and four one-year options to
extend. Iridium’s contract with the DoD is currently in the second year of
optional extension, making this the third year of the overall DoD contract. Two
one-year option periods remain. 2)
Includes direct and indirect DoD revenues and revenues from certain other
governmental entities through the DoD gateway. |
 M2M
(SBD) Data Transmission Voice Call
OpenPort
Session
Iridium Is Used –
Everywhere
10
One week plot of SBD Session, Voice Call, & OpenPort
Session Origination Points week of 5/23/10-5/29/10
(Commercial Traffic Only) |
 Expanding
Distribution Network •
Wholesale distribution model
minimizes costs and risks
•
Growing web of hundreds of
total distribution partners
•
Partners provide “outsourced
R&D”
to develop specialty
products for individual
customer segments
•
>200 individual applications
targeting key verticals
11 |
 New Core
Products Accelerating our Growth
2001
2001
0
Partners
0
Partners
02
03
04
05
06
07
08
Iridium
OpenPort
High
Functionality
Handset
Low Cost
Handset
Original
Motorola
Voice
Handset
Iridium
9505A
M2M
9601
Voice
& Data
Modem
iGPS
M2M
Chipset
12
M2M
9602
Iridium
9522B
Iridium
9555
U.S. DOD
Tactical Radio
(Netted)
Pre-NEXT
Devices
Iridium
Aero
OpenPort
2010
2010
09
>
200
Partners
>
200
Partners |
 Licensing
in New Markets New Geographic Opportunities
•
Today we have distribution presence in over 100 countries
•
Potential distribution presence in certain countries offering large growth
opportunity: •
Russia,
China,
India,
South
Africa
–
Population
of
2.7B
(1)
•
Currently pursuing entering these and other countries
(1)
July 2009 estimate according to CIA World Factbook.
13 |
 Growing
Rapidly, Even Through Recession
14 |
 Continued
Growth Expected 2009
1Q’10
2010
Guidance
Subscribers
(1)
342K
Up 11.2%
359K
Up 14.3%
376K –
393K
Up 10 –
15%
Commercial
Service Revenue
$160.2 M
Up 20.3%
$40.9 M
Up 11.0%
Up 10 –
12%
Government
Service Revenue
(2)
$53.7 M
Up 2.4%
$13.7 M
Up 3.1%
Up 3 –
5%
Equipment
Revenues
$83.5 M
Down 30.4%
$21.8 M
Up 6.5%
Single Digit
Growth
Operational
EBITDA
(3)
$133.9 M
Up 20.5%
$33.6 M
Up 19.6%
$145 –
155 M
Up 8 –
16%
15
~375K already as of 6/10/10!
1)
Billable subscribers at the end of the respective periods, which exclude suspended
subscribers who elected to suspend their accounts and were no generating any
fees. 2)
Voice and M2M service revenue for the U.S. government
3)
Net Income in 2009 and 1Q10 were $48.5M and ($1.3M) respectively, which includes $17.0M
and $18.4M of expenses related to purchase price accounting adjustments, net of
tax, respectively. Operational EBITDA is defined on page 3. See
pages 33 and 36 for a reconciliation of Operational EBITDA to Net Income. |
 Subscriber
and Service Revenue Key to Earnings Growth
•
Growing billable subscriber
base drives recurring service
revenue
•
Enterprise and government
end-users
•
Service revenue is predictable
and growing
($M's)
(000's)
Robust
Billable
Subscriber
Growth
1)
Billable subscribers exclude suspended subscribers who elected to suspend their
accounts and were not generating any fees at such time.
$235
$201
$159
$129
Q1 03
Q1 10
16
(1)
Service Revenue
16
$55
$60 |
 •
Largely fixed cost business model
•
Expanding
Operational
EBITDA
margin
(1)
Substantial Operating Leverage
(1)
Operational EBITDA is defined on slide 3. Operational EBITDA margin is defined
as Operational EBITDA divided by total revenue.
Operational EBITDA
Operational EBITDA Margin
17
1Q10
Margin
41%
-
up
340bps
from
previous
1Q |
 Government Backing for Low-Cost,
Flexible Financing
18 |
 Iridium
Has a Strong Balance Sheet •
Net
Cash
of
$146M
at
end
of
1Q10
(1)
•
Strong
cash
producing
operations
-
2010
Operational
EBITDA
guidance provided of $145 –
155M
•
$262M of potential warrant proceeds from $7.00 and $11.50
warrants
19
(1) Includes Cash & Restricted Cash, less indebtedness at March 31, 2010
|
 June
2 nd
Announcement
•
Iridium announced a comprehensive plan for Iridium NEXT
constellation and financing
•
Iridium
signed
an
agreement
with
Thales
Alenia
Space
(TAS)
for
next-
generation constellation after a comprehensive competitive process
•
$2.1B
(1)
contract for 81 satellites (66 operational, 6 in-orbit spares, 9
ground spares)
•
TAS beginning work immediately under an Authorization to Proceed
•
First launch scheduled during Q1 2015
•
Total
NEXT
cost
now
expected
to
be
$2.9B
to
be
spent
through
2017
(1)
•
Coface, France’s export credit agency (ECA), committed to
guarantee 95% of $1.8B facility
20
1) Computed at a Euro to USD exchange rate of 1.23 which will be converted to fixed
rate after financing close. |
 •
Coface, France’s export credit agency, has issued a ‘Promise of
Guarantee’ which commits to cover 95% of $1.8B facility
•
Iridium expects an attractive fixed rate consistent with other ECA
financings
(1)
and a flexible, long term (15 years)
•
Facility only drawn down through 2017 as capital required; payoff over
the subsequent 7 years
•
With Iridium’s growth and delayed drawdown –
credit statistics very
manageable
•
Syndication underway now –
expect to be completed this summer
•
Coface
guarantee is not conditioned on Iridium raising additional debt
or
equity
Iridium NEXT Financing
21
(1) Globalstar’s
maximum potential rate is in the 6.5% range.
Combined with expected cash flows, Coface-backed credit
facility fully funds Iridium NEXT! |
 Iridium
NEXT Prime Selection •
TAS offers the best comprehensive solution for
Iridium in terms of design, functionality, price,
schedule and financing
•
Initial launch scheduled during Q1 2015
•
Current fleet expected to provide service
through transition to Iridium NEXT
•
Fully compatible with current constellation and
customer devices to simplify network transition
and customer continuity
22
•
Iridium NEXT features:
•
Doubles current Iridium subscriber capacity for long-term growth
•
Supports
higher
data
speeds
–
enabling
the
most
competitive
price
points
in
the
industry
•
Capable
of
supporting
future
product
enhancements
•
Designed
to
host
secondary
payloads
–
in
discussion
with
numerous
potential
candidates
•
Will maintain Iridium’s unique architecture and its advantages
-
software upgradability |
 Hosted
Payload Opportunity •
Significant interest from government and industry in sharing Iridium NEXT
global networked communications infrastructure
•
New cash flow stream potential for Iridium
•
Pre-launch
(2012
–
2014)
and
after
launch
(data
delivery
2015
and
beyond)
•
Potential customers appreciate the unique opportunity Iridium NEXT presents:
•
Unprecedented
spatial
and
temporal
coverage
with
66
payloads
•
Real-time
data
acquisition
from
on-board
sensors
•
Cost-effective
–
fraction of the cost of dedicated satellites
•
Thales Alenia
Space has “designed in”
hosted payload
flexibility
•
Active opportunities underway with various
governmental agencies
23
23 |
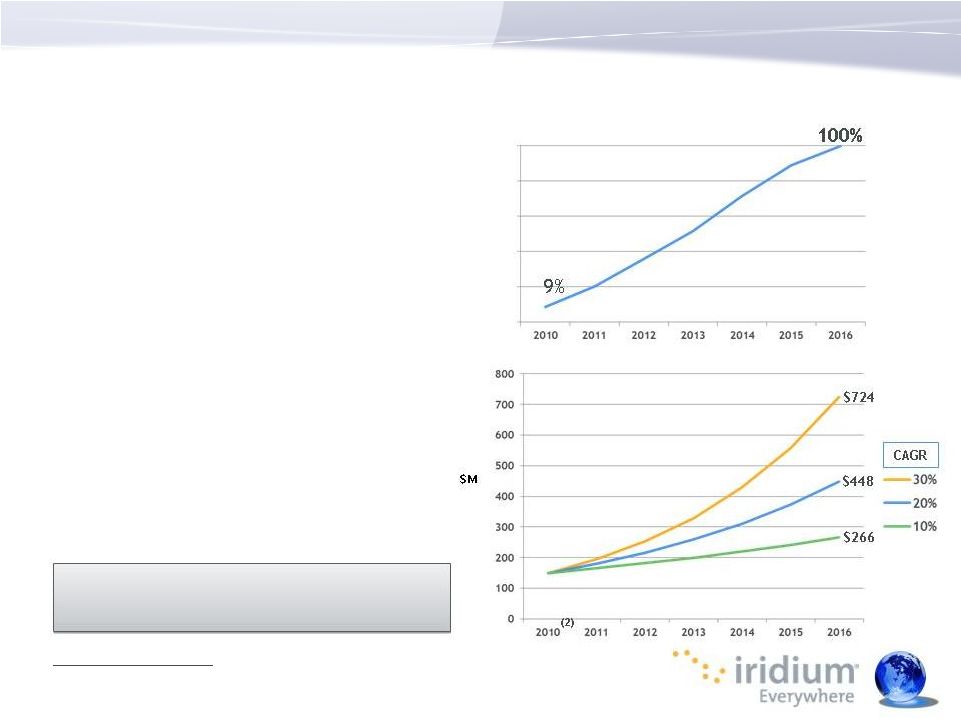
 Putting
Cost of Iridium NEXT in Perspective •
$2.9B constellation (current estimated total cost)
(1)
•
Assumes constellation provides commercially acceptable service
through 2030
(2)
•
Large cash flow potential over constellation life justifies the
investment:
24
1)
Computed at a Euro to USD exchange rate of 1.23.
2)
Design life is expected to be 10 years. Historically, actual constellation life
has significantly exceeded design life. 3)
Cumulative Operational EBITDA based on midpoint of 2010 Operational EBITDA guidance
previously provided by management ($150M) and assuming Operational EBITDA grows
at 10% and 15% per year, respectively. For periods after the deployment of
Iridium NEXT, Operational EBITDA will not exclude revenues and expenses associated with Iridium NEXT.
See page 3 -
Basis of Presentation.
4)
The Operational EBITDA CAGRs
are for illustrative purposes only and are not intended to be and should not be relied
upon as management guidance or projections. |
 Valued
at Large Discount to Peers 25 |
 Iridium
Trading at 3.3x 2010E Operational EBITDA 26
Current Iridium Trading Valuation
Note: Balance sheet data as of 3/31/10.
1)
Includes shares outstanding plus the value of the outstanding warrants using the
treasury stock method. 2)
Cash and restricted cash, less indebtedness at March 31, 2010.
3)
Represents midpoint of management guidance.
4)
Source: Bloomberg as of 6/4/10; based on 2010 estimated EBITDA.
(2)
(1)
(4)
($ in millions, except per-share data)
Share Price as of 6/4/2010
$8.74
x Shares Outstanding
73.0
Market Capitalization
$638
Less: Net Cash
($146)
Enterprise Value
$492
Divided by: 2010E Operational EBITDA
(3)
$150
Ent. Value / 2010E Operational EBITDA
3.3x
Comparison to Inmarsat
Approx. 10.5x
(Primary Competitor)
26 |
 Iridium
NEXT Financing and Equity Value 27
27
Expected Iridium NEXT Cumulative Capex
Spend
•
$1.8B Coface-backed facility will be
drawn down over time in line with
capital expenditures…
•
While Operational EBITDA grows
(1)
Potential Operational EBITDA Growth
(1)
Significant Equity Value In All
Years As We Build NEXT
(1)
Operational EBITDA growth for illustrative purposes only and are not intended to be
and should not be relied upon as management guidance or projections
(2)
Midpoint of 2010 Guidance = $150M |
 The
Iridium Success Story •
Company today has a record of performance -
nearly no net debt and
strong and growing Operational EBITDA…
•
Memories gradually fading from predecessor bankruptcy twelve years ago
•
Extensive scrutiny through recent corporate and financial transactions
validate Iridium’s business model
•
“Conventional wisdom”
in industry about operating risks repeatedly overcome
by Iridium’s track record and robust network design
•
$1.8 B French government guarantee to cover full financing needs
with
low-cost, flexible debt
•
Can focus now on growing operating margins and generating long term
earnings and value
28 |
 Iridium
NEXT Constellation Industry Leadership
Fully Financed
Summary
Strong Base of Customers
Positive & Growing EBITDA
Leverage on Assets and
Expanding Margins
Distribution Model
Numerous Opportunities
for Growth in Fast
Increasing Revenue
Growing Market
29 |
 Appendix |
 (1)
Subscribers as of the end of the period
(2)
Primarily Commercial M2M data subscribers who elected to suspend their accounts and as
a result were not generating fees at such time
Iridium Communications Inc. and Iridium Holdings LLC
Q1 2010 Summary Highlights
31
31
Iridium Holdings LLC
(In thousands)
2009
Revenue
Subscribers
(1)
Commercial
Voice and M2M data service
Voice
$ 32,838
219
M2M data
3,782
64
Total voice and M2M data service
36,620
283
Other
198
-
Total commercial
36,818
283
Government
Voice and M2M data service
Voice
13,218
29
M2M data
130
2
Total voice and M2M data service
13,348
31
Engineering and support
5,120
-
Total government
18,468
31
Equipment
20,503
-
Total revenue and billable subscribers
$ 75,789
314
Suspended
subscribers
(2)
14
Total subscribers
328
NM= Not Meaningful
Iridium Communications Inc.
2010
% Change
Revenue
Subscribers
(1)
Revenue
Subscribers
$ 36,607
248
11.5%
13.2%
4,050
76
7.1%
18.8%
40,657
324
11.0%
14.5%
229
-
15.7%
NM
40,886
324
11.0%
14.5%
13,494
30
2.1%
3.4%
263
5
102.3%
150.0%
13,757
35
3.1%
12.9%
5,256
-
2.7%
NM
19,013
35
3.0%
12.9%
21,843
-
6.5%
NM
$ 81,742
359
7.9%
14.3%
31
390
18.9%
For
the
Three
Months
Ended
March
31,
For
the
Three
Months
Ended
March
31, |
 Iridium
Communications Inc. and Iridium Holdings LLC Q1 2010 Consolidated Statements of
Operations (In thousands)
32
32
Iridium Holdings LLC
Iridium Communications Inc.
For the Three Months Ended March 31,
2009
2010
Purchase Accounting
Adjustments
(1)
Revenue:
Services:
Government
$
18,468
$
19,013
$
-
Commercial
36,818
40,886
(1,056)
Subscriber equipment
20,503
21,843
-
Total revenue
75,789
81,742
(1,056)
Operating expenses:
Cost of subscriber equipment sales
11,316
23,145
10,873
Cost of services (exclusive of depreciation and amortization)
19,697
20,361
(1,020)
Research and development
12,094
4,265
-
Depreciation and amortization
3,675
22,511
19,053
Selling, general and administrative
13,939
15,930
-
Transaction costs
643
-
-
Total operating expenses
61,364
86,212
28,906
Operating profit (loss)
14,425
(4,470)
(29,962)
Other (expense) income:
Interest income (expense), net of capitalized interest
(4,639)
106
-
Other income (expense), net
(68)
117
Total other (expense) income
(4,707)
223
-
Earnings (loss) before provision (benefit) for taxes
9,718
(4,247)
(29,962)
Income tax (benefit) provision
-
(2,930)
(11,558)
Net income (loss)
$ 9,718
$
(1,317) $
(18,404) Operational EBITDA
$ 28,117
$ 33,619
$
- (1)
When comparing Iridium Communications Inc.'s results of operations to that of Iridium
Holdings LLC, the impact of the purchase accounting on the carrying value of
inventory, property and equipment, intangible assets and accruals, increased by
approximately $19.8 million, $348.2 million, $95.5 million and $29.0 million,
respectively compared to Iridium Holdings LLC’s balance sheet as of September 29,
2009. Similarly, Iridium Holdings LLC's deferred revenue decreased by $7.4
million. As a result of the purchase accounting adjustments related to the acquisition,
our cost of subscriber equipment sales increased in the first quarter of 2010 as
compared to those costs and expenses of Iridium Holdings LLC in prior periods and the
decrease in the carrying value of deferred revenue will also result in a
decrease in revenue throughout 2010. In addition, the increase in accruals will result
in a reduction in cost of services (exclusive of depreciation and amortization)
during 2010 and future periods. The increase in property and equipment and intangible
assets will result in an increase to depreciation and amortization expense
during 2010 and future periods. |
 Iridium
Communications Inc. and Iridium Holdings LLC Q1 2010 Operational EBITDA
Non-GAAP reconciliation (In thousands)
33
33
Iridium Holdings LLC
Iridium Communications
Inc.
Three Months Ended
March 31, 2009
Three Months Ended
March 31, 2010
Net income (loss)
$
9,718
$
(1,317) Interest expense
4,622
12
Interest income
17
(118)
Income taxes
-
(2,930)
Depreciation and amortization
3,675
22,511
Iridium NEXT expenses, net
8,849
3,370
Share-based compensation
593
1,182
Transaction expenses
643
-
Purchase accounting adjustments
-
10,909
Operational EBITDA
$ 28,117
$
33,619 |
 Iridium
Communications Inc. and Iridium Holdings LLC 2009 Summary Highlights
34
34
Iridium Holdings LLC
Iridium Communications Inc.
(In thousands)
For the Year Ended December 31,
2008
For the Year Ended December 31,
2009
% Change
Revenue
Subscribers
(1)
Revenue
Subscribers
(1)
Revenue
Subscribers
Commercial
Voice and M2M data service
Voice
$ 121,183
218
$ 143,133
238
18.1%
9.2%
M2M data
11,288
59
16,462
70
45.8%
18.6%
Total voice and M2M data service
132,471
277
159,595
308
20.5%
11.2%
Other
776
-
648
-
-16.5%
NM
Total commercial
133,247
277
160,243
308
20.3%
11.2%
Government
Voice and M2M data service
Voice
52,172
29
52,956
30
1.5%
3.4%
M2M data
277
2
770
4
178.0%
100.0%
Total voice and M2M data service
52,449
31
53,726
34
2.4%
9.7%
Engineering and support
15,310
-
21,472
-
40.2%
NM
Total government
67,759
31
75,198
34
11.0%
9.7%
Equipment
119,938
-
83,499
-
-30.4%
NM
Total revenue and billable subscribers
$
320,944
308
$
318,940
342
-0.6%
11.0%
Suspended subscribers
(2)
12
27
Total subscribers
320
369
15.3%
NM
= Not Meaningful
(1)
Subscribers as of the end of the period
(2)
Primarily Commercial M2M data subscribers who elected to suspend their accounts and as
a result were not generating fees at such time
|
 Iridium
Communications Inc. and Iridium Holdings LLC 2009
Consolidated Statements of Operations
(In thousands)
35
Iridium Holdings LLC
Iridium Communications
Inc.
Iridium Holdings LLC
Combined Year
For the Year Ended
December 31, 2008
For the Three Months
Ended December 31,
2009
For the Period January
1, 2009 to September
29, 2009
For the Year Ended
December 31, 2009
Impact of Purchase
Accounting
Adjustments on
2009 results
Revenue:
Services:
Government
$ 67,759
$
19,159
$ 56,039
$ 75,198
$
-
Commercial
133,247
39,537
120,706
160,243
(1,675)
Subscriber equipment
119,938
17,293
66,206
83,499
-
Total revenue
320,944
75,989
242,951
318,940
(1,675)
Operating
expenses:
Cost of subscriber equipment sales
67,570
18,657
33,265
51,922
8,899
Cost of services (exclusive of depreciation and amortization)
69,882
18,965
58,978
77,943
(1,020)
Research and development
32,774
5,974
17,432
23,406
-
Depreciation and amortization
12,535
22,376
10,850
33,226
18,621
Selling, general and administrative
55,105
16,307
44,505
60,812
-
Transaction costs
7,959
-
12,478
12,478
-
Total operating
expenses
245,825
82,279
177,508
259,787
26,500
Operating
profit
75,119
(6,290)
65,443
59,153
(28,175)
Other (expense) income:
Interest expense, net of capitalized interest
(21,094)
(47)
(12,829)
(12,876)
(78)
Interest income and other income (expense), net
(146)
324
670
994
-
Total other income (expense)
(21,240)
277
(12,159)
(11,882)
(78)
Earnings before provision (benefit) for taxes
53,879
(6,013)
53,284
47,271
(28,253)
Income tax provision (benefit)
-
(1,038)
-
(1,038)
(10,899)
Net income
$ 53,879
$
(4,975)
$ 53,284
$ 48,309
$
(17,354) Operational EBITDA
$ 111,103
$
30,211 $ 103,718
$ 133,929
$
-
35
(1)
See page 3 for definition of combined year.
(2)
When comparing Iridium Communications Inc.'s results of operations to that of Iridium
Holdings LLC, the impact of the purchase accounting on the carrying value of
inventory, property and equipment, intangible assets and accruals, increased by
approximately $19.8 million, $348.2 million, $95.5 million and $29.0 million, respectively
compared to Iridium Holdings LLC’s balance sheet as of September 29, 2009.
Similarly, Iridium Holdings LLC's deferred revenue decreased by $7.4 million. As a result of the
purchase accounting adjustments related to the acquisition, our cost of subscriber
equipment sales will increase in the first quarter of 2010 as compared to those costs and
expenses of Iridium Holdings LLC in prior periods and the decrease in the carrying
value of deferred revenue will also result in a decrease in revenue throughout 2010. In
addition, the increase in accruals will result in a reduction in cost of services
(exclusive of depreciation and amortization) during 2010 and future periods. The increase in
property and equipment and intangible assets will result in an increase to depreciation
and amortization expense during 2010 and future periods. (1)
(2) |
 Iridium
Communications Inc. and Iridium Holdings LLC 2009 Operational EBITDA Non-GAAP
reconciliation (In thousands)
36
Iridium Holdings LLC
Iridium
Communications Inc.
Iridium Holdings LLC
Combined Year
(1)
For the Year Ended
December 31, 2008
Three Months Ended
December 31, 2009
For the Period January
1, 2009 to September
29, 2009
For the Year Ended
December 31, 2009
Net income
$ 53,879
$
(4,975)
$ 53,284
$ 48,309
Interest expense
21,094
47
12,829
12,876
Interest income
(1,345)
(298)
(287)
(585)
Income taxes
-
(1,038)
-
(1,038)
Depreciation and amortization
12,535
22,376
10,850
33,226
Iridium Next expenses, net
14,113
4,109
9,159
13,268
Stock-based compensation
2,868
436
5,405
5,841
Transaction expenses
7,959
-
12,478
12,478
Purchase accounting adjustments
-
9,554
-
9,554
Operational EBITDA
$ 111,103
$
30,211
$ 103,718
$ 133,929
(1)
See page 3 for definition of combined year.
36 |