Attached files
| file | filename |
|---|---|
| 8-K - FORM 8-K - UDR, Inc. | c02198e8vk.htm |
Exhibit 99.1

| Edgewater - San Francisco, CA Delancey at Shirlington - Arlington, VA The Belmont - Dallas, TX 989 Elements and Elements Too - Bellevue, WA NAREIT's Investor Forum - June 2010 |

| MD 7% DC 12% VA 9% FL 16% 6% 4% 2% 38% 2% 4% 28% 44% UDR Overview National Portfolio Concentrated in markets with low single-family home affordability and job growth ahead of national average 51,471 homes in 179 communities(2) Average monthly revenue of $1,144 per home compared to national average of $967 Leading Multifamily REIT NYSE: UDR 38 year track record of paying dividends S&P 400 Enterprise value - $6.5 billion(1) As of June 4, 2010. Includes all wholly-owned homes, homes in development and joint venture homes at 100%. Percentages shown on map indicate contribution of first quarter 2010 total same-store net operating income (NOI) |

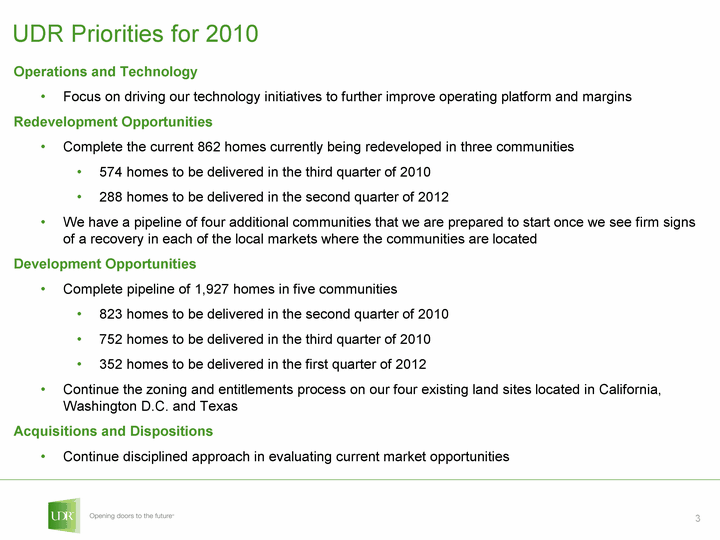
| UDR Priorities for 2010 Operations and Technology Focus on driving our technology initiatives to further improve operating platform and margins Redevelopment Opportunities Complete the current 862 homes currently being redeveloped in three communities 574 homes to be delivered in the third quarter of 2010 288 homes to be delivered in the second quarter of 2012 We have a pipeline of four additional communities that we are prepared to start once we see firm signs of a recovery in each of the local markets where the communities are located Development Opportunities Complete pipeline of 1,927 homes in five communities 823 homes to be delivered in the second quarter of 2010 752 homes to be delivered in the third quarter of 2010 352 homes to be delivered in the first quarter of 2012 Continue the zoning and entitlements process on our four existing land sites located in California, Washington D.C. and Texas Acquisitions and Dispositions Continue disciplined approach in evaluating current market opportunities |

| Continued Outperformance Versus Publicly Traded Peer Group Occupancy Increased 110 bps to 95.8% compared to 1st Quarter of 2009 Operating Margin Maintained operating margin of at least 66% for each of the last 12 quarters Revenue Monthly income per home of $1,144 Decreased by 3.1% versus peer average decline of 3.1% Expenses Decreased by 0.3% versus peer average increase of 2.2% NOI Down 4.4% versus peer average decline of 6.3% 2005 2006 2007 2008 2009 UDR Revenue Growth 0.038 0.06 0.05 0.036 -0.02 Peer Revenue Growth 0.039 0.06 0.047 0.027 -0.026 2005 2006 2007 2008 2009 UDR NOI Growth 0.034 0.086 0.07 0.038 -0.022 Peer NOI Growth 0.037 0.07 0.057 0.028 -0.045 1Q 2010 Same-Store Results 5-Year Same-Store Trends Peer group includes AEC, AIV, AVB, BRE, CLP, CPT, EQR, ESS, HME, MAA and PPS. |

| Rents Continue to Improve Percentage change in new and renewal lease rates compared to the expiring lease 2Q 2009 3Q 2009 4Q 2009 1Q 2010 4/1/2010 5/1/2010 New leases -0.071 -0.064 -0.076 -0.045 -0.02 -0.004 Renewal leases 0.002 -0.006 -0.006 0.002 0.01 0.013 Includes all stabilized homes. |

| Levering Technology to Enhance Operations Top rated website Social media: Facebook, Twitter, Flickr, YouTube Mobile apartment search applications for: iPhone, Android, BlackBerry and PalmPre Click-to-call mobile paid search Augmented social reality apartment search application for mobile devices Community initiatives: Multi-site sales teams Customer kiosks and mobile websites 24 X 7 "office hours" Call center Online renewal Our customers are consumers - we are able to reach more customers through our various business channels SOURCES SERVICES |

| Online Renewal Initiative Now providing residents the ability to renew their lease online A notification is sent via email alerting the customer of a renewal offer available on the resident portal (MyUDR.com) Once logged in to MyUDR.com the resident is able to choose one of the variable lease terms and may qualify for an incentive, if they renew within the incentive period (typically 14 days) The resident is then presented with a list of available upgrades for their home Lease is generated, signed and stored electronically Benefits of online renewal: Upgrades provide the opportunity to upsell resident as part of the renewal process Able to make better pricing decision by knowing customers' selection earlier in the renewal process Reduces administrative burden of the renewal process on the onsite team and allows them to focus on sales and service Initial results show customers prefer the convenience of renewing their lease electronically Creates all lease documents electronically - including signatures |

| Technology Platform Designed to Meet Customers' Demands Elements Too - Bellevue, WA Percentage of: May 2010 May 2010 Payments received via ACH Payments received via ACH 74% Service requests entered through MyUDR.com Service requests entered through MyUDR.com 74% Move-ins initiated via an Internet source Move-ins initiated via an Internet source 63% Renewals completed electronically Renewals completed electronically 4% UDR's full suite of mobile websites and apartment search applications encompasses over 90% of all mobile operating systems |

| Created value through redeveloping 4,108 homes over the last three years, with an average incremental investment of $43 thousand per home Transformational Redevelopment Capability Targeting "Forever Great" and Emerging Locations Positive neighborhood trends Proximity to quality employment Convenient to retail, recreation, and transportation hubs Markets with high barriers to entry Good site exposure and access Revenue Generating Impact Potential Opportunities to optimize unit mix and unit layouts to improve functionality Dated exterior appearance that can be improved Missing amenities or upgrades that can be added Outdated leasing facilities that can be updated or replaced Capturing excess density Market Upside Potential Adequate rent gap to justify investment in improvements Capacity to increase rents while remaining below new product levels Potential to improve resident profile Adopting "Green" Components Where Possible Before Redevelopment After Redevelopment Highlands of Marin, San Rafael, CA Highlands of Marin, San Rafael, CA |

| Development Current pipeline consists of five communities with an estimated cost of $333 million Meaningful contribution to NOI starting in the second half of 2010 Applying for LEED certifications on all current developments Will continue to research and evaluate sites that reinforce our low home affordability market strategy Continued strong lease-up velocity at all communities The Savoye - Addison, TX The Savoye - Addison, TX |

| The Portico at Silver Spring Metro Kuwait Finance House Joint Venture Acquired 151 homes in April for $43 million and financed the acquisition with a five-year $26 million secured interest-only mortgage at 4.5% |

| Strong Balance Sheet Financial profile as of May 31, 2010 The Whitmore - Arlington, VA In excess of $6 billion in assets(1) Total cash and credit capacity in excess of $730 million; over $3 billion of unencumbered assets available for additional liquidity Existing debt totals $3.4 billion, with weighted average rate of 4.4% and 5.6 years to maturity Investment grade rating from Standard & Poor's and Moody's Fixed charge coverage of 2.0x(2) Equity raised from "At the Market" equity program: Excludes depreciation. As of March 31, 2010. Through June 4, 2010. Price per share is equal to the weighted average net price. The Kennedy Building - Seattle, WA Period(3) Shares issued Net price per share(4) Net proceeds 2Q 2010 1.55M $19.58 $30.3M YTD 2010 5.91M $17.54 $103.6M Since inception 10.37M $16.52 $171.3M |

| Debt Maturities as of May 31, 2010 2010 2011 2012 2013 2014 2015 2016 2017 2018 Thereafter Fannie Mae Facilities - 50 175 35 - - 40 303 225 382 Medium Term Notes - - 100 123 313 325 83 - - 16 Mortgage - 48 86 37 65 18 63 71 - - Convertible Notes - 270 - - - - - - - - Construction Loans - 129 83 100 - - - - - - Term Loans - - 100 - - - - - - - Tax Exempt - - - - - - - - - 40 Line of Credit - - 133 - - - - - - - Percent of Total Debt - 15% 20% 9% 11% 10% 5% 11% 7% 13% Secured - 46% 51% 59% 17% 5% 55% 100% 100% 96% Unsecured - 54% 49% 41% 83% 95% 45% - - 4% Fixed Rate - $386 $410 $158 $378 $325 $83 $314 $225 $315 Rate - 4.4% 5.3% 6.1% 5.3% 5.3% 5.3% 4.7% 4.8% 5.3% Floating Rate - $111 $270 $137 - $18 $103 $60 - $123 Rate - 0.9% 2.1% 2.8% - 2.1% 2.6% 0.8% - 2.7% (3) Assumes all available extensions are executed. Included in fixed rate debt are variable rate debt instruments that have been fixed using interest rate swaps and can be reported as fixed rate debt under hedge accounting. $168M of the 4.00% convertible notes outstanding with a put option in January 2011 and $106M of the 3.625% convertible notes outstanding with a September 2011 maturity. |

| Forward-Looking Statement Certain statements made in this presentation may constitute "forward-looking statements." The words "expect," "intend," "believe," "anticipate," "likely," "will" and similar expressions generally identify forward-looking statements. These forward-looking statements are subject to risks and uncertainties which can cause actual results to differ materially from those currently anticipated, due to a number of factors, which include, but are not limited to, unfavorable changes in the apartment market, changing economic conditions, the impact of inflation/deflation on rental rates and property operating expenses, expectations concerning availability of capital and the stabilization of the capital markets, the impact of competition and competitive pricing, acquisitions or new developments not achieving anticipated results, delays in completing developments and lease-ups on schedule, expectations on job growth, home affordability and demand/supply ratio for multifamily housing, expectations concerning development and redevelopment activities, expectations on occupancy levels, expectations concerning the Vitruvian ParkSM project, expectations that automation will help grow net operating income, expectations on post-renovated stabilized annual operating income, expectations on annualized net operating income and other risk factors discussed in documents filed by the Company with the Securities and Exchange Commission from time to time, including the Company's Annual Report on Form 10-K and the Company's Quarterly Reports on Form 10-Q. Actual results may differ materially from those described in the forward-looking statements. These forward-looking statements and such risks, uncertainties and other factors speak only as of the date of this presentation, and the Company expressly disclaims any obligation or undertaking to update or revise any forward-looking statement contained herein, to reflect any change in the Company's expectations with regard thereto, or any other change in events, conditions or circumstances on which any such statement is based, except to the extent otherwise required by law. This presentation and these forward-looking statements include UDR's analysis and conclusions based in part on third party data and reflect UDR's judgment as of the date of these materials. UDR assumes no obligation to revise or update to reflect future events or circumstances. |

| ___________________________________________________________________ ___________________________________________________________________ ___________________________________________________________________ ___________________________________________________________________ ___________________________________________________________________ ___________________________________________________________________ ___________________________________________________________________ ___________________________________________________________________ ___________________________________________________________________ ___________________________________________________________________ Notes |

| Investor Relations Contact: H. Andrew Cantor acantor@udr.com (720) 283-6083 |
