Attached files
| file | filename |
|---|---|
| 8-K - 8K INVESTOR MEETINGS - PDC ENERGY, INC. | pdc8k20100608.htm |

NASDAQ:PETD
PETROLEUM DEVELOPMENT
CORPORATION
CORPORATION
Investor Meetings
June 2010

See Slide 2 regarding Forward Looking Statements
The following information contains forward-looking statements within the meaning of the Private Securities Litigation Reform Act
of 1995. These forward-looking statements are based on Management’s current expectations and beliefs, as well as a number
of assumptions concerning future events.
of 1995. These forward-looking statements are based on Management’s current expectations and beliefs, as well as a number
of assumptions concerning future events.
These statements are based on certain assumptions and analyses made by Management in light of its experience and its
perception of historical trends, current conditions and expected future developments as well as other factors it believes are
appropriate in the circumstances. However, whether actual results and developments will conform with Management’s
expectations and predictions is subject to a number of risks and uncertainties, general economic, market or business
conditions; the opportunities (or lack thereof) that may be presented to and pursued by Petroleum Development Corporation;
actions by competitors; changes in laws or regulations; and other factors, many of which are beyond the control of Petroleum
Development Corporation.
You are cautioned not to put undue reliance on such forward-looking statements because actual results may vary materially
from those expressed or implied, as more fully discussed in our safe harbor statements found in our SEC filings, including,
without limitation, the discussion under the heading “Risk Factors” in the Company’s 2009 annual report on Form 10-K and in
subsequent Form 10-Qs. All forward-looking statements are based on information available to Management on this date
and Petroleum Development Corporation assumes no obligation to, and expressly disclaims any obligation to, update
or revise any forward looking statements, whether as a result of new information, future events or otherwise.
The SEC permits oil and gas companies to disclose in their filings with the SEC proved reserves, probable reserves and
possible reserves. SEC regulations define “proved reserves” as those quantities of oil or gas which, by analysis of geosciences
and engineering data, can be estimated with reasonable certainty to be economically producible in future years from known
reservoirs under existing economic conditions, operating methods and government regulations; “probable reserves” as
unproved reserves which, together with proved reserves, are as likely as not to be recovered; and “possible reserves” as
unproved reserves which are less certain to be recovered than probable reserves. Estimates of probable and possible reserves
which may potentially be recoverable through additional drilling or recovery techniques are by nature more uncertain than
estimates of proved reserves and accordingly are subject to substantially greater risk of not actually being realized by the
Company. In addition, the Company’s reserves and production forecasts and expectations for future periods are dependent
upon many assumptions, including estimates of production decline rates from existing wells and the undertaking and outcome
of future drilling activity, which may be affected by significant commodity price declines or drilling cost increases.
This material also contains certain non-GAAP financial measures as defined under the Securities and Exchange Commission
rules.
rules.
Disclaimer
2

See Slide 2 regarding Forward Looking Statements
Table of Contents
• PDC Summary
• PDC 2010 Budget & Operational
Guidance
Guidance
• Recent Operational / Transactional
Update
Update
• PDC First Quarter 2010 Results
• Appendix
3

See Slide 2 regarding Forward Looking Statements
PDC SUMMARY
4

See Slide 2 regarding Forward Looking Statements
Reasons to Invest in PDC
• Long term track record of operational excellence
• Diversified operating basins with low risk predictable growth (over
2,200 projects in inventory)
2,200 projects in inventory)
• Emerging opportunity in the Marcellus Shale
• Strong balance sheet with capital available for value added
acquisitions, joint ventures, exploration and partnership
repurchases
acquisitions, joint ventures, exploration and partnership
repurchases
• Trade at discount to peers on operational and financial metrics
• Strong hedge positions that protect cash flow
• Company transitioning from a Partnership company to a more
traditional E&P company
traditional E&P company
5

See Slide 2 regarding Forward Looking Statements
(1) Appalachian Basin (Marcellus and Shallow Devonian) JV
(2) EBITDAX and Cash Flow estimates as per analyst consensus
(3) From 06/09 to 06/10
• Petroleum Development Corporation is an
independent oil and natural gas company
with operations primarily in the Rocky
Mountain region, Appalachian Basin and
Michigan Basin
independent oil and natural gas company
with operations primarily in the Rocky
Mountain region, Appalachian Basin and
Michigan Basin
• PDC was founded in 1969 in Bridgeport, WV
and is now headquartered in Denver, CO
and is now headquartered in Denver, CO
Enterprise Value
Capitalization
Corporate Profile
6
|
|
03/31/2009
|
03/31/2010
|
|
Share Price (06/09 and 06/10)
|
$18.11
|
$21.15
|
|
Diluted Share Outstanding (MM)
|
14.8
|
19.3
|
|
Market Capitalization ($MM)
|
$268
|
$408
|
|
Net debt total
|
382
|
233
|
|
Minority Interest
|
1
|
-
|
|
Enterprise Value
|
$650
|
$641
|
|
52-Week High ($/share) (3)
|
$74.08
|
$26.21
|
|
52-Week Low ($/share) (3)
|
$9.70
|
$12.88
|
Corporate Summary
|
|
03/31/2009
|
03/31/2010
|
|
Net Debt Total
|
$382
|
$233
|
|
Common Equity
|
507
|
515
|
|
Minority Interest (1)
|
1
|
-
|
|
Total Capitalization ($MM)
|
$890
|
$749
|
|
Debt Ratios:
|
|
|
|
Debt/EBITDAX (LTM) (2)
|
1.56x
|
1.33x
|
|
Senior Debt/EBITDAX (LTM) (2)
|
0.52x
|
1.02x
|
|
EBITDAX/ Interest Net (LTM)
(2) |
12.2x
|
5.4x
|
|
Debt/Book Cap
|
45%
|
33%
|
See Slide 2 regarding Forward Looking Statements
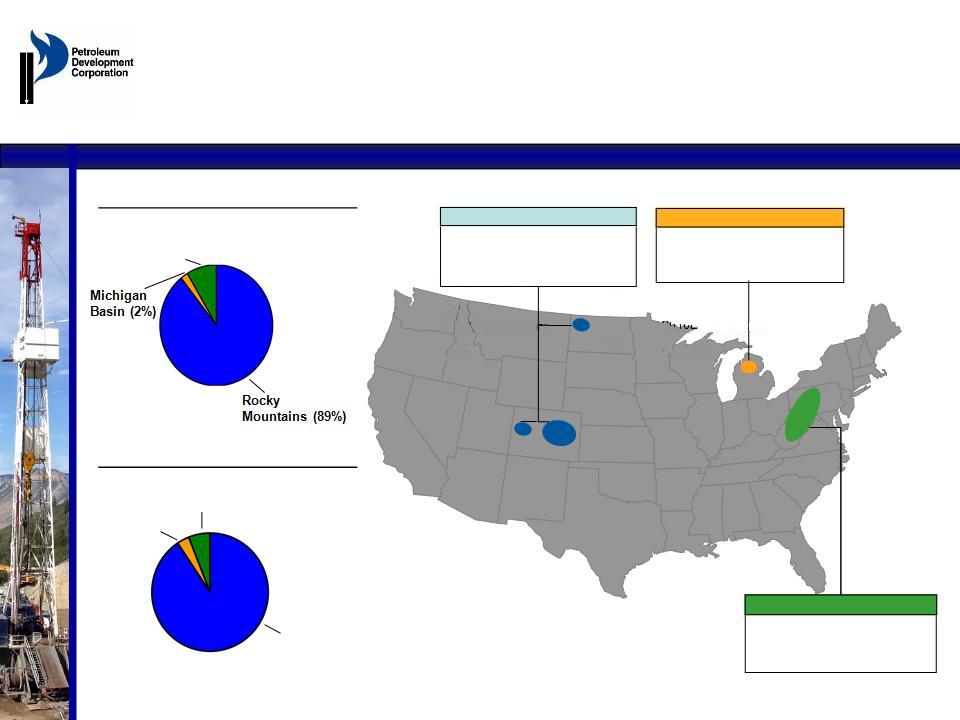
Core Operating Regions
See Slide 2 regarding Forward Looking Statements
2009 Proved Reserves: 641 Bcfe
2009 Production: 37.8 Bcfe
2010E Production: 31.2 Bcfe
Rocky Mountains
2009 Proved Reserves: 15 Bcfe
2009 Production: 1.4 Bcfe
2010E Production: 1.3 Bcfe
Michigan Basin
2009 Proved Reserves*: 61 Bcfe
2009 Production: 4.1 Bcfe
2010E Production: 3.2 Bcfe
Appalachian Basin
2009 Proved Reserves
717 Bcfe
Appalachian Basin (9%)*
2009 Production
43.3 Bcfe
Michigan
Basin (3%)
Basin (3%)
Appalachian Basin (9%)
Rocky
Mountains (87%)
Mountains (87%)
*Appalachian Basin includes 100% of PDC Mountaineer, LLC Reserves at Year-End 2009
7

See Slide 2 regarding Forward Looking Statements
PDC 2010 BUDGET &
OPERATIONAL GUIDANCE
OPERATIONAL GUIDANCE
8

See Slide 2 regarding Forward Looking Statements
Reserve Summary
at Year-End 2009
at Year-End 2009
753 Bcfe
Revisions &
Pricing
Adjustments
Pricing
Adjustments
Drops /
Scheduling
Adjustments
Scheduling
Adjustments
Production
Adds /
Extensions
Extensions
Revisions, LOE
Improvements,
Operations
Improvements,
Operations
See Slide 2 regarding Forward Looking Statements
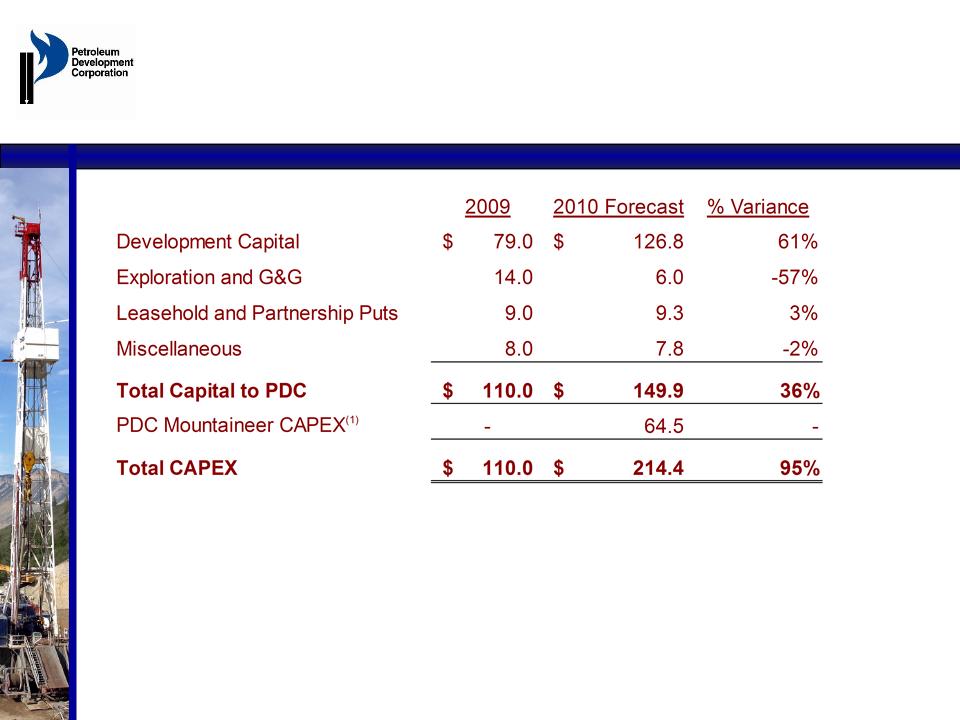
Capital Budget
10
(1) Subject to bi-annual approval by PDC Mountaineer Board of Directors. 2010 CAPEX to be funded by PDC Mountaineer J.V partner. PDC
has no capital investment commitment for 2010.
has no capital investment commitment for 2010.
PDC has announced that it will be updating its 2010 budgets, and production estimates at its 7/15/10 Analyst Day.
($ in millions)
See Slide 2 regarding Forward Looking Statements
11
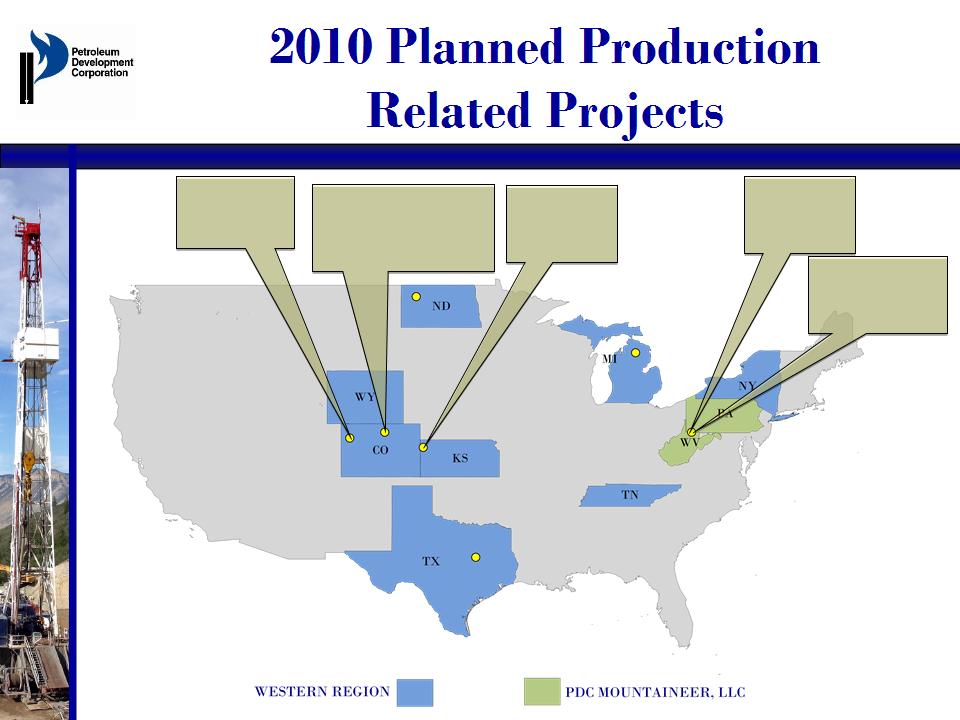
Marcellus
•16 Verticals
•10
Horizontals
Horizontals
Shallow Devonian
•50 Recompletes
•29 Workovers
NECO
•25 New Drills
•50
Workovers
Workovers
Wattenberg
•180 New Drills
-138 Operated New Drills
-42 Non-Op New Drills
•12 Refracs/Recompletes
Piceance
•21 New Drills
-11 Mesa
-10 Valley
See Slide 2 regarding Forward Looking Statements
PDC has over 2,200 identified
projects in Inventory
projects in Inventory
See Slide 2 regarding Forward Looking Statements
12
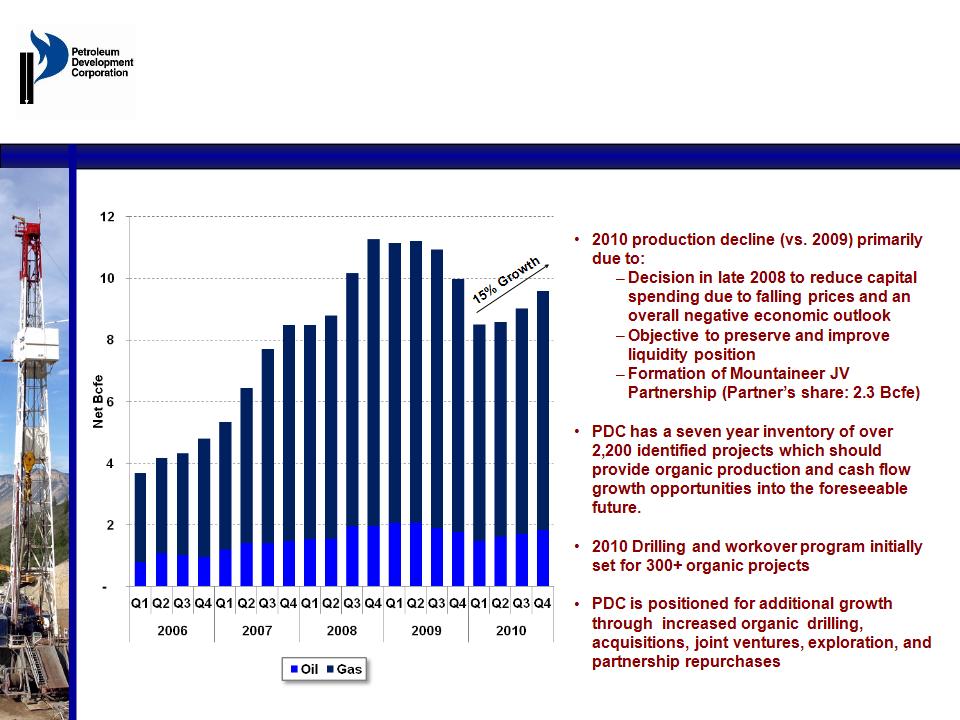
Quarterly Net Production
2010 Production Guidance
E
See Slide 2 regarding Forward Looking Statements
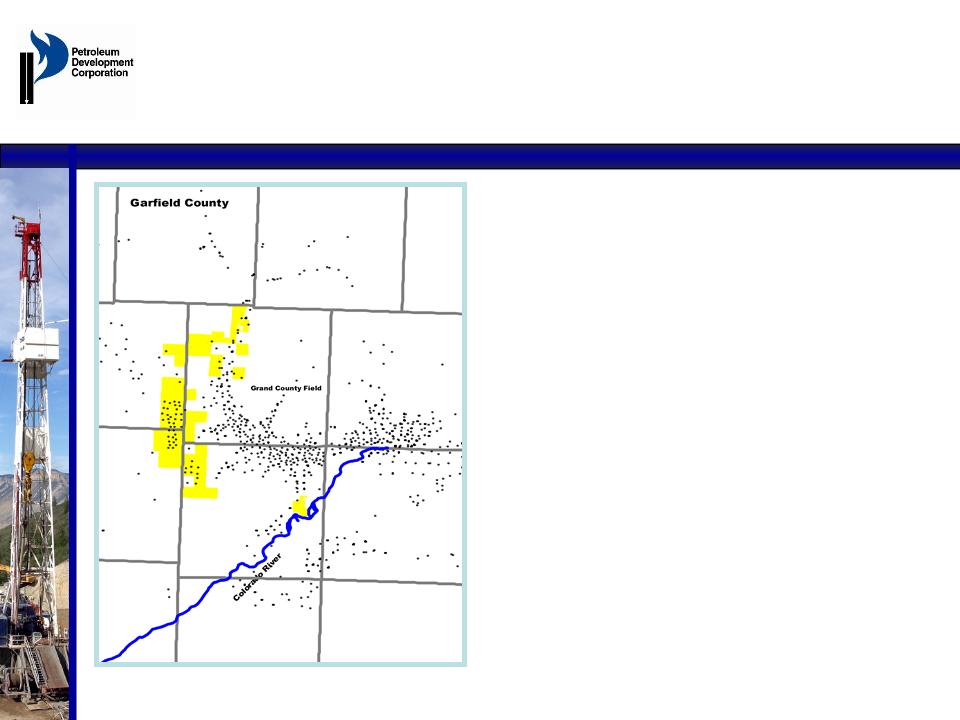
Piceance Basin
at December 31, 2009
at December 31, 2009
• Gross operated wells 288
• Undeveloped acreage 5,300
• Undeveloped, gross,
10-acre locations 433
10-acre locations 433
• 362 total net PDC
• Number of net remaining locations
- PUD 251
- Probable 97
- Possible 14
13
See Slide 2 regarding Forward Looking Statements
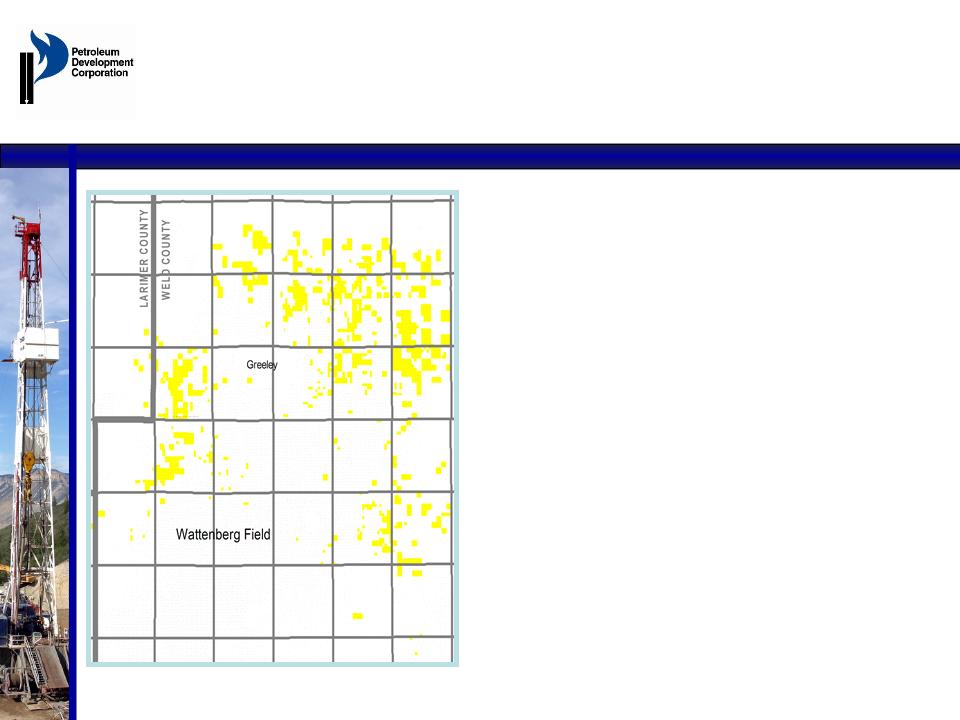
Wattenberg Field
at December 31, 2009
at December 31, 2009
• Gross Operated wells 1,410
• Undeveloped acreage 19,400
• Undeveloped, gross, locations 1,533
• 831 total net PDC
- PUD 373
- Probable 316
- Possible 142
14
See Slide 2 regarding Forward Looking Statements
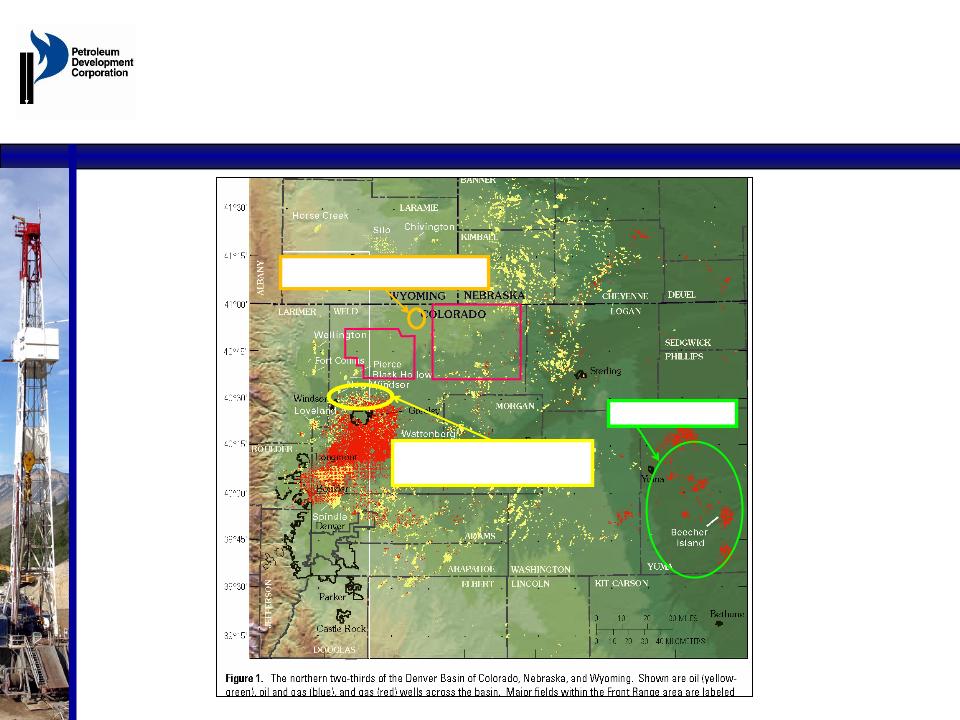
PDC Undeveloped Northern
Wattenberg Acreage Area
Wattenberg Acreage Area
EOG Niobrara Horizontal Well plus 39
Drilling Permits Approved & Pending
Drilling Permits Approved & Pending
PDC Undeveloped Acreage in
Northern Wattenberg Area.
Approximately 19,400 acres.
Northern Wattenberg Area.
Approximately 19,400 acres.
PDC NECO Area: Niobrara
Biogenic Gas Production
Biogenic Gas Production
Pawnee
National
Grasslands
National
Grasslands
Pawnee National
Grasslands
Grasslands
Base Map Source
USGS
USGS
15

See Slide 2 regarding Forward Looking Statements
Wattenberg Field:
Niobrara Formation Overview
Niobrara Formation Overview
• Covers the bulk of the Rocky Mountain region and has been being
developed in the DJ Basin for 30+ years on a veritcal basis with
mixed results
developed in the DJ Basin for 30+ years on a veritcal basis with
mixed results
• Economics improved in the late 90’s with modern hydraulic
fracturing technology for vertical development
fracturing technology for vertical development
• PDC developed and enhanced a geologic model which
incorporates recent horizontal drilling and production results by
EOG Resources and Noble
incorporates recent horizontal drilling and production results by
EOG Resources and Noble
• In Q2 2010 PDC purchased the 5,500 net acre “Krieger Prospect”
as an anticipated horizontal project for approximately $1,000 per
acre
as an anticipated horizontal project for approximately $1,000 per
acre
• Spacing request, hearing and permit submittal should occur by the
end of July 2010
end of July 2010
• Expect to spud and achieve first production Q4 2010
• Anticipate drilling 4-6 horizontal wells in 2011 and will continue to
evaluate farm-in opportunities
evaluate farm-in opportunities
16
See Slide 2 regarding Forward Looking Statements
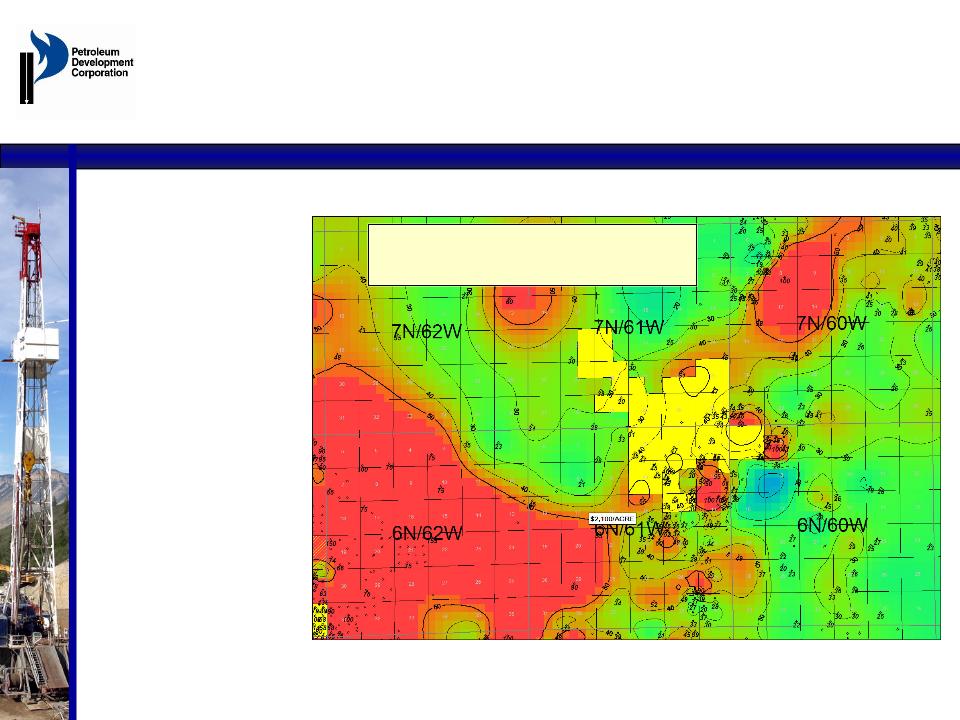
PDC Krieger Horizontal
Niobrara Drilling Prospect
Niobrara Drilling Prospect
17
Mapped on maximum Deep Rt in Niobrara B Zone.
CI = 10 ohm up to 50 ohm. Blue is lowest Rt, red highest Rt.
All above 50 ohm undifferentiated & shown in red.
PDC leases in yellow.
• Mapped on a greater
than 50 ohm Rt fairway
trending northeast from
Wattenberg Field.
than 50 ohm Rt fairway
trending northeast from
Wattenberg Field.
•Existing 3D Seismic helps
confirm wellbore planning.
confirm wellbore planning.
• Approximately 5,500
acres net to PDC.
acres net to PDC.
• Anticipate 12+ horizontal
well locations based on
640 acre spacing.
well locations based on
640 acre spacing.
• Drill initial well in 4th
Quarter 2010.
Quarter 2010.
• Vertical Niobrara tests in
the area provide evidence
of oil in the Niobrara
system.
the area provide evidence
of oil in the Niobrara
system.
• Offset full State section
sold for $2,100 per acre in
May 2010 lease sale.
sold for $2,100 per acre in
May 2010 lease sale.
See Slide 2 regarding Forward Looking Statements
18
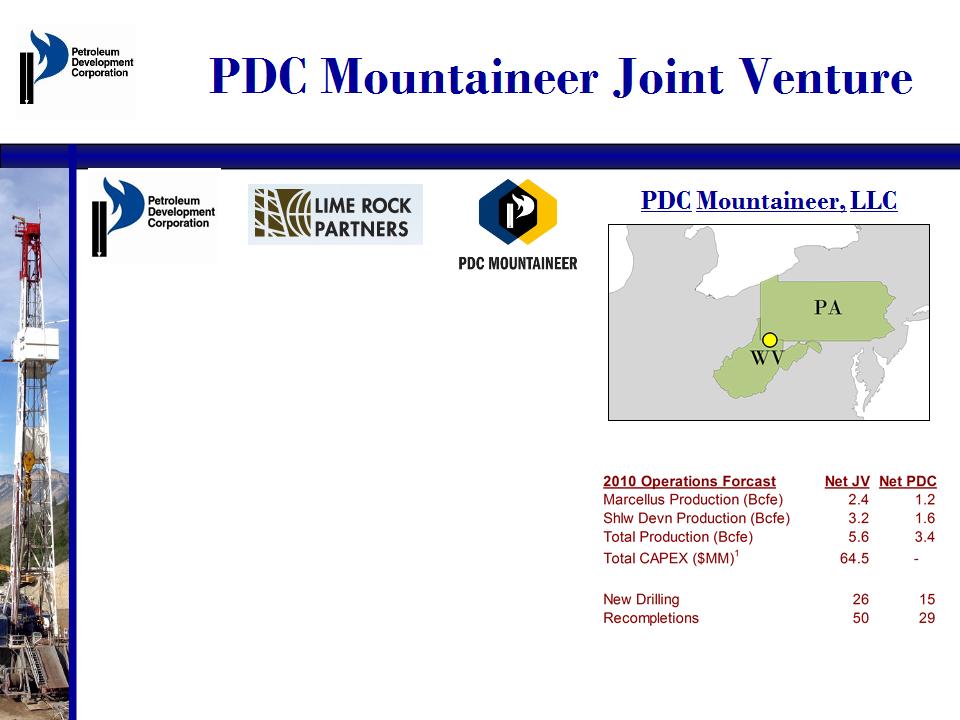
• $158 MM Appalachian JV formed with Lime Rock Partners
(“LRP”) effective 10/1/09; PDC contributed Marcellus
acreage and Shallow Devonian production and acreage.
(“LRP”) effective 10/1/09; PDC contributed Marcellus
acreage and Shallow Devonian production and acreage.
• Provided PDC an alternative capital source as LRP funded
PDC $45 MM upon closing, and a commitment to invest the
first $68.5 MM of capital investment. LRP will become a
50% partner once it satisfies it’s capital investment
obligation.
PDC $45 MM upon closing, and a commitment to invest the
first $68.5 MM of capital investment. LRP will become a
50% partner once it satisfies it’s capital investment
obligation.
• Provides opportunity to accelerate development of the JV
assets.
assets.
• PDC’s ability to raise capital through the JV structure,
provides financial flexibility and opportunities to increase
development capital spending and /or pursue acquisitions.
provides financial flexibility and opportunities to increase
development capital spending and /or pursue acquisitions.
• The JV is governed and managed by a Board of Directors
comprised of equal representation by PDC and LRP. PDC
will manage the operations of the JV.
comprised of equal representation by PDC and LRP. PDC
will manage the operations of the JV.
+
=
Marcellus & Devonian Shallow
(1) 2010 CAPEX to be funded by PDC Mountaineer partner, PDC has no capital investment obligation.
See Slide 2 regarding Forward Looking Statements
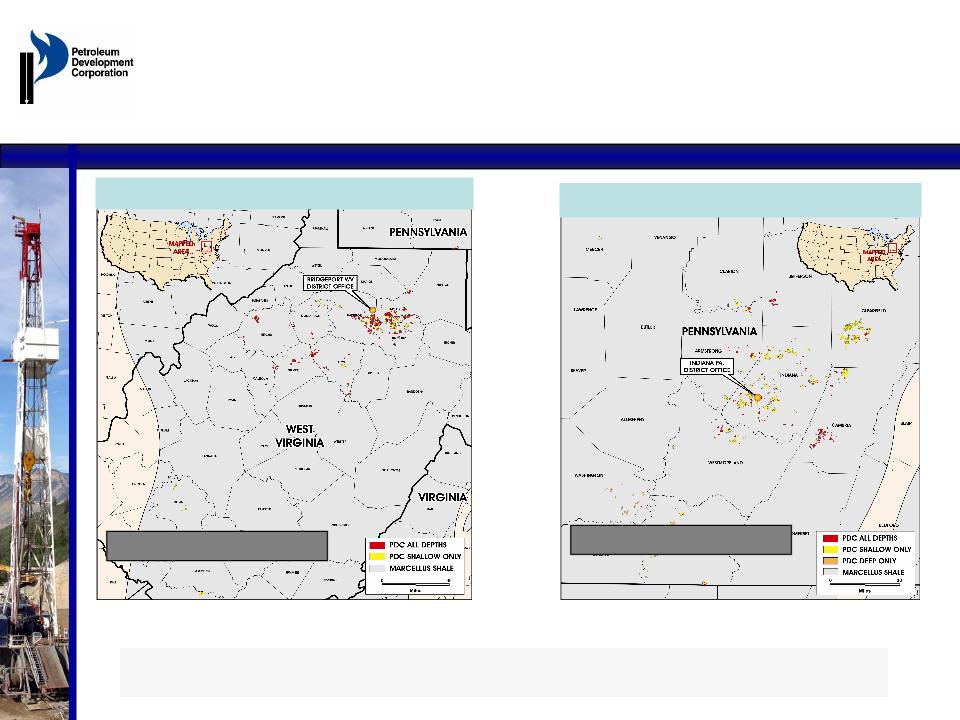
Pennsylvania Acreage Map
15,219 Net Marcellus Rights
42,354 Net Marcellus Rights
West Virginia Acreage Map
Appalachian Basin Acreage -
Marcellus Shale
|
|
HBP NET
ACRES |
UNDEVELOPED
NET ACRES
|
TOTAL
NET ACRES
|
AVERAGE
NRI |
|
As of 2-22-2010
|
PA: 9,981
WV: 38,395
|
PA: 5,238
WV: 3,959
|
PA: 15,219
WV: 42,354
|
82.80%
86.70%
|
19

See Slide 2 regarding Forward Looking Statements
Income Statement and
Cash Flow Analysis
Cash Flow Analysis
20
1) Other income: income from gas marketing activities, well ops and pipeline income
• Despite 17.6% reduction in
production in 2010 versus 2009,
the Company budgeted 2010 net
income versus a loss in 2009 and
budgeted strong year over year
adjusted cash flow from
operations.
production in 2010 versus 2009,
the Company budgeted 2010 net
income versus a loss in 2009 and
budgeted strong year over year
adjusted cash flow from
operations.
• Year-over-year change in net
income and cash flow from
operations were primarily due to
improved:
income and cash flow from
operations were primarily due to
improved:
• Price realizations
• Capital efficiency
• G&A expense - non-
recurrence of 2009 one time
items.
recurrence of 2009 one time
items.
|
($ in MM except per share data)
|
2009
Actual
|
2010
Low
|
2010
High
|
|
Bcfe
|
43.3
|
35.7
|
35.7
|
|
|
|
|
|
|
Total O&G Revenue
|
$286
|
$239
|
$258
|
|
Other Income(1)
|
14
|
12
|
12
|
|
Total Revenue
|
$300
|
$251
|
$270
|
|
O&G Production & Well Ops Cost
|
65
|
59
|
63
|
|
G&A Expense
|
54
|
43
|
39
|
|
Adjusted EBITDAX
|
$181
|
$150
|
$169
|
|
|
|
|
|
|
Exploration Expense/Dry Hole Cost
|
23
|
9
|
8
|
|
DD&A
|
131
|
116
|
116
|
|
Net Interest Expense
|
37
|
34
|
34
|
|
Taxes/ (Benefit)
|
(7)
|
(4)
|
4
|
|
Adjusted Net Income (loss)
|
($3)
|
($6)
|
$7
|
|
|
|
|
|
|
Stock-based Compensation
|
6
|
7
|
5
|
|
DD&A
|
131
|
116
|
116
|
|
Exploratory/Dry Hole Cost
|
1
|
2
|
1
|
|
Other
|
35
|
28
|
28
|
|
Adjusted Cash Flows From Operations
|
$170
|
$148
|
$158
|
|
Weighted # of share outstanding
|
16,448
|
19,300
|
19,300
|
|
CFFO/Share
|
$10.35
|
$7.67
|
$8.17
|
|
EPS
|
($0.18)
|
($0.32)
|
$0.34
|
See Slide 2 regarding Forward Looking Statements
Oil and Gas Hedges
(1) Based on 12/31/09 PDP curve (i.e., may represent 50% or less of actual production for the future year)
(2) Based on forward pricing curves as of 3/31/2010
(3) Blended price for forecasted production at hedged and at forward prices
Continued focus on hedging enabled the Company to protect its cash flow, capital programs,
and organic drilling economics from commodity price fluctuations
and organic drilling economics from commodity price fluctuations
• Realized gains of $108MM
• Substantial hedge positions through 2013 via swaps (2010-2011) and collars (2012-2013) at solid historical
commodity price levels should continue to provide on-going protection
commodity price levels should continue to provide on-going protection
• Price sensitivity of 2010’s budget has been significantly mitigated. Variation of $1.00/Mcfe for natural gas
and $10.00/bbl for oil results in less than a 5% variation in cash flow from operations
and $10.00/bbl for oil results in less than a 5% variation in cash flow from operations
21
|
As of April 30, 2010
|
|
2010
|
2011
|
2012
|
2013
|
|
Weighted Average Hedge Price (Mcfe) (1)
|
|||||
|
With Floors
|
$7.44
|
$6.83
|
$6.39
|
$6.37
|
|
|
With Ceilings
|
$8.22
|
$7.64
|
$7.96
|
$8.20
|
|
|
% of Forecasted Production(1)
|
77%
|
73%
|
59%
|
58%
|
|
|
Weighted Avg Forward Price(2)
|
$5.94
|
$6.76
|
$7.11
|
$7.30
|
|
|
Weighted Avg Price of Forecasted
Production(3) |
$7.10
|
$6.81
|
$6.68
|
$6.77
|
|
See Slide 2 regarding Forward Looking Statements
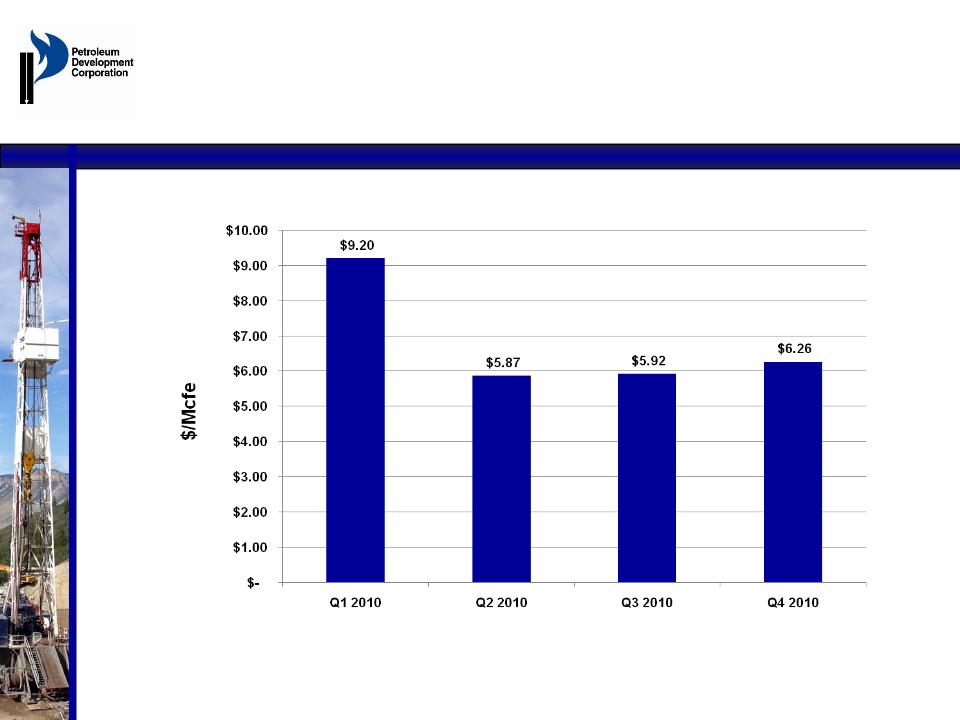
Quarterly Realized Hedge Price
(as of 4/30/2010)
(as of 4/30/2010)
22
• Weighted average for full-year 2010 is $6.81/Mcfe
• Excludes Michigan Divestiture & Permian acquisitions
See Slide 2 regarding Forward Looking Statements
RECENT OPERATIONAL /
TRANSACTIONAL UPDATE
TRANSACTIONAL UPDATE
23

See Slide 2 regarding Forward Looking Statements
PDC Wolfberry Acquisition in
West Texas Key Highlights
West Texas Key Highlights
24
• Acquired producing assets from private seller in Wolfberry
Trend for $45 mm plus PDC’s producing Michigan Gas assets
valued by the seller at $30 million
Trend for $45 mm plus PDC’s producing Michigan Gas assets
valued by the seller at $30 million
• Includes 72 wells on approximately 8,300 net acres
• Should add approximately 900 boe/d over the next 12 months
and strong multi-year production growth is projected
and strong multi-year production growth is projected
• Proved plus probable (2P) reserve add of approximately 8.5
million BOE (70% oil)
million BOE (70% oil)
• Effective date of transaction is May 1, 2010 with projected
closing date of July 30, 2010
closing date of July 30, 2010
• Acquisition driven by US onshore basin study findings
• Must identify asset team to execute development plan and
grow the position
grow the position

See Slide 2 regarding Forward Looking Statements
PDC Wolfberry Acquisition
Wolfberry Acreage Overview with Surrounding Activity
Wolfberry Acreage Overview with Surrounding Activity
25
Key Development Areas
• Roy Parks area
• Mabee areas
• Ratliff area
• Other Permian
Development Potential
• 120 Wolfberry locations
• Anticipate 1 rig program starting 4Q
2010
2010
• Multiple re-completion
targets
targets
• Production optimization
Key Offset Operators
• Concho
• Devon
• Cabot
• Endeavor

See Slide 2 regarding Forward Looking Statements
Partnership Purchases:
Three-Year Plan
Three-Year Plan
• Limited Partners’ non-operated interest is typically 60-80% of
certain PDC operated wells (Rockies principally)
certain PDC operated wells (Rockies principally)
• 28 Limited Partnerships have net reserves of approximately 125
Bcfe and net production of approximately 25 MMcfe/d owned by
the Limited Partners
Bcfe and net production of approximately 25 MMcfe/d owned by
the Limited Partners
• PDC strategy to purchase Limited Partners’ interest over next
three years
three years
– Production and reserve adds in existing operated core acreage
– Reduction/optimization of internal G&A costs
– 9 SEC compliant partnerships represent over 60% of net reserves
and over 75% of total cash flows owned by the Limited Partners
and over 75% of total cash flows owned by the Limited Partners
– Elimination of Limited Partnerships through repurchases would
finalize PDC’s transition to a traditionally capitalized E&P company
finalize PDC’s transition to a traditionally capitalized E&P company
26

See Slide 2 regarding Forward Looking Statements
IncreasingValue in
2010 and Beyond
2010 and Beyond
• Additional Organic Drilling - Possibly beginning 2nd half 2010
- Ramp up in Piceance and Wattenberg
- Focus on enhancing Piceance economics
• Marcellus JV - drilling 26 horizontal and vertical wells in 2010
- Large operator in WV achieved reserves of 3.6 Bcfe per
horizontal well near PDC acreage
horizontal well near PDC acreage
- Over 150 Marcellus permits issued in WV counties surrounding
PDC position
PDC position
• Partnership Purchases - Three Year Plan
- Non-operated interests in certain existing PDC operated
Wattenberg and Piceance Assets
Wattenberg and Piceance Assets
• Acquisitions - Asset and Small Corporate
- Anticipate substantial A&D deal flow in 2010
• Exploration - Moderate Risk Resource Plays
- Niobrara Wattenberg; Mancos Shale Piceance; Bakken; Others
27

See Slide 2 regarding Forward Looking Statements
28
Peer Group: BBG, BRY, COG, CRZO, GDP, PVA, ROSE

See Slide 2 regarding Forward Looking Statements
• Strong Focus on creating Shareholder value
• Strong core asset base with improved drilling economics
• Marcellus Shale JV with Lime Rock partners provides potential
catalyst for strong production and cash flow growth
catalyst for strong production and cash flow growth
• Evaluating potential acquisition, joint venture, and exploration
opportunities which could provide value-added growth
opportunities which could provide value-added growth
• Strong balance sheet with liquidity of ~$250 million
• Experienced and highly effective management team
• PDC is undervalued and poised for growth
Summary
29

See Slide 2 regarding Forward Looking Statements
PDC FIRST QUARTER
2010 RESULTS
2010 RESULTS
30

See Slide 2 regarding Forward Looking Statements
First Quarter 2010 Highlights
31
• Net income of $23.7 million, or $1.23 per diluted share
• Gas and oil revenues up 52% over same period 2009 on Q1
2010 realized prices of $9.20 per Mcfe over Q1 2009 realized
prices of $7.08 per Mcfe
2010 realized prices of $9.20 per Mcfe over Q1 2009 realized
prices of $7.08 per Mcfe
• Adjusted cash flow of $49.3 million, or $2.56 per diluted share
• Q1 2010 adjusted cash flow up approximately $10 million over
same period 2009 on 20% lower volumes
same period 2009 on 20% lower volumes
• Production of 9.1 Bcfe, 7% above Q1 guidance of 8.5 Bcfe
• Drilled 38.6 net wells vs. 24.9 net wells in Q1 2009
• Liquidity improved to $254 million

See Slide 2 regarding Forward Looking Statements
2010 Q1 Operations Highlights
• Quarterly production exceeded budget by 7%
• Integrated $10MM Wattenberg acquisition
– Suncor preferential right
• Marcellus
– Drilled first horizontal well with completion pending
– Drilling second horizontal well
• Wattenberg
– Major gas system operator is installing pipe and compression that
will reduce line pressure and may further enhance production
will reduce line pressure and may further enhance production
– Completion practices continue to improve
– Second rig reached efficiency very quickly
• Piceance
– Fit for purpose rig achieving new level of drilling pace
– Anticipating permit of water disposal well in next 30 days
32
See Slide 2 regarding Forward Looking Statements
Lifting Costs
33
|
Area
|
Full Year
2008 Actual |
Full Year
2009 Actual |
Q1 2010
Actual
|
|
Direct Costs ($/Mcfe)
|
$0.84
|
$0.59
|
$0.75
|
|
Indirect Costs ($/Mcfe)
|
$0.23
|
$0.24
|
$0.29
|
|
Total Lifting Cost ($/Mcfe)
|
$1.07
|
$0.83
|
$1.04
|
|
Production (MMcfe/d)
|
106
|
119
|
101
|
• Q1 2010 per unit costs increased as a result of:
• Winter operations
• Decreased production
• EH&S expenses
• Location and road maintenance
• Water hauling and disposal

See Slide 2 regarding Forward Looking Statements
Summary Financial Results
(1) O&G operating margin is defined as O&G revenue less O&G production and well operations costs.
(2) See appendix for GAAP reconciliation of Adjusted Cash Flow and Adjusted EBITDA, respectively.
34
|
|
Three Months Ended
|
|
|
March 31,
|
||
|
($ in millions)
|
2010
|
2009
|
|
O&G revenues
|
$60.4
|
$39.7
|
|
O&G production & well operations costs
|
$15.7
|
$16.4
|
|
O&G operating margin(1)
|
$44.7
|
$23.3
|
|
Adjusted cash flow from operations(2)
|
$49.3
|
$39.7
|
|
Adjusted EBITDA(2)
|
$53.7
|
$46.2
|
|
DD&A
|
$28.4
|
$34.4
|
|
G&A
|
$10.7
|
$12.1
|
See Slide 2 regarding Forward Looking Statements
Summary Financial Results
|
|
Three Months Ended
March 31, |
|
|
(in millions except per share data)
|
2010
|
2009
|
|
Income (loss) from operations
|
$45.7
|
($1.6)
|
|
Net Income (loss) attributable to
shareholders |
$23.7
|
($5.7)
|
|
Diluted earnings (loss) per share attributable
to shareholders |
$1.23
|
($0.38)
|
|
|
Three Months Ended
March 31, |
|
|
|
2010
|
2009
|
|
Adjusted net income attributable to
shareholders(1) |
$10.9
|
$4.1
|
|
Adjusted earnings per share attributable to
shareholders(1) |
$0.57
|
$0.27
|
35
(1) See appendix for GAAP reconciliation of Adjusted Net Income.

See Slide 2 regarding Forward Looking Statements
APPENDIX
36

See Slide 2 regarding Forward Looking Statements
Acreage Inventory
|
Area
|
Lease Gross
Acres |
PDC Net Acres
|
Net Developed
Acres |
Net Undeveloped
Acres |
State
|
|
Grand Valley
|
8,000
|
8,000
|
2,700
|
5,300
|
Colorado
|
|
Wattenberg
|
72,200
|
64,900
|
45,500
|
19,400
|
Colorado
|
|
NECO
|
127,100
|
105,100
|
19,600
|
85,500
|
Colorado/Kansas
|
|
Michigan
|
26,800
|
23,300
|
14,800
|
8,500
|
Michigan
|
|
New York
|
18,700
|
15,900
|
0
|
15,900
|
New York
|
|
North Dakota
|
66,800
|
30,200
|
4,600
|
25,600
|
North Dakota
|
|
Appalachian Basin
|
120,900
|
117,600
|
106,800
|
10,800
|
WV / PA
|
|
Wyoming
|
19,500
|
19,300
|
100
|
19,200
|
Wyoming
|
|
Texas Barnett
|
8,900
|
6,000
|
400
|
5,600
|
Texas
|
|
Total
|
468,900
|
390,300
|
194,500
|
195,800
|
|
|
|
|
|
PDC TOTAL NET
|
390,300
|
|
37

See Slide 2 regarding Forward Looking Statements
Proved Reserves/Bcfe
by Area at Year-End 2009
by Area at Year-End 2009
38
|
Area
|
2008
|
2009
|
2008
|
2009
|
2008
|
2009
|
2008
|
2009
|
|
Wattenberg
|
79
|
89
|
1
|
1
|
119
|
140
|
199
|
230
|
|
Piceance
|
107
|
103
|
6
|
0
|
260
|
275
|
373
|
378
|
|
NECO
|
40
|
31
|
3
|
0
|
5
|
0
|
48
|
31
|
|
Appalachia
|
53
|
42
|
21
|
13
|
39
|
6
|
113
|
61
|
|
Other
|
20
|
16
|
0
|
1
|
0
|
0
|
20
|
17
|
|
TOTAL
|
299
|
281
|
31
|
15
|
423
|
421
|
753
|
717*
|
|
% Total Proved
|
40%
|
39%
|
4%
|
2%
|
56%
|
59%
|
100%
|
100%
|
Bcfe = One billion cubic feet of natural gas equivalent.
* Using year-end spot pricing methodology, as was used at year-end 2008, total reported reserves would have been 811 Bcfe.
See Slide 2 regarding Forward Looking Statements
3P Reserves(1)/Bcfe
by Area at Year-End 2009
by Area at Year-End 2009
39
|
Proved + Probable
|
||||||
|
Area
|
2008
|
2009
|
2008
|
2009
|
2008
|
2009
|
|
Wattenberg
|
199
|
230
|
236
|
305
|
241
|
332
|
|
Piceance
|
373
|
378
|
486
|
449
|
538
|
465
|
|
NECO
|
48
|
31
|
57
|
31
|
74
|
31
|
|
Appalachia
|
113
|
61
|
126
|
113
|
136
|
145
|
|
Other
|
20
|
17
|
20
|
17
|
20
|
17
|
|
TOTAL
|
753
|
717
|
925
|
915
|
1,009
|
990
|
Bcfe = One billion cubic feet of natural gas equivalent.
(1) 3P estimates are non-SEC.
See Slide 2 regarding Forward Looking Statements
Production/Bcfe by Area
40
|
Area
|
2008
|
2009
|
% Increase/
(Decrease)
|
2010E
|
% Increase/
(Decrease)
|
|
Wattenberg
|
15.4
|
16.3
|
6%
|
14.1
|
-13%
|
|
Piceance
|
12.5
|
15.8
|
26%
|
11.9
|
-25%
|
|
NECO
|
5.0
|
5.3
|
6%
|
4.6
|
-11%
|
|
Appalachia
|
3.9
|
4.1
|
5%
|
3.4
|
-17%
|
|
Other (ND, TX, WY, MI)
|
1.9
|
1.8
|
5%
|
1.7
|
-11%
|
|
TOTAL
|
38.7
|
43.3
|
12%
|
35.7
|
-18%
|
Bcfe = One billion cubic feet of natural gas equivalent.
See Slide 2 regarding Forward Looking Statements
41
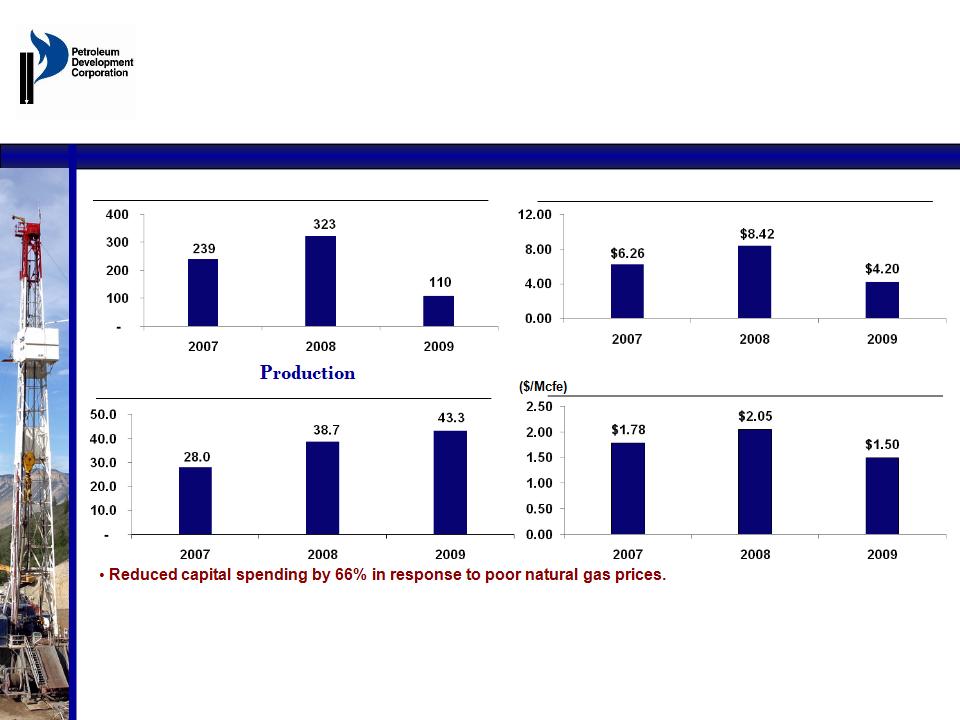
2009 Metrics
Natural Gas Equivalent(1)
Natural Gas Equivalent(1)
Oil & Gas Production and Well
Operations Costs(2)
Operations Costs(2)
(Bcfe)
($/Mcfe)
($MM)
Capital Spending
• Increased production by 12% and reduced L.O.E $/Mcfe by just under 30%.
• Improved L.O.E $/Mcfe should be sustainable beyond 2009 and should improve incremental capital investment
returns.
returns.
(1) Average Sales Price excluding gain/loss on derivatives
(2) Includes direct and indirect well expenses, production taxes, and overhead and other production expenses.
See Slide 2 regarding Forward Looking Statements
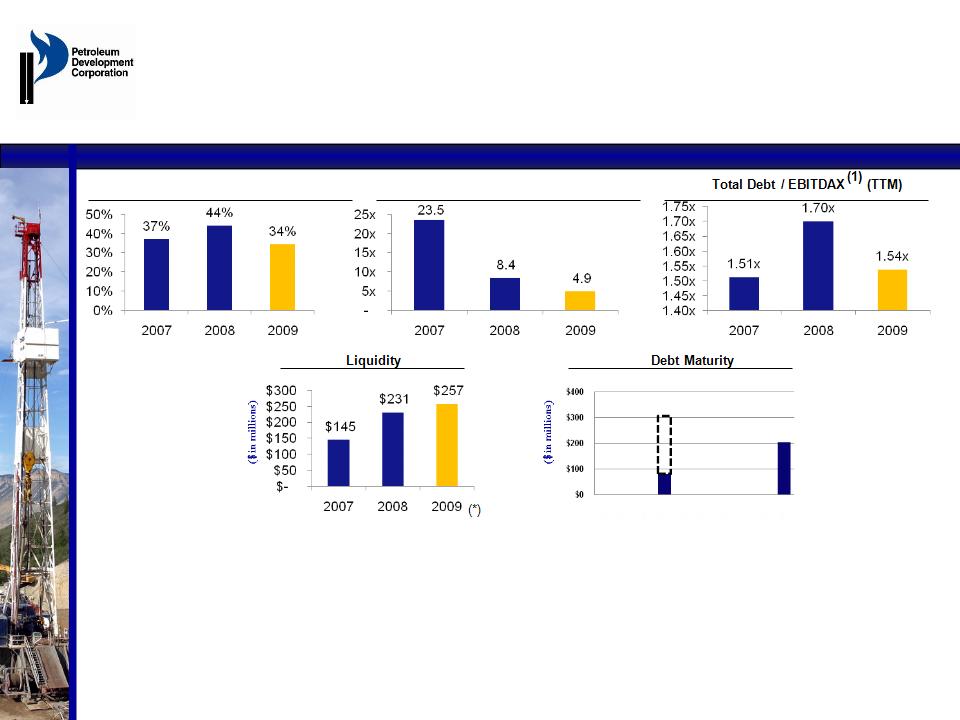
2009 Credit Ratios
Total Debt / Capital Base
(%)
(1) EBITDAX: Earnings before Interest, Taxes, Depreciation, Depletion and Amortization , unrealized hedge gains/losses, and Exploration Expense.
EBITDAX (1)/ Interest, net (TTM)
2009
2010
2011
2012
2013
2014
2015
2016
2017
2018
• Reduced capital spending and operating costs improvements resulted in substantial available liquidity
and improvement in leverage and coverage measures
and improvement in leverage and coverage measures
• ~$50MM equity raise, and ~$160MM PDC and Lime Rock Partners joint venture to develop Marcellus
Shale and Shallow Devonian assets, reflected the company’s ability to access alternative capital
markets, and improve liquidity, leverage and coverage measures
Shale and Shallow Devonian assets, reflected the company’s ability to access alternative capital
markets, and improve liquidity, leverage and coverage measures
* Liquidity excludes $18.7 million L.C.
42
$305
$203
x
x
x
$80
See Slide 2 regarding Forward Looking Statements
2009 Adjusted Net
Income Reconciliation
Income Reconciliation
43
(1) Includes natural gas marketing activities.
|
|
Year Ended
|
|
|
December 31,
|
||
|
($ in millions, except per share data)
|
2009
|
2008
|
|
Net Income (loss) attributable to shareholders
|
($79.3)
|
$113.3
|
|
Unrealized loss (gain) on derivatives, net (1)
|
116.6
|
(117.5)
|
|
Provision for underpayment of gas sales
|
2.7
|
4.0
|
|
Tax effect of above adjustment
|
(43.0)
|
39.9
|
|
Adjusted Net Income (loss) attributable to
shareholders |
($2.9)
|
$39.7
|
|
Weighted average diluted shares outstanding
|
16,448
|
14,848
|
|
Adjusted diluted earnings (loss) per share
|
($0.18)
|
$2.67
|
See Slide 2 regarding Forward Looking Statements
2009 Adjusted Cash
Flow Reconciliation
Flow Reconciliation
44
|
|
Year Ended
|
|
|
December 31,
|
||
|
($ in millions, except per share data)
|
2009
|
2008
|
|
Net Cash provided by operating activities
|
$143.9
|
$139.1
|
|
Changes in assets and liabilities related to
operations |
26.3
|
60.8
|
|
Adjusted cash flow from operations
|
$170.2
|
$199.9
|
|
Weighted average diluted shares outstanding
|
16,448
|
14,848
|
|
Adjusted cash flow per share
|
$10.35
|
$13.46
|
See Slide 2 regarding Forward Looking Statements
2009 Adjusted
EBITDA Reconciliation
EBITDA Reconciliation
(1) Includes natural gas marketing activities.
45
|
|
Year Ended
|
|
|
December 31,
|
||
|
($ in millions, except per share data)
|
2009
|
2008
|
|
Net Income (loss) attributable to shareholders
|
($79.3)
|
$113.3
|
|
Unrealized loss (gain) on derivatives, net (1)
|
116.6
|
(117.5)
|
|
Interest, net
|
37.0
|
27.5
|
|
Income taxes expense (benefit)
|
(45.6)
|
61.5
|
|
Depreciation, depletion & amortization
|
131.0
|
104.6
|
|
Adjusted EBITDA
|
$159.7
|
$189.4
|
|
Weighted average diluted shares outstanding
|
16,448
|
14,848
|
|
Adjusted EBITDA per share
|
$9.71
|
$12.76
|
See Slide 2 regarding Forward Looking Statements
Q1 2010 Adjusted
Net Income Reconciliation
Net Income Reconciliation
46
(1) Includes natural gas marketing activities.
|
|
Three Months Ended
|
|
|
March 31,
|
||
|
(in millions, except per share data)
|
2010
|
2009
|
|
Net income (loss) attributable to shareholders
|
$23.7
|
($5.7)
|
|
Unrealized loss (gain) on derivatives, net (1)
|
(20.5)
|
13.2
|
|
Provision for underpayment of gas sales
|
-
|
2.6
|
|
Tax effect of above adjustments
|
7.7
|
(6.0)
|
|
Adjusted net income attributable to shareholders
|
$10.9
|
$4.1
|
|
Weighted average diluted shares outstanding
|
19.3
|
14.8
|
|
Adjusted diluted earnings per share
|
$0.57
|
$0.27
|
* Amounts may not foot due to rounding.
See Slide 2 regarding Forward Looking Statements
Q1 2010 Adjusted
Cash Flow Reconciliation
Cash Flow Reconciliation
47
|
|
Three Months Ended
|
|
|
March 31,
|
||
|
(in millions, except per share data)
|
2010
|
2009
|
|
Net cash provided by operating activities
|
$51.3
|
$35.9
|
|
Changes in assets and liabilities related to
operations |
(2.0)
|
3.9
|
|
Adjusted cash flow from operations
|
$49.3
|
$39.7
|
* Amounts may not foot due to rounding.
See Slide 2 regarding Forward Looking Statements
Q1 2010 Adjusted
EBITDA Reconciliation
EBITDA Reconciliation
(1) Includes natural gas marketing activities.
48
|
|
Three Months Ended
|
|
|
March 31,
|
||
|
(in millions, except per share data)
|
2010
|
2009
|
|
Net income (loss) attributable to shareholders
|
$23.7
|
($5.7)
|
|
Unrealized loss (gain) on derivatives, net(1)
|
(20.5)
|
13.2
|
|
Interest expense, net
|
7.8
|
8.4
|
|
Income tax expense (benefit)
|
14.3
|
(4.0)
|
|
Depreciation, depletion & amortization
|
28.4
|
34.4
|
|
Adjusted EBITDA
|
$53.7
|
$46.2
|
|
Weighted average diluted shares outstanding
|
19.3
|
14.8
|
|
Adjusted EBITDA per share
|
$2.78
|
$3.12
|
* Amounts may not foot due to rounding.

NASDAQ:PETD
PETROLEUM DEVELOPMENT
CORPORATION
CORPORATION
Investor Meetings
June 2010