Attached files
| file | filename |
|---|---|
| 8-K - 8-K - CommunitySouth Financial CORP | a10-11732_18k.htm |
Exhibit 99.1
|
|
[LOGO] |
|
|
Forward-Looking Statements Certain statements included in this presentation, other than statements of historical fact, are “forward-looking statements.” The words “anticipate,” “believe,” “estimate,” “expect,” “intend,” “may,” “plan,” “will,” “would,” “could,” “should,” “guidance,” “potential,” “continue,” “project,” “forecast,” “confident,” and similar expressions are typically used to identify forward-looking statements. These forward-looking statements include, among others, statements regarding (1) our belief that we have identified all of our problem assets, (2) our ability to maintain our liquidity position, (3) our net interest margin (4) our growth opportunities and ability to capitalize on them, and (5) our ability to implement cost savings initiatives to improve efficiency. These statements are based on assumptions and assessments made by management in light of their experience and their perception of historical trends, current conditions, expected future developments, and other factors they believe to be appropriate. Any forward-looking statements are not guarantees of our future performance and are subject to risks and uncertainties and may be affected by various factors that may cause actual results, developments, and business decisions to differ materially from those in the forward-looking statements. Some of the factors that may cause actual results, developments, and business decisions to differ materially from those contemplated by such forward-looking statements include: (i) competitive pressures among depository and other financial institutions may increase significantly and have an effect on pricing, spending, third-party relationships and revenues; (ii) the strength of the United States economy in general and the strength of the local economies in which we conduct our operations may be different than expected resulting in, among other things, a deterioration in the credit quality or a reduced demand for credit, including the resultant effect on our loan portfolio and allowance for loan losses; (iii) the rate of delinquencies and amounts of charge-offs, the level of allowance for loan loss, the rates of loan growth, or adverse changes in asset quality in our loan portfolio, which may result in increased credit risk-related losses and expenses; (iv) legislative and regulatory changes, including changes in banking, securities and tax laws and regulations and their application by our regulators; and (v) adverse conditions in the stock market, the public debt market and other capital markets (including changes in interest rate conditions) could have a negative impact on our company. Additional factors that could cause our results to differ materially from those described in the forward-looking statements can be found in our reports (such as Annual Reports on Form 10-K, Quarterly Reports on Form 10-Q and Current Reports on Form 8-K) filed with the SEC and available at the SEC’s Internet site (http://www.sec.gov). We can give no assurance that any of the events anticipated by the forward-looking statements will occur or, if any of them does, what impact they will have on our results of operations and financial condition. We disclaim any intent or obligation to publicly update or revise any forward-looking statements, regardless of whether new information becomes available, future developments occur or otherwise. |
|
|
Today’s Agenda Company Overview 2009 Results & Recent Developments Deposit Franchise Loan Portfolio Improving Asset Quality Plans Financial Highlights Profitability Improvement Initiatives Leveraging Our Strengths |
|
|
Company Overview CommunitySouth Financial Corporation opened in January 2005 $441 million asset bank with 94 employees as of March 31, 2010 Six branches and full-service mortgage and investment divisions Positioned as a niche solution to the regional / money center banks Built great reputation in Upstate over the first five years Voted Best Bank in Pickens County two years in a row (2008, 2009) Named to the Top 25 Fastest Growing Companies in South Carolina (2007 and 2008 - SC Chamber/Elliott Davis) Awarded the 2010 Pacesetters Award from the United Way of Pickens County for philanthropic efforts This information relates to our customer-focused business strategy and our achievements in customer satisfaction and not whether an investment in our Company is a good investment decision. |
|
|
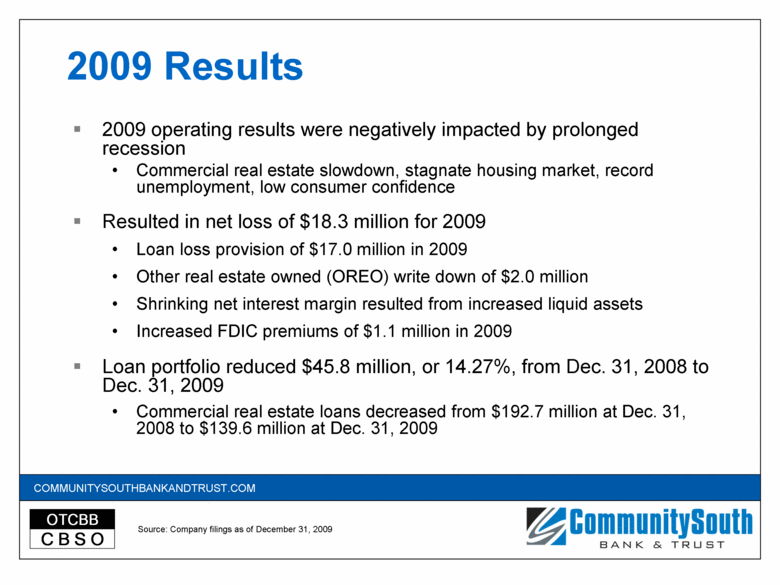
2009 Results 2009 operating results were negatively impacted by prolonged recession Commercial real estate slowdown, stagnate housing market, record unemployment, low consumer confidence Resulted in net loss of $18.3 million for 2009 Loan loss provision of $17.0 million in 2009 Other real estate owned (OREO) write down of $2.0 million Shrinking net interest margin resulted from increased liquid assets Increased FDIC premiums of $1.1 million in 2009 Loan portfolio reduced $45.8 million, or 14.27%, from Dec. 31, 2008 to Dec. 31, 2009 Commercial real estate loans decreased from $192.7 million at Dec. 31, 2008 to $139.6 million at Dec. 31, 2009 Source: Company filings as of December 31, 2009 |
|
|
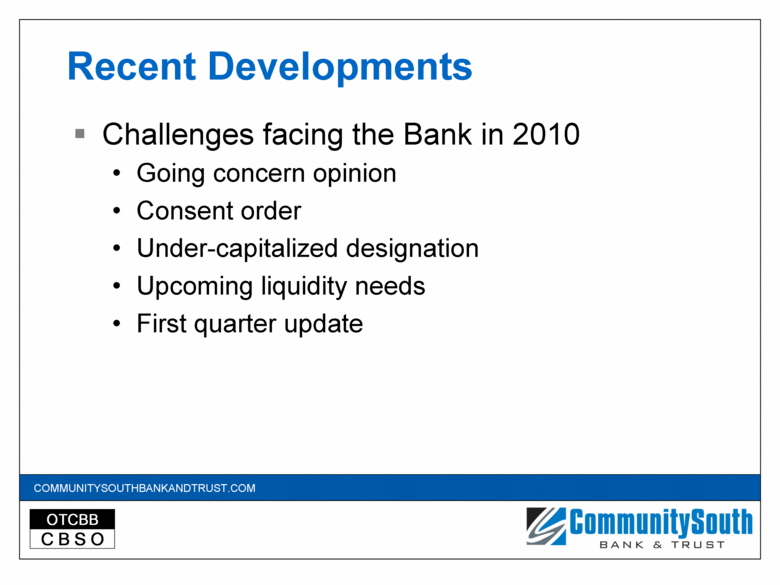
Recent Developments Challenges facing the Bank in 2010 Going concern opinion Consent order Under-capitalized designation Upcoming liquidity needs First quarter update |
|
|
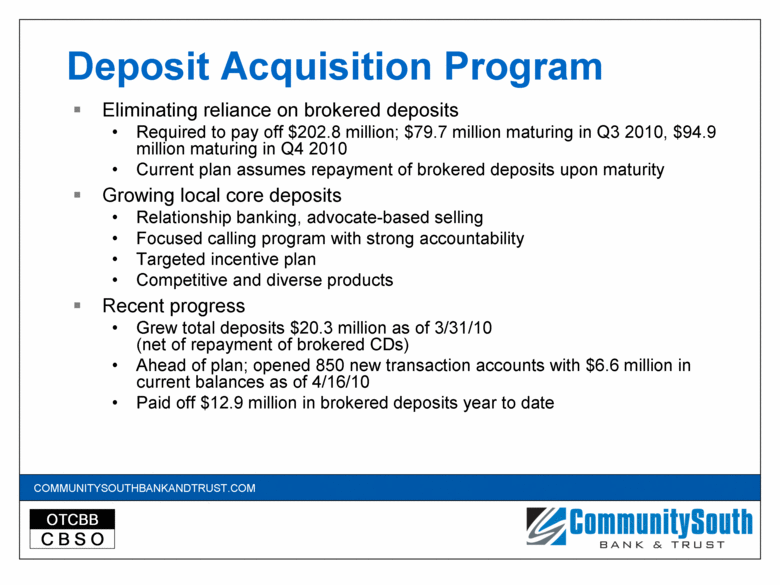
Deposit Acquisition Program Eliminating reliance on brokered deposits Required to pay off $202.8 million; $79.7 million maturing in Q3 2010, $94.9 million maturing in Q4 2010 Current plan assumes repayment of brokered deposits upon maturity Growing local core deposits Relationship banking, advocate-based selling Focused calling program with strong accountability Targeted incentive plan Competitive and diverse products Recent progress Grew total deposits $20.3 million as of 3/31/10 (net of repayment of brokered CDs) Ahead of plan; opened 850 new transaction accounts with $6.6 million in current balances as of 4/16/10 Paid off $12.9 million in brokered deposits year to date |
|
|
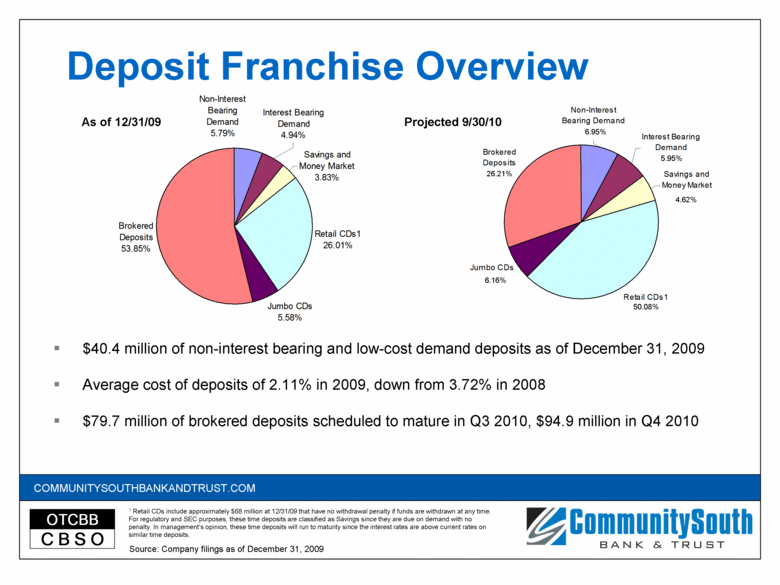
Deposit Franchise Overview $40.4 million of non-interest bearing and low-cost demand deposits as of December 31, 2009 Average cost of deposits of 2.11% in 2009, down from 3.72% in 2008 $79.7 million of brokered deposits scheduled to mature in Q3 2010, $94.9 million in Q4 2010 Source: Company filings as of December 31, 2009 1 Retail CDs include approximately $68 million at 12/31/09 that have no withdrawal penalty if funds are withdrawn at any time. For regulatory and SEC purposes, these time deposits are classified as Savings since they are due on demand with no penalty. In management’s opinion, these time deposits will run to maturity since the interest rates are above current rates on similar time deposits. As of 12/31/09 6.95% 5.95% 4.62% 50.08% 6.16% 26.21% Projected 9/30/10 Retail CDs1 26.01% Jumbo CDs 5.58% Brokered Deposits 53.85% Non-Interest Bearing Demand 5.79% Interest Bearing Demand 4.94% Savings and Money Market 3.83% |
|
|
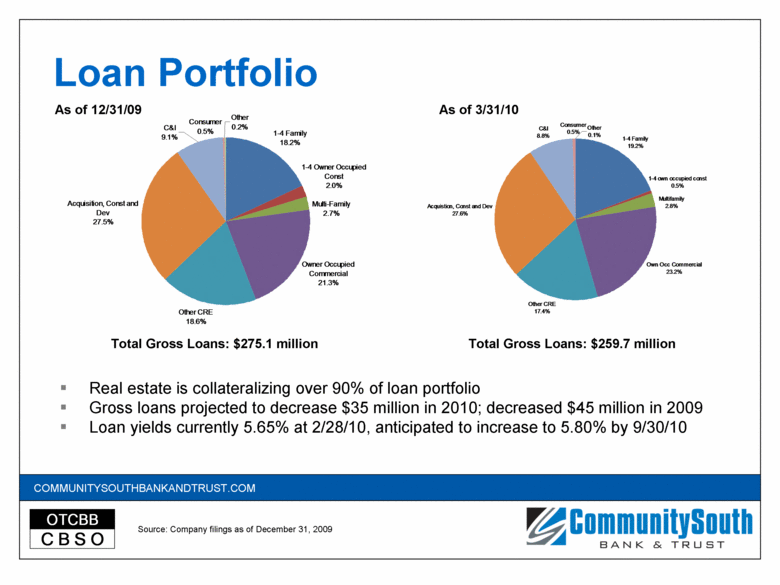
Loan Portfolio Total Gross Loans: $275.1 million As of 3/31/10 Total Gross Loans: $259.7 million Real estate is collateralizing over 90% of loan portfolio Gross loans projected to decrease $35 million in 2010; decreased $45 million in 2009 Loan yields currently 5.65% at 2/28/10, anticipated to increase to 5.80% by 9/30/10 As of 12/31/09 Source: Company filings as of December 31, 2009 1-4 Family 18.2% Owner Occupied Commercial 21.3% Other CRE 18.6% Acquisition, Const and Dev 27.5% Consumer 0.5% Other 0.2% C&I 9.1% 1-4 Owner Occupied Const 2.0% Multi-Family 2.7% 1-4 Family 19.2% Own Occ Commercial 23.2% Other CRE 17.4% Acquistion, Const and Dev 27.6% C&I 8.8% Consumer 0.5% Other 0.1% 1-4 own occupied const 0.5% Multifamily 2.8% |
|
|
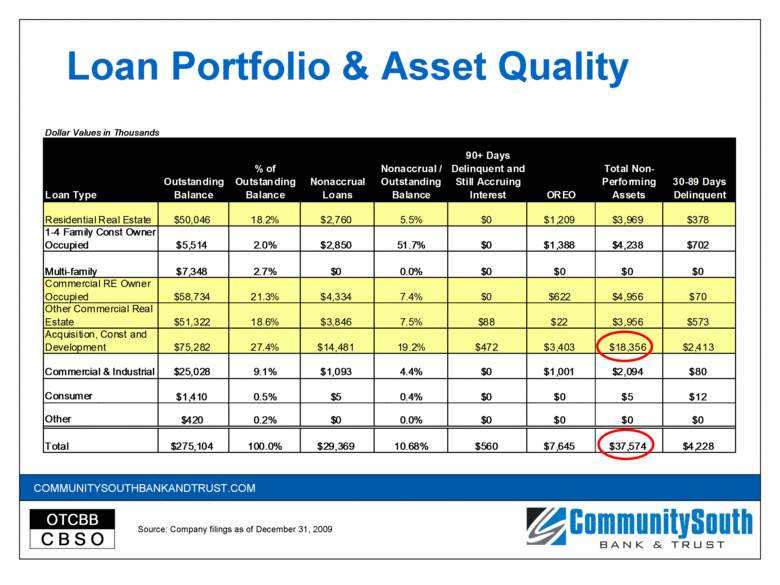
Loan Portfolio & Asset Quality Source: Company filings as of December 31, 2009 Loan Type Outstanding Balance % of Outstanding Balance Nonaccrual Loans Nonaccrual / Outstanding Balance 90+ Days Delinquent and Still Accruing Interest OREO Total Non- Performing Assets 30-89 Days Delinquent Residential Real Estate $50,046 18.2% $2,760 5.5% $0 $1,209 $3,969 $378 1-4 Family Const Owner Occupied $5,514 2.0% $2,850 51.7% $0 $1,388 $4,238 $702 Multi-family $7,348 2.7% $0 0.0% $0 $0 $0 $0 Commercial RE Owner Occupied $58,734 21.3% $4,334 7.4% $0 $622 $4,956 $70 Other Commercial Real Estate $51,322 18.6% $3,846 7.5% $88 $22 $3,956 $573 Acquisition, Const and Development $75,282 27.4% $14,481 19.2% $472 $3,403 $18,356 $2,413 Commercial & Industrial $25,028 9.1% $1,093 4.4% $0 $1,001 $2,094 $80 Consumer $1,410 0.5% $5 0.4% $0 $0 $5 $12 Other $420 0.2% $0 0.0% $0 $0 $0 $0 Total $275,104 100.0% $29,369 10.68% $560 $7,645 $37,574 $4,228 Dollar Values in Thousands |
|
|
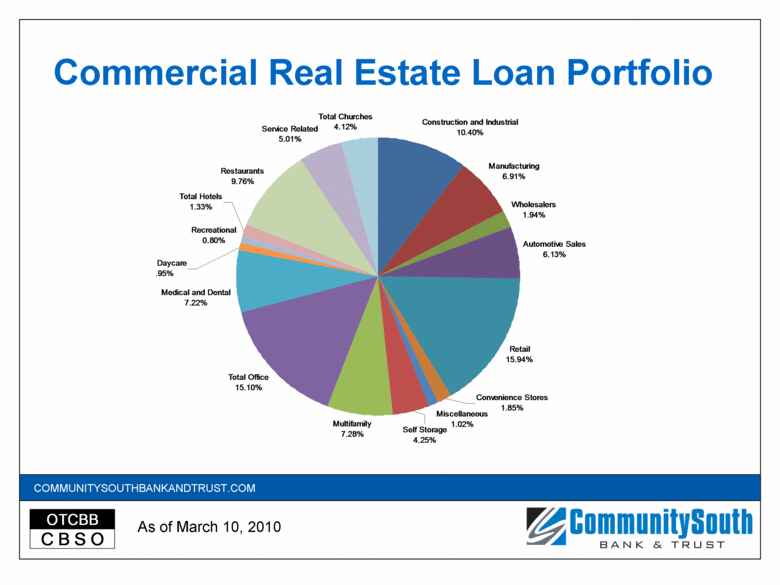
Commercial Real Estate Loan Portfolio As of March 10, 2010 Construction and Industrial 10.40% Manufacturing 6.91% Wholesalers 1.94% Automotive Sales 6.13% Retail 15.94% Miscellaneous 1.02% Multifamily 7.28% Total Office 15.10% Recreational 0.80% Restaurants 9.76% Service Related 5.01% Total Churches 4.12% Medical and Dental 7.22% Total Hotels 1.33% Total Daycare 0.95% Convenience Stores 1.85% Self Storage 4.25% |
|
|
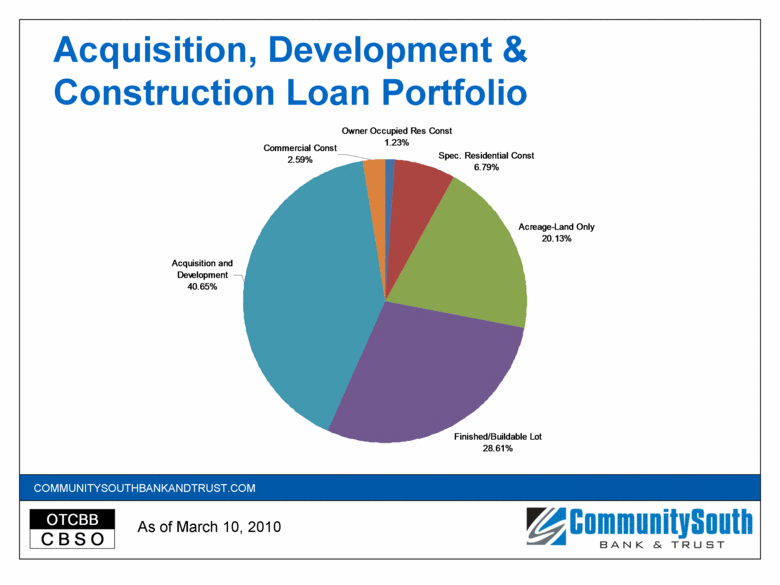
As of March 10, 2010 Acquisition, Development & Construction Loan Portfolio Acreage-Land Only 20.13% Finished/Buildable Lot 28.61% Acquisition and Development 40.65% Owner Occupied Res Const 1.23% Commercial Const 2.59% Spec. Residential Const 6.79% |
|
|
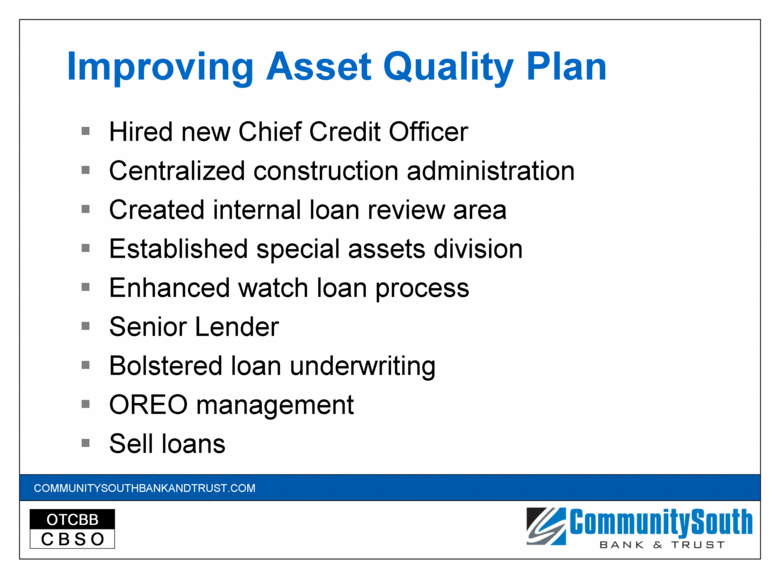
Improving Asset Quality Plan Hired new Chief Credit Officer Centralized construction administration Created internal loan review area Established special assets division Enhanced watch loan process Senior Lender Bolstered loan underwriting OREO management Sell loans |
|
|
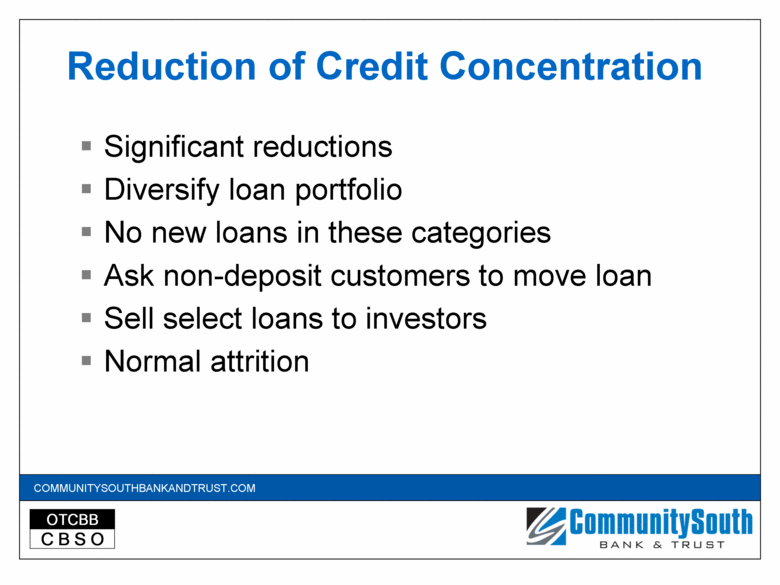
Reduction of Credit Concentration Significant reductions Diversify loan portfolio No new loans in these categories Ask non-deposit customers to move loan Sell select loans to investors Normal attrition |
|
|
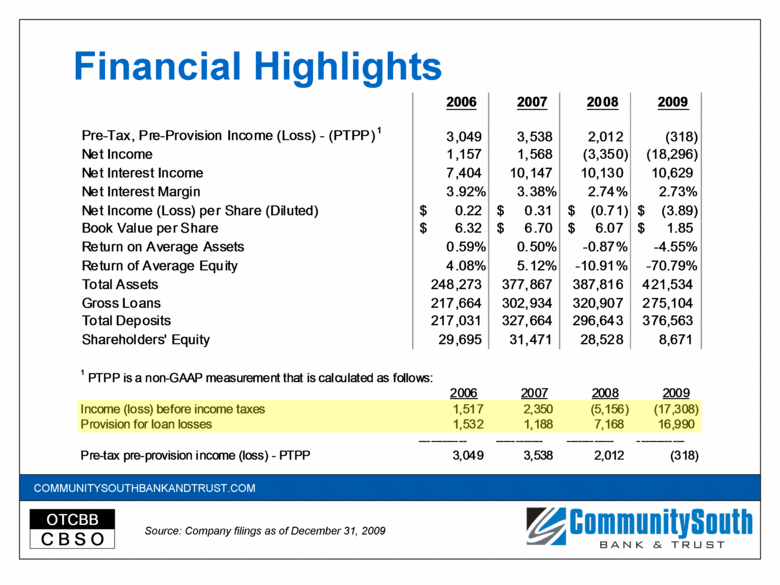
Financial Highlights Source: Company filings as of December 31, 2009 2006 2007 2008 2009 Pre-Tax, Pre-Provision Income (Loss) - (PTPP) 1 3,049 3,538 2,012 (318) Net Income 1,157 1,568 (3,350) (18,296) Net Interest Income 7,404 10,147 10,130 10,629 Net Interest Margin 3.92% 3.38% 2.74% 2.73% Net Income (Loss) per Share (Diluted) 0.22 $ 0.31 $ (0.71) $ (3.89) $ Book Value per Share 6.32 $ 6.70 $ 6.07 $ 1.85 $ Return on Average Assets 0.59% 0.50% -0.87% -4.55% Return of Average Equity 4.08% 5.12% -10.91% -70.79% Total Assets 248,273 377,867 387,816 421,534 Gross Loans 217,664 302,934 320,907 275,104 Total Deposits 217,031 327,664 296,643 376,563 Shareholders' Equity 29,695 31,471 28,528 8,671 1 PTPP is a non-GAAP measurement that is calculated as follows: 2006 2007 2008 2009 Income (loss) before income taxes 1,517 2,350 (5,156) (17,308) Provision for loan losses 1,532 1,188 7,168 16,990 ------------ ------------ ------------ ------------ Pre-tax pre-provision income (loss) - PTPP 3,049 3,538 2,012 (318) |
|
|
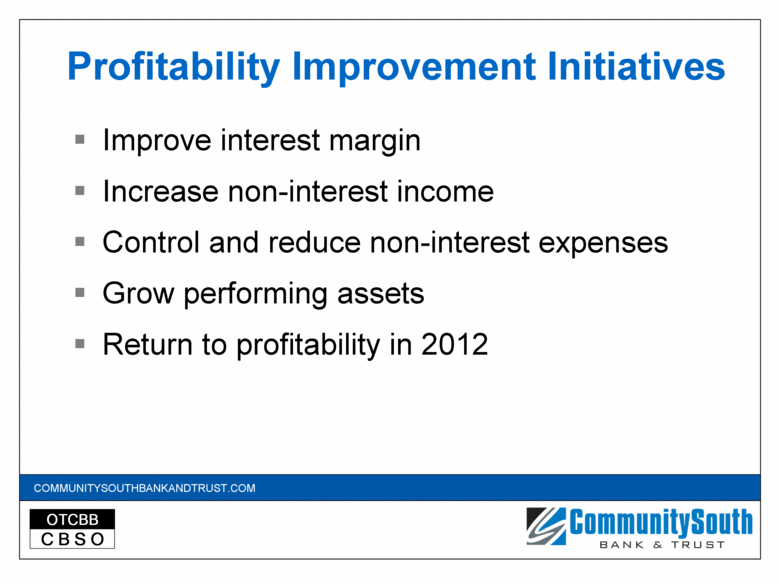
Profitability Improvement Initiatives Improve interest margin Increase non-interest income Control and reduce non-interest expenses Grow performing assets Return to profitability in 2012 |
|
|
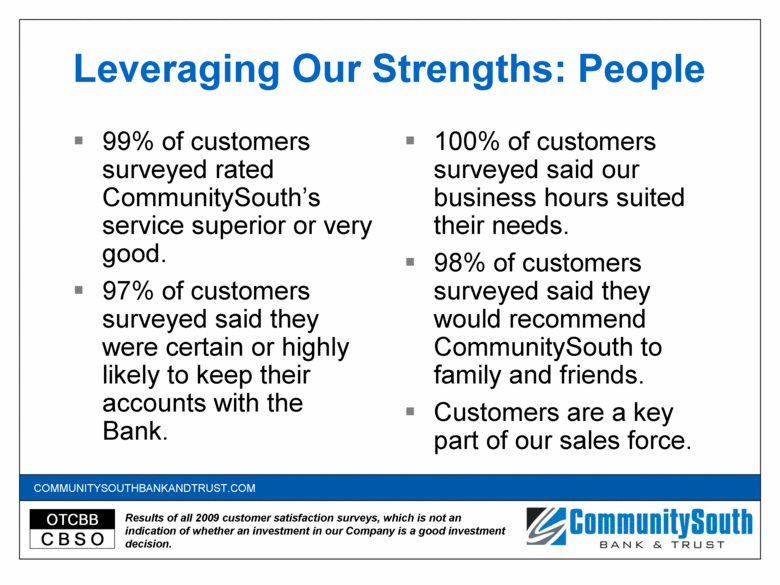
Leveraging Our Strengths: People 99% of customers surveyed rated CommunitySouth’s service superior or very good. 97% of customers surveyed said they were certain or highly likely to keep their accounts with the Bank. 100% of customers surveyed said our business hours suited their needs. 98% of customers surveyed said they would recommend CommunitySouth to family and friends. Customers are a key part of our sales force. Results of all 2009 customer satisfaction surveys, which is not an indication of whether an investment in our Company is a good investment decision. |
|
|
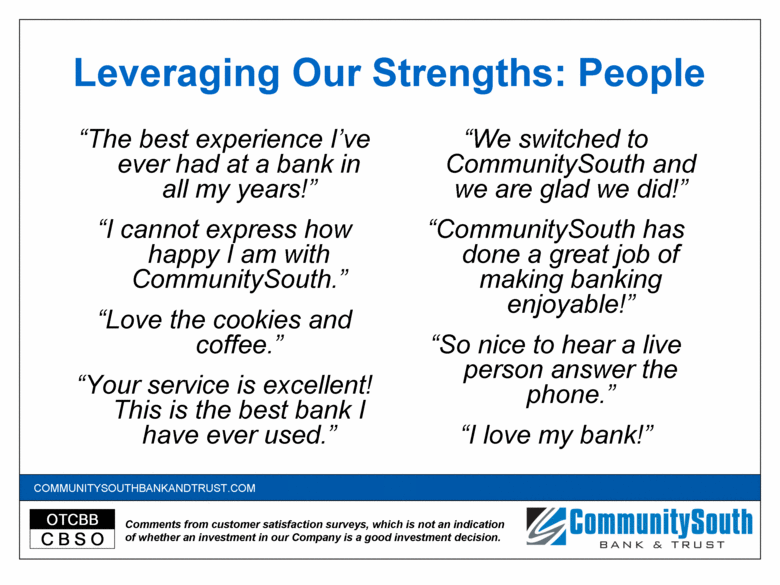
Leveraging Our Strengths: People “The best experience I’ve ever had at a bank in all my years!” “I cannot express how happy I am with CommunitySouth.” “Love the cookies and coffee.” “Your service is excellent! This is the best bank I have ever used.” “We switched to CommunitySouth and we are glad we did!” “CommunitySouth has done a great job of making banking enjoyable!” “So nice to hear a live person answer the phone.” “I love my bank!” Comments from customer satisfaction surveys, which is not an indication of whether an investment in our Company is a good investment decision. |
|
|
Open Forum |

