Attached files
| file | filename |
|---|---|
| 8-K - AMERICAN CAMPUS COMMUNITIES, INC. 8-K - AMERICAN CAMPUS COMMUNITIES INC | a6320784.htm |
Exhibit 99.1
American Campus Communities REITWeek - June 2010 Supplemental Analyst Package
2 Joint Venture Portfolio Acquisition
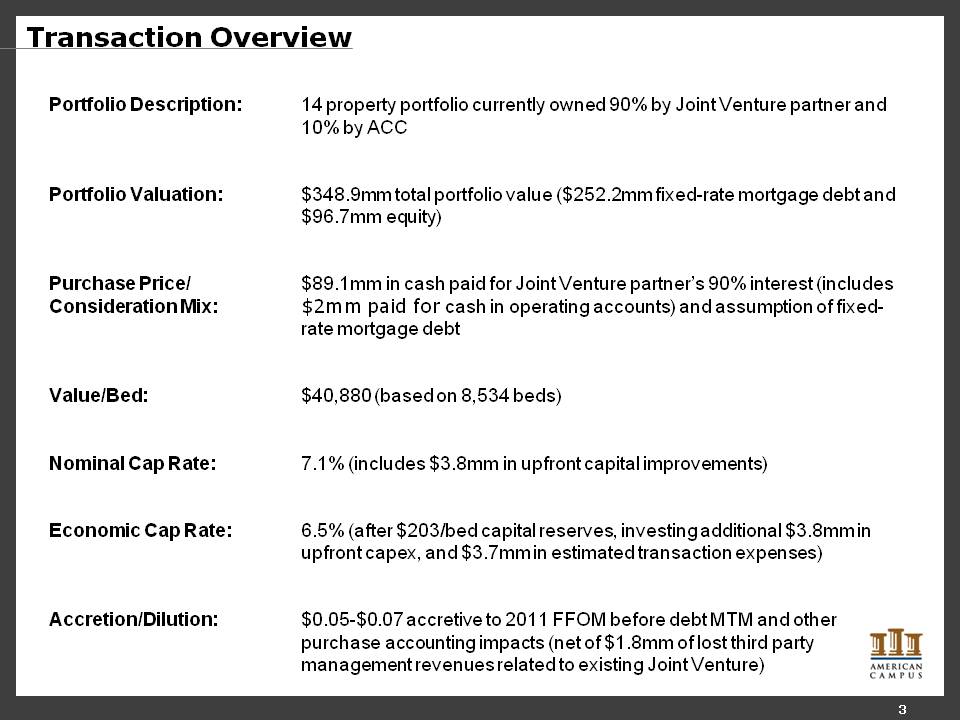
3 Transaction Overview Portfolio Description: 14 property portfolio currently owned 90% by Joint Venture partner and 10% by ACC Portfolio Valuation: $348.9mm total portfolio value ($252.2mm fixed-rate mortgage debt and $96.7mm equity) Purchase Price/Consideration Mix: $89.1mm in cash paid for Joint Venture partner’s 90% interest (includes$2mm paid for cash in operating accounts) and assumption of fixed-rate mortgage debt Value/Bed: $40,880 (based on 8,534 beds) Nominal Cap Rate:7.1% (includes $3.8mm in upfront capital improvements) Economic Cap Rate: 6.5% (after $203/bed capital reserves, investing additional $3.8mm in upfront capex, and $3.7mm in estimated transaction expenses) Accretion/Dilution: $0.05-$0.07 accretive to 2011 FFOM before debt MTM and other purchase accounting impacts (net of $1.8mm of lost third party management revenues related to existing Joint Venture)
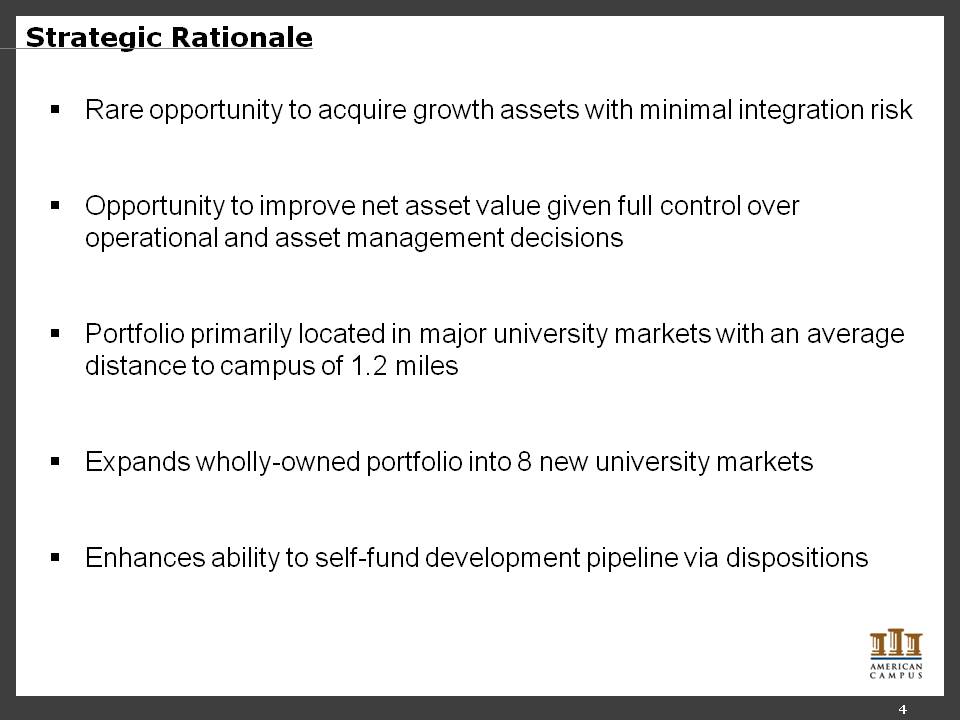
4 Strategic Rationale Rare opportunity to acquire growth assets with minimal integration risk Opportunity to improve net asset value given full control over operational and asset management decisions Portfolio primarily located in major university markets with an average distance to campus of 1.2 miles Expands wholly-owned portfolio into 8 new university markets Enhances ability to self-fund development pipeline via dispositions
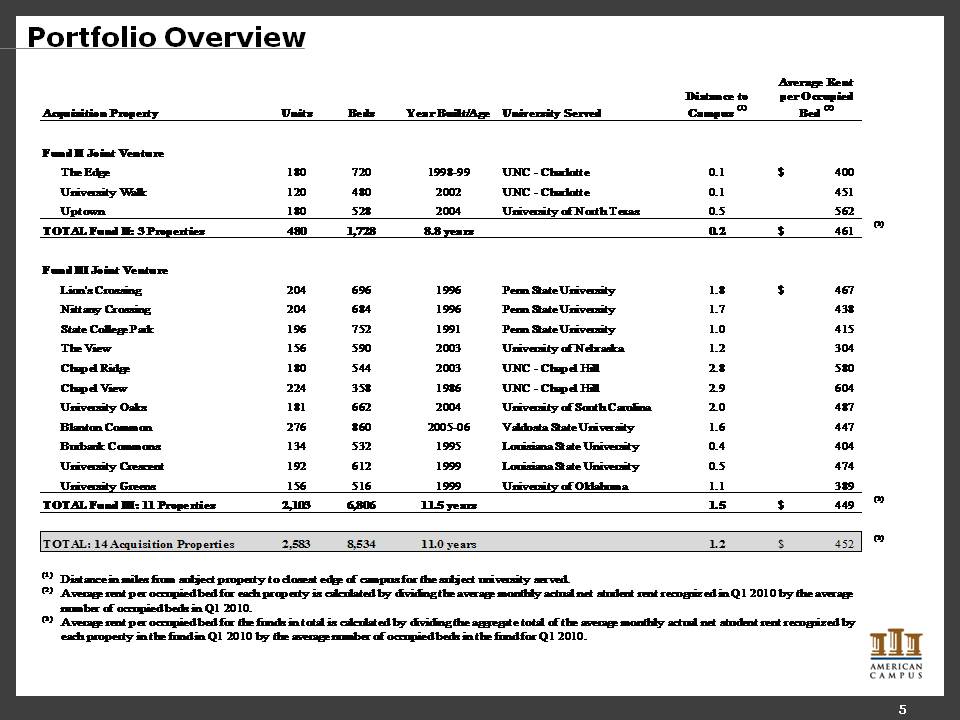
5 Portfolio Overview Acquisition Property Units Beds Year Built/Age University Served Distance to Campus (1) Average Rent per Occupied Bed (2) Fund II Joint Venture The Edge 180 720 1998-99 UNC - Charlotte 0.1 $400 University Walk 120 480 2002 UNC - Charlotte 0.1 451 Uptown 180 528 2004 University of North Texas 0.5 562 TOTAL Fund II: 3 Properties 480 1,728 8.8 years 0.2 $461 (3) Fund III Joint Venture Lion's Crossing 204 696 1996 Penn State University 1.8 $467 Nittany Crossing 204 684 1996 Penn State University 1.7 438 State College Park 196 752 1991 Penn State University 1.0 415 The View 156 590 2003 University of Nebraska 1.2 304 Chapel Ridge 180 544 2003 UNC - Chapel Hill 2.8 580 Chapel View 224 358 1986 UNC - Chapel Hill 2.9 604 University Oaks 181 662 2004 University of South Carolina 2.0 487 Blanton Common 276 860 2005-06 Valdosta State University 1.6 447 Burbank Commons 134 532 1995 Louisiana State University 0.4 404 University Crescent 192 612 1999 Louisiana State University 0.5 474 University Greens 156 516 1999 University of Oklahoma 1.1 389 TOTAL Fund III: 11 Properties 2,103 6,806 11.5 years 1.5 $449 (3) TOTAL: 14 Acquisition Properties 2,583 8,534 11.0 years 1.2 $452 (3) (1) Distance in miles from subject property to closest edge of campus for the subject university served. (2) Average rent per occupied bed for each property is calculated by dividing the average monthly actual net student rent recognized in Q1 2010 by the average number of occupied beds in Q1 2010. (3) Average rent per occupied bed for the funds in total is calculated by dividing the aggregate total of the average monthly actual net student rent recognized by each property in the fund in Q1 2010 by the average number of occupied beds in the fund for Q1 2010.
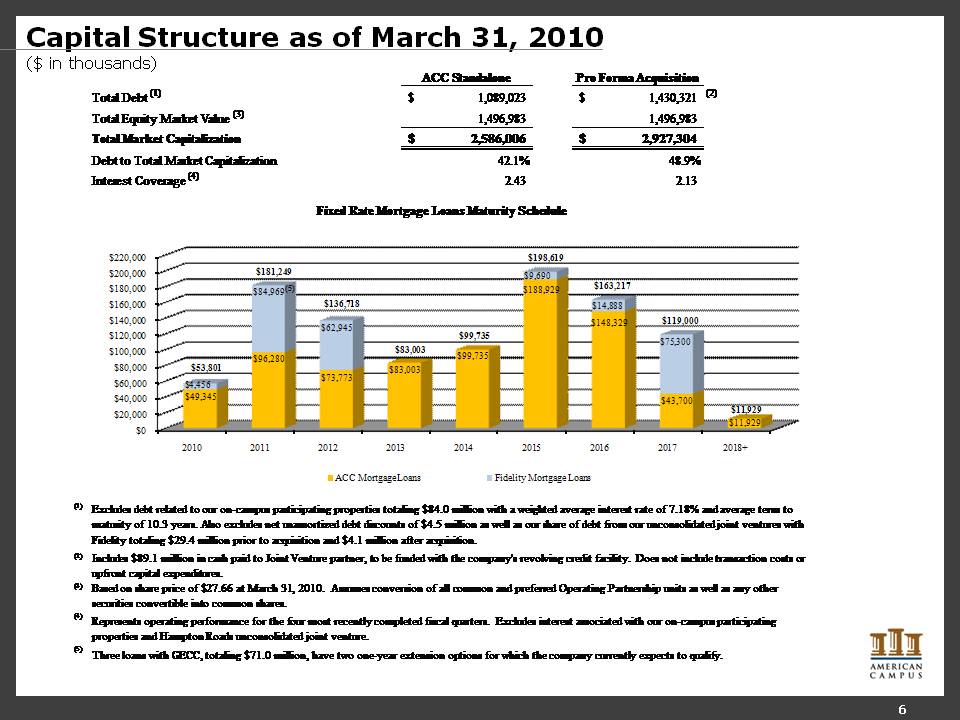
6 Capital Structure as of March 31, 2010 ($ in thousands) ACC Standalone Pro Forma Acquisition Total Debt (1) $1,089,023 $1,430,321 (2) Total Equity Market Value (3) 1,496,983 1,496,983 Total Market Capitalization $2,586,006 $2,927,304 Debt to Total Market Capitalization 42.1% 48.9% Interest Coverage (4) 2.43 2.13 Fixed Rate Mortgage Loans Maturity Schedule $220,000 $200,000 $180,000 $160,000 $140,000 $120,000 $100,000 $80,000 $60,000 $40,000 $20,000 $0 2010 2011 2012 2013 2014 2015 2016 2017 2018+ ACC Mortgage Loans Fidelity Mortgage Loans $53,801 $4,456 $49,345 $181,249 $84,969(5) $96,280 $136,718 $62,945 $73,773 $83,003 $83,003 $99,735 $99,735 $198,619 $9,690 $188,929 $163,217 $14,888 $148,329 $119,000 $75,300 $43,700 $11,929 $11,929 (1) Excludes debt related to our on-campus participating properties totaling $84.0 million with a weighted average interest rate of 7.18% and average term to maturity of 10.3 years. Also excludes net unamortized debt discounts of $4.5 million as well as our share of debt from our unconsolidated joint ventures with Fidelity totaling $29.4 million prior to acquisition and $4.1 million after acquisition. (2) Includes $89.1 million in cash paid to Joint Venture partner, to be funded with the company's revolving credit facility. Does not include transaction costs or upfront capital expenditures. (3) Based on share price of $27.66 at March 31, 2010. Assumes conversion of all common and preferred Operating Partnership units as well as any other securities convertible into common shares. (4) Represents operating performance for the four most recently completed fiscal quarters. Excludes interest associated with our on-campus participating properties and Hampton Roads unconsolidated joint venture. (5) Three loans with GECC, totaling $71.0 million, have two one-year extension options for which the company currently expects to qualify.
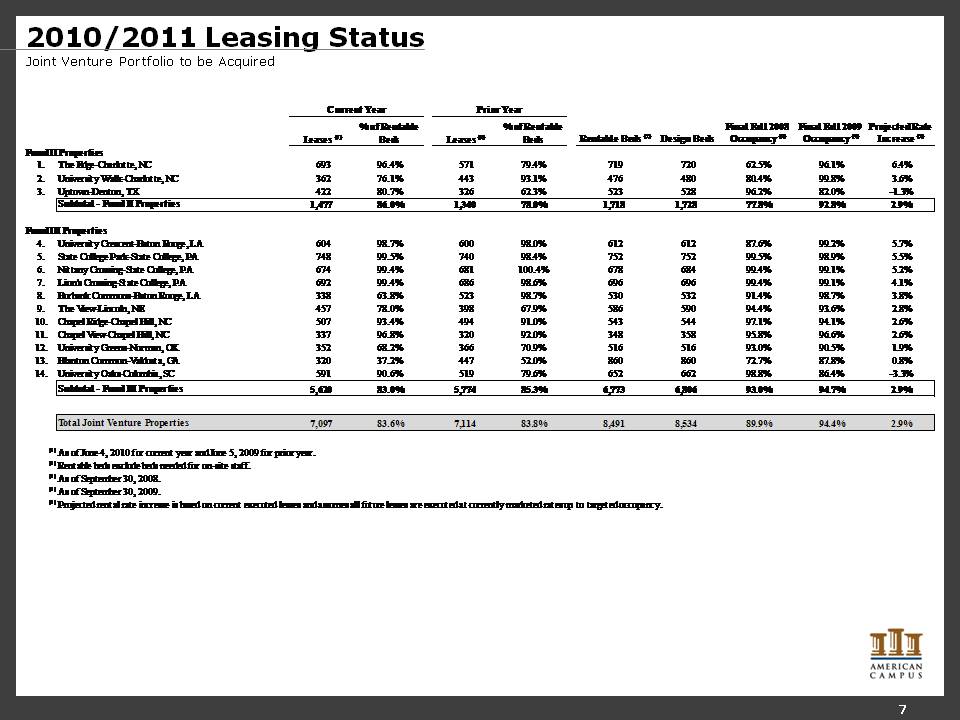
7 2010/2011 Leasing Status Joint Venture Portfolio to be Acquired Current Year Prior Year Rentable Beds (2) Design Beds Final Fall 2008 Occupancy (3) Final Fall 2009 Occupancy (4) Projected Rate Increase (5) Leases (1) % of Rentable Beds Leases (1) % of Rentable Beds Fund II Properties 1. The Edge-Charlotte, NC 693 96.4% 571 79.4% 719 720 62.5% 96.1% 6.4% 2. University Walk-Charlotte, NC 362 76.1% 443 93.1% 476 480 80.4% 99.8% 3.6% 3. Uptown-Denton, TX 422 80.7% 326 62.3% 523 528 96.2% 82.0% -1.3% Subtotal - Fund II Properties 1,477 86.0% 1,340 78.0% 1,718 1,728 77.8% 92.8% 2.9% Fund III Properties 4. University Crescent-Baton Rouge, LA 604 98.7% 600 98.0% 612 612 87.6% 99.2% 5.7% 5. State College Park-State College, PA 748 99.5% 740 98.4% 752 752 99.5% 98.9% 5.5% 6. Nittany Crossing-State College, PA 674 99.4% 681 100.4% 678 684 99.4% 99.1% 5.2% 7. Lion's Crossing-State College, PA 692 99.4% 686 98.6% 696 696 99.4% 99.1% 4.1% 8. Burbank Commons-Baton Rouge, LA 338 63.8% 523 98.7% 530 532 91.4% 98.7% 3.8% 9. The View-Lincoln, NE 457 78.0% 398 67.9% 586 590 94.4% 93.6% 2.8% 10. Chapel Ridge-Chapel Hill, NC 507 93.4% 494 91.0% 543 544 97.1% 94.1% 2.6% 11. Chapel View-Chapel Hill, NC 337 96.8% 320 92.0% 348 358 95.8% 96.6% 2.6% 12. University Greens-Norman, OK 352 68.2% 366 70.9% 516 516 93.0% 90.5% 1.9% 13. Blanton Common-Valdosta, GA 320 37.2% 447 52.0% 860 860 72.7% 87.8% 0.8% 14. University Oaks-Columbia, SC 591 90.6% 519 79.6% 652 662 98.8% 86.4% -3.3% Subtotal - Fund III Properties 5,620 83.0% 5,774 85.3% 6,773 6,806 93.0% 94.7% 2.9% Total Joint Venture Properties 7,097 83.6% 7,114 83.8% 8,491 8,534 89.9% 94.4% 2.9% (1) As of June 4, 2010 for current year and June 5, 2009 for prior year. (2) Rentable beds exclude beds needed for on-site staff. (3) As of September 30, 2008. (4) As of September 30, 2009. (5) Projected rental rate increase is based on current executed leases and assumes all future leases are executed at currently marketed rates up to targeted occupancy.
8 ACC Leasing Update
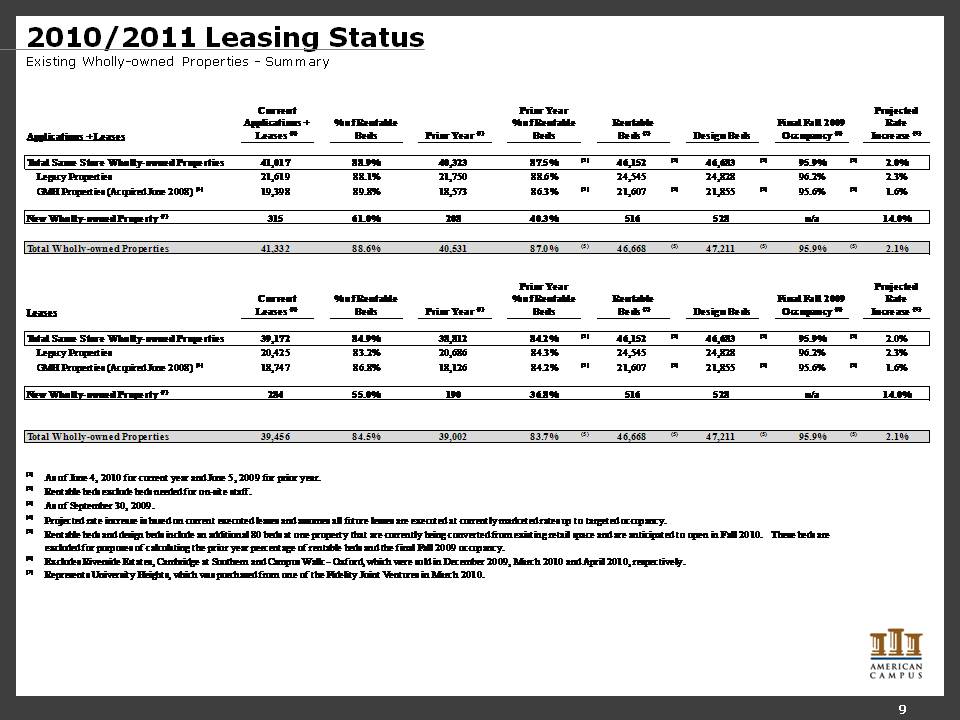
9 2010/2011 Leasing Status Existing Wholly-owned Properties - Summary Applications + Leases Current Applications + Leases (1) % of Rentable Beds Prior Year (1) "Prior Year % of Rentable Beds" "Rentable Beds (2)" Design Beds Final Fall 2009 Occupancy (3) Projected Rate Increase (4) Total Same Store Wholly-owned Properties 41,017 88.9% 40,323 87.5% (5) 46,152 (5) 46,683 (5) 95.9% (5) 2.0% Legacy Properties 21,619 88.1% 21,750 88.6% 24,545 24,828 96.2% 2.3% GMH Properties (Acquired June 2008) (6) 19,398 89.8% 18,573 86.3% (5) 21,607 (5) 21,855 (5) 95.6% (5) 1.6% New Wholly-owned Property (7) 315 61.0% 208 40.3% 516 528 n/a 14.0% Total Wholly-owned Properties 41,332 88.6% 40,531 87.0% (5) 46,668 (5) 47,211 (5) 95.9% (5) 2.1% Leases Current Leases (1) % of Rentable Beds Prior Year (1) "Prior Year % of Rentable Beds" "Rentable Beds (2)" Design Beds Final Fall 2009 Occupancy (3) Projected Rate Increase (4) Total Same Store Wholly-owned Properties 39,172 84.9% 38,812 84.2% (5) 46,152 (5) 46,683 (5) 95.9% (5) 2.0% Legacy Properties 20,425 83.2% 20,686 84.3% 24,545 24,828 96.2% 2.3% GMH Properties (Acquired June 2008) (6) 18,747 86.8% 18,126 84.2% (5) 21,607 (5) 21,855 (5) 95.6% (5) 1.6% New Wholly-owned Property (7) 284 55.0% 190 36.8% 516 528 n/a 14.0% Total Wholly-owned Properties 39,456 84.5% 39,002 83.7% (5) 46,668 (5) 47,211 (5) 95.9% (5) 2.1% (1) As of June 4, 2010 for current year and June 5, 2009 for prior year. (2) Rentable beds exclude beds needed for on-site staff. (3) As of September 30, 2009. (4) Projected rate increase is based on current executed leases and assumes all future leases are executed at currently marketed rates up to targeted occupancy. (5) Rentable beds and design beds include an additional 80 beds at one property that are currently being converted from existing retail space and are anticipated to open in Fall 2010. These beds are excluded for purposes of calculating the prior year percentage of rentable beds and the final Fall 2009 occupancy. (6) Excludes Riverside Estates, Cambridge at Southern and Campus Walk - Oxford, which were sold in December 2009, March 2010 and April 2010, respectively. (7) Represents University Heights, which was purchased from one of the Fidelity Joint Ventures in March 2010.
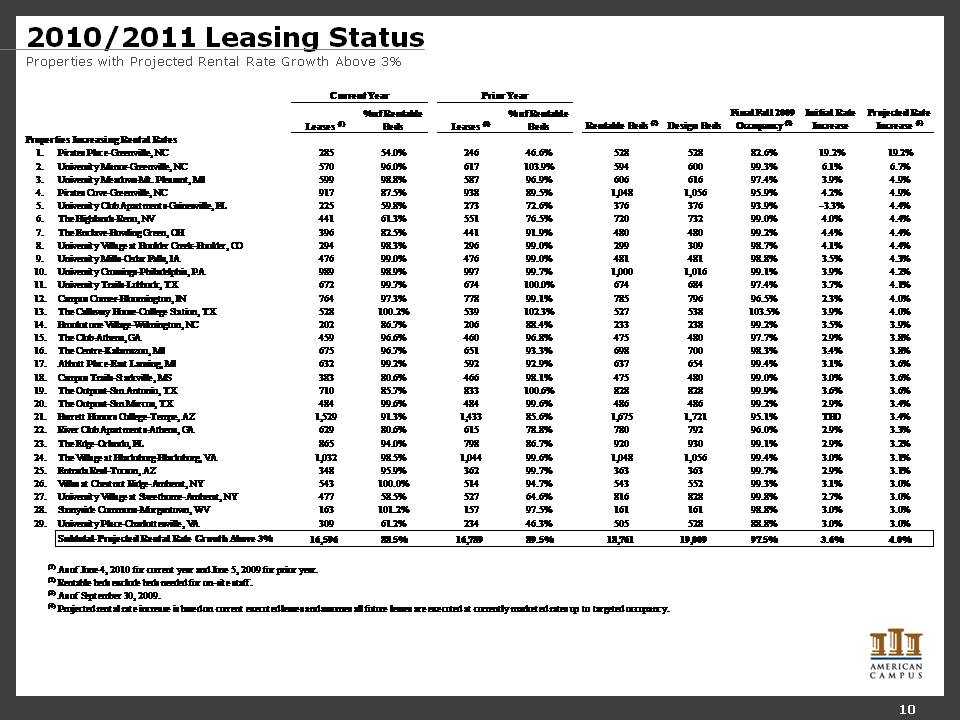
10 2010/2011 Leasing Status Properties with Projected Rental Rate Growth Above 3% Current Year Prior Year Rentable Beds (2) Design Beds Final Fall 2009 Occupancy (3) Initial Rate Increase Projected Rate Increase (4) Leases (1) % of Rentable Beds Leases (1) % of Rentable Beds Properties Increasing Rental Rates 1. Pirates Place-Greenville, NC 285 54.0% 246 46.6% 528 528 82.6% 19.2% 19.2% 2. University Manor-Greenville, NC 570 96.0% 617 103.9% 594 600 99.3% 6.1% 6.7% 3. University Meadows-Mt. Pleasant, MI 599 98.8% 587 96.9% 606 616 97.4% 3.9% 4.9% 4. Pirates Cove-Greenville, NC 917 87.5% 938 89.5% 1,048 1,056 95.9% 4.2% 4.9% 5. University Club Apartments-Gainesville, FL 225 59.8% 273 72.6% 376 376 93.9% -3.3% 4.4% 6. The Highlands-Reno, NV 441 61.3% 551 76.5% 720 732 99.0% 4.0% 4.4% 7. The Enclave-Bowling Green, OH 396 82.5% 441 91.9% 480 480 99.2% 4.4% 4.4% 8. University Village at Boulder Creek-Boulder, CO 294 98.3% 296 99.0% 299 309 98.7% 4.1% 4.4% 9. University Mills-Cedar Falls, IA 476 99.0% 476 99.0% 481 481 98.8% 3.5% 4.3% 10. University Crossings-Philadelphia, PA 989 98.9% 997 99.7% 1,000 1,016 99.1% 3.9% 4.2% 11. University Trails-Lubbock, TX 672 99.7% 674 100.0% 674 684 97.4% 3.7% 4.1% 12. Campus Corner-Bloomington, IN 764 97.3% 778 99.1% 785 796 96.5% 2.3% 4.0% 13. The Callaway House-College Station, TX 528 100.2% 539 102.3% 527 538 103.5% 3.9% 4.0% 14. Brookstone Village-Wilmington, NC 202 86.7% 206 88.4% 233 238 99.2% 3.5% 3.9% 15. The Club-Athens, GA 459 96.6% 460 96.8% 475 480 97.7% 2.9% 3.8% 16. The Centre-Kalamazoo, MI 675 96.7% 651 93.3% 698 700 98.3% 3.4% 3.8% 17. Abbott Place-East Lansing, MI 632 99.2% 592 92.9% 637 654 99.4% 3.1% 3.6% 18. Campus Trails-Starkville, MS 383 80.6% 466 98.1% 475 480 99.0% 3.0% 3.6% 19. The Outpost-San Antonio, TX 710 85.7% 833 100.6% 828 828 99.9% 3.6% 3.6% 20. The Outpost-San Marcos, TX 484 99.6% 484 99.6% 486 486 99.2% 2.9% 3.4% 21. Barrett Honors College-Tempe, AZ 1,529 91.3% 1,433 85.6% 1,675 1,721 95.1% TBD 3.4% 22. River Club Apartments-Athens, GA 629 80.6% 615 78.8% 780 792 96.0% 2.9% 3.3% 23. The Edge-Orlando, FL 865 94.0% 798 86.7% 920 930 99.1% 2.9% 3.2% 24. The Village at Blacksburg-Blacksburg, VA 1,032 98.5% 1,044 99.6% 1,048 1,056 99.4% 3.0% 3.1% 25. Entrada Real-Tucson, AZ 348 95.9% 362 99.7% 363 363 99.7% 2.9% 3.1% 26. Villas at Chestnut Ridge-Amherst, NY 543 100.0% 514 94.7% 543 552 99.3% 3.1% 3.0% 27. University Village at Sweethome-Amherst, NY 477 58.5% 527 64.6% 816 828 99.8% 2.7% 3.0% 28. Sunnyside Commons-Morgantown, WV 163 101.2% 157 97.5% 161 161 98.8% 3.0% 3.0% 29. University Place-Charlottesville, VA 309 61.2% 234 46.3% 505 528 88.8% 3.0% 3.0% Subtotal-Projected Rental Rate Growth Above 3% 16,596 88.5% 16,789 89.5% 18,761 19,009 97.5% 3.6% 4.0% (1) As of June 4, 2010 for current year and June 5, 2009 for prior year. (2) Rentable beds exclude beds needed for on-site staff. (3) As of September 30, 2009. (4) Projected rental rate increase is based on current executed leases and assumes all future leases are executed at currently marketed rates up to targeted occupancy.
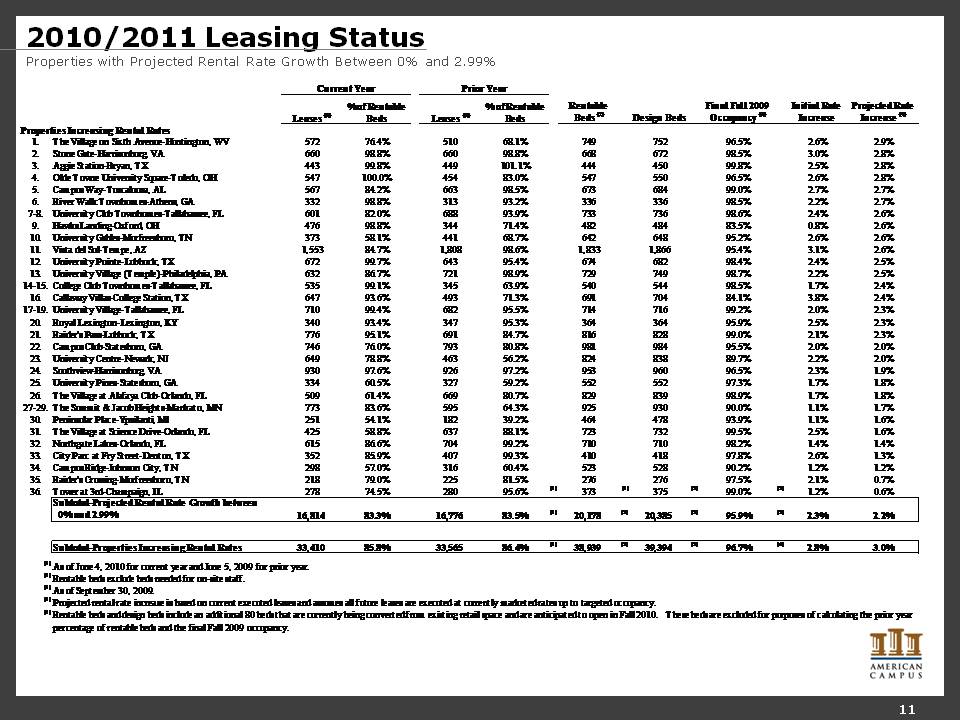
11 2010/2011 Leasing Status Properties with Projected Rental Rate Growth Between 0% and 2.99% Current Year Prior Year Rentable Beds (2) Design Beds Final Fall 2009 Occupancy (3) Initial Rate Increase Projected Rate Increase (4) Leases (1) % of Rentable Beds Leases (1) % of Rentable Beds Properties Increasing Rental Rates 1. The Village on Sixth Avenue-Huntington, WV 572 76.4% 510 68.1% 749 752 96.5% 2.6% 2.9% 2. Stone Gate-Harrisonburg, VA 660 98.8% 660 98.8% 668 672 98.5% 3.0% 2.8% 3. Aggie Station-Bryan, TX 443 99.8% 449 101.1% 444 450 99.8% 2.5% 2.8% 4. Olde Towne University Square-Toledo, OH 547 100.0% 454 83.0% 547 550 96.5% 2.6% 2.8% 5. Campus Way-Tuscaloosa, AL 567 84.2% 663 98.5% 673 684 99.0% 2.7% 2.7% 6. River Walk Townhomes-Athens, GA 332 98.8% 313 93.2% 336 336 98.5% 2.2% 2.7% 7-8. University Club Townhomes-Tallahassee, FL 601 82.0% 688 93.9% 733 736 98.6% 2.4% 2.6% 9. Hawks Landing-Oxford, OH 476 98.8% 344 71.4% 482 484 83.5% 0.8% 2.6% 10. University Gables-Murfreesboro, TN 373 58.1% 441 68.7% 642 648 95.2% 2.6% 2.6% 11. Vista del Sol-Tempe, AZ 1,553 84.7% 1,808 98.6% 1,833 1,866 95.4% 3.1% 2.6% 12. University Pointe-Lubbock, TX 672 99.7% 643 95.4% 674 682 98.4% 2.4% 2.5% 13. University Village (Temple)-Philadelphia, PA 632 86.7% 721 98.9% 729 749 98.7% 2.2% 2.5% 14-15. College Club Townhomes-Tallahassee, FL 535 99.1% 345 63.9% 540 544 98.5% 1.7% 2.4% 16. Callaway Villas-College Station, TX 647 93.6% 493 71.3% 691 704 84.1% 3.8% 2.4% 17-19. University Village-Tallahassee, FL 710 99.4% 682 95.5% 714 716 99.2% 2.0% 2.3% 20. Royal Lexington-Lexington, KY 340 93.4% 347 95.3% 364 364 95.9% 2.5% 2.3% 21. Raider's Pass-Lubbock, TX 776 95.1% 691 84.7% 816 828 99.0% 2.1% 2.3% 22. Campus Club-Statesboro, GA 746 76.0% 793 80.8% 981 984 95.5% 2.0% 2.0% 23. University Centre-Newark, NJ 649 78.8% 463 56.2% 824 838 89.7% 2.2% 2.0% 24. Southview-Harrisonburg, VA 930 97.6% 926 97.2% 953 960 96.5% 2.3% 1.9% 25. University Pines-Statesboro, GA 334 60.5% 327 59.2% 552 552 97.3% 1.7% 1.8% 26. The Village at Alafaya Club-Orlando, FL 509 61.4% 669 80.7% 829 839 98.9% 1.7% 1.8% 27-29. The Summit & Jacob Heights-Mankato, MN 773 83.6% 595 64.3% 925 930 90.0% 1.1% 1.7% 30. Peninsular Place-Ypsilanti, MI 251 54.1% 182 39.2% 464 478 93.9% 1.1% 1.6% 31. The Village at Science Drive-Orlando, FL 425 58.8% 637 88.1% 723 732 99.5% 2.5% 1.6% 32. Northgate Lakes-Orlando, FL 615 86.6% 704 99.2% 710 710 98.2% 1.4% 1.4% 33. City Parc at Fry Street-Denton, TX 352 85.9% 407 99.3% 410 418 97.8% 2.6% 1.3% 34. Campus Ridge-Johnson City, TN 298 57.0% 316 60.4% 523 528 90.2% 1.2% 1.2% 35. Raider's Crossing-Murfreesboro, TN 218 79.0% 225 81.5% 276 276 97.5% 2.1% 0.7% 36. Tower at 3rd-Champaign, IL 278 74.5% 280 95.6% 373 375 99.0% 1.2% 0.6% "Subtotal-Projected Rental Rate Growth between 0% and 2.99%"16,814 83.3% 16,776 83.5% 20,178 20,385 95.9% 2.3% 2.2% Subtotal-Properties Increasing Rental Rates 33,410 85.8% 33,565 86.4% 38,939 39,394 96.7% 2.8% 3.0% (1) As of June 4, 2010 for current year and June 5, 2009 for prior year. (2) Rentable beds exclude beds needed for on-site staff. (3) As of September 30, 2009. (4) Projected rental rate increase is based on current executed leases and assumes all future leases are executed at currently marketed rates up to targeted occupancy. (5) Rentable beds and design beds include an additional 80 beds that are currently being converted from existing retail space and are anticipated to open in Fall 2010. These beds are excluded for purposes of calculating the prior year percentage of rentable beds and the final Fall 2009 occupancy.
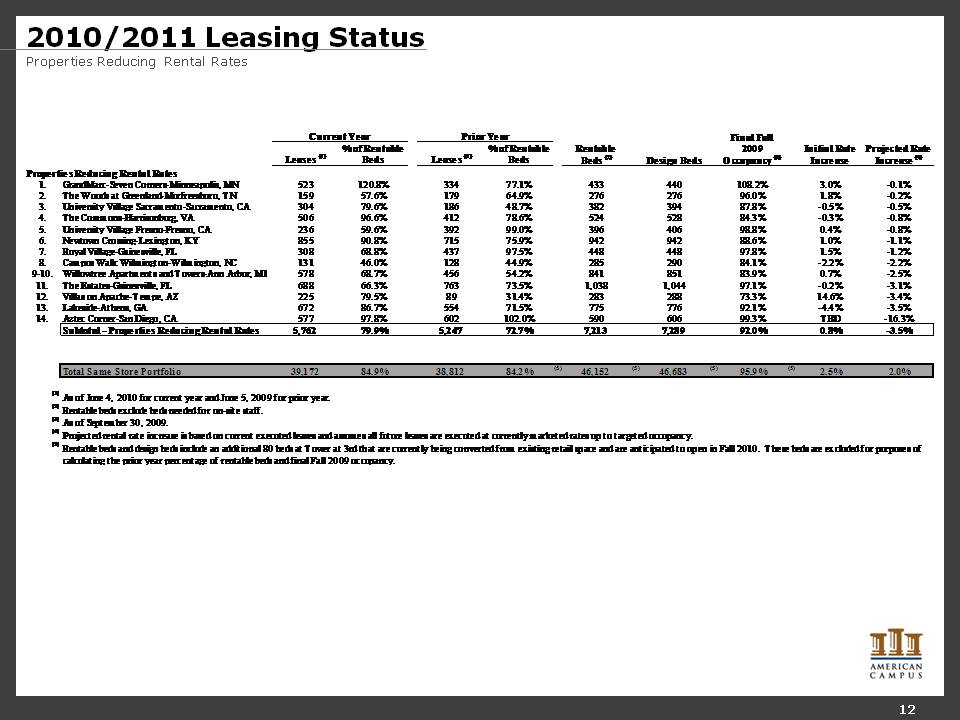
12 2010/2011 Leasing Status Properties Reducing Rental Rates Current Year Prior Year Rentable Beds (2) Design Beds Final Fall 2009 Occupancy (3) Initial Rate Increase Projected Rate Increase (4) Leases (1) % of Rentable Beds Leases (1) % of Rentable Beds Properties Reducing Rental Rates 1. GrandMarc-Seven Corners-Minneapolis, MN 523 120.8% 334 77.1% 433 440 108.2% 3.0% -0.1% 2. The Woods at Greenland-Murfreesboro, TN 159 57.6% 179 64.9% 276 276 96.0% 1.8% -0.2% 3. University Village Sacramento-Sacramento, CA 304 79.6% 186 48.7% 382 394 87.8% -0.5% -0.5% 4. The Commons-Harrisonburg, VA 506 96.6% 412 78.6% 524 528 84.3% -0.3% -0.8% 5. University Village Fresno-Fresno, CA 236 59.6% 392 99.0% 396 406 98.8% 0.4% -0.8% 6. Newtown Crossing-Lexington, KY 855 90.8% 715 75.9% 942 942 88.6% 1.0% -1.1% 7. Royal Village-Gainesville, FL 308 68.8% 437 97.5% 448 448 97.8% 1.5% -1.2% 8. Campus Walk Wilmington-Wilmington, NC 131 46.0% 128 44.9% 285 290 84.1% -2.2% -2.2% 9-10. Willowtree Apartments and Towers-Ann Arbor, MI 578 68.7% 456 54.2% 841 851 83.9% 0.7% -2.5% 11. The Estates-Gainesville, FL 688 66.3% 763 73.5% 1,038 1,044 97.1% -0.2% -3.1% 12. Villas on Apache-Tempe, AZ 225 79.5% 89 31.4% 283 288 73.3% 14.6% -3.4% 13. Lakeside-Athens, GA 672 86.7% 554 71.5% 775 776 92.1% -4.4% -3.5% 14. Aztec Corner-San Diego, CA 577 97.8% 602 102.0% 590 606 99.3% TBD -16.3% Subtotal - Properties Reducing Rental Rates 5,762 79.9% 5,247 72.7% 7,213 7,289 92.0% 0.8% -3.5% Total Same Store Portfolio 39,172 84.9% 38,812 84.2% 46,152 46,683 95.9% 2.5% 2.0% (1) As of June 4, 2010 for current year and June 5, 2009 for prior year. (2) Rentable beds exclude beds needed for on-site staff. (3) As of September 30, 2009. (4) Projected rental rate increase is based on current executed leases and assumes all future leases are executed at currently marketed rates up to targeted occupancy. (5) Rentable beds and design beds include an additional 80 beds at Tower at 3rd that are currently being converted from existing retail space and are anticipated to open in Fall 2010. These beds are excluded for purposes of calculating the prior year percentage of rentable beds and final Fall 2009 occupancy.
13 Forward Looking Statements In addition to historical information, this supplemental package contains forward-looking statements under the federal securities law. These statements are based on current expectations, estimates and projections about the industry and markets in which American Campus operates, management's beliefs, and assumptions made by management. Forward-looking statements are not guarantees of future performance and involve certain risks and uncertainties, which are difficult to predict.