Attached files
| file | filename |
|---|---|
| 8-K - CIRRUS LOGIC, INC. 8-K - CIRRUS LOGIC, INC. | a6319911.htm |
Cirrus Logic June Quarter Fiscal Year 2011 Investor Update
Safe Harbor Statement Except for historical information contained herein, the matters set forth in this presentation; estimates and assumptions regarding industry market projections; our revenue growth rate and opportunities; future revenue, gross margin, and R&D and SG&A expenses, and future product releases are forward-looking statements. These forward-looking statements are based on our current expectations, estimates and assumptions and are subject to certain risks and uncertainties that could cause actual results to differ materially from our current expectations, estimates and assumptions and the forward-looking statements made in this presentation. These risks and uncertainties include, but are not limited to, the risk factors listed in our Form 10-K for the year ended March 27, 2010, and in other filings with the Securities and Exchange Commission. The foregoing information concerning our business outlook represents our outlook as of the date of this presentation, and we undertake no obligation to update or revise any forward-looking statements, whether as a result of new developments or otherwise.
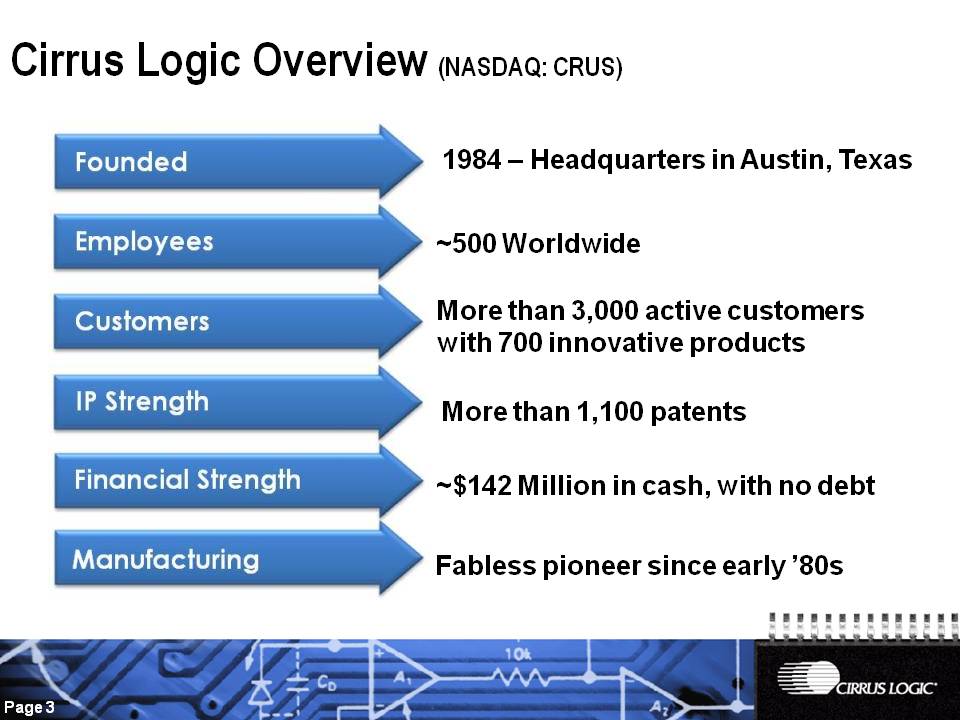
Cirrus Logic Overview (NASDAQ: CRUS) Customers More than 3,000 active customers with 700 innovative products Employees ~500 Worldwide Founded 1984 – Headquarters in Austin, Texas Financial Strength ~$142 Million in cash, with no debt IP Strength More than 1,100 patents Manufacturing Fabless pioneer since early ’80s
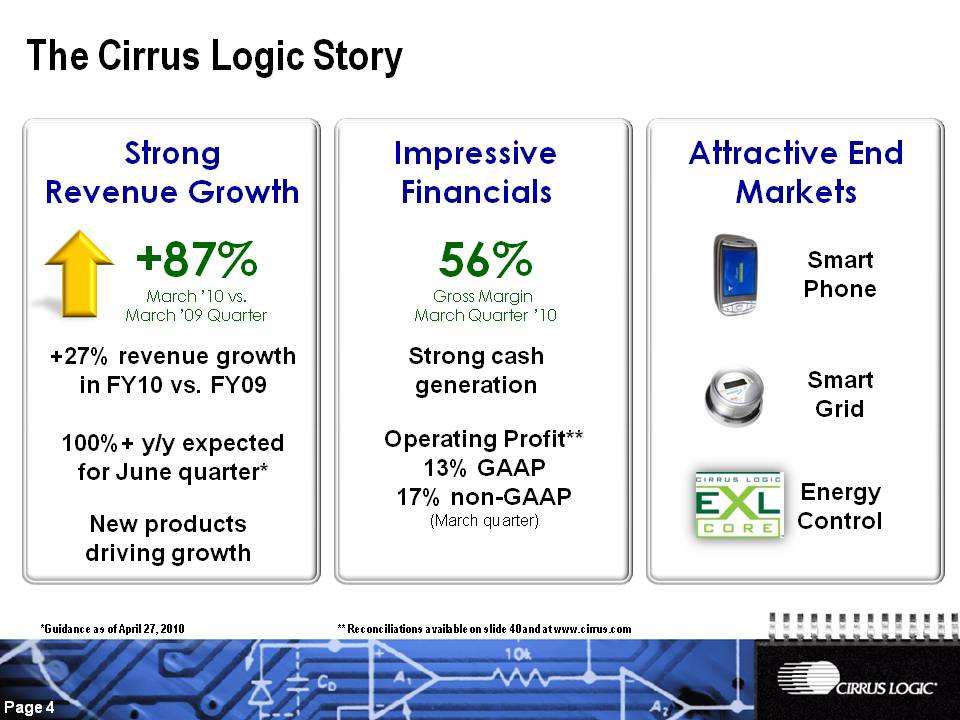
Strong Revenue Growth Impressive Financials Attractive End Markets +87% March ’10 vs. March ’09 Quarter 56% Gross Margin March Quarter ’10 Strong cash generation Operating Profit** 13% GAAP 17% non-GAAP (March quarter) New products driving growth +27% revenue growth in FY10 vs. FY09 100%+ y/y expected for June quarter* Energy Control Smart Grid Smart Phone The Cirrus Logic Story *Guidance as of April 27, 2010 ** Reconciliations available on slide 40 and at www.cirrus.com
Our Mission To deliver innovative and proprietary high-performance analog and mixed-signal components
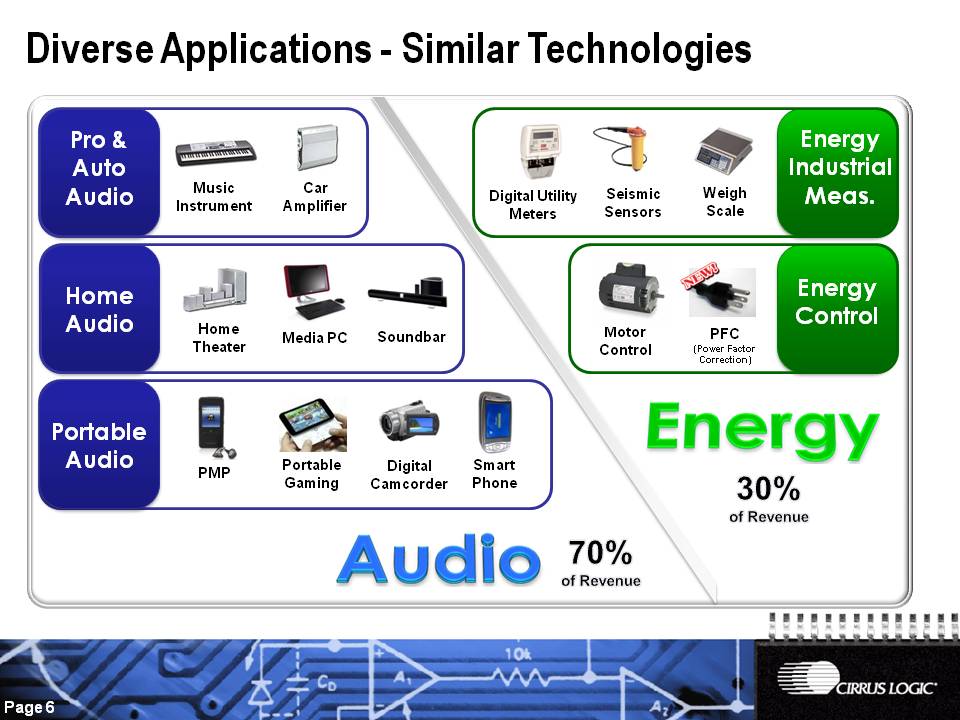
Diverse Applications - Similar Technologies Portable Gaming PMP Media PC Home Theater Music Instrument Car Amplifier Weigh Scale Motor Control Digital Utility Meters Digital Camcorder Soundbar Home Audio Pro & Auto Audio Energy Control Energy Industrial Meas. PFC (Power Factor Correction) Seismic Sensors 30% of Revenue Portable Audio Smart Phone 70% of Revenue
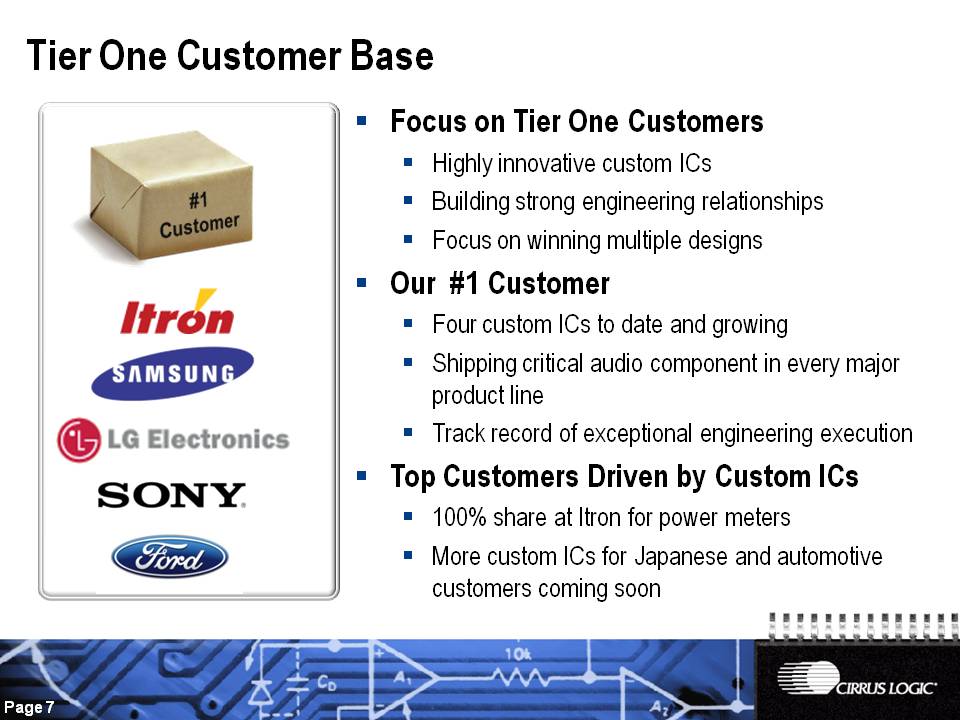
Tier One Customer Base #1 Customer Focus on Tier One Customers Highly innovative custom ICs Building strong engineering relationships Focus on winning multiple designs Our #1 Customer Four custom ICs to date and growing Shipping critical audio component in every major product line Track record of exceptional engineering execution Top Customers Driven by Custom ICs 100% share at Itron for power meters More custom ICs for Japanese and automotive customers coming soon
Employee Talent and Culture The basis for our long-term sustainable success Belief in Our Vision and Mission Innovation and technical leadership Performance-Based Culture Execution is our key focus Attracting the Best Talent Recognized as a “Best Companies” to work for Always increasing our “talent density” pool
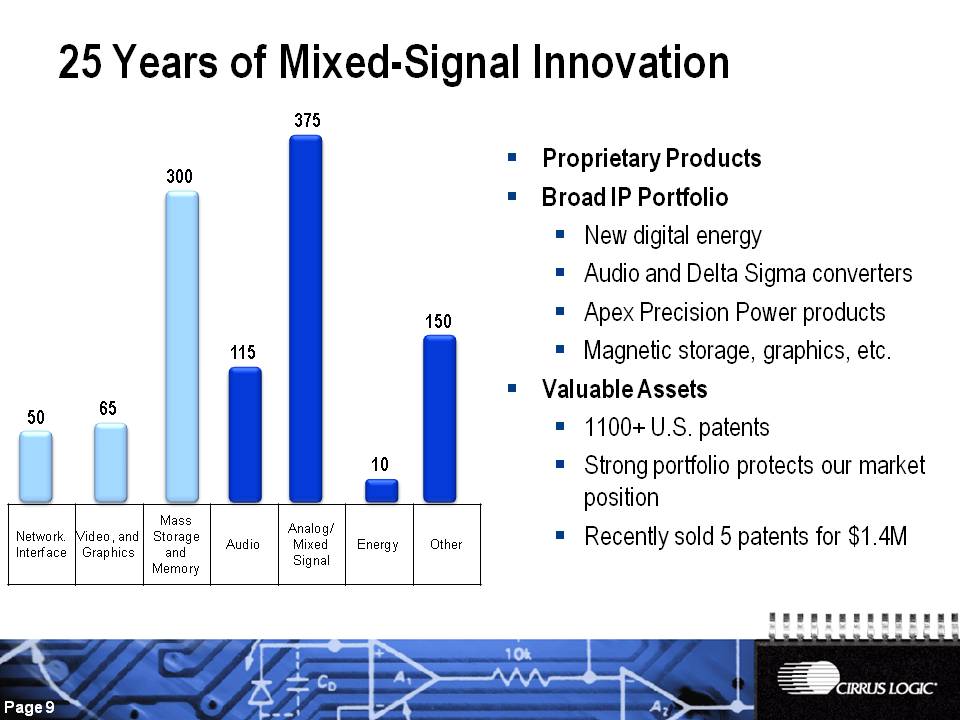
25 Years of Mixed-Signal Innovation Proprietary Products Broad IP Portfolio New digital energy Audio and Delta Sigma converters Apex Precision Power products Magnetic storage, graphics, etc. Valuable Assets 1100+ U.S. patents Strong portfolio protects our market position Recently sold 5 patents for $1.4M 65 300 115 375 10 50 150 Network Interface Video and Graphics Mass Storage and Memory Audio Analog Mixed Signal Energy Other
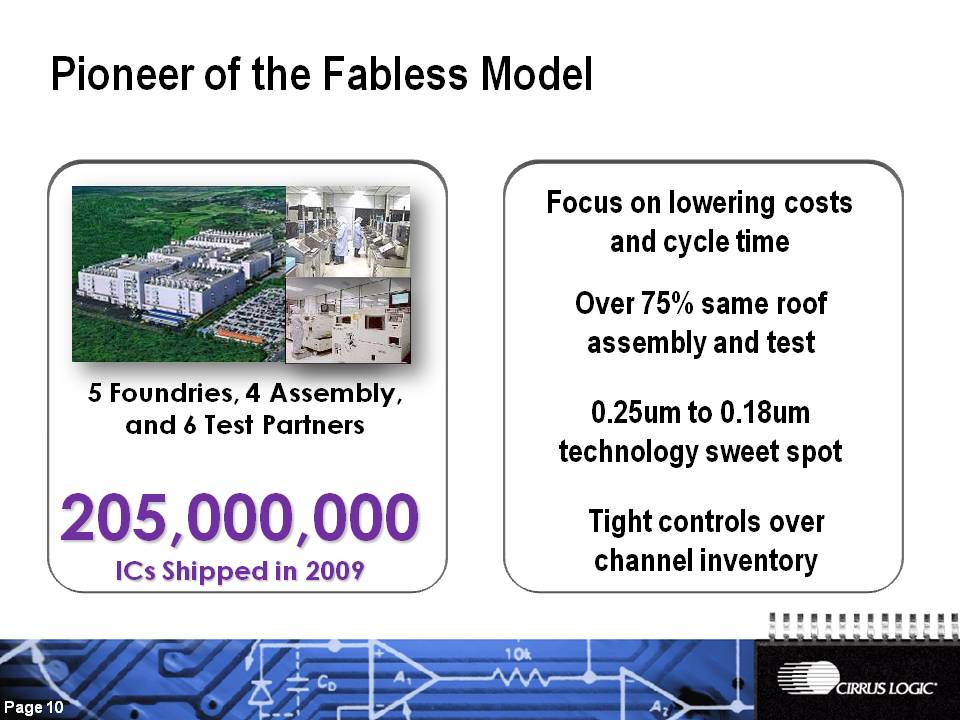
Pioneer of the Fabless Model 5 Foundries, 4 Assembly, and 6 Test Partners 205,000,000 ICs Shipped in 2009 Over 75% same roof assembly and test 0.25um to 0.18um technology sweet spot Focus on lowering costs and cycle time Tight controls over channel inventory
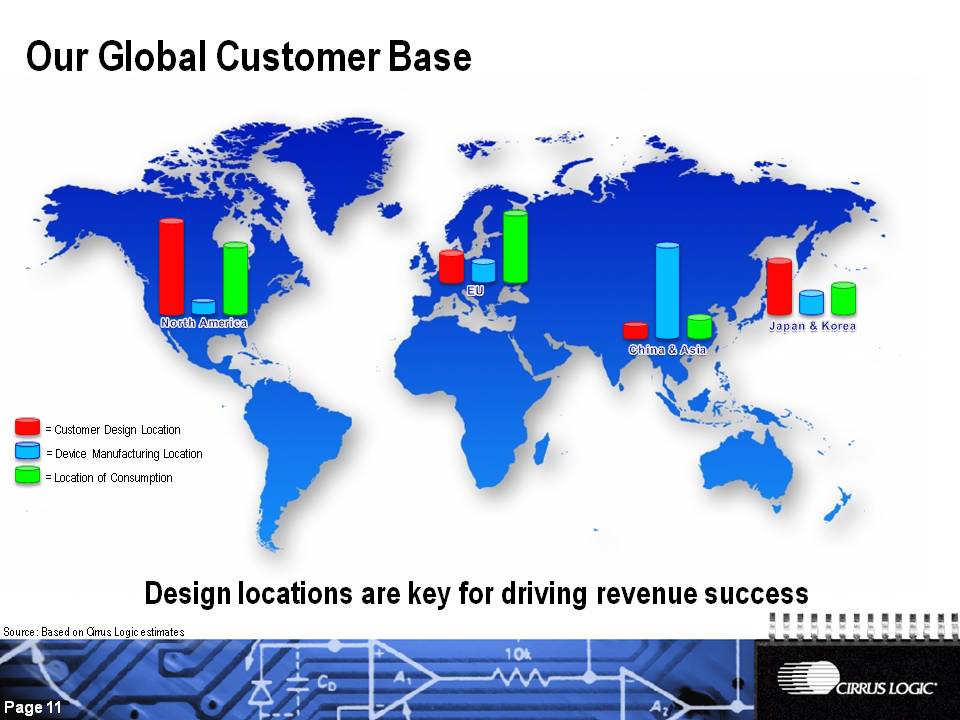
Our Global Customer Base North America EU Japan & Korea China & Asia = Customer Design Location = Location of Consumption = Device Manufacturing Location Design locations are key for driving revenue success Source: Based on Cirrus Logic estimates
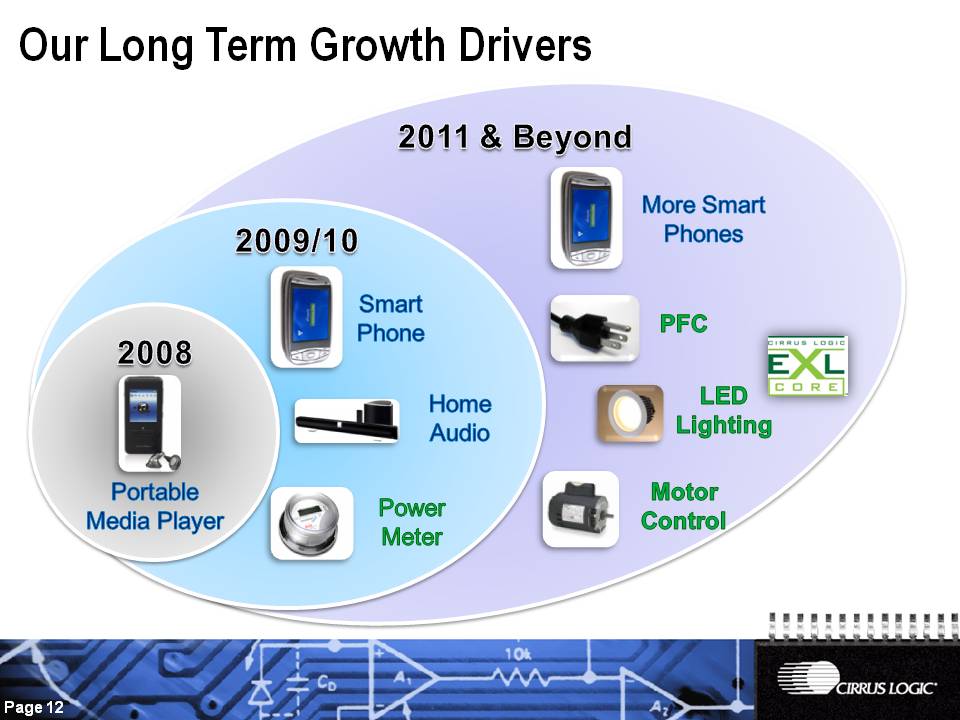
Home Audio Smart Phone 2009/10 Our Long Term Growth Drivers 2011 & Beyond Power Meter PFC LED Lighting Motor Control Portable Media Player 2008 More Smart Phones

Audio
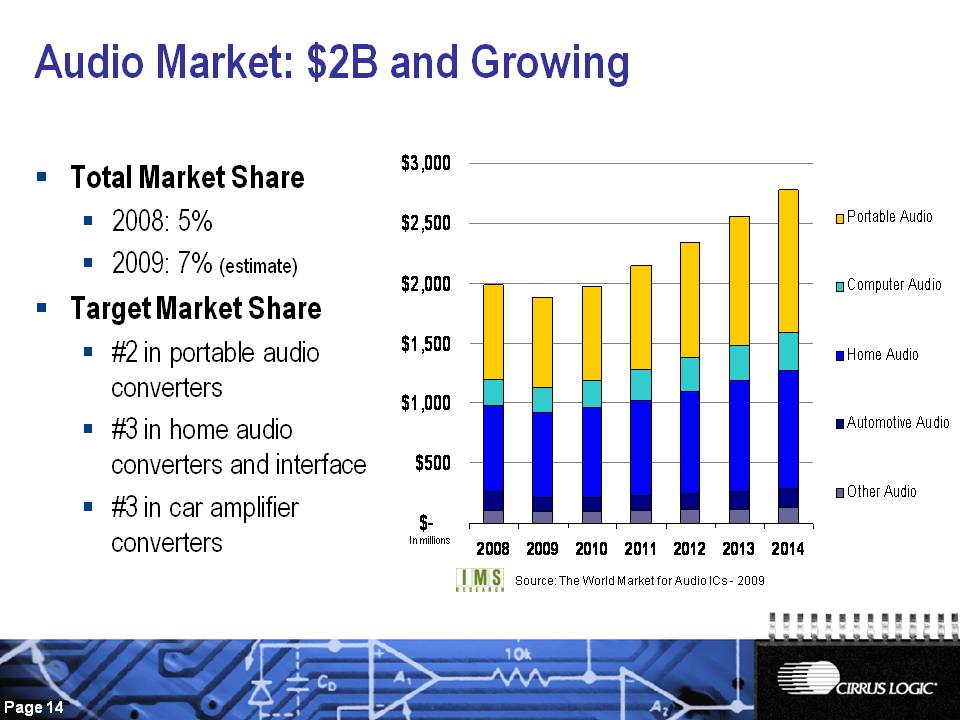
Total Market Share 2008: 5% 2009: 7% (estimate) Target Market Share #2 in portable audio converters #3 in home audio converters and interface #3 in car amplifier converters Audio Market: $2B and Growing Source: The World Market for Audio ICs - 2009 In millions
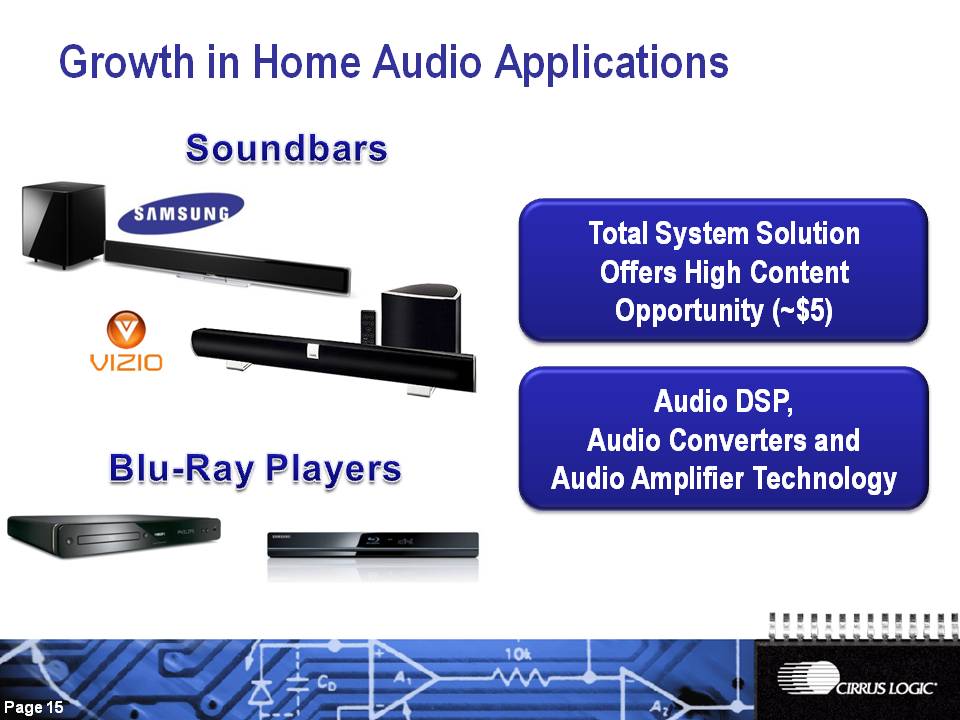
Growth in Home Audio Applications Total System Solution Offers High Content Opportunity (~$5) Audio DSP, Audio Converters and Audio Amplifier Technology Soundbars Blu-Ray Players
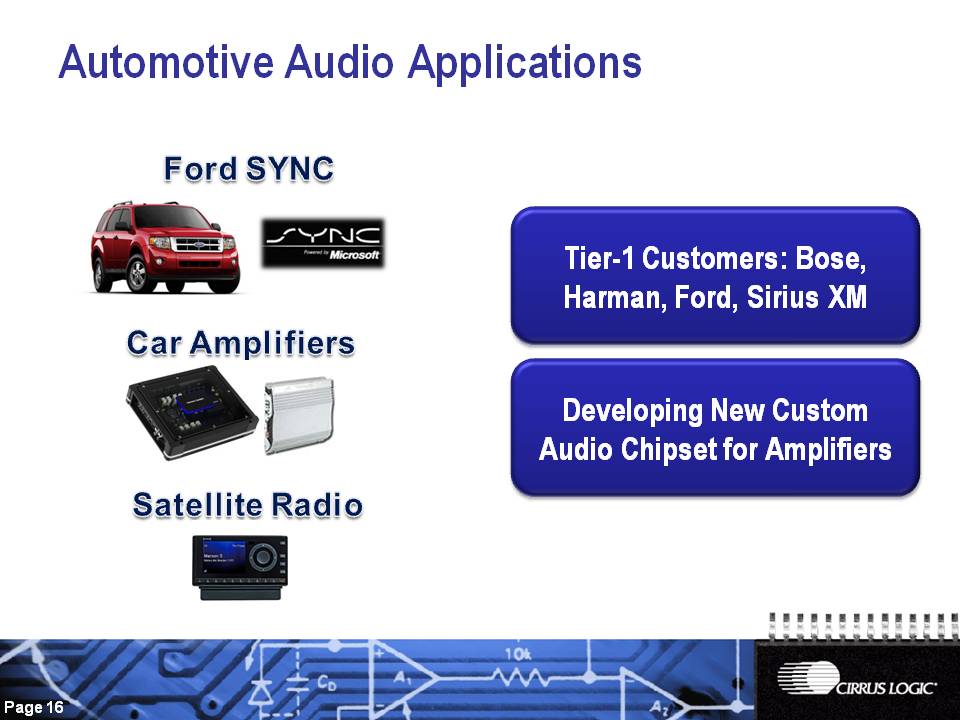
Automotive Audio Applications Car Amplifiers Satellite Radio Ford SYNC Developing New Custom Audio Chipset for Amplifiers Tier-1 Customers: Bose, Harman, Ford, Sirius XM
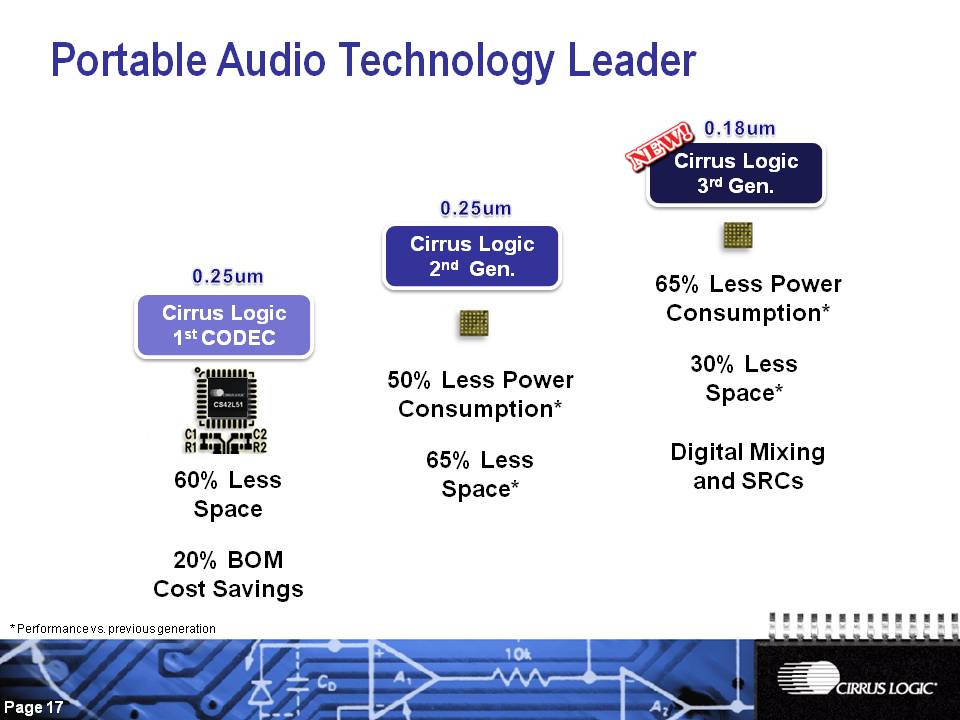
60% Less Space 20% BOM Cost Savings 65% Less Space* Cirrus Logic 1st CODEC Cirrus Logic 2nd Gen. Cirrus Logic 3rd Gen. 50% Less Power Consumption* Portable Audio Technology Leader 30% Less Space* 65% Less Power Consumption* Digital Mixing and SRCs 0.25um 0.25um 0.18um * Performance vs. previous generation
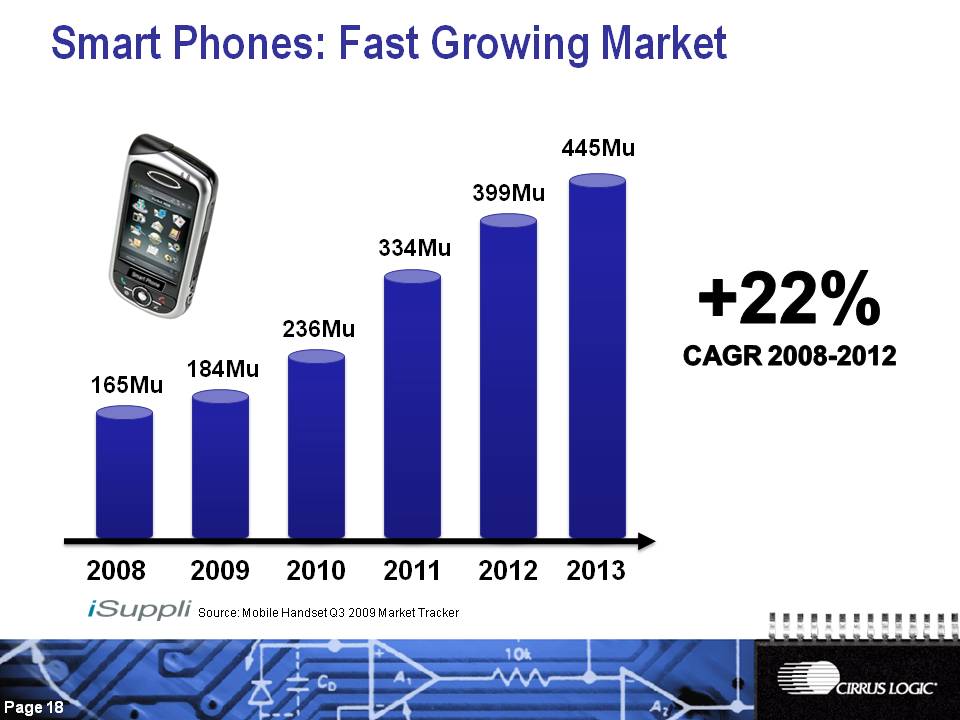
Smart Phones: Fast Growing Market 2008 2009 2010 2011 2012 2013 445Mu 399Mu 334Mu 236Mu 184Mu 165Mu Source: Mobile Handset Q3 2009 Market Tracker +22% CAGR 2008-2012
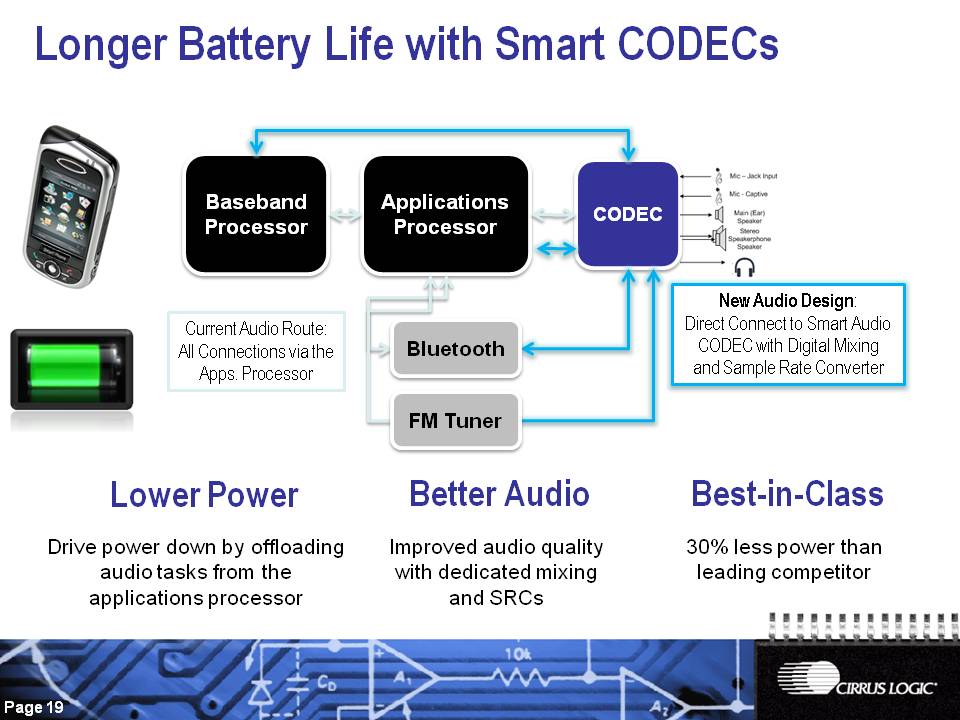
Longer Battery Life with Smart CODECs CODEC Baseband Processor Applications Processor FM Tuner Current Audio Route: All Connections via the Apps. Processor New Audio Design: Direct Connect to Smart Audio CODEC with Digital Mixing and Sample Rate Converter 30% less power than leading competitor Bluetooth Improved audio quality with dedicated mixing and SRCs Drive power down by offloading audio tasks from the applications processor Lower Power Better Audio Best-in-Class
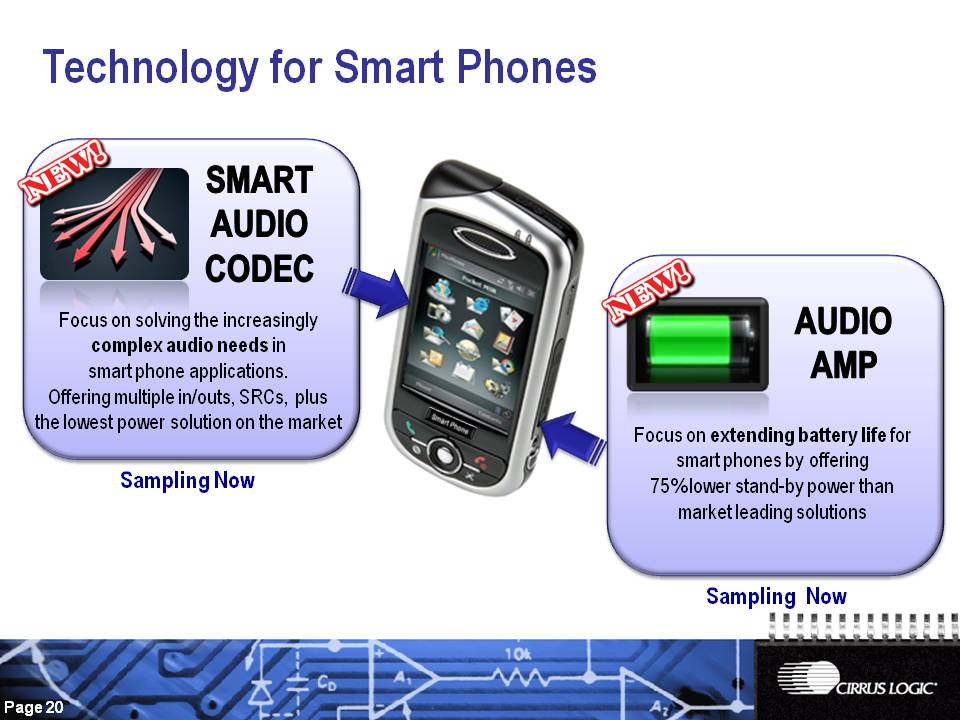
Smart Audio Codec Focus on solving the increasingly complex audio needs in smart phone applications. Offering multiple in/outs, SRCs, plus the lowest power solution on the market Focus on extending battery life for smart phones by offering 75% lower stand-by power than market leading solutions Audio Amp Sampling Now Sampling Now Technology for Smart Phones
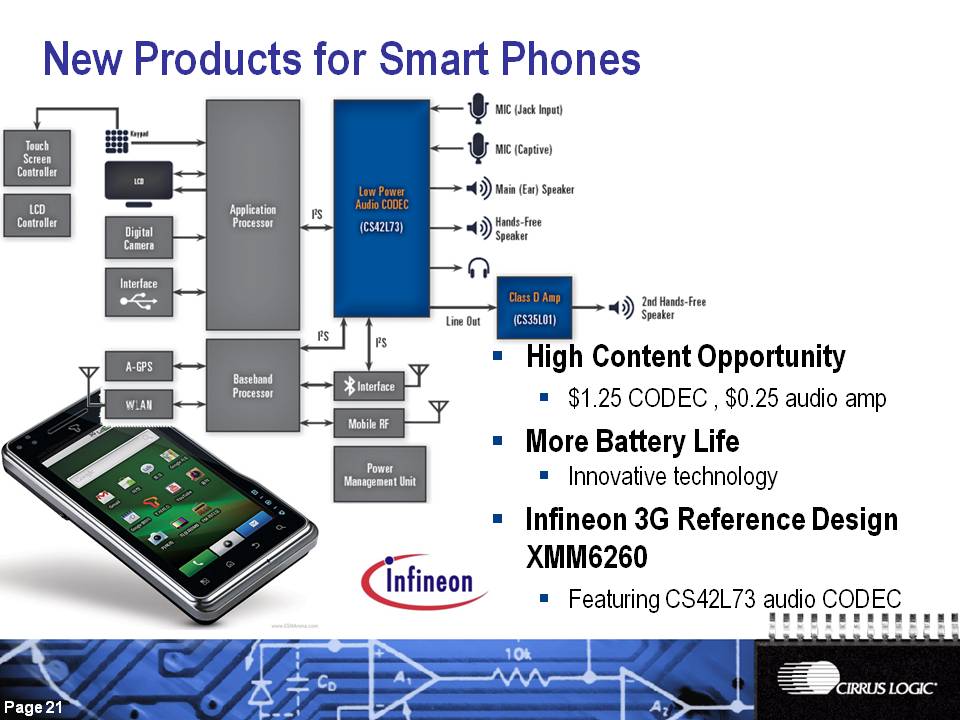
New Products for Smart Phones High Content Opportunity $1.25 CODEC , $0.25 audio amp More Battery Life Innovative technology Infineon 3G Reference Design XMM6260 Featuring CS42L73 audio CODEC
Key Customer Focused Innovation Longer Battery Life Lower System Cost Smaller Footprint Fewer External Components Higher Audio Quality Simpler Design Deep Applications Knowledge More than 1,100 Patents 25 Years of Mixed-Signal Innovation Our Sustainable Advantage

Energy
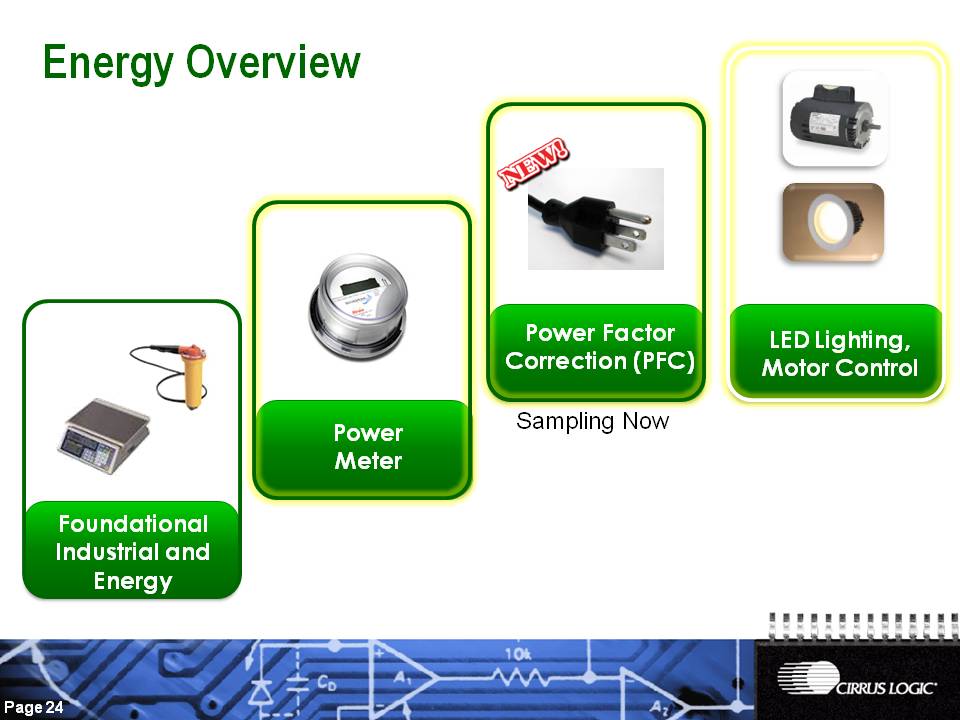
Energy Overview Foundational Industrial and Energy Power Meter Power Factor Correction (PFC) LED Lighting, Motor Control Sampling Now
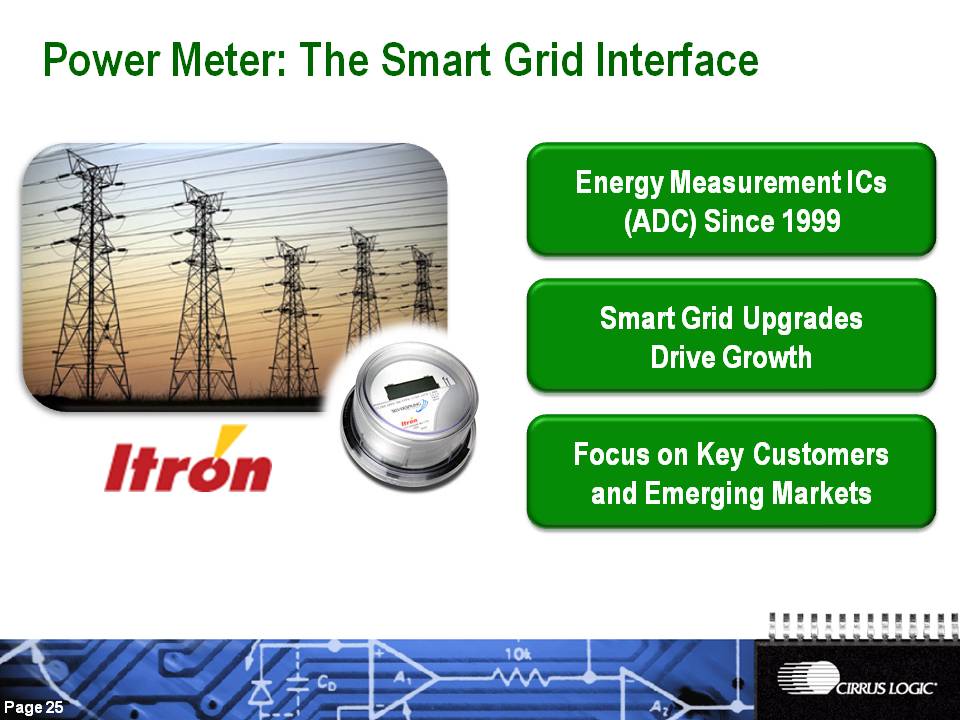
Power Meter: The Smart Grid Interface Energy Measurement ICs (ADC) Since 1999 Smart Grid Upgrades Drive Growth Focus on Key Customers and Emerging Markets
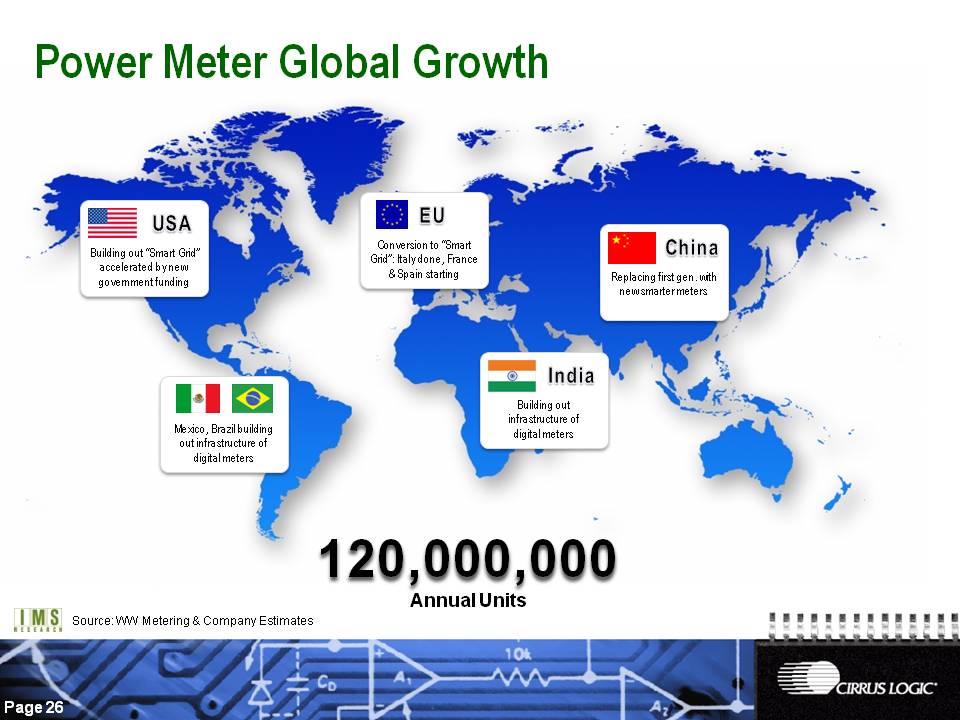
Power Meter Global Growth Conversion to “Smart Grid”: Italy done, France & Spain starting EU Replacing first gen. with new smarter meters China Building out infrastructure of digital meters India Building out “Smart Grid” accelerated by new government funding USA Mexico, Brazil building out infrastructure of digital meters 120,000,000 Annual Units Source: WW Metering & Company Estimates
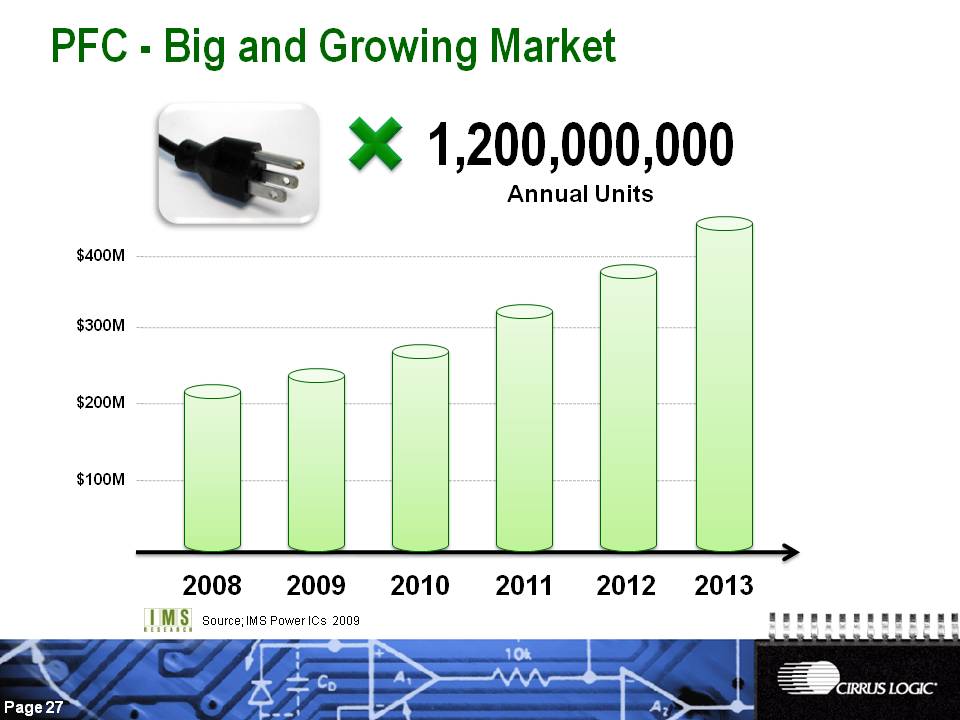
PFC - Big and Growing Market 2008 2009 2010 2011 2012 $100M $200M $300M $400M Source; IMS Power ICs 2009 2013 1,200,000,000 Annual Units
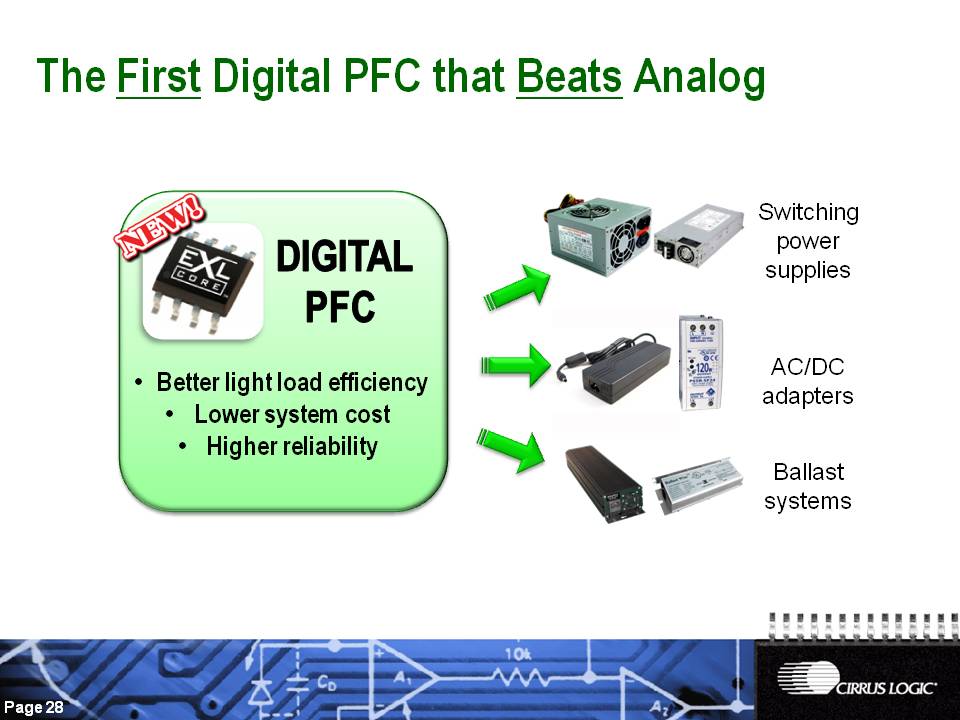
Digital PFC Switching power supplies AC/DC adapters Ballast systems The First Digital PFC that Beats Analog Better light load efficiency Lower system cost Higher reliability
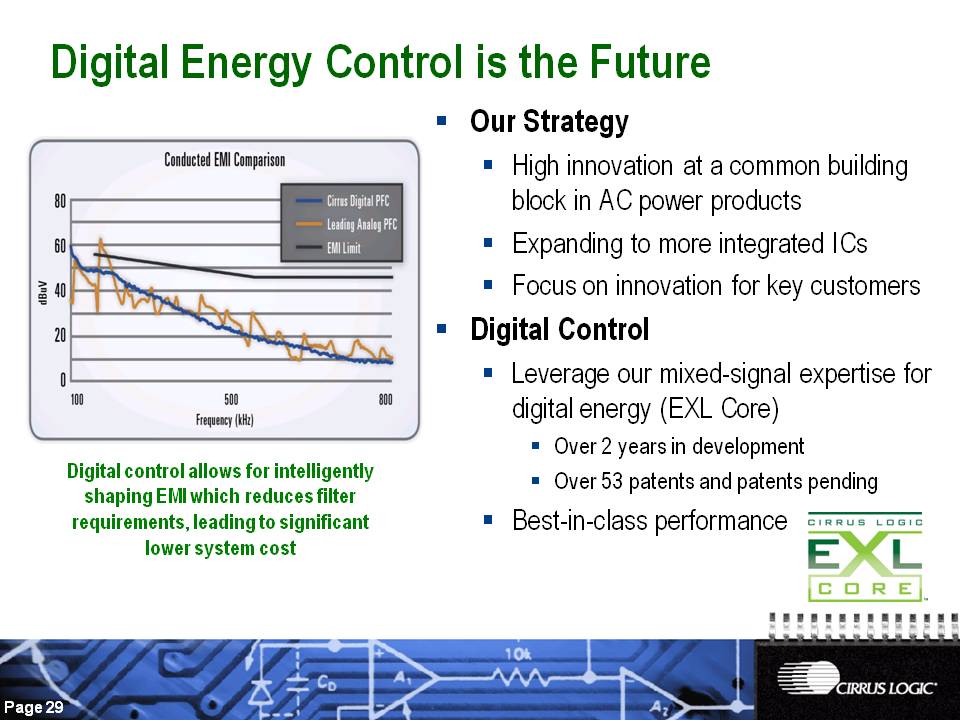
Digital Energy Control is the Future Our Strategy High innovation at a common building block in AC power products Expanding to more integrated ICs Focus on innovation for key customers Digital Control Leverage our mixed-signal expertise for digital energy (EXL Core) Over 2 years in development Over 53 patents and patents pending Best-in-class performance Digital control allows for intelligently shaping EMI which reduces filter requirements, leading to significant lower system cost
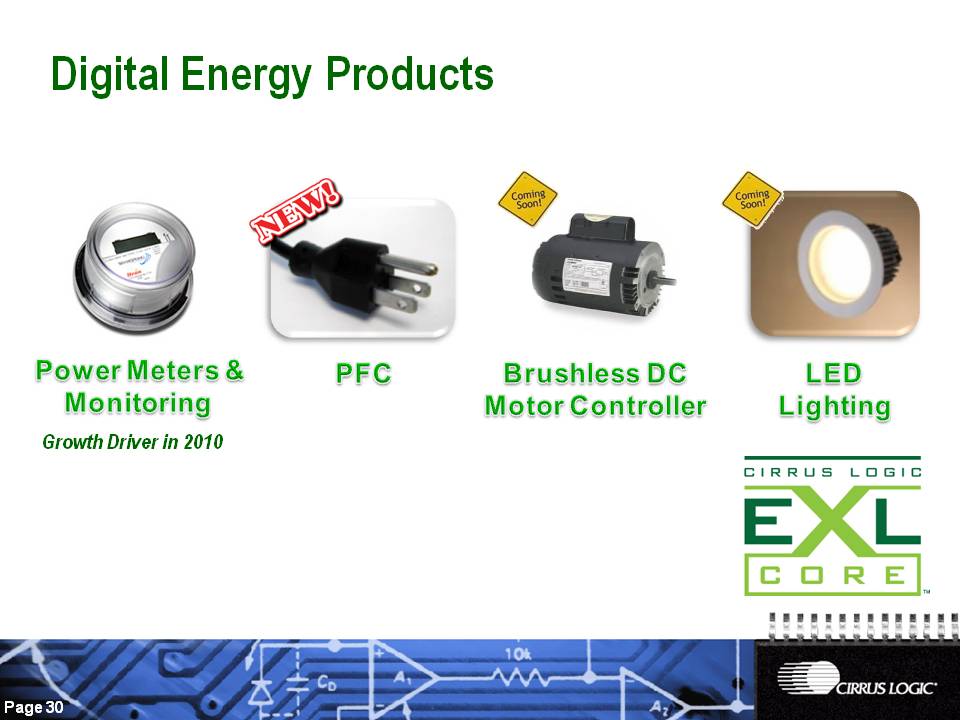
Digital Energy Products PFC LED Lighting Brushless DC Motor Controller Power Meters & Monitoring Growth Driver in 2010

Financials
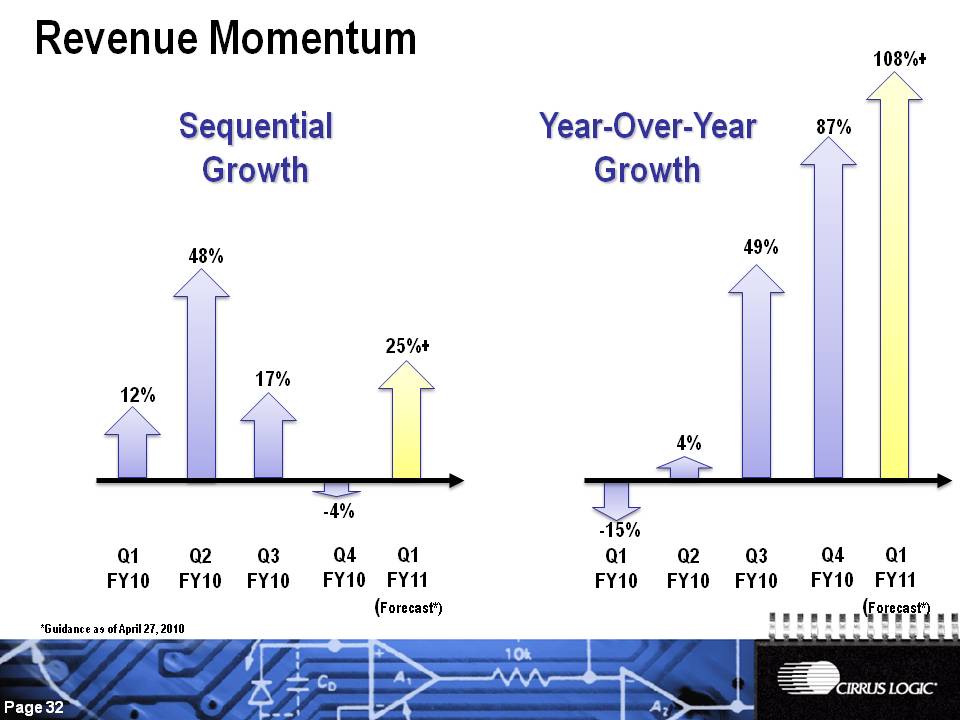
Revenue Momentum 108%+ Q1 FY10 Q2 FY10 Q3 FY10 Q4 FY10 Q1 FY11 (Forecast*) 87% 49% 4% -15% Q1 FY10 Q2 FY10 Q3 FY10 Q4 FY10 Q1 FY11 (Forecast*) 25%+ 17% -4% 48% 12% *Guidance as of April 27, 2010 Year-Over-Year Growth Sequential Growth
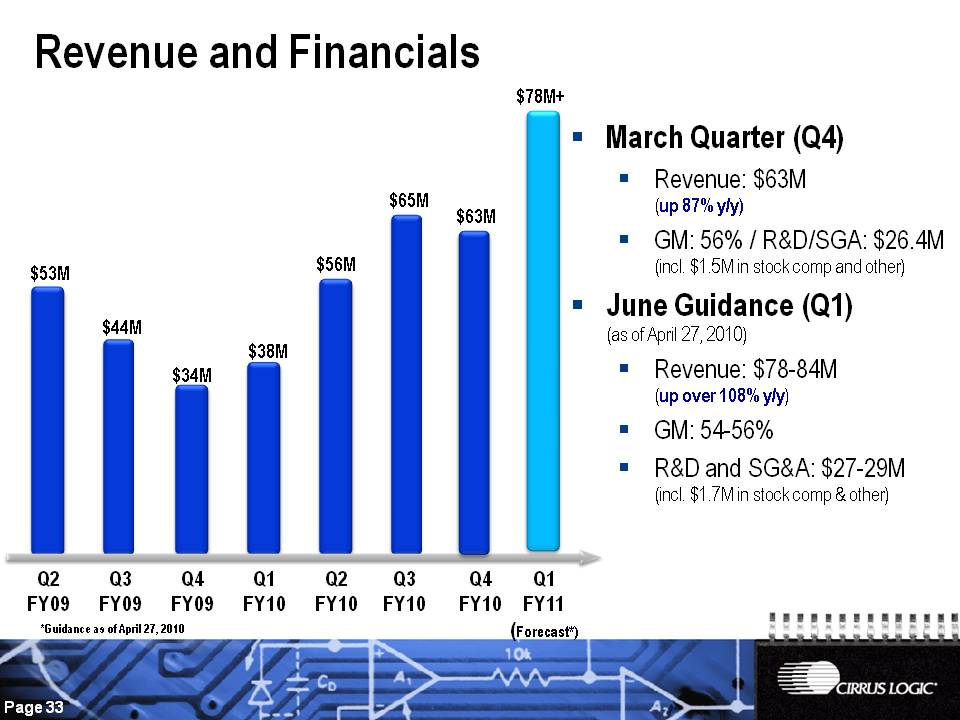
Q1 FY10 Q2 FY10 Q3 FY09 Q2 FY09 Q4 FY09 $53M $56M $44M $34M $38M Revenue and Financials Q3 FY10 $65M March Quarter (Q4) Revenue: $63M (up 87% y/y) GM: 56% / R&D/SGA: $26.4M (incl. $1.5M in stock comp and other) June Guidance (Q1) (as of April 27, 2010) Revenue: $78-84M (up over 108% y/y) GM: 54-56% R&D and SG&A: $27-29M (incl. $1.7M in stock comp & other) $63M Q4 FY10 Q1 FY11 (Forecast*) $78M+ *Guidance as of April 27, 2010
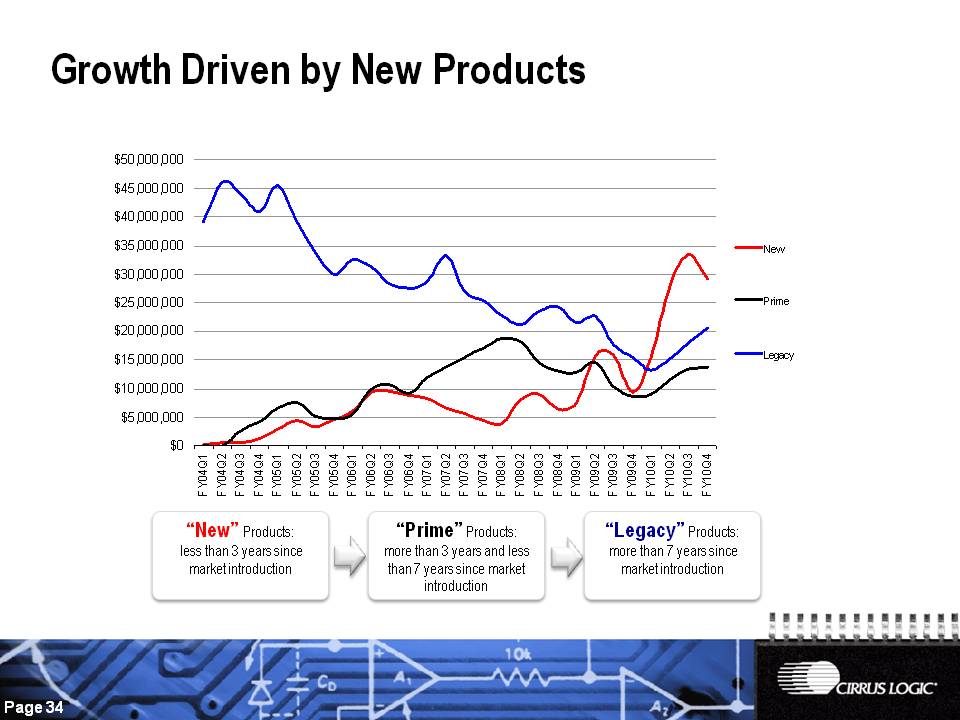
Growth Driven by New Products “New” Products: less than 3 years since market introduction “Prime” Products: more than 3 years and less than 7 years since market introduction “Legacy” Products: more than 7 years since market introduction
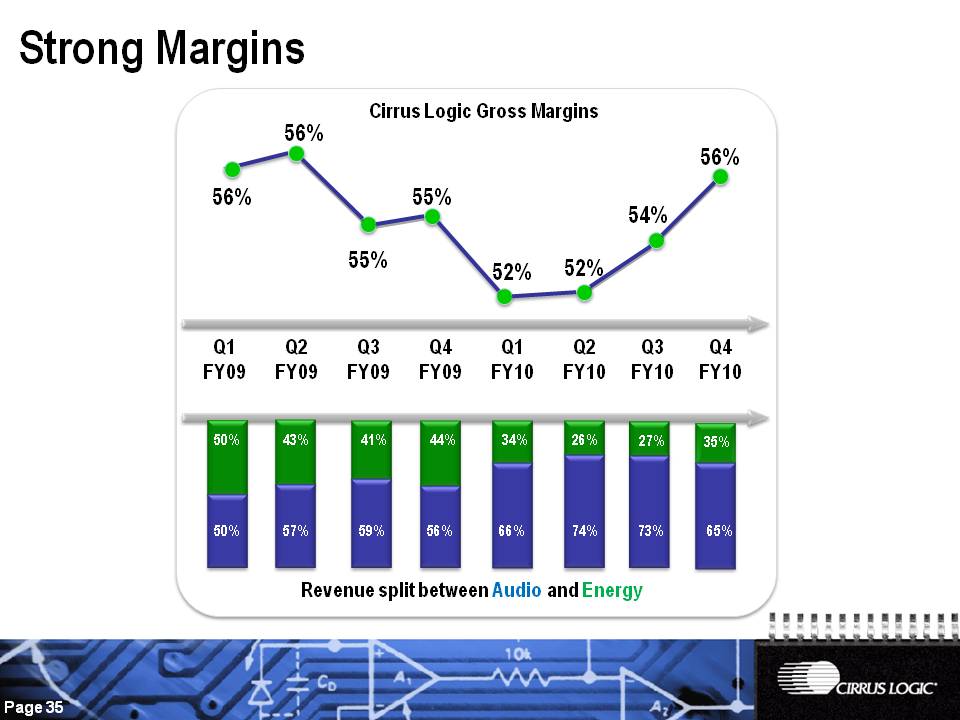
Q1 FY10 Q2 FY10 Q3 FY09 Q2 FY09 Q1 FY09 Q4 FY09 Q3 FY10 52% 52% 55% 55% 56% 56% 54% Revenue split between Audio and Energy Cirrus Logic Gross Margins Strong Margins 50% 57% 59% 56% 66% 74% 50% 43% 41% 44% 34% 26% Q4 FY10 56% 27% 73% 35% 65%
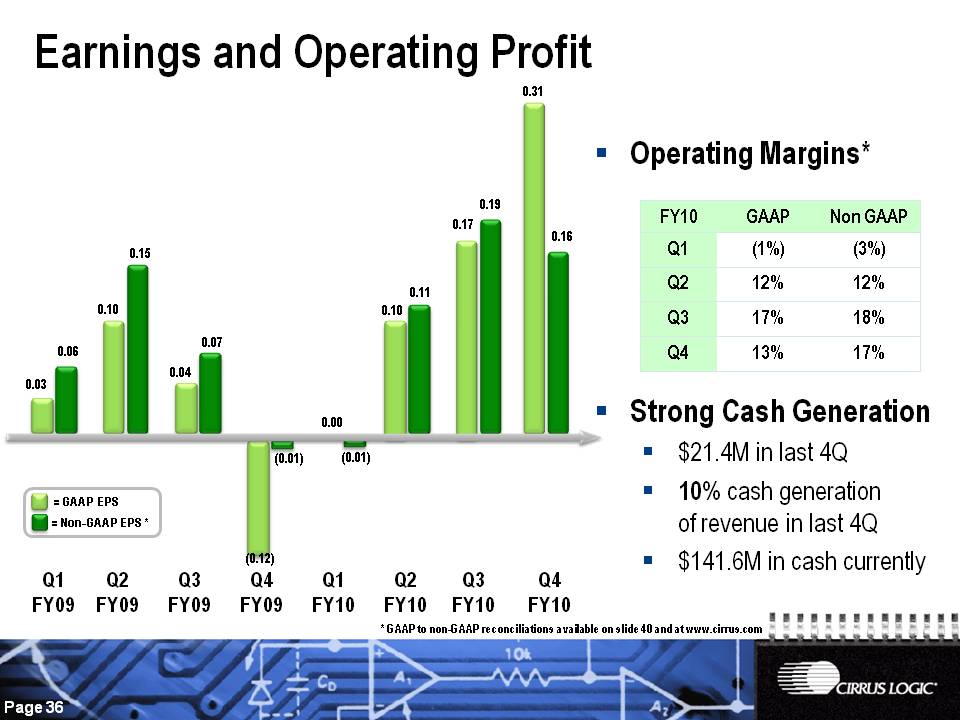
Q1 FY10 Q2 FY10 Q3 FY09 Q2 FY09 Q4 FY09 0.03 Earnings and Operating Profit Q3 FY10 Operating Margins* Strong Cash Generation $21.4M in last 4Q 10% cash generation of revenue in last 4Q $141.6M in cash currently Q4 FY10 0.06 0.10 0.15 0.04 0.07 0.31 0.16 (0.01) 0.11 0.17 0.19 Q1 FY09 (0.01) (0.12) = GAAP EPS = Non-GAAP EPS * 0.00 0.10 * GAAP to non-GAAP reconciliations available on slide 40 and at www.cirrus.com
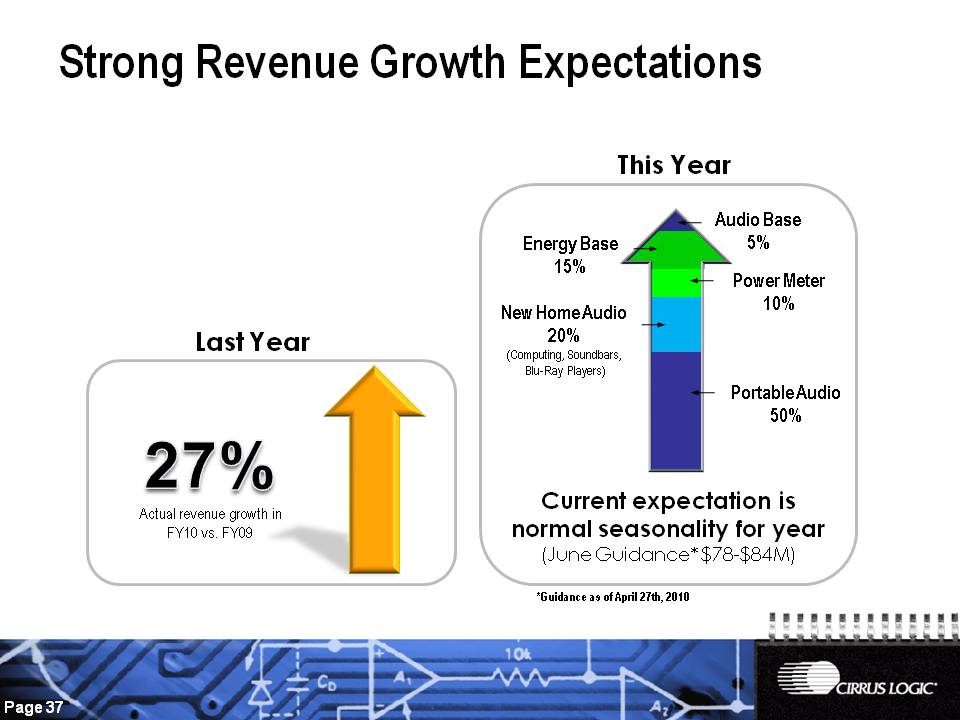
Strong Revenue Growth Expectations 27% Actual revenue growth in FY10 vs. FY09 Last Year This Year Portable Audio 50% New Home Audio 20% (Computing, Soundbars, Blu-Ray Players) Power Meter 10% Energy Base 15% Audio Base 5% Current expectation is normal seasonality for year (June Guidance* $78-$84M) *Guidance as of April 27th, 2010
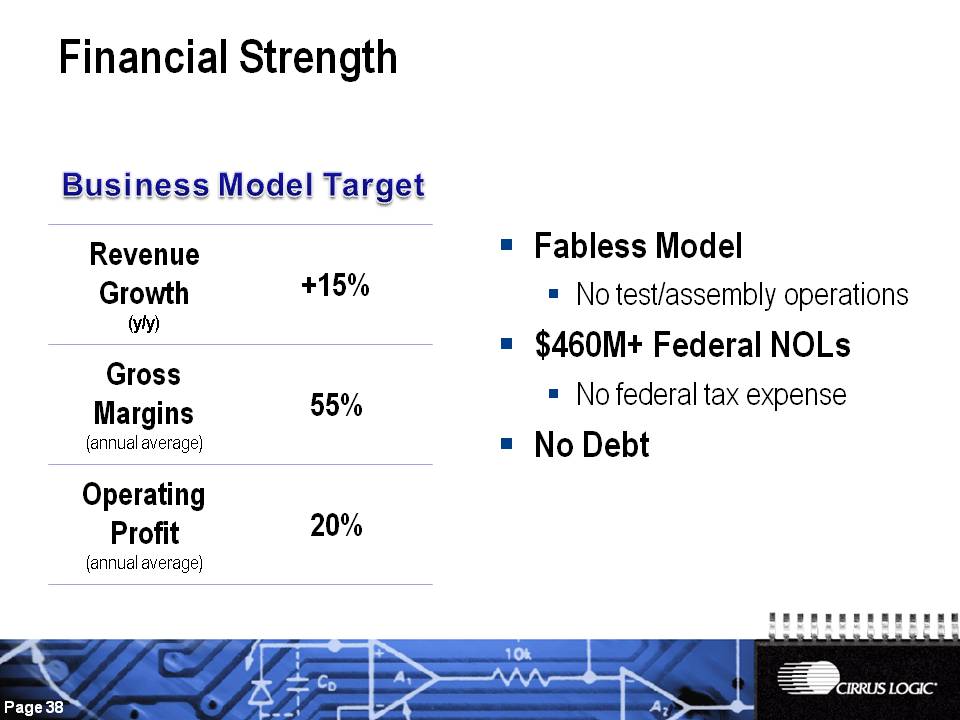
Fabless Model No test/assembly operations $460M+ Federal NOLs No federal tax expense No Debt Financial Strength Business Model Target Revenue Growth (y/y) +15% Gross Margins (annual average) 55% Operating Profit 20%

Home Audio Smart Phone 2009/10 Our Long Term Growth Drivers 2011 & Beyond Power Meter PFC LED Lighting Motor Control Portable Media Player 2008 More Smart Phones
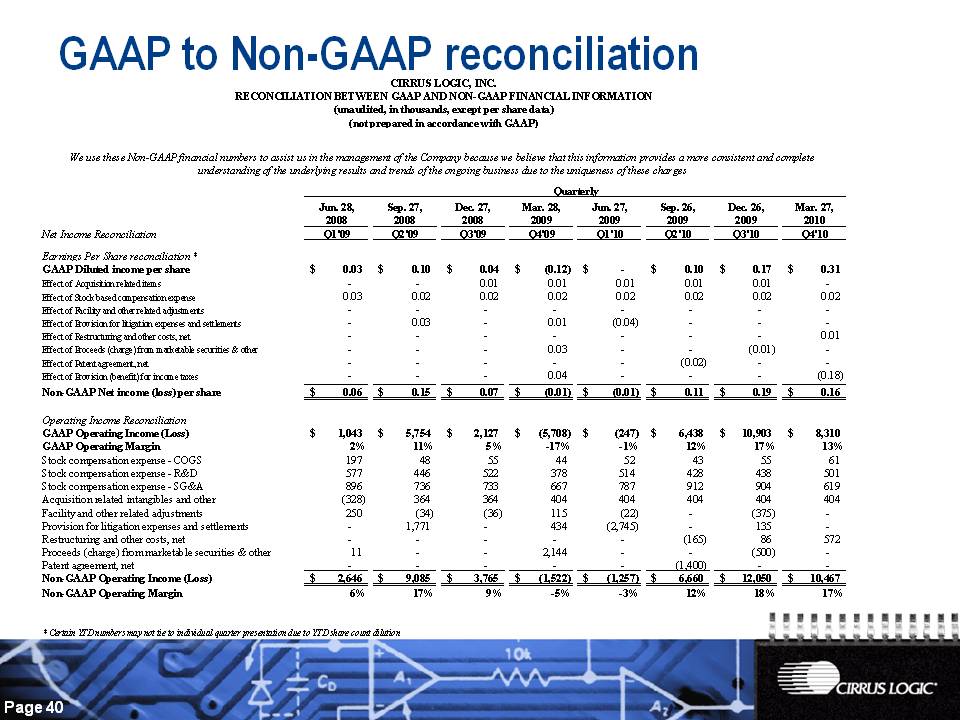
GAAP to Non-GAAP reconciliation CIRRUS LOGIC, INC. RECONCILIATION BETWEEN GAAP AND NON-GAAP FINANCIAL INFORMATION (unaudited, in thousands, except per share data) (not prepared in accordance with GAAP) We use these Non-GAAP financial numbers to assist us in the management of the Company because we believe that this information provides a more consistent and complete understanding of the underlying results and trends of the ongoing business due to the uniqueness of these charges Jun. 28, Sep. 27, Dec. 27, Mar. 28, Jun. 27, Sep. 26, Dec. 26, Mar. 27, 2008 2009 2010 Net Income Reconciliation Q1'09 Q2'09 Q3'09 Q4'09 Q1'10 Q2'10 Q3'10 Q4'10 Earnings Per Share reconciliation * GAAP Diluted income per share 0.03 $ 0.10 $ 0.04 $ (0.12) $ $ 0.10 $ 0.17 $ 0.31 $ Effect of Acquisition related items 0.01 Effect of Stock based compensation expense 0.03 0.02 0.02 Facility and other related adjustments Effect of Effect of Provision for litigation expenses and settlements 0.03 0.01 (0.04) Effect of Restructuring and other costs, net 0.01 Effect of Proceeds (charge) from marketable securities & other 0.03 (0.01) Effect of Patent agreement, net (0.02) Effect of Provision (benefit) for income taxes 0.04 (0.18) Non-GAAP Net income (loss) per share 0.06 $ 0.15 $ 0.07 $ (0.01) $ (0.01) $ 0.11 $ 0.19 $ 0.16 $ Operating Income Reconciliation GAAP Operating Income (Loss) 1,043 $ 5,754 $ 2,127 $ (5,708) $ (247) $ 6,438 $ 10,903 $ 8,310 $ GAAP Operating Margin 2% 11% 5% -17% -1% 12% 17% 13% Stock compensation expense - COGS 197 48 55 44 52 43 55 61 Stock compensation expense R&D 577 446 522 378 514 428 438 501 Stock compensation expense SG&A 896 736 733 667 787 912 904 619 Acquisition related intangibles and other (328) 364 404 Facility and other related adjustments 250 (34) (36) 115 (22) (375) Provision for litigation expenses and settlements 1,771 434 (2,745) 135 Restructuring and other costs, net (165) 86 572 Proceeds (charge) from marketable securities & other 11 2,144 (500) Patent agreement, net (1,400) Non-GAAP Operating Income (Loss) 2,646 $ 9,085 $ 3,765 $ (1,522) $ (1,257) $ 6,660 $ 12,050 $ 10,467 $ Non-GAAP Operating Margin 6% 17% 9% -5% -3% 12% 18% 17% * Certain YTD numbers may not tie to individual quarter presentation due to YTD share count dilution