Attached files
| file | filename |
|---|---|
| 8-K - FORM 8-K - PERDOCEO EDUCATION Corp | d8k.htm |
 Career Education Corporation
UBS Global Technology and Services Conference
June 8, 2010
Copyright Career Education Corporation 2010
Exhibit 99.1 |
 Mike Graham
Executive Vice President and Chief Financial Officer
Copyright Career Education Corporation 2010 |
 During
this
presentation,
we
will
make
forward-looking
statements
subject
to
known
and
unknown
risks
and
uncertainties
that
could
cause
actual
performance
to
differ
materially
from
that
expressed
or
implied
by
the
statements.
These
statements
are
based
on
information
currently
available
to
us.
Some
factors
that
could
cause
actual
results
and
performance
to
differ
are:
•Our
ability
to
comply
with
the
extensive
regulatory
requirements
and
accreditation
requirements
for
school
operations
•Changes
and
uncertainties
in
student
lending
markets
and
federal
and
state
student
financial
aid
programs
•Financial
and
operating
results,
including
new
student
starts
•Our
ability
to
manage
and
grow
our
business
in
current
and
changing
economic,
political,
regulatory
and
competitive
environments
•Litigation,
claims
and
administrative
proceedings
involving
the
company
•Other
risks
described
from
time
to
time
in
our
press
releases
and
our
filings
with
the
Securities
and
Exchange
Commission
We
undertake
no
obligation
to
publicly
release
any
revisions
to
forward-looking
statements
to
reflect
events
or
expectations
after
the
date
of
this
presentation.
We
provide
a
detailed
discussion
of
risk
factors
in
our
SEC
filings
and
encourage
you
to
review
the
filings.
Safe Harbor |
 The
Company
has
included
some
non-GAAP
financial
measures
in
this
presentation
to
discuss
the
Company's
financial
results
and
outlook.
As
a
general
matter,
the
Company
uses
these
non-GAAP
measures
in
addition
to
and
in
conjunction
with
results
presented
in
accordance
with
GAAP.
Among
other
things,
the
Company
may
use
such
non-GAAP
financial
measures
in
addition
to
and
in
conjunction
with
corresponding
GAAP
measures,
to
help
analyze
the
performance
of
its
core
business,
in
connection
with
the
preparation
of
annual
budgets,
and
in
measuring
performance
for
some
forms
of
compensation.
In
addition,
the
Company
believes
that
non-GAAP
financial
measures
are
used
by
analysts
and
others
in
the
investment
community
to
analyze
the
Company's
historical
results
and
in
providing
estimates
of
future
performance
and
that
failure
to
report
these
non-GAAP
measures
could
result
in
confusion
among
analysts
and
others
and
a
misplaced
perception
that
the
Company's
results
have
underperformed
or
exceeded
expectations.
These
non-GAAP
financial
measures
reflect
an
additional
way
of
viewing
aspects
of
the
Company's
operations
that,
when
viewed
with
the
GAAP
results
and
the
reconciliations
to
corresponding
GAAP
financial
measures,
provide
a
more
complete
understanding
of
the
Company's
results
of
operations
and
the
factors
and
trends
affecting
the
Company's
business.
However,
these
non-GAAP
measures
should
be
considered
as
a
supplement
to,
and
not
as
a
substitute
for,
or
superior
to,
the
corresponding
measures
calculated
in
accordance
with
GAAP.
Non-GAAP Financial Measures |
 Career Education Overview
Purpose:
To
change
lives
through
education.
Purpose:
To
change
lives
through
education.
Bachelors
28%
Masters
4%
Certificate
24%
Associates
44%
21 to 30
43%
Under 21
16%
Over 30
41%
Students by Degree Type
Students by Age
*Demographics as of December 31, 2009
*Student Population and Graduates as of March 31, 2010
Over 116,000 Students
Over 467,000 Graduates |
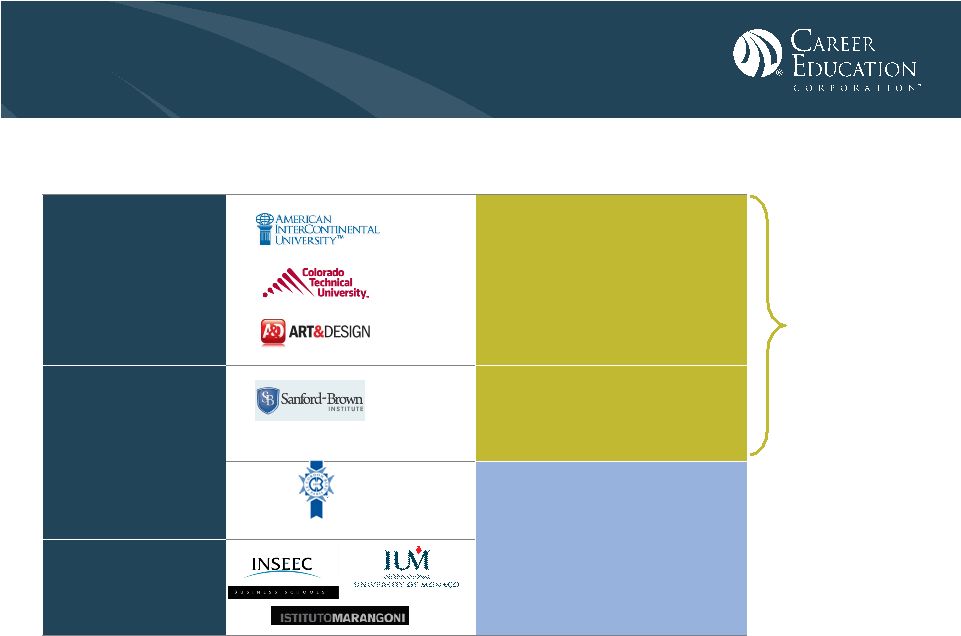
 Population
66,700
28,200
12,200
9,500
% Online
70%
<1%
<1%
# of Campuses
26
38
18
13
Accreditation
Regional
National
National
Program
Emphasis
Business, IT
Health, Design,
Protective
Health
Culinary
Business,
Design
Bachelors
Masters
Certificate
Associates
Career Education:
Diversified Institutions
University
TM
TM
International
Career-focused
*Demographics as of December 31, 2009
* Student Population as of March 31, 2010 |
 2009: A Watershed Year
2007-2008
2009
Recognize > Redefine > Reach
Strengthen
foundation
Accelerate
growth
2005
2006
2007
2008
2009
Revenue
+11%
“Watershed”:
“…an
important
point
or
transition
between
two
phases,
conditions,
etc.” |
 Results…
2007
2008 2009
Operating Income
+75%
In Millions
Student Population
2007
2008 2009
+19% |
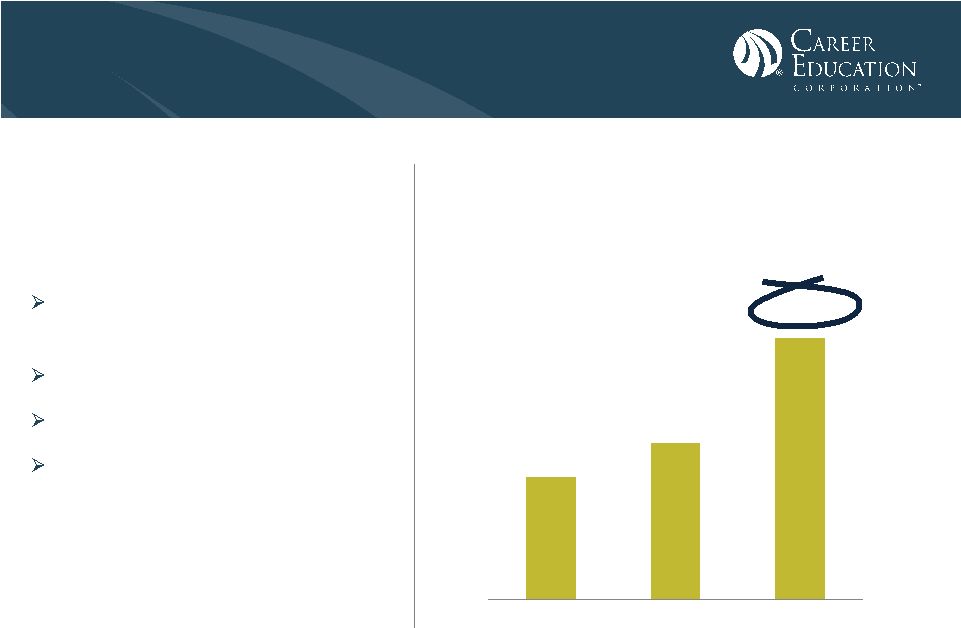
 Continued
Momentum
in
First
Quarter 2010
•
Revenue increased 22%
•
Operating income increased 72%
•
Earnings per share increased 154%
…results position us well for the balance of the year
Achieved Record Student Population Levels
Achieved Record Student Population Levels
117,000
+24% |
 Career Education:
Path Forward
2007-2008
2009
2010+
Recognize > Redefine > Reach
Next Level
•Focus
•Growth
Strengthen
foundation
Accelerate
growth |
 Largest Future
Opportunities
Well Positioned in Key Segments
University
•
Significant online
presence
•
Presence in high-
demand programs
Career-
focused
•
Strong position in
largest growth
programs
•
Premier brands in
niche markets
International
TM
TM |
 Enablers for Growth
•
Quality
•
Programs
•
Technology
•
Geographic Expansion |
 University
42%
Graduation
Rate
/1
73%
Placement
Rate
/2
Career-
focused
57%
Graduation
Rate
/1
81%
Placement
Rate
/2
Enablers for Growth:
Continued Focus on Quality Outcomes
A Simplified View of Complicated Metrics
/1:
Based
on
internal
data
available
of
students
who
graduated
within
150%
of
the
program
length.
University
cohort
is
for
students
starting
calendar
year
2003
and Career-
focused
cohort
is
for
students
starting
calendar
year
2006.
Certain
students
are
excluded
from
cohort
such
as
those
who
died
or
were
disabled
or
those
serving
in
the
armed
forces,
a
foreign
aid
service
or
on
church
missions.
/2:
Based
on
internal
data
available
of
students
graduating
between
7/1/2008
and
6/30/2009
who
have
obtained
employment
within
their
field
or
a
related
field
by
12/31/2009.
Certain
graduates
are
excluded
from
cohort
such
as
those
who
are
continuing
their
education
and
those
that
have
waived
employment
assistance
due
to
death,
disability
or
incarceration,
those
serving
in
the
armed
forces,
those
of
non-immigrant
status
and
those
voluntarily
not
seeking
employment
utilizing
skills
directly or
indirectly
taught
in
their
field
of
study.
TM
TM |
 •
CEC institutions expect to
significantly increase 2010
new program introductions
Transplant existing programs
within institutions
Augment current program areas
Enter new program areas
Expand into higher degrees
•
Developed 3-year Pipelines
70
89
150
2008
2009
2010 Est
Number of New Programs
New Programs:
Accelerate Development |
  Technology:
Innovative Learning Options
University
•
Flexible learning model to suit
learner’s preference
TM
Health
•
Simpro online simulators for
cognitive skills training |
 •
Measured expansion into new
markets
6 to 8 new campuses per year
•
Externship-driven
•
Disciplined real estate
approach
•
Program extensions into higher
degrees leveraging regional
accreditation
Geographic Expansion:
Health Education
2008
2009
2010 Est.
26
34
40 -
42
Number of Health Campuses |
 2010
Student Population Growth
15%+
Revenue Growth
15%+
Operating Income Growth
40%+
Annual
Growth
Short-term Milestones -
2010
2010+
Next Level
•Focus
•Growth
•Value
|
 8-10%
Low 20’s%
Annual
Revenue
Growth
2010 Target Operating Margin
Short-term Milestones -
2010
International
TM
TM |
 2011 -
2014
Student Population Growth
8-10%
Revenue Growth
8-10%
Operating Income Growth
15-20%
Annual
Growth
Long-term Milestones
2010+
Next Level
•Focus
•Growth
•Value
|
 8-10%
Low 20’s%
Annual
Revenue
Growth
2014 Target Operating Margin
Long-term Milestones
International
TM
TM |
 Continue
to
Generate
Strong
Cash Flow
2007 -
2009 |
 Share Repurchase
•
Remain committed to returning
excess cash to shareholders
•
$306 million total authorization as of
April 30, 2010
High ROI Strategic Investments
$85 million in 2010
•
Health Education Start-Ups
•
Chicago-area
Real
Estate
consolidation
•
Culinary Real Estate optimization
Strong Balance Sheet
•
Maintain appropriate ED ratios
•
Disciplined approach to student
payment plans
M&A
•
Disciplined approach
•
Potential for accretive tuck-in
acquisitions across University,
Career Focused and International
•
New Locations
•
New Programs Areas
Uses of Cash |
 CEC Strategic Summary
$3 Billion in
2014
Revenue
1Million
Graduates
Outstanding
Share Price
Growth
$3 Billion in
2014
Revenue
1Million
Graduates
Outstanding
Share Price
Growth
Growth
Growth
Strong Market
Trends
Enhance
Program
Development
Investment in
Leading IT
Platform
Utilize Scale &
Resources
Accelerate
M & A and
Geographic
Expansion
+
Focus
Focus
Continue Culture
of Quality and
Compliance
Intentional
Portfolio
Choices
Improved
Marketing
Effectiveness
Leverage Shared
Services
Improve Human
Capital
Management
=
Value
Value
For:
For:
Students
Students
Employees
Employees
Shareholders
Shareholders |
 Thank You!
Copyright Career Education Corporation 2010 |