Attached files
Table of Contents
Index to Financial Statements
UNITED STATES
SECURITIES AND EXCHANGE COMMISSION
Washington, D.C. 20549
FORM 10-K/A
(Amendment No. 1)
| þ | ANNUAL REPORT PURSUANT TO SECTION 13 OR 15(d) OF THE SECURITIES EXCHANGE ACT OF 1934 |
For the fiscal year ended September 25, 2009
or
| ¨ | TRANSITION REPORT PURSUANT TO SECTION 13 OR 15(d) OF THE SECURITIES EXCHANGE ACT OF 1934 |
For the transition period from to
Commission file number 333-122531
THE MONEY TREE INC
(Exact name of registrant as specified in its charter)
| Georgia | 58-2171386 | |
| State or other jurisdiction of incorporation or organization |
(I.R.S. Employer Identification No.) |
114 South Broad Street
Bainbridge, Georgia 39817
(Address, including zip code, of principal executive offices)
Registrant’s telephone number, including area code (229) 246-6536
Securities registered pursuant to Section 12(b) of the act:
None
Securities registered pursuant to section 12(g) of the Act:
None
Indicate by check mark if the registrant is a well-known seasoned issuer, as defined in Rule 405 of the Securities Act. ¨ Yes þ No
Indicate by check mark if the registrant is not required to file reports pursuant to Section 13 or Section 15(d) of the Act. ¨ Yes þ No
Indicate by check mark whether the registrant (1) has filed all reports required to be filed by Section 13 of 15(d) of the Securities Exchange Act of 1934 during the preceding 12 months (or for such shorter period that the registrant was required to file such reports), and (2) has been subject to such filing requirements for the past 90 days. þ Yes ¨ No
Indicate by check mark whether the registrant has submitted electronically and posted on its corporate Web site, if any, every Interactive Data File required to be submitted and posted pursuant to Rule 405 of Regulation S-T (§232.405 of this chapter) during the preceding 12 months (or for such shorter period that the registrant was required to submit and post such files). Yes ¨ No ¨
Indicate by check mark if disclosure of delinquent filers pursuant to Item 405 of Regulation S-K(§229.405 of this chapter) is not contained herein, and will not be contained, to the best of registrant’s knowledge, in definitive proxy or information statements incorporated by reference in Part III of the Form 10-K or any attachment to this Form 10-K. þ
| Large accelerated filer | ¨ | Accelerated filer | ¨ | |||
| Non-accelerated filer | ¨ (Do not check if a smaller reporting company) | Smaller reporting company | þ | |||
Indicate by check mark whether the registrant is a shell company (as defined in Rule 12b-2 of the Act). ¨ Yes þ No
State the aggregate market value of the voting and non-voting common equity held by non-affiliates computed by reference to the price at which the common equity was last sold, or the average bid and asked price of such common equity, as of the last business day of the registrant’s most recently completed second quarter. Not Applicable
Indicate the number of shares outstanding of each of the registrant’s classes of common stock, as of the last practicable date.
| Class |
Outstanding at November 25, 2009 | |
| Class A, Voting | 2,686 Shares | |
| Class B, Non-Voting | 26,860 Shares |
DOCUMENTS INCORPORATED BY REFERENCE
None.
Table of Contents
Index to Financial Statements
ANNUAL REPORT ON FORM 10-K/A
FOR FISCAL YEAR ENDED SEPTEMBER 25, 2009
TABLE OF CONTENTS
| Item 1. | Business | 2 | ||
| Item 1A. | Risk Factors | 11 | ||
| Item 2. | Properties | 15 | ||
| Item 3. | Legal Proceedings | 15 | ||
| Item 4. | Submission of Matters to a Vote of Security Holders | 15 | ||
| Item 5. | Market for Registrant’s Common Equity, Related Stockholder Matters and Issuer Purchases of Equity Securities | 16 | ||
| Item 6. | Selected Financial Data | 16 | ||
| Item 7. | Management’s Discussion and Analysis of Financial Condition and Results of Operations | 18 | ||
| Item 7A. | Quantitative and Qualitative Disclosures About Market Risk | 35 | ||
| Item 8. | Financial Statements and Supplementary Data | 36 | ||
| Item 9A. | Controls and Procedures | 74 | ||
| Item 10. | Directors and Executive Officers of the Registrant | 76 | ||
| Item 11. | Executive Compensation | 77 | ||
| Item 12. | Security Ownership of Certain Beneficial Owners and Management and Related Stockholder Matters | 81 | ||
| Item 13. | Certain Relationships and Related Transactions | 82 | ||
| Item 14. | Principal Accounting Fees and Services | 82 | ||
| Item 15. | Exhibits, Financial Statement Schedules | 83 | ||
Table of Contents
Index to Financial Statements
PART I
EXPLANATORY NOTE
This amendment No. 1 to this Annual Report on Form 10-K/A (“Form 10-K/A”) is being filed in order to correct previously issued historical consolidated financial statements of The Money Tree Inc. (the “Company”) as of September 25, 2009 and 2008, and for each of the three years in the period ended September 25, 2009, initially filed with the Securities and Exchange Commission (the “SEC”) on December 23, 2009, for errors in previously reported amounts related to net finance receivables, shareholders’ deficit, provision for credit losses, provision for income taxes and net loss.
For the convenience of the reader, this Form 10-K/A includes all of the information contained in the original report on Form 10-K, and no attempt has been made in this Form 10-K/A to modify or update the disclosures presented in the original report on Form 10-K, except as required to reflect the effects of the restatement. The Form 10-K/A does not reflect events occurring after the filing of the Form 10-K or modify or update those disclosures, including the exhibits to the Form 10-K affected by subsequent events. Information not affected by the restatement is unchanged and reflects the disclosures made at the time of the original filing of the Form 10-K on December 23, 2009. Accordingly, this Form 10-K/A should be read in conjunction with our filings made with the Securities and Exchange Commission subsequent to the filing of the original Form 10-K, including any amendments to those filings. The following items have been amended as a result of the restatement:
| • | Part I – Item 1 – Business; |
| • | Part I – Item 1A – Risk Factors; |
| • | Part II – Item 6 – Selected Financial Data; |
| • | Part II – Item 7 – Management’s Discussion and Analysis of Financial Condition and Results of Operations; |
| • | Part II – Item 8 – Financial Statements and Supplemental Data; |
| • | Part IV – Item 15 – Exhibits and Financial Statement Schedules. |
We have not amended and do not intend to amend our previously filed Quarterly Reports on Form 10-Q for periods affected by the restatement. For this reason, the consolidated financial statements and related financial information for the affected periods contained in any other prior reports should no longer be relied upon. In addition, this Form 10-K/A includes current certifications from the Company’s CEO and CFO as Exhibits 31.1, 31.2, and 32.1.
On April 23, 2010, the Company decided to restate our audited consolidated financial results as of September 25, 2009 and 2008 and for the three years ended September 25, 2009, 2008 and 2007 (the “Restatement”). The Restatement reflects the following adjustments:
| 1. | Consumer bankruptcy portfolio amounts contained in the Company’s net finance receivables were overstated due to an insufficient reserve for loan losses. The result was an overstatement of net finance receivables due to this insufficiency for the periods noted above, an understatement of provision for credit losses for the years ended September 25, 2009 and 2007 and an overstatement of provision for credit losses for the year ended September 25, 2008. |
| 2. | As a result of the above adjustments, we have reassessed the realizability of our net deferred income tax assets and, as a result, increased our valuation allowance recorded against such net deferred income tax assets. |
The impact of the adjustments related to the Restatement for the years ended September 25, 2009, 2008 and 2007 is summarized below:
| Net Income (Loss) | Accumulated Deficit, September 25, 2006 |
|||||||||||||||
| Year ended September 25, | ||||||||||||||||
| 2009 | 2008 | 2007 | ||||||||||||||
| As Previously Reported |
$ | (11,951,193 | ) | $ | (11,966,366 | ) | $ | 375,637 | $ | (2,982,984 | ) | |||||
| Adjustment: |
||||||||||||||||
| (Increase)/Decrease in provision for credit losses |
(983,897 | ) | 769,329 | (2,957,287 | ) | (5,754,931 | ) | |||||||||
| (Increase)/Decrease in provision for income taxes |
— | 1,210,000 | (1,210,000 | ) | — | |||||||||||
| Total adjustments |
(983,897 | ) | 1,979,329 | (4,167,287 | ) | (5,754,931 | ) | |||||||||
| As Restated |
$ | (12,935,090 | ) | $ | (9,987,037 | ) | $ | (3,791,650 | ) | $ | (8,737,915 | ) | ||||
Additional information about the decision to restate these financial statements can be found in our Current Report on Form 8-K, filed with the SEC on April 29, 2010.
1
Table of Contents
Index to Financial Statements
| Item 1. | Business: |
We originally incorporated in the State of Georgia in 1987 under the name The Money Tree Inc. Then, in 1995, pursuant to a corporate reorganization, we changed the name of the company to The Money Tree of Georgia Inc. and formed a new parent company called The Money Tree Inc. We have been engaged in the consumer finance business since our inception, primarily making, purchasing and servicing direct consumer loans, consumer sales finance contracts and motor vehicle installment sales contracts. Direct consumer loans are direct loans to customers for general use, which are collateralized by existing automobiles or consumer goods, or are unsecured. Consumer sales finance contracts consist of retail installment sales contracts for purchases of specific consumer goods by customers either from our branch locations or from a retail store and are collateralized by such consumer goods. Motor vehicle installment sales contracts are initiated by us or purchased from automobile dealers subject to our credit approval. Direct consumer loans and consumer sales finance contracts originate primarily in our branch office locations. As of September 25, 2009, direct consumer loans comprised 30.0%, motor vehicle installment sales contracts comprised 45.1%, and consumer sales finance contracts comprised 24.9% of the gross amount of our outstanding loans and contracts.
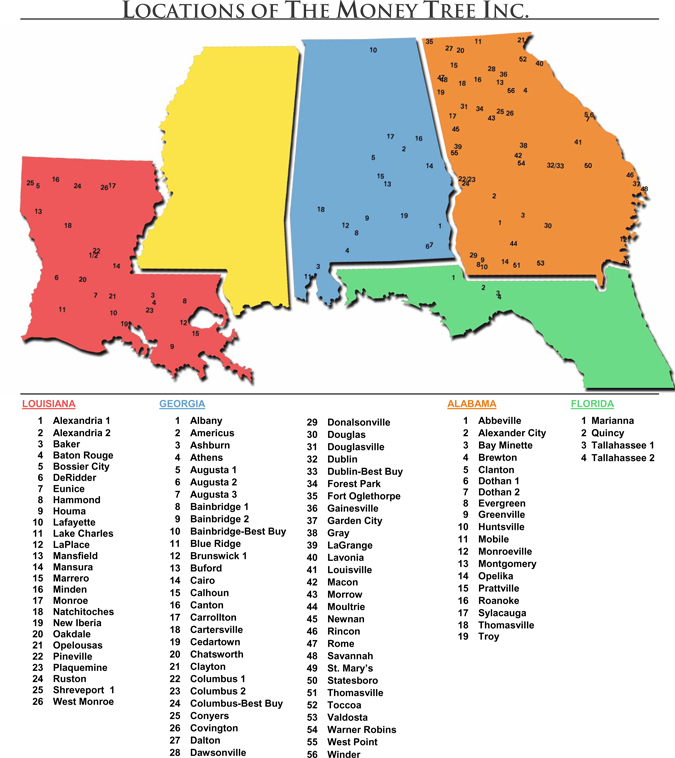
As of the date of this report, we operate 102 consumer finance branch offices in cities located throughout Georgia, Florida, Alabama and Louisiana and three used car lots in Georgia.
2
Table of Contents
Index to Financial Statements
We operate our business through the following wholly-owned subsidiaries: The Money Tree of Georgia Inc.; The Money Tree of Louisiana, Inc.; The Money Tree of Florida Inc.; Small Loans, Inc.; and Home Furniture Mart Inc. Below is a map showing our branch office locations:
3
Table of Contents
Index to Financial Statements
We fund our loan demand through a combination of cash collections from our loans, proceeds raised from the sale of debentures and demand notes and loans from various banks and other financial institutions.
Our direct consumer loans generally serve individuals with limited access to other sources of consumer credit such as banks, savings and loans, other consumer finance businesses and credit cards. Direct consumer loans are general loans made to people who need money typically for the following purposes:
| • | paying some unusual or unforeseen expense; |
| • | paying off an accumulation of small debts; or |
| • | purchasing furniture and appliances. |
To the extent they are secured at all, direct consumer loans are generally secured by personal property and/or motor vehicles already owned by our customers. Automobile sales finance loans are made primarily in the Bainbridge, Columbus and Dublin, Georgia locations (subsequent to September 25, 2009 the Columbus Georgia lot was closed). They are typically made in amounts from $3,000 to $30,000 on maturities of 24 to 54 months. Consumer sales finance contracts consist of retail installment sales contracts for purchases of specific consumer goods by customers either at our branch locations or at a retail store. The consumer goods purchased by the customer serve as collateral for these loans. We originate consumer sales finance contracts at our branch offices and sometimes purchase such contracts from retail dealers. These loans have maturities that typically range from three to 36 months and generally do not individually exceed $4,000 in principal amount. We generally charge the maximum interest rates allowed under applicable federal and state laws for our loans.
Prior to making a loan or purchasing a consumer sales finance contract or a motor vehicle installment sales contract, we undertake a credit investigation to determine the income, existing indebtedness, length and stability of employment, and other relevant information concerning the customer. When a loan is made, if it is secured at all, we are granted a security interest in personal property or automobiles of the borrower. In making direct consumer loans, we place emphasis upon the customer’s ability to repay rather than upon the potential resale value of the underlying collateral. In making motor vehicle installment sales and consumer sales finance contracts, however, we place increased emphasis upon the marketability and value of the underlying collateral.
Our business consists mainly of making loans to salaried people and wage earners who depend on their earnings to make their repayments. Our ability to operate on a profitable basis, therefore, depends to a large extent on the continued employment of these people and their ability to meet their obligations as they become due. In the event of a sustained recession or a continued downturn in the U.S. and local economies in which we operate with resulting unemployment and continued increases in the number of personal bankruptcies, our collection ratios and profitability would be detrimentally affected. See “Risk Factors – We could suffer increased credit losses if there is a continued downturn in the economy.”
4
Table of Contents
Index to Financial Statements
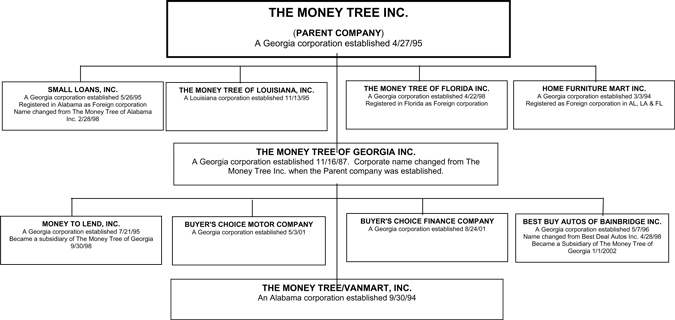
Below is a chart detailing the relationships of our subsidiaries and other related entities:
5
Table of Contents
Index to Financial Statements
Lending and Collection Operations
We seek to provide short-term loans to the segment of the population that has limited access to other sources of credit and is considered a higher credit risk. See “Risk Factors – Our typical customer base has ‘subprime’ credit ratings and higher than average credit risks which has resulted in increased loan defaults.” In evaluating the creditworthiness of potential customers, we primarily examine the individual’s discretionary income, length of current employment, duration of residence and prior credit experience. We make loans to individuals on the basis of the customer’s discretionary income and other factors and the loans are limited to amounts that we believe the customer can reasonably be expected to repay from that income. All of our new customers are required to complete standardized credit applications in person or by telephone at our local offices. We equip each of our local offices to perform immediate background, employment and credit checks. Generally, we perform loan approval at our headquarters; however, some branch managers have limited authority to approve loans up to certain amounts. When initiating a loan for a new customer, our employees verify the applicant’s employment and credit histories through telephone checks with employers or other employment references and a variety of credit services. We require substantially all new customers to submit a listing of personal property that will be pledged as collateral to secure the loan, but we do not rely on the value of such collateral in the loan approval process and generally do not perfect our security interest in that collateral. Accordingly, if the customer were to default in the repayment of the loan, we may not be able to recover the outstanding loan balance by resorting to the sale of collateral.
We believe that the development and continual reinforcement of personal relationships with customers improve our ability to monitor their creditworthiness, reduce credit risk and generate repeat loans. It is not unusual for us to have made a number of loans to the same customer over the course of several years, many of which were refinanced with a new loan after two or three payments. In determining whether to refinance existing loans, we typically require loans to be current in their payments, and repeat customers are generally required to complete a new credit application if they have not completed one within the prior two years.
In the fiscal year ended September 25, 2009, approximately 34.9% of the total number of loans we made resulted from refinancing of existing loans. Refinancings accounted for approximately 19.9% of the total volume of loans we made during that period. In the fiscal year ended September 25, 2008, approximately 34.4% of the total number of loans and 22.5% of the total volume of loans we made resulted from refinancing of existing loans. A refinancing represents a new loan transaction with an existing customer in which a portion of the new loan is used to repay the balance of an existing loan and the remaining portion is advanced to the customer. We actively market the opportunity to refinance existing loans prior to maturity due to the established credit of these customers. The refinancings result in increased amounts borrowed by the customer and additional fees and income realized by us.
We typically do not perfect our security interest in collateral securing our loans by filing Uniform Commercial Code financing statements. We usually charge a non-filing or non-recording insurance fee in connection with our direct consumer loans. These fees are equal in aggregate amount to the premiums paid by us to purchase non-filing insurance coverage from an unaffiliated insurance company. Under our non-filing insurance coverage, we are reimbursed for losses on direct consumer loans resulting from our policy of not perfecting our security interest in collateral pledged to secure the loans. Non-file insurance is not available for motor vehicle installment sales contracts and consumer sales finance contracts. We must rely on the collateral securing the loan for these two products, and any recovery on such collateral is very uncertain. See “Risk Factors – The collectibility of our finance receivables may be affected by general economic conditions and we may not be able to recover the full amount of delinquent accounts by resorting to sale of collateral or receipt of non-filing insurance proceeds.”
Competition
We compete with several national and regional finance companies, as well as a variety of local finance companies, in the communities in which we operate. We believe that we compete effectively in the marketplace primarily based on our emphasis on customer service and the variety of services we provide.
Customer Service Training. We believe intensive training for all employees is integral to the success of our customer service emphasis. Our branch structure includes three positions at each branch office: customer service representative; manager trainee; and branch manager. Customer service representatives meet customers, take payments and input loans. In addition, customer service representatives are responsible for soliciting additional business from existing customers who visit a branch by refinancing current loans. Manager trainees collect past due loans and solicit loans. Branch managers oversee branch operations and the loan making process. When an employee is hired, he or she is required to successfully complete a one- to two-week training course in our headquarters for the position. Branch managers attend both the customer service representative and collection
6
Table of Contents
Index to Financial Statements
training classes as well as a one-week manager training class (for a total of three weeks of training). Branch managers are also trained on location in their respective branches by one of our traveling trainers and by a regional manager. Designated employees in our headquarters also provide answers to questions by telephone that arise during the course of dealing with customers at the branch offices.
Additional Services to Customers. In addition to the loan services we provide, we offer certain services typically provided by banks or other institutions to consumers who do not have relationships with commercial banks or such other institutions. Please see the “Certain Relationships and Related Transactions” section for a discussion of conflicts and issues arising from various relationships between us, our executive officers and our affiliates. We believe that our ability to service our customers’ needs distinguishes us from most of our competitors that solely offer loan services. Listed below are a number of services offered by us in this capacity.
Direct Deposit. We (working in conjunction with our bank) are an approved “Authorized Payment Agent” for Social Security, Veterans Administration (VA), military and retirement benefits. We (working in conjunction with our bank) also accept direct deposit of employee payroll checks for our customers. This service allows customers to elect to receive their benefits or payroll checks at a local branch office.
Sale and Financing of Certain Consumer Goods. In each branch office location (or next door to the branch office in the State of Louisiana), we offer for sale certain furniture, appliances, electronics and other household items. See “Regulation and Supervision – State Laws.” We receive a mark-up for each of the products sold. In addition, we offer financing to eligible consumers desiring to finance the purchase of these consumer goods.
Motor Club Memberships. We offer motor club membership from Interstate Motor Club, Inc. to all customers possessing a valid driver’s license. Reimbursement benefits to members include: bail bond; emergency road service; wrecker service; emergency ambulance expense; lock and key service; emergency travel expense; and legal fees. We receive a commission on sales of motor club memberships. Interstate Motor Club, Inc. is owned by Bradley D. Bellville, our President and a director; Jefferey V. Martin, one of our directors; and two of Mr. Martin’s siblings. See “Certain Relationships and Related Transactions.”
Prepaid Telephone Service. We offer prepaid telephone service to all of our customers. We receive a commission for each customer who signs up for the service as well as a commission for each monthly payment collected. The telephone service is provided through Budget Phone, Inc., an unaffiliated entity.
Bank Draft. We offer bank draft services to all of our customers whereby amounts owed to us are automatically debited from the customer’s bank account and paid to us on a regular periodic basis. This results in ease of payment for the customer and, we believe, reduced collections costs and added predictability of cash flow.
Insurance and Other Benefits
We offer various credit and non-credit insurance products in connection with our loans. We sell insurance products as a licensed agent for a non-affiliated insurance company pursuant to certain underwriting guidelines set by the insurance company. During our fiscal year ended September 25, 2009, we earned $8.4 million in commissions from the sale of insurance products.
We offer credit life insurance, credit accident and sickness insurance and collateral protection insurance. Credit life insurance is elected by those customers who prefer to have their indebtedness covered in the event of death. Credit accident and sickness insurance is available to customers who are gainfully employed for a minimum of 30 hours per week, and provides coverage in the form of continued payments on the loan made by us in the event the customer is unable to work for a period of time. Collateral protection insurance is written to protect our security interest in certain collateral. Examples of covered collateral are automobiles, trucks, travel trailers and certain boats. When a claim is made, the insurance proceeds are payable to us and any excess is payable to the customer. This insurance pays for partial losses as well as total losses of the collateral.
7
Table of Contents
Index to Financial Statements
We also offer non-credit accidental death and dismemberment insurance to customers. This type of insurance may have a term shorter or longer than the term of the loan and coverage may exceed the principal amount of the loan. Proceeds of claims are payable to the customers and/or their beneficiaries. Customers are not required to purchase these insurance products from us in order to obtain any other product or service provided by us. See “Regulation and Supervision – State Laws.”
Provision for Credit Losses
Provision for credit losses (sometimes known as bad debt expense) is charged against income in amounts sufficient, in the opinion of senior management, to maintain an allowance for credit losses at a level considered adequate to cover the probable losses inherent in our finance receivable portfolio. Credit loss experience, contractual delinquency of finance receivables and management’s judgment are all factors used in assessing the overall adequacy of the allowance and the resulting provision for credit losses. Charge-offs are typically determined in one of three ways. First, an account that is at least 180 days past due with no payments made within the last 180 days may be charged off. Second, an account may be determined by senior management to be uncollectible under certain circumstances, as in the event of death of the customer who did not elect to purchase credit life insurance for his loan contract or in situations when repossession and sale of collateral occurs on consumer sales finance and motor vehicle installment sales contracts and the balance is not recoverable through legal process or other methods. Third, upon receipt of a notice of bankruptcy filing from the customer, the account is charged off within 30 days.
In addition to these general means of designating an account to be charged off, branch managers may encounter other situations when charge-off is appropriate. We require that a supervisor visit each branch to review all of their accounts that are potential charge-off accounts on a monthly basis. Then each supervisor meets with the operations manager for a final review. Prior to these visits, the branch manager is responsible for ensuring that all phases of the collection process have been followed. A comprehensive charge-off checklist has been developed to help the branch manager verify that all collection activities and procedures have been followed in order to have that account charged off. Senior management reviews the charge-off checklist to determine whether an account should be charged off or whether the branch manager should undertake further collection measures for the particular account.
Direct consumer loans are charged off net of proceeds from non-filing insurance. We purchase non-filing insurance on certain direct consumer loans in lieu of filing a Uniform Commercial Code financing statement. Premiums collected are remitted to the insurance company to cover possible losses from charge-offs as a result of not recording. Should we ever discontinue our practice of purchasing non-filing insurance, the proceeds from these claims would not be available to us to offset future credit losses and additional provisions for credit losses would be required.
For consumer sales finance and motor vehicle installment sales contracts, we are granted a security interest in the collateral for which the loan was made. In the event of default, the collateral on such contracts may be repossessed at 31 to 60 days’ delinquency (roughly two payments). After repossession, the collateral is sold (typically within 30 days) according to UCC-9 disposition of collateral rules and the proceeds of the sale are applied to the customer’s account. If the likelihood of collection on a judgment is favorable, a suit is filed for the deficiency balance remaining and, if granted, garnishment and/or execution follow for collection of the balance. If the collateral is not conducive to repossession because it is in unmarketable condition, judgment is sought without repossession and sale of collateral. If collection on a judgment is not favorable, the balance of the account is charged off.
As stated in the Explanatory Note to Part I, management has determined that our previous policy with respect to our consumer bankruptcy portfolio created an insufficient reserve for loan losses. Under the new policy, upon receipt of a notice of bankruptcy filing from the customer, the account is fully charged off within 30 days. If payments are received from the bankruptcy court or the bankruptcy is dismissed and the branch is able to recover all or a portion of the past due account, via cash collections or the sale of collateral, these amounts are now reported as recoveries of charge-offs.
For the fiscal years ended September 25, 2009, 2008 and 2007, our charge-offs, net of recoveries, were $10.6 million, $9.4 million and $5.1 million, respectively. We have experienced a significant increase in net charge-offs in 2008 and 2009 when compared to previous years. The declining economy, increase in cost of consumer goods, the rise in unemployment levels and bankruptcy filings have had a negative impact on our customer base. These factors have played a role in the significant increase of loan defaults occurring over the past three years. Although we continue to seek remedies through the legal process to attempt to collect past due amounts, sufficient evidence did not exist to defer the losses associated with these defaults.
8
Table of Contents
Index to Financial Statements
Allowance for Credit Losses
The allowance for credit losses (a deduction from finance receivables reported on our Consolidated Balance Sheet and sometimes known as a bad debt reserve) is determined by several factors. Historical loss experience coupled with the levels of and trends in delinquencies are the primary factors in the determination of the allowance for credit losses. Other factors such as borrowers’ ability to repay, effects of any changes in risk selection and lending policies and practices, and general economic conditions, to a lesser extent, are also considered. An evaluation is performed to compare the amount of accounts charged off, net of recoveries of such accounts, in relation to the average net outstanding finance receivables for the period being reviewed. Management has historically used this methodology to provide a benchmark for determining the allowance due to our loan portfolio in the direct consumer and consumer sales finance segments, consisting primarily of a large number of smaller balance homogeneous loans. A review is also performed of loans that comprise the automotive segment to determine if the allowance should be adjusted based on possible exposure related to collectibility of these loans. In accordance with the auto sales contract, we may repossess the collateralized vehicle after 30 days without payment to protect the vehicle’s integrity and to minimize our loss.
For the fiscal years ended September 25, 2009, 2008 and 2007, the charge-offs, net of recoveries, were $10.6 million, $9.4 million and $5.1 million, respectively. These amounts represent 16.7%, 12.8% and 6.9% of the respective year’s net average outstanding receivables. As discussed above, the poor economic conditions have played a role in the significant increase of loan defaults occurring over the past three years which has resulted in the subsequent increase in the relationship of net charge-offs to net outstanding finance receivables. Due to these circumstances, management revised its methodology in determining the adequacy of its allowance to rely much more heavily on current data.
Consequently, at September 25, 2009, we have established an allowance, expressed as a percentage of average net finance receivables, of 19.4% of direct consumer loans, 29.8% of consumer sales finance loans and 6.5% of loans in the automotive segment. The balance of the allowance for credit losses was $8.9 million and $8.8 million at September 25, 2009 and 2008, respectively.
Regulation and Supervision
Federal Laws
Our lending operations are subject to extensive federal regulation, including the Truth in Lending Act, the Equal Credit Opportunity Act and the Fair Credit Reporting Act. These laws generally require us to provide certain disclosures to prospective borrowers and protect against discriminatory lending practices and unfair credit practices.
The Truth in Lending Act requires us to make certain disclosures to our customers, including the terms of repayment, the total finance charge, the annual percentage rate charged and other information relating to the loan.
The Equal Credit Opportunity Act prohibits us from discriminating against loan applicants based on race, color, sex, age or marital status. Pursuant to Regulation B promulgated under the Equal Credit Opportunity Act, we are required to make certain disclosures regarding consumer rights and advise consumers whose credit applications are not approved of the reasons for the rejection.
The Fair Credit Reporting Act requires us to provide certain information to consumers whose credit applications are not approved on the basis of a report obtained from a consumer reporting agency. On December 4, 2003, President Bush signed into law the Fair and Accurate Credit Transaction Act. The FACT Act reauthorizes and amends the Fair Credit Reporting Act and permanently extends the state preemption provisions of the Fair Credit Reporting Act. The FACT Act also creates new provisions to strengthen consumer rights by addressing the problem of identity theft, as well as limit the disclosure of medical information for credit purposes.
The Federal Trade Commission (FTC) Credit Practices Rule prevents consumer lenders from using certain household goods as collateral on direct cash loans. We collateralize such loans with non-household goods such as automobiles, boats, mobile homes, and other exempt items.
9
Table of Contents
Index to Financial Statements
We are subject to the consumer privacy provisions of the Gramm-Leach-Bliley Act and, as such, are regulated by the FTC. The GLB Act restricts or prohibits our ability to offer non-affiliated third parties access to nonpublic personal information generated by our business. While we do not currently share any such nonpublic personal information with non-affiliated third parties, we may do so in the future. Required compliance with the GLB Act and these rules, or our failure to comply with them, may increase the overall cost to us in providing our products and services and may limit potential future revenue opportunities. In addition, the GLB Act allows states to enact consumer privacy laws that may be more burdensome or restrictive than the GLB Act, the rules promulgated thereunder and other existing federal laws. The GLB Act, the FTC’s rules, or the adoption of other consumer privacy laws or regulations could have a material adverse effect on our business, financial condition and operating results.
We are subject to the USA PATRIOT Act of 2001, including Section 352 of the Money Laundering Abatement Act, reasonably expected to detect and cause the reporting of suspicious transactions in connection with the sale of debentures and demand notes by us, direct deposits made by customers and the issuance of money orders to customers. In addition to other procedures, for investments or other cash receipts greater than $10,000, we obtain a copy of a valid driver’s license or picture identification and complete the required IRS Form 8300.
State Laws
General
State laws require that each office in which a small loan business is conducted be licensed by the state and that the business be conducted according to the applicable statutes and regulations. The granting of a license depends on the financial responsibility, character and fitness of the applicant, and, where applicable, the applicant must show finding of a need through convenience and advantage documentation. As a condition to obtaining such license, the applicant must consent to state regulation and examination and to the making of periodic reports to the appropriate governing agencies. Licenses are revocable for cause, and their continuance depends upon compliance with the law and regulations issued pursuant thereto. We have never had any of our small loan business licenses revoked.
We are also subject to state regulations governing insurance agents. State insurance regulations require that insurance agents be licensed and limit the premium amount charged for such insurance.
Georgia Laws
Direct consumer loans we make in Georgia are subject to the Georgia Industrial Loan Act. GILA governs loans of $3,000 or less and requires that lenders, like us, who are subject to GILA not loan funds for more than 36 months and 15 days. GILA provides for a maximum rate of interest and specifies permitted additional fees that can be charged for a loan, including loan fees, maintenance fees and late fees. Under GILA, a lender may also sell certain types of insurance. GILA permits us to charge and collect from our customers premiums actually paid for insurance obtained for the customer, provided that the insurance is reasonably related to the type and value of the property issued and the amount and term of the loan, and further provided that the insurance is obtained through an insurance company authorized to do business in Georgia and through a regular insurance agent licensed by the state insurance commissioner.
We also make a comparatively small number of direct consumer loans for amounts greater than $3,000 and for a longer period than 36 months and 15 days. These loans are not subject to GILA restrictions, but are made at an open, negotiated rate which, along with other terms of the loan, is subject only to the general Georgia usury laws.
In connection with the sale and financing of motor vehicles, we are generally subject to the Georgia Motor Vehicle Sales Financing Act. MVSFA requires, among other things, that certain content and notices be present in contracts and regulates the specific manner of execution and delivery of contracts. MVSFA also regulates related insurance purchased, the amount of certain finance charges, the treatment of prepayment and recovery of deficiencies in repossession cases.
Louisiana Laws
We are registered as a non-depository licensed lender in Louisiana. Direct consumer loans and sales finance loans we make in Louisiana are governed by the Louisiana Consumer Credit Law. The Louisiana Office of Financial Institutions regulates the Louisiana Consumer Credit Law. The Louisiana Consumer Credit Law generally
10
Table of Contents
Index to Financial Statements
regulates consumer loans made in Louisiana and provides for maximum rates of interest that may be charged based upon outstanding loan balance (the higher the loan balance the less the interest rate allowed to be charged). The Louisiana Consumer Credit Law specifies the permitted additional fees that may be charged in connection with a loan, including loan fees, maintenance fees and late fees. The Louisiana Consumer Credit Law allows us to request or require our customers to provide insurance in connection with consumer credit transactions. However, the maximum rates to be charged for such insurance are set by statute. The Louisiana Consumer Credit Law prevents us from displaying or selling merchandise at our branch office locations and requires that the space in which we make our consumer loans be separated from any location in which we display or sell merchandise by walls that may be broken only by a passageway in which the public does not have access.
Alabama Laws
Direct consumer loans and sales finance loans we make in Alabama are governed by the Alabama Consumer Credit Act and the regulations promulgated thereunder, also referred to as the Mini-Code. The Alabama State Banking Department, Bureau of Loans regulates the Mini-Code. The Mini-Code governs loans of $2,000 or less and provides for maximum finance charges depending on the loan balance and specifies permitted additional fees that may be charged for a loan, including loan fees, maintenance fees and late fees. Furthermore, the Mini-Code requires that we refund or credit certain unearned finance charges when a customer renews or extends a loan. The Mini-Code also requires that loans of less than $1,000 be repaid in substantially equal installments at periodic intervals over a period of not more than 36 months and 15 days for amounts financed of more than $300 and 24 months and 15 days for amounts financed of $300 or less. The Mini-Code permits us to charge and collect insurance premiums from our customers so long as the insurance is offered and written by a licensed insurance company authorized to do business in Alabama. However, the maximum rates to be charged for such insurance are set by statute. The Mini-Code also requires us to obtain the prior written approval of the State Banking Department prior to conducting any other business on the premises.
We also make a small number of consumer loans for amounts greater than $2,000 in Alabama. Such loans are not subject to the Mini-Code, but are made at an open, negotiated rate which, along with other terms of the loan, is subject only to the general Alabama usury laws.
Florida Laws
Direct consumer loans and sales finance loans we make in Florida are governed by the Florida Consumer Finance Act and are regulated by the Florida Department of Banking and Finance. The Florida Consumer Finance Act generally governs loans of less than $25,000 and provides for maximum rates of interest depending upon the loan balance and specifies permitted additional fees that may be charged for a loan, including loan fees, maintenance fees and late fees. The Florida Consumer Finance Act permits us to charge and collect insurance premiums from our customers so long as they are provided under a group or individual insurance policy which complies with the insurance laws of the State of Florida.
Employees
As of September 25, 2009, we had 370 full-time employees and five part-time employees. We do not have employment agreements with any of our employees.
| Item 1A. | Risk Factors: |
Our operations are subject to a number of risks. You should carefully read and consider these risks, together with all other information in this report. If any of the following risks actually occur, our business, financial condition or operating results and our ability to repay the debentures and demand notes could be materially adversely affected.
There is uncertainty as to our ability to continue as a going concern.
The opinion of our independent registered accounting firm for the fiscal year ended September 25, 2009, which is included in Item 8 of this report, contains a going concern qualification. This conclusion is based on our operating losses, a deficiency in net interest margin and our shareholders’ deficit. Those factors, as well as uncertainty in securing financing for continued operations, create an uncertainty regarding our ability to continue as a going concern.
11
Table of Contents
Index to Financial Statements
We suffered significant losses during fiscal years 2007, 2008 and 2009 and we anticipate such losses will likely continue in 2010.
Our net losses were approximately $3.8 million, $10.0 million and $12.9 million during fiscal years 2007, 2008 and 2009, respectively. We anticipate that such significant losses will likely continue in 2010.
We may be unable to meet our debenture and demand note redemption obligations which could force us to sell off our loan receivables and other operating assets or cease our operations.
We may issue demand notes, debentures, or similar debt instruments to investors in order to raise funds for our operations. As of September 25, 2009, we had a total of $73,602,821 of debentures and $3,146,707 of demand notes outstanding, which demand notes may be redeemed by our investors at any time. Of this amount, our subsidiary, The Money Tree of Georgia Inc., has issued $30,730,844 of debentures and $441,747 of demand notes. While the maturing debentures of our subsidiary are subject to substantially similar early redemption and automatic extension provisions as the debentures, we cannot predict with any accuracy the number of debenture holders who will elect to redeem such debentures at or prior to maturity. We intend to pay these and any other redemption obligations using our normal cash sources, such as collections on finance receivables and used car sales, as well as proceeds from the sale of the debentures and demand notes. We are substantially reliant upon the net offering proceeds we receive from the sale of the debentures and demand notes. However, during the fiscal year ended September 25, 2009, we redeemed $18.6 million in debentures, while only receiving $10.0 million from the sale of new debentures. Therefore, we have had to use funds from operations to fund these net redemptions. Our operations and other sources of funds may not provide sufficient available cash flow to meet our continued redemption obligations if the amount of redemptions continues at its current pace and we continue to suffer losses and use funds from operations to fund redemptions. If we are unable to repay or redeem the principal amount of debentures or demand notes when due, and we are unable to obtain additional financing or other sources of capital, we may be forced to sell off our loan receivables and other operating assets or we might be forced to cease our operations.
If we default in our debenture or demand note payment obligations, the indenture agreements relating to our debentures and demand notes provide that the trustee could accelerate all payments due under the debentures and demand notes, which would further negatively affect our financial position.
Our obligations with respect to the debentures and demand notes are governed by the terms of indenture agreements with U.S. Bank National Association, as trustee. Under the indentures, in addition to other possible events of default, if we fail to make a payment of principal or interest under any debenture or demand note and this failure is not cured within 30 days, we will be deemed in default. Upon such a default, the trustee or holders of 25% in principal of the outstanding debentures or demand notes could declare all principal and accrued interest immediately due and payable. Since our total assets do not cover these debt payment obligations, we would most likely be unable to make all payments under the debentures or demand notes when due, and we might be forced to cease our operations.
We suffered significant credit losses in 2009 due to continued weakening economic conditions, and there is no guarantee such credit losses will not continue during this downturn in the economy or that our operations and profitability will not continue to be negatively affected.
Because our business consists mainly of making loans to individuals who depend on their earnings to make their repayments, our ability to operate on a profitable basis depends to a large extent on the continued employment of those individuals and their ability to meet their financial obligations as they become due. In the current recession and continued downturn in the U.S. and local economies in which we operate, our customers have been affected by the resulting unemployment and increases in the number of personal bankruptcies. Therefore, we continue to experience increased credit losses and our collection ratios and profitability could continue to be materially and adversely affected. This recession has negatively affected our customers’ disposable income, confidence and spending patterns and preferences, which in turn are negatively impacting our sales of consumer goods and vehicles and our customers’ ability to repay their obligations to us. As a result, we continue to experience significant credit losses through loan charge-offs. For the fiscal year ended September 25, 2009, our charge-offs, net of recoveries, for our entire loan portfolio were $10.6 million, or 16.7% of average net finance receivables, and charge-offs for the direct consumer loans and consumer sales finance contract segments were 23.1% of the related average receivables. These high levels of charge-offs have had a negative impact on our operations and profitability. Should the current economic conditions continue or worsen, our operations and profitability will continue to be materially and adversely affected.
12
Table of Contents
Index to Financial Statements
Our significant shareholders’ deficit balance may limit our ability to obtain future financing, which could have a negative effect on our operations and our liquidity.
As of September 25, 2009, we had a shareholders’ deficit of $33,774,045, which means our total liabilities exceed our total assets. Bankruptcy law defines this as balance sheet insolvency. The existence of a significant shareholders’ deficit may limit our ability to obtain future debt or equity financing. If we are unable to obtain financing in the future, it will likely have a negative effect on our operations and our liquidity and our ability to continue as a going concern.
Our lack of a significant line of credit could affect our liquidity.
We have operated without a significant line of credit for the past several years. We have been seeking for several months to obtain a line of credit as an additional source of long-term financing. If we fail to obtain a line of credit, we will be more dependent on the proceeds from the debentures and demand notes for our continued liquidity. Since our sales of the debentures and demand notes have been significantly curtailed, our failure to obtain a line of credit would negatively affect our ability to meet our obligations.
The collectibility of our finance receivables has been severely and negatively affected by general economic conditions and we have not been able to recover the full amount of delinquent accounts by resorting to sale of collateral or receipt of non-filing insurance proceeds.
Our liquidity is dependent on, among other things, the collection of our finance receivables. We continually monitor the delinquency status of our finance receivables and promptly institute collection efforts on delinquent accounts. Collections of our consumer finance receivables have been severely and negatively affected by general economic conditions. Since we do not ordinarily perfect our security interest in collateral for loans, we have not been able to recover the full amount of outstanding receivables by resorting to the sale of collateral or receipt of non-filing insurance proceeds.
Our typical customer base has “subprime” credit ratings and higher than average credit risks which has resulted in increased loan defaults.
We typically lend money to individuals who have difficulty receiving loans from banks and other financial institutions because of credit problems or other adverse financial circumstances. Therefore, we have a higher risk of loan default among our customers than other lending companies. If we continue to suffer increased loan defaults, our operations will be materially adversely affected.
If we or our operations suffer from severe negative publicity, we could be faced with significantly greater payment or redemption obligations from holders of the demand notes than we have cash available for such payments or redemptions.
Because our demand notes are payable or redeemable at any time by holders, we cannot control the amount or timing of such payments or redemptions. If we or our operations suffer from severe negative publicity, we may receive significantly greater payment or redemption requests in a short time period than we have cash available to fund such payments or redemptions. In such event, we could be declared in default on the demand notes and other debt instruments.
Our internal controls over financial reporting may not be effective in preventing or detecting misstatements in our financial statements, and if we fail to detect material misstatements in our financial statements, our financial condition and operating results could be severely and negatively affected.
During our fiscal years ended September 25, 2009 and 2008, we concluded that our system of internal controls over financial reporting contained a material weakness and was not operating effectively. This resulted in errors in our previously issued financial statements. There can be no assurance that in the future our system of internal controls would detect misstatements in our financial statements. If we fail to detect material misstatements in our financial statements in the future, our financial condition and operating results could be severely and negatively affected.
13
Table of Contents
Index to Financial Statements
Hurricanes or other adverse weather events could negatively affect local economies or cause disruption to our branch office locations, which could have an adverse effect on our business or results of operations.
Our operations are conducted in the States of Georgia, Florida, Alabama and Louisiana, including areas susceptible to hurricanes or tropical storms. Such weather events can disrupt our operations, result in damage to our branch office locations and negatively affect the local economies in which we operate. We cannot predict whether or to what extent future hurricanes will affect our operations or the economies in our market areas, but such weather events could result in a decline in loan originations and an increase in the risk of delinquencies, foreclosures or loan losses. Our business or results of operations may be adversely affected by these and other negative effects of future hurricanes.
Additional competition may decrease our liquidity and profitability.
We compete for business with a number of large national companies and banks that have substantially greater resources, lower cost of funds, and a more established market presence than we have. If these companies increase their marketing efforts to include our market niche of borrowers, or if additional competitors enter our markets, we may be forced to reduce our interest rates and fees in order to maintain or expand our market share. Any reduction in our interest rates or fees could have an adverse impact on our liquidity and profitability.
An increase in market interest rates may result in a reduction in our liquidity and increased losses or delay in our return to profitability and impair our ability to pay interest and principal on our debentures and demand notes.
Interest rates are currently at or near historic lows. Sustained, significant increases in interest rates could unfavorably impact our liquidity and increase our losses or delay our return to profitability by reducing the interest rate spread between the rate of interest we receive on loans and interest rates we must pay under our demand notes and debentures and any bank debt we incur. Any reduction in our liquidity and increase in our losses or delay in our return to profitability would diminish our ability to pay principal and interest on the debentures and demand notes.
We are subject to many laws and governmental regulations, and any changes in these laws or regulations may materially adversely affect our financial condition and business operations.
Our operations are subject to regulation by federal authorities and state banking, finance, consumer protection and insurance authorities and are subject to various laws and judicial and administrative decisions imposing various requirements and restrictions on our operations which, among other things, require that we obtain and maintain certain licenses and qualifications, and limit the interest rates, fees and other charges we may impose in our consumer finance business. Although we believe we are in compliance in all material respects with applicable laws, rules and regulations, we cannot assure you that we are or that any change in such laws, or in the interpretations thereof, will not make our compliance with such laws more difficult or expensive or otherwise adversely affect our financial condition or business operations.
We are devoting resources to comply with various provisions of the Sarbanes-Oxley Act, including Section 404 relating to internal controls testing and auditor attestation, and this may reduce the resources we have available to focus on our core business.
For fiscal year ended September 25, 2009, we are subject to the requirements of Section 404(A) of the Sarbanes-Oxley Act, and in order to ensure compliance with the various provisions of the Sarbanes-Oxley Act, we have evaluated our internal controls over financial reporting to allow management to report on our internal controls systems. Among other things, we may not be able to conclude on an ongoing basis that we have effective internal controls over financial reporting in accordance with Section 404. Any failure to comply with the various requirements of the Sarbanes-Oxley Act, may require significant management time and expenses, and divert attention or resources away from our core business.
Beginning with the fiscal year ending September 25, 2010, our independent registered public accounting firm will be required to attest to our internal controls systems and may not be able or willing to issue a favorable assessment of our internal controls over financial reporting.
We are controlled by the Martin family and do not have any independent board members overseeing our operations.
Our board of directors consists of Bradley D. Bellville, our President, and Jefferey V. Martin. We do not have any independent directors on our board. In addition, The Vance R. Martin Family Trust owns a majority of the outstanding shares of our voting capital stock. While W. Derek Martin, our former Chairman, is no longer an officer or actively involved in our operations, he serves as the sole trustee of the Trust. Therefore, the Martin family will be able to exercise significant control over our affairs, including the election of directors.
14
Table of Contents
Index to Financial Statements
| Item 2. | Properties: |
As of the date of this report, we lease all 102 of our branch office locations, the three used car lots and our corporate headquarters in Bainbridge, Georgia. Martin Family Group, LLLP owns and leases to us the real estate for thirteen of these branch office locations, one used car lot and our corporate headquarters. One of our shareholders is the president of Martin Investments, Inc. which is the managing general partner of Martin Family Group LLLP. In addition, Martin Sublease, L.L.C. leases from the owners, and subleases to us, 53 of these branch office locations and two used car lots.
| Item 3. | Legal Proceedings: |
As of the date of this report, neither we nor any of our officers or directors is a party to, and none of our property is presently the subject of, any pending or threatened legal proceeding or proceeding by a governmental authority that could have a material adverse effect on our business. We are a party to litigation and other contingent assets and liabilities arising in the normal course of business.
| Item 4. | Submission of Matters to a Vote of Security Holders: |
No matters were submitted to a vote of the security holders during the quarter ended September 25, 2009.
15
Table of Contents
Index to Financial Statements
PART II
| Item 5. | Market for Registrant’s Common Equity, Related Stockholder Matters and Issuer Purchases of Equity Securities: |
Not applicable.
| Item 6. | Selected Financial Data: |
The following selected consolidated financial data should be read in conjunction with “Management’s Discussion and Analysis of Financial Condition and Results of Operations” and our audited consolidated financial statements and related notes included elsewhere in this report. The selected consolidated balance sheet data, as of September 25, 2009 and 2008, and the selected consolidated statement of operations data, for the fiscal years ended September 25, 2009, 2008 and 2007, have been derived from our audited consolidated financial statements and related notes included in this report. The selected consolidated balance sheet data, as of September 25, 2007, 2006, and 2005, and the selected consolidated statement of operations data, for the fiscal year ended September 25, 2006 and 2005, have been derived from our audited financial statements that are not included in this report.
16
Table of Contents
Index to Financial Statements
| As of, and for, the Fiscal Year Ended September 25, | ||||||||||||||||||||
| 2009 | 2008 | 2007 | 2006 | 2005 | ||||||||||||||||
| (Restated) | (Restated) | (Restated) | (Restated) | (Restated) | ||||||||||||||||
| Interest and fee income |
$ | 15,589 | $ | 19,280 | $ | 19,481 | $ | 20,048 | $ | 18,843 | ||||||||||
| Interest expense |
(7,611 | ) | (8,275 | ) | (8,026 | ) | (7,350 | ) | (6,355 | ) | ||||||||||
| Net interest and fee income before provision for credit losses |
7,978 | 11,005 | 11,455 | 12,698 | 12,488 | |||||||||||||||
| Provision for credit losses |
(10,614 | ) | (13,043 | ) | (7,940 | ) | (4,718 | ) | (4,116 | ) | ||||||||||
| Net revenue (loss) from interest and fees after provision for credit losses |
(2,636 | ) | (2,038 | ) | 3,515 | 7,980 | 8,372 | |||||||||||||
| Insurance commissions |
8,354 | 9,615 | 10,120 | 11,263 | 10,490 | |||||||||||||||
| Commissions from motor club memberships(1) |
1,602 | 1,844 | 1,947 | 1,957 | 1,475 | |||||||||||||||
| Delinquency fees |
1,561 | 1,720 | 1,776 | 1,565 | 1,676 | |||||||||||||||
| Income tax service income(2) |
— | — | 3 | 83 | 162 | |||||||||||||||
| Other income |
530 | 647 | 748 | 689 | 797 | |||||||||||||||
| Net revenues before retail sales |
9,411 | 11,788 | 18,109 | 23,537 | 22,972 | |||||||||||||||
| Retail sales |
16,019 | 17,164 | 19,002 | 17,972 | 15,061 | |||||||||||||||
| Cost of sales |
(10,366 | ) | (11,131 | ) | (12,170 | ) | (11,611 | ) | (9,358 | ) | ||||||||||
| Gross margin on retail sales |
5,653 | 6,033 | 6,832 | 6,361 | 5,703 | |||||||||||||||
| Net revenues |
15,064 | 17,821 | 24,941 | 29,898 | 28,675 | |||||||||||||||
| Operating expenses |
(28,426 | ) | (28,469 | ) | (27,604 | ) | (29,151 | ) | (29,205 | ) | ||||||||||
| Net operating income (loss) |
(13,362 | ) | (10,468 | ) | (2,663 | ) | 747 | (530 | ) | |||||||||||
| Other non-operating income |
— | — | — | 151 | — | |||||||||||||||
| Loss on sale of property and equipment |
(11 | ) | (21 | ) | (19 | ) | (75 | ) | (81 | ) | ||||||||||
| Income (loss) before income tax benefit (expense) |
(13,373 | ) | (10,669 | ) | (2,682 | ) | 823 | (611 | ) | |||||||||||
| Income tax benefit (expense) |
438 | 682 | (1,109 | ) | (274 | ) | (304 | ) | ||||||||||||
| Net income (loss) |
$ | (12,935 | ) | $ | (9,987 | ) | $ | (3,791 | ) | $ | 549 | $ | (915 | ) | ||||||
| Ratio of earnings to fixed charges(3) |
(4) | (4) | (4) | 1.10 | (4) | |||||||||||||||
| Cash and cash equivalents |
$ | 2,922 | $ | 12,541 | $ | 17,854 | $ | 12,920 | $ | 9,619 | ||||||||||
| Finance receivables(5) |
56,281 | 68,601 | 72,276 | 73,178 | 72,370 | |||||||||||||||
| Allowance for credit losses |
(8,925 | ) | (8,814 | ) | (5,150 | ) | (2,275 | ) | (2,484 | ) | ||||||||||
| Finance receivables, net |
47,356 | 59,787 | 67,126 | 70,903 | 69,886 | |||||||||||||||
| Other receivables |
717 | 957 | 861 | 1,013 | 1,099 | |||||||||||||||
| Inventory |
2,202 | 3,167 | 3,057 | 2,195 | 2,402 | |||||||||||||||
| Property and equipment, net |
4,227 | 4,906 | 4,220 | 4,581 | 4,850 | |||||||||||||||
| Total assets |
59,254 | 83,857 | 95,862 | 95,732 | 91,231 | |||||||||||||||
| Senior debt |
327 | 695 | 512 | 669 | 1,186 | |||||||||||||||
| Senior subordinated debt |
— | — | — | 600 | 1,000 | |||||||||||||||
| Subordinated debt, related parties |
— | — | — | 370 | 800 | |||||||||||||||
|
Debentures(6) |
73,603 | 82,209 | 81,861 | 77,910 | 68,905 | |||||||||||||||
| Demand notes(6) |
3,147 | 3,658 | 5,991 | 8,137 | 12,867 | |||||||||||||||
| Shareholders’ deficit |
$ | (33,774 | ) | $ | (20,839 | ) | $ | (10,852 | ) | $ | (7,060 | ) | $ | (6,609 | ) | |||||
| (1) | Received from Interstate Motor Club, Inc., an affiliated entity. |
| (2) | Received from Cash Check Inc. of Ga., an affiliated entity. |
| (3) | The ratio of earnings to fixed charges represents the number of times fixed charges are covered by earnings. For purposes of this ratio, “earnings” is determined by adding pre-tax income to “fixed charges,” which consists of interest on all indebtedness and an interest factor attributable to rent expense. |
| (4) | Calculation results in a deficiency in the ratio (i.e., less than one-to-one coverage). The deficiency in earnings to cover fixed charges was $13,372,623; $10,669,231; $2,682,314; and $611,423 for the years ended September 25, 2009, 2008, 2007, and 2005, respectively. |
| (5) | Net of unearned insurance commissions, unearned finance charges and unearned discounts. |
| (6) | Issued, in part, by our subsidiary, The Money Tree of Georgia Inc. See Note 7 to our consolidated audited financial statements for the year ended September 25, 2009. |
17
Table of Contents
Index to Financial Statements
| Item 7. | Management’s Discussion and Analysis of Financial Condition and Results of Operations |
The following discussion includes the effects of the restatement of the audited consolidated financial statements discussed in the explanatory note on page one and should be read in conjunction with the information under “Selected Consolidated Financial Data” and our audited consolidated financial statements and related notes and other financial data included elsewhere in this report.
Overview
We make consumer finance loans and provide other financial products and services through our branch offices in Georgia, Alabama, Louisiana and Florida. We sell retail merchandise, principally furniture, appliances and electronics, at certain of our branch office locations and operate three used automobile dealerships in the State of Georgia. We also offer insurance products, prepaid phone services and automobile club memberships to our loan customers.
We fund our consumer loan demand through a combination of cash collections from our consumer loans, proceeds raised from the sale of debentures and demand notes and loans from various banks and other financial institutions. Our consumer loan business consists of making, purchasing and servicing direct consumer loans, consumer sales finance contracts and motor vehicle installment sales contracts. Direct consumer loans generally serve individuals with limited access to other sources of consumer credit, such as banks, savings and loans, other consumer finance businesses and credit cards. Direct consumer loans are general loans made typically to people who need money for some unusual or unforeseen expense, for the purpose of paying off an accumulation of small debts or for the purchase of furniture and appliances. Please see “Business” for a more detailed discussion of the various types of loans we make to our customers. The following table sets forth certain information about the components of our finance receivables:
| Description of Loans and Contracts |
| |||||||||||
| As of, or for, the Year Ended September 25, | ||||||||||||
| 2009 | 2008 | 2007 | ||||||||||
| (Restated) | (Restated) | (Restated) | ||||||||||
| Direct Consumer Loans: |
| |||||||||||
| Number of Loans Made to New Borrowers |
33,045 | 27,770 | 20,838 | |||||||||
| Number of Loans Made to Former Borrowers |
64,774 | 57,862 | 55,117 | |||||||||
| Number of Loans Made to Existing Borrowers |
50,504 | 85,329 | 110,364 | |||||||||
| Total Number of Loans Made |
148,323 | 170,961 | 186,319 | |||||||||
| Total Volume of Loans Made |
$ | 48,940,971 | $ | 66,766,194 | $ | 73,350,400 | ||||||
| Average Size of Loans Made |
$ | 330 | $ | 391 | $ | 394 | ||||||
| Number of Loans Outstanding |
47,619 | 63,424 | 74,204 | |||||||||
| Total of Loans Outstanding |
$ | 20,098,661 | $ | 33,068,727 | $ | 39,608,318 | ||||||
| Percent of Loans Outstanding |
30.0 | % | 40.8 | % | 45.9 | % | ||||||
| Average Balance on Outstanding Loans |
$ | 422 | $ | 521 | $ | 534 | ||||||
18
Table of Contents
Index to Financial Statements
| Description of Loans and Contracts |
| |||||||||||
| As of, or for, the Year Ended September 25, | ||||||||||||
| 2009 | 2008 | 2007 | ||||||||||
| (Restated) | (Restated) | (Restated) | ||||||||||
| Motor Vehicle Installment Sales Contracts: |
||||||||||||
| Total Number of Contracts Made |
775 | 763 | 977 | |||||||||
| Total Volume of Contracts Made |
$ | 14,097,733 | $ | 14,217,234 | $ | 17,965,678 | ||||||
| Average Size of Contracts Made |
$ | 18,191 | $ | 18,633 | $ | 18,389 | ||||||
| Number of Contracts Outstanding |
2,742 | 2,726 | 2,798 | |||||||||
| Total of Contracts Outstanding |
$ | 30,151,923 | $ | 30,707,329 | $ | 32,259,968 | ||||||
| Percent of Total Loans and Contracts |
45.1 | % | 37.8 | % | 37.4 | % | ||||||
| Average Balance on Outstanding Contracts |
$ | 10,996 | $ | 11,265 | $ | 11,530 | ||||||
| Consumer Sales Finance Contracts: |
||||||||||||
| Number of Contracts Made to New Customers |
2,241 | 865 | 137 | |||||||||
| Number of Loans Made to Former Customers |
68 | 3,161 | 2,684 | |||||||||
| Number of Loans Made to Existing Customers |
3,112 | 3,211 | 3,120 | |||||||||
| Total Contracts Made |
5,421 | 7,237 | 5,941 | |||||||||
| Total Volume of Contracts Made |
$ | 17,046,757 | $ | 18,883,178 | $ | 16,869,906 | ||||||
| Number of Contracts Outstanding |
7,242 | 7,792 | 7,044 | |||||||||
| Total of Contracts Outstanding |
$ | 16,663,172 | $ | 17,373,830 | $ | 14,420,494 | ||||||
| Percent of Total Loans and Contracts |
24.9 | % | 21.4 | % | 16.7 | % | ||||||
| Average Balance of Outstanding Contracts |
$ | 2,301 | $ | 2,230 | $ | 2,047 | ||||||
Below is a table showing our total gross outstanding finance receivables:
| September 25, 2009 |
September 25, 2008 |
September 25, 2007 | |||||||
| (Restated) | (Restated) | (Restated) | |||||||
| Total Loans and Contracts Outstanding (gross): |
|||||||||
| Direct Consumer Loans |
$ | 20,098,661 | $ | 33,068,727 | $ | 39,608,318 | |||
| Motor Vehicle Installment |
30,151,923 | 30,707,329 | 32,259,968 | ||||||
| Consumer Sales Finance |
16,663,172 | 17,373,830 | 14,420,494 | ||||||
| Total Gross Outstanding |
$ | 66,913,756 | $ | 81,149,886 | $ | 86,288,780 | |||
Below is a roll-forward of the balance of each category of our outstanding finance receivables. Loans originated reflect the gross amount of loans made or purchased during the period presented inclusive of pre-computed interest, fees and insurance premiums. Collections represent cash receipts in the form of repayments made on our loans as reflected in our Consolidated Statements of Cash Flows. Refinancings represent the amount of the pay off of loans refinanced. Charge-offs represent the gross amount of loans charged off as uncollectible. Rebates/other adjustments primarily represent reductions to gross loan amounts of precomputed interest and insurance premiums resulting from loans refinanced and other loans paid off before maturity. See “Summary of Significant Accounting Policies – Income Recognition” in Note 2 to our Consolidated Financial Statements for further discussion related to rebates of interest.
19
Table of Contents
Index to Financial Statements
| Fiscal Year Ended September 25, 2009 |
Fiscal Year Ended September 25, 2008 |
Fiscal Year Ended September 25, 2007 |
||||||||||
| (Restated) | (Restated) | (Restated) | ||||||||||
| Direct Consumer Loans: |
||||||||||||
| Balance – beginning |
$ | 33,068,727 | $ | 39,608,318 | $ | 45,671,669 | ||||||
| Loans originated |
48,940,971 | 66,766,194 | 73,350,400 | |||||||||
| Collections |
(40,671,119 | ) | (47,076,723 | ) | (52,252,511 | ) | ||||||
| Refinancings |
(10,912,645 | ) | (14,791,503 | ) | (18,154,981 | ) | ||||||
| Charge-offs, gross |
(8,589,238 | ) | (8,894,529 | ) | (5,579,005 | ) | ||||||
| Rebates/other adjustments |
(1,738,035 | ) | (2,543,030 | ) | (3,427,254 | ) | ||||||
| Balance – end |
$ | 20,098,661 | $ | 33,068,727 | $ | 39,608,318 | ||||||
| Consumer Sales Finance Contracts: |
||||||||||||
| Balance – beginning |
$ | 17,373,830 | $ | 14,420,494 | $ | 11,213,566 | ||||||
| Loans originated |
17,046,757 | 18,883,178 | 16,869,906 | |||||||||
| Collections |
(7,760,796 | ) | (7,267,346 | ) | (6,058,209 | ) | ||||||
| Refinancings |
(5,635,286 | ) | (5,460,970 | ) | (4,993,560 | ) | ||||||
| Charge-offs, gross |
(3,966,748 | ) | (2,521,245 | ) | (1,758,664 | ) | ||||||
| Rebates/other adjustments |
(394,585 | ) | (680,281 | ) | (852,545 | ) | ||||||
| Balance – end |
$ | 16,663,172 | $ | 17,373,830 | $ | 14,420,494 | ||||||
| Motor Vehicle Installment Sales Contracts: |
||||||||||||
| Balance – beginning |
$ | 30,707,329 | $ | 32,259,968 | $ | 31,280,840 | ||||||
| Loans originated |
14,097,733 | 14,217,234 | 17,965,678 | |||||||||
| Collections |
(11,502,246 | ) | (13,286,462 | ) | (14,469,121 | ) | ||||||
| Refinancings |
— | — | — | |||||||||
| Charge-offs, gross |
(1,768,170 | ) | (1,370,165 | ) | (1,185,753 | ) | ||||||
| Rebates/other adjustments |
(1,382,723 | ) | (1,113,246 | ) | (1,331,676 | ) | ||||||
| Balance – end |
$ | 30,151,923 | $ | 30,707,329 | $ | 32,259,968 | ||||||
| Total: |
||||||||||||
| Balance – beginning |
$ | 81,149,886 | $ | 86,288,780 | $ | 88,166,075 | ||||||
| Loans originated |
80,085,461 | 99,866,606 | 108,185,984 | |||||||||
| Collections |
(59,934,161 | ) | (67,630,531 | ) | (72,779,841 | ) | ||||||
| Refinancings |
(16,547,931 | ) | (20,252,473 | ) | (23,148,541 | ) | ||||||
| Charge-offs, gross |
(14,324,156 | ) | (12,785,939 | ) | (8,523,422 | ) | ||||||
| Rebates/other adjustments |
(3,515,343 | ) | (4,336,557 | ) | (5,611,475 | ) | ||||||
| Balance – end |
$ | 66,913,756 | $ | 81,149,886 | $ | 86,288,780 | ||||||
20
Table of Contents
Index to Financial Statements
Below is a reconciliation of the amounts of the finance receivables originated and repaid (collections) from the receivable roll-forward to the amounts shown in our Consolidated Statements of Cash Flows.
| Fiscal Year Ended September 25, 2009 |
Fiscal Year Ended September 25, 2008 |
Fiscal Year Ended September 25, 2007 |
||||||||||
| Finance Receivables Originated: |
||||||||||||
| Direct consumer loans |
$ | 48,940,971 | $ | 66,766,194 | $ | 73,350,400 | ||||||
| Consumer sales finance |
17,046,757 | 18,883,178 | 16,869,906 | |||||||||
| Motor vehicle installment sales |
14,097,733 | 14,217,234 | 17,965,678 | |||||||||
| Total gross loans originated |
80,085,461 | 99,866,606 | 108,185,984 | |||||||||
| Non-cash items included in gross finance receivables* |
(21,745,038 | ) | (26,531,233 | ) | (31,243,362 | ) | ||||||
| Finance receivables originated – cash flows** |
$ | 58,340,423 | $ | 73,335,373 | $ | 76,942,622 | ||||||
| Loans Repaid: |
||||||||||||
| Collections |
||||||||||||
| Direct consumer loans |
$ | 40,671,119 | $ | 47,076,723 | $ | 52,252,512 | ||||||
| Consumer sales finance |
7,760,796 | 7,267,346 | 6,058,208 | |||||||||
| Motor vehicle installment sales |
11,502,246 | 13,286,462 | 14,469,121 | |||||||||
| Finance receivables repaid – cash flows |
$ | 59,934,161 | $ | 67,630,531 | $ | 72,779,841 | ||||||
| * | Includes precomputed interest and fees (since these amounts are included in the gross amount of finance receivables originated but are not advanced in the form of cash to customers) and refinanced receivable balances (since there is no cash generated from the repayment of original receivables refinanced). |
| ** | Includes amounts advanced to customers in conjunction with refinancings, which were $4,738,460 for the fiscal year ended September 25, 2009; $10,078,648 for the fiscal year ended September 25, 2008; and $10,545,399 for the fiscal year ended September 25, 2007. |
Segments and Seasonality
We segment our business operations into the following two segments:
| • | consumer finance and sales; and |
| • | automotive finance and sales. |
The consumer finance and sales segment is comprised primarily of small consumer loans and sales of consumer goods such as furniture, appliances and electronics. We typically experience our strongest financial performance for the consumer finance and sales segment during the holiday season, which is our first fiscal quarter ending December 25.
The automotive finance and sales segment is comprised exclusively of used vehicle sales and their related financing. We typically experience our strongest financial performance for the automotive finance and sales segment during our second fiscal quarter ending March 25 when used car sales are the highest. Please refer to Note 16 in the “Notes to Consolidated Financial Statements” for a breakdown of our operations by segment.
21
Table of Contents
Index to Financial Statements
Net Interest Margin
A principal component of our profitability is our net interest margin, which is the difference between the interest that we earn on finance receivables and the interest that we pay on borrowed funds. In some states, statutes regulate the interest rates that we may charge our customers, while, in other locations, competitive market conditions establish interest rates that we may charge. Differences also exist in the interest rates that we earn on the various components of our finance receivable portfolio.
Unlike our interest income, our interest expense is sensitive to general market interest rate fluctuations. These general market fluctuations directly impact our cost of funds. Our generally limited ability to increase the interest rates earned on new and existing finance receivables restricts our ability to react to increases in our cost of funds. Accordingly, increases in market interest rates generally will narrow our interest rate spread and lower our profitability, while decreases in market interest rates generally will widen our interest rate spread and increase our profitability. Significant increases in market interest rates will likely result in a reduction in our liquidity and profitability and impair our ability to pay interest and principal on the debentures. See “Quantitative and Qualitative Disclosures About Market Risk” below.
The decrease in the net interest margin for the fiscal year ended September 25, 2009 was a result primarily of the suppressed average rate earned on outstanding finance receivables. Our liquidity issues have caused us to tighten our lending guidelines and significantly decrease our direct consumer loans, while we experienced only slight decreases in consumer sales finance contracts and motor vehicle installment contracts. These contracts generally yield a lower interest rate as compared to direct consumer loans. We also saw a slight increase in the average interest paid on our debt as a result of higher rates paid on short-term borrowings during fiscal year 2009.
The following table presents important data relating to our net interest margin:
| As of, or for, the Year Ended September 25, | ||||||||||||
| 2009 | 2008 | 2007 | ||||||||||
| (Restated) | (Restated) | (Restated) | ||||||||||
| Average net finance receivables (1) |
$ | 63,341,575 | $ | 73,354,638 | $ | 73,378,408 | ||||||
| Average notes payable (2) |
$ | 78,753,900 | $ | 87,985,623 | $ | 87,680,692 | ||||||
| Interest income |
$ | 11,506,002 | $ | 14,211,519 | $ | 14,742,029 | ||||||
| Loan fee income |
4,083,072 | 5,068,550 | 4,738,711 | |||||||||
| Total interest and fee income |
15,589,074 | 19,280,069 | 19,480,740 | |||||||||
| Interest expense |
7,611,185 | 8,275,310 | 8,025,969 | |||||||||
| Net interest and fee income before provision for credit losses |
$ | 7,977,889 | $ | 11,004,759 | $ | 11,454,771 | ||||||
| Average interest rate earned |
24.6 | % | 26.3 | % | 26.5 | % | ||||||
| Average interest rate paid |
9.7 | % | 9.4 | % | 9.2 | % | ||||||
| Net interest rate spread |
14.9 | % | 16.9 | % | 17.4 | % | ||||||
| Net interest margin (3) |
12.6 | % | 15.0 | % | 15.6 | % | ||||||
| (1) | Averages are computed using month-end balances of finance receivables (net of unearned interest/fees, insurance commissions, and unearned discounts) during the year presented. Net finance receivables for this purpose include all outstanding finance receivables, including accounts in non-accrual status. |
| (2) | Averages are computed using month-end balances of interest bearing debt (including senior debt, senior subordinated debt, subordinated debt to related parties, debentures and demand notes) during the year presented. |
| (3) | Net interest margin represents net interest and fee income (before the provision for credit losses) divided by average net finance receivables. |
22
Table of Contents
Index to Financial Statements
Rate/Volume Analysis
The following table sets forth the effects of changing rates and volumes on our net interest income. Information is provided with respect to (i) effects on interest income attributable to changes in volume (changes in volume multiplied by prior rate), (ii) effects on interest income attributable to changes in rate (changes in rate multiplied by prior volume), and (iii) changes in rate/volume (change in rate multiplied by change in volume).
| Increase (Decrease) Due to | ||||||||||||||||||||||||||||||||
| Volume | Rate | Rate/Volume | Total net increase (decrease) | |||||||||||||||||||||||||||||
| 9/25/09 | 9/25/08 | 9/25/09 | 9/25/08 | 9/25/09 | 9/25/08 | 9/25/09 | 9/25/08 | |||||||||||||||||||||||||
| Earning assets: |
||||||||||||||||||||||||||||||||
| Interest income on finance receivables: |
$ | (2,517,649 | ) | $ | (136,473 | ) | $ | (1,005,772 | ) | $ | (55,899 | ) | $ | (167,574 | ) | $ | (8,299 | ) | $ | (3,690,995 | ) | $ | (200,671 | ) | ||||||||
| Interest bearing liabilities: |
||||||||||||||||||||||||||||||||
| Debentures & demand notes |
(874,693 | ) | 19,996 | 131,167 | 303,295 | (15,990 | ) | 746 | (759,516 | ) | 324,037 | |||||||||||||||||||||
| Other debt |
3,582 | (47,906 | ) | 93,744 | (16,611 | ) | (1,935 | ) | (10,179 | ) | 95,391 | (74,696 | ) | |||||||||||||||||||
| Total interest expense |
(871,111 | ) | (27,910 | ) | 224,911 | 286,684 | (17,925 | ) | (9,433 | ) | (664,125 | ) | 249,341 | |||||||||||||||||||
| Net interest income |
$ | (1,646,538 | ) | $ | (108,563 | ) | $ | (1,230,683 | ) | $ | (342,583 | ) | $ | (149,649 | ) | $ | 1,134 | $ | (3,026,870 | ) | $ | (450,012 | ) | |||||||||
Return on Deficit and Assets
Below is a table showing certain performance ratios for the fiscal years ended September 25, 2009 and 2008. These ratios are typically reported by financial institutions in connection with their annual financial performance.
| Performance Ratios(1) |
2009 | 2008 | ||||
| (Restated) | (Restated) | |||||
| Return on average assets (2) |
-17.2 | % | -11.2 | % | ||
| Return on average shareholders’ deficit (3) |
-64.7 | % | -185.2 | % | ||
| Average deficit to average assets ratio (4) |
-26.5 | % | -6.0 | % |
| (1) | Averages are computed using quarter end balances. |
| (2) | Calculated as net income divided by average total assets during the fiscal year. |
| (3) | Calculated as net income divided by average shareholders’ deficit during the fiscal year. |
| (4) | Calculated as average shareholders’ deficit divided by average total assets during the fiscal year. |
Analysis of Allowance for Credit Losses
At the end of each reporting period, management is required to take a “snapshot” of the risk of probable losses inherent in the finance receivables portfolio and to reflect that risk in our allowance calculations. We use a systematic approach to calculate the allowance for credit losses whereby we apply historical charge-off benchmarks to groups of loans and then adjust (either positively or negatively), as and if applicable, for relevant factors. This method prevents the calculation from becoming simply a mathematical exercise, but instead addresses matters affecting loan collectibility. Historically, the relevant items impacting our allowance have included, but are not limited to, a variety of factors, such as historic loan loss experience, borrowers’ ability to repay, collateral considerations and non-file insurance recoveries, levels of and trends in delinquencies, effects of any changes in risk selection and lending policies and practices, and general economic conditions impacting our portfolio. See “Risk Factors – Risks Related to Our Business – We suffered significant credit losses in 2007, 2008 and 2009 due to continued weakening economic conditions, and there is no guarantee such credit losses will not continue during this downturn in the economy or that our operations and profitability will not continue to be negatively affected.”
23
Table of Contents
Index to Financial Statements
In the first step of our approach, a benchmark percentage is calculated based on historical ratios of charge-offs to average notes receivable. This percentage is derived by dividing the net amount of segmented finance receivables charged off (gross amount of charge-offs less the amount of recoveries of such charged off accounts from non-file insurance and other recoveries) by the average net outstanding finance receivables over a specific period of time and converting this to an annualized basis. Once this benchmark percentage is determined, a review is performed to detect upward or downward trends in the pertinent factors noted above. Such trends may lead us to adjust the benchmark percentage that is applied to the entire net finance receivable portfolio used in determining the balance of the allowance for credit losses.
Two additional matters that we consider when reviewing the risk included in our portfolio include insurance products and the non-accrual status of certain loans in our portfolio. We also offer insurance products in conjunction with the loan. In the event of the death or injury of the customer or damage to pledged collateral, the proceeds from the claims would generally pay off or continue payments on the loan. However, proceeds from these insurance claims are not considered a recovery since the loan was not charged off, so they are not considered in the allowance determination. The portion of our finance receivables that are in a non-accrual status, meaning the earning of interest and fees has been suspended because of their delinquency status, are considered to be impaired. However, we do not apply different loss rates to impaired or non-impaired loans since our adjusted benchmark percentage is applied to the entire net finance receivable portfolio.
24
Table of Contents
Index to Financial Statements
The following table shows these ratios of charge-offs to average notes receivable for the categories of our finance receivables.
| As of, or for, the Year Ended September 25, | ||||||||||||
| 2009 | 2008 | 2007 | ||||||||||
| (Restated) | (Restated) | (Restated) | ||||||||||
| Direct Consumer | ||||||||||||
| Ending net outstanding finance receivables |
$ | 19,524,349 | $ | 30,296,093 | $ | 35,117,968 | ||||||
| Average net outstanding finance receivables (1) |
$ | 24,849,742 | $ | 34,138,313 | $ | 37,122,070 | ||||||
| Charge offs, gross |
$ | 8,589,238 | $ | 8,894,529 | $ | 5,579,005 | ||||||
| Recoveries (2) |
$ | (3,759,401 | ) | $ | (3,424,066 | ) | $ | (3,467,385 | ) | |||
| Charge offs, net of recoveries |
$ | 4,829,837 | $ | 5,470,463 | $ | 2,111,620 | ||||||
| % of net charge offs to average net receivables |
||||||||||||
| 12 month trend |
19.4 | % | 16.0 | % | 5.7 | % | ||||||
| 24 month trend |
17.5 | % | 10.6 | % | 5.6 | % | ||||||
| Actual allowance % |
19.4 | % | 16.0 | % | 5.7 | % | ||||||
| Actual allowance |
$ | 3,794,785 | $ | 4,854,770 | $ | 1,997,620 | ||||||
| Consumer Sales Finance | ||||||||||||
| Ending net outstanding finance receivables |
$ | 11,765,752 | $ | 12,902,817 | $ | 10,964,928 | ||||||
| Average net outstanding finance receivables (1) |
$ | 13,311,376 | $ | 13,360,839 | $ | 10,462,675 | ||||||
| Charge offs, gross |
$ | 3,966,748 | $ | 2,521,245 | $ | 1,758,664 | ||||||
| % of net charge offs to average net receivables |
||||||||||||
| 12 month trend |
29.8 | % | 18.9 | % | 16.8 | % | ||||||
| 24 month trend |
24.3 | % | 18.0 | % | 9.0 | % | ||||||
| Actual allowance % |
29.8 | % | 18.9 | % | 16.8 | % | ||||||
| Actual allowance |
$ | 3,506,157 | $ | 2,434,814 | $ | 1,843,088 | ||||||
| Auto Sales Finance | ||||||||||||
| Ending net outstanding finance receivables |
$ | 24,991,375 | $ | 25,402,402 | $ | 26,193,069 | ||||||
| Average net outstanding finance receivables (1) |
$ | 25,180,457 | $ | 25,855,486 | $ | 25,793,664 | ||||||
| Charge offs, gross |
$ | 1,768,170 | $ | 1,370,165 | $ | 1,185,753 | ||||||
| % of net charge offs to average net receivables |
||||||||||||
| 12 month trend |
7.0 | % | 5.3 | % | 4.6 | % | ||||||
| 24 month trend |
6.1 | % | 4.9 | % | 4.6 | % | ||||||
| Actual allowance % |
6.5 | % | 6.0 | % | 5.0 | % | ||||||
| Actual allowance |
$ | 1,624,439 | $ | 1,524,144 | $ | 1,309,653 | ||||||
25
Table of Contents
Index to Financial Statements
| As of, or for, the Year Ended September 25, | ||||||||||||
| 2009 | 2008 | 2007 | ||||||||||
| (Restated) | (Restated) | (Restated) | ||||||||||
| Total Receivables | ||||||||||||
| Ending net outstanding finance receivables |
$ | 56,281,476 | $ | 68,601,312 | $ | 72,275,965 | ||||||
| Average net outstanding finance receivables (1) |
$ | 63,341,575 | $ | 73,354,638 | $ | 73,378,408 | ||||||
| Charge offs, gross |
$ | 14,324,156 | $ | 12,785,939 | $ | 8,523,422 | ||||||
| Recoveries (2) |
$ | (3,759,401 | ) | $ | (3,424,066 | ) | $ | (3,467,385 | ) | |||
| Charge offs, net of recoveries |
$ | 10,564,755 | $ | 9,361,873 | $ | 5,056,037 | ||||||
| % of net charge offs to average net receivables |
||||||||||||
| 12 month trend |
16.7 | % | 12.8 | % | 6.9 | % | ||||||
| 24 month trend |
14.6 | % | 9.8 | % | 5.8 | % | ||||||
| Actual allowance |
$ | 8,925,381 | $ | 8,813,728 | $ | 5,150,361 | ||||||
| Allowance as a % of net outstanding receivables |
15.9 | % | 12.8 | % | 7.1 | % | ||||||
| (1) | Average net outstanding finance receivables are computed using the monthly balances net of unearned interest/fees, unearned insurance commissions and unearned discounts. |
| (2) | Recoveries represent receipts from non-file insurance claims, cash recoveries and bankruptcy recoveries. |
As of September 25, 2009 and 2008, our allowance for credit losses was $8.9 million and $8.8 million, respectively, which represent 15.9% and 12.8% of the net outstanding finance receivables, respectively.
During fiscal 2007, we noted an increasing trend in the total value of delinquent loans, causing us to develop the allowance for credit losses primarily based upon average charge-offs for the most recent year while taking other qualitative factors into account. Based upon this analysis, we recorded an allowance of 5.7% of direct consumer loans, 16.8% of consumer sales finance loans, and 5.0% of auto sales finance loans, or 7.1% of the total net outstanding receivables at September 25, 2007. We increased the auto sales finance percentage by 40 basis points from the benchmark based on the qualitative factors noted at September 25, 2007. No adjustments were made to the direct consumer or consumer sales finance benchmarks.
As we ended fiscal 2008, our snapshot of the portfolio reflected several trends, all pointing in the same downward direction. First, in 2008 net charge-offs increased significantly, from $5.1 million to $9.4 million. We also incurred corresponding increases in delinquencies. In addition, various widely reported and relevant economic indicators (e.g. credit-rating agency outlooks, government agency reports, etc.) pointed to a significantly deteriorating general economic condition. Simultaneously and in conjunction with our initial Sarbanes-Oxley testing of controls over the charge-off process and the completion of our implementation of a new accounting system for loans, we performed an extensive analysis to determine the amount of past due loans which had not been charged off. The results of the testing led us to adopt a more centralized, consistent approach to loan evaluations in determining the point at which a loan should be charged off, which resulted in a quicker loss recognition “trigger” in recognizing loan charge-offs.
At the end of fiscal year 2008, based on the internal indicators, the external environmental factors and the change in charge-off process noted above, we made a decision to continue to rely on the most recent historical data. Therefore, for fiscal 2008 we continued to utilize a 12-month average net charge-off ratio as the base benchmark and, after considering the qualitative factors, we recorded an allowance of 16.0% of direct consumer loans, 18.9% of consumer sales finance loans, and 6.0% of auto sales finance loans, or 12.8% of the total net outstanding receivables at September 25, 2008. We increased the auto sales finance percentage by 70 basis points from the benchmark based on the qualitative factors noted at September 25, 2008. No adjustments were made to the direct consumer or consumer sales finance benchmarks.
Although some of the uncertainty relative to the general economic conditions appeared to be diminishing at the end of fiscal 2009, net charge-offs again increased and totaled $10.6 million. We
26
Table of Contents
Index to Financial Statements
contemplated the use of a 24-month benchmark percentage at the end of fiscal year 2009 due to the similarities in fiscal years 2008 and 2009. Even though delinquencies were improving, due to the uncertainty still in existence at this time and the increase in net charge-offs, we again utilized the 12-month benchmark percentages used in computing the allowance at September 25, 2009 and recorded an allowance of 19.4% of direct consumer loans, 29.8% of consumer sales finance loans, and 6.5% of auto sales finance loans, or 15.9% of the total net outstanding receivables at September 25, 2009. We decreased the auto sales finance percentage by 50 basis points from the benchmark based on the qualitative factors noted at September 25, 2009. No adjustments were made to the direct consumer or consumer sales finance benchmarks.
Delinquency Information
Our delinquency levels reflect, among other factors, changes in the mix of loans in the portfolio, the quality of receivables, the results of collection efforts, bankruptcy trends and general economic conditions. The delinquency information in the following tables is computed on the basis of the amount past due in accordance with the original payment terms of the loan (contractual method). We use the contractual method for all external reporting purposes. Management closely monitors delinquency using this method to measure the quality of our loan portfolio and the probability of credit loss. We also use other tools, such as a recency report, which shows the date of the last full contractual payment received on the loan, to determine a particular customer’s willingness to pay. For example, if a delinquent customer has made a recent payment, we may decide to delay more serious collection measures, such as repossession of collateral. However, such a payment will not change the non-accrual status of the account until all of the principal and interest amounts contractually due are brought current (we receive one or more full contractual payments and the account is less than 60 days contractually delinquent), at which time we believe future payments are reasonably expected. Our gross finance receivables on non-accrual status totaled approximately $7.7 million and approximately $11.0 million for the fiscal years ended September 25, 2009 and 2008, respectively. Suspended interest as a result of these non-accrual accounts totaled $0.9 million, $1.2 million and $1.1 million for the fiscal years ended September 25, 2009, 2008 and 2007, respectively. Generally, we do not refinance delinquent accounts. However, on occasion a past due account will qualify for refinancing. We use the following criteria for determining whether a delinquent account qualifies for refinancing: (1) a re-evaluation of the customer’s creditworthiness is performed to ensure additional credit is warranted; and (2) a payment must have been received on the account within the last 10 days. Since we refinance delinquent loans on such an infrequent basis, we do not maintain any statistics relating to this type of refinancing.
Below is certain information relating to the delinquency status of each category of our receivables for the years ended September 25, 2009 and 2008. Because consumer bankrupt accounts are fully charged off within 30 days, no accounts in bankruptcy are included in the direct consumer and consumer sales finance categories.
| As of September 25, 2009 | ||||||||||||||||
| Direct Consumer |
Consumer Sales Finance Contracts |
Motor Vehicle Installment Sales Contracts* |
Total | |||||||||||||
| (Restated) | (Restated) | (Restated) | ||||||||||||||
| Gross Loans and Contracts Receivable |
$ | 20,098,661 | $ | 16,663,172 | $ | 30,151,923 | $ | 66,913,756 | ||||||||
| Loans and Contracts greater than 180 days past due |
$ | 3,358,791 | $ | 1,410,284 | $ | — | $ | 4,769,075 | ||||||||
| Percentage of Outstanding |
16.71 | % | 8.46 | % | 0.00 | % | 7.13 | % | ||||||||
| Loans and Contracts greater than 90 days past due |
$ | 4,774,562 | $ | 2,153,578 | $ | 787,638 | $ | 7,715,778 | ||||||||
| Percentage of Outstanding |
23.76 | % | 12.92 | % | 2.61 | % | 11.53 | % | ||||||||
| Loans and Contracts greater than 60 days past due |
$ | 5,456,656 | $ | 2,531,102 | $ | 1,212,067 | $ | 9,199,825 | ||||||||
| Percentage of Outstanding |
27.15 | % | 15.19 | % | 4.02 | % | 13.75 | % | ||||||||
27
Table of Contents
Index to Financial Statements
| As of September 25, 2008 | ||||||||||||||||
| Direct Consumer |
Consumer Sales Finance Contracts |
Motor Vehicle Installment Sales Contracts* |
Total | |||||||||||||
| (Restated) | (Restated) | (Restated) | ||||||||||||||
| Gross Loans and Contracts Receivable |
$ | 33,068,727 | $ | 17,373,830 | $ | 30,707,329 | $ | 81,149,886 | ||||||||
| Loans and Contracts greater than 180 days past due |
$ | 6,188,210 | $ | 2,604,066 | $ | — | $ | 8,792,276 | ||||||||
| Percentage of Outstanding |
18.71 | % | 14.99 | % | 0.00 | % | 10.83 | % | ||||||||
| Loans and Contracts greater than 90 days past due |
$ | 7,486,842 | $ | 3,212,367 | $ | 285,407 | $ | 10,984,616 | ||||||||
| Percentage of Outstanding |
22.64 | % | 18.49 | % | 0.93 | % | 13.54 | % | ||||||||
| Loans and Contracts greater than 60 days past due |
$ | 8,152,033 | $ | 3,513,289 | $ | 624,360 | $ | 12,289,682 | ||||||||
| Percentage of Outstanding |
24.65 | % | 20.22 | % | 2.03 | % | 15.14 | % | ||||||||
| * | Motor Vehicle Installment Sales Contracts aging categories exclude accounts in legal or repossession process in the amounts of $5,262,871 at September 25, 2009 and $5,110,548 at September 25, 2008. |
Results of Operations
Comparison of Fiscal Years Ended September 25, 2009 and 2008
Net Revenues
Net revenues were $15.1 million and $17.8 million for the fiscal years ended September 25, 2009 and 2008, respectively. The $2.7 million decrease in net revenues was primarily a result of the significant decrease in interest and fee income as well as other components of loan-related income. These decreases in income were partially offset by significant decreases in the provision for credit losses.
Net Interest and Fee Income Before Provision for Credit Losses
Net interest and fee income before provision for credit losses was $8.0 million and $11.0 million for the fiscal years ended September 25, 2009 and 2008, respectively. Total interest and fee income decreased $3.7 million. Liquidity issues caused us to curtail historical lending levels resulting in a 20% decrease in finance receivables originated in 2009 compared to 2008. Interest expense decreased $0.7 million from $8.3 million in 2008 to $7.6 million in 2009 due to a decrease in outstanding debt of $9.5 million during fiscal year 2009.
Provision for Credit Losses
Provision for credit losses was $10.6 million and $13.0 million for the fiscal years ended September 25, 2009 and 2008, respectively. Charge-offs, net of recoveries, increased by $1.2 million, from $9.4 million to $10.6 million, in fiscal year 2009 over 2008. Charge-offs expressed as a percentage of average net finance receivables increased to 16.7% in fiscal year 2009, compared to 12.8% in fiscal year 2008. However, we experienced a significant decrease in the dollar amount of net finance receivables outstanding at the end of fiscal year 2009. When applying the benchmark loss rates to the components of our net finance receivables, this resulted in only a slight increase in the allowance for credit losses at September 25, 2009 as compared to September 25, 2008, with a resulting decrease in the provision for credit losses. See “Risk Factors – We suffered significant credit losses in 2009 due to continued weakening economic conditions, and there is no guarantee such credit losses will not continue during this downturn in the economy or that our operations and profitability will not continue to be negatively affected.”
28
Table of Contents
Index to Financial Statements
Insurance and Other Products
Income from commissions on insurance products and motor club memberships decreased from $11.5 million in fiscal year 2008 to $10.0 million in fiscal year 2009. Of the total for fiscal year 2009, commissions on credit insurance products were $5.7 million and non-credit insurance products and motor club memberships were $4.3 million. Approximately 67.3% of our loans during this period included one or more of our insurance products or motor club memberships. Delinquency fees and other income were in aggregate $2.1 million and $2.4 million for fiscal years ended September 25, 2009 and 2008, respectively. This decrease is consistent with the decrease in all loan-related income components.
Gross Margin on Retail Sales
Gross margin on retail sales were $5.7 million and $6.0 million for the fiscal years ended September 25, 2009 and 2008, respectively. Sales and gross margins in the consumer segment were $6.6 million and $2.9 million, respectively for fiscal year 2009 and $7.4 million and $3.3 million, respectively, for fiscal year 2008. In the automotive segment, sales were $9.1 million, down $0.4 million from 2008 sales of $9.5 million. Gross margins remained the same as 2008 gross margins of $2.4 million. We were encouraged by the small decreases in overall sales during fiscal year 2009 in light of the poor general economic conditions. We view this as a positive indicator for retail sales entering fiscal year 2010.
Operating Expenses/Impairment loss from write-down of goodwill
Operating expenses were $28.4 million and $28.5 million for the fiscal years ended September 25, 2009 and 2008, respectively. Although our lending activities and resulting income in the fiscal year ended September 25, 2009 decreased significantly, many components of operating expenses do not vary with income levels. Personnel expenses increased $0.2 million in 2009 over 2008 due to increases in health insurance costs. Facilities expense increased $0.2 million due to higher utility expenses and scheduled increases in facility leases. General and administrative expenses decreased by $0.2 million based on lower communication and supplies expenses. Other operating expenses decreased $0.3 million due to an impairment charge to goodwill of $1.0 million in fiscal year 2008, which was offset by $0.5 million in legal costs associated with the settlement of a lawsuit and increases in other professional expenses in 2009. We also recorded a loss of $0.1 million on the sale of finance receivables in 2009.
Income Tax Benefit
Income tax benefit was $0.4 million and $0.7 million for the fiscal years ended September 25, 2009 and 2008, respectively. For the fiscal year ended September 25, 2009, we increased the valuation allowance for our deferred income tax asset by $4.6 million compared to $3.3 million for the year ended September 25, 2008, resulting in a difference between income taxes calculated using expected annual federal and state rates and actual income tax benefit.
Comparison of Fiscal Years Ended September 25, 2008 and 2007
Net Revenues
Net revenues were $17.8 million and $24.9 million for the fiscal years ended September 25, 2008 and 2007, respectively. The decrease in net revenues was primarily as a result of the significant increase in provision for credit losses. Decreases in insurance commissions, interest and fee income and gross margin on retail sales also contributed to the $7.1 million overall decrease.
Net Interest and Fee Income Before Provision for Credit Losses
Net interest and fee income before provision for credit losses was $11.0 million and $11.5 million for the fiscal years ended September 25, 2008 and 2007, respectively. Total interest and fee income decreased $0.2 million while interest expense increased $0.3 million, from $8.0 million in 2007 to $8.3 million in 2008.
29
Table of Contents
Index to Financial Statements
Provision for Credit Losses
Provision for credit losses was $13.0 million and $7.9 million for the fiscal years ended September 25, 2008 and 2007, respectively. Charge-offs net of recoveries increased by $4.3 million in fiscal year 2008 over 2007. The deteriorating general economic conditions had a significant impact on our customers, leading to the high level of loan defaults and subsequent charge-offs. For fiscal year 2007, management revised its methodology in determining the adequacy of its allowance to rely on current data available rather than utilizing average charge-off data from prior years. The high level of charge-offs has caused the benchmark loss rates applied to the net outstanding receivables to increase, resulting in a net increase to the allowance and an additional provision for credit losses of approximately $0.8 million in addition to the increase in charge-offs net of recoveries in fiscal year 2008.
Insurance and Other Products
Income from commissions on insurance products and motor club memberships decreased from $12.1 million in 2007 to $11.5 million in fiscal year 2008. During fiscal year 2008, commissions on credit insurance products were $6.6 million and non-credit insurance products and motor club memberships were $4.9 million. Approximately 65.8% of our loans during this period included one or more of our insurance products or motor club memberships. Delinquency fees and other income were in aggregate $2.3 million and $2.5 million for the fiscal years ended September 25, 2008 and 2007, respectively. This decrease was partially due to the decreases in delinquency fees as well as other miscellaneous charges and products included in other income.
Gross Margin on Retail Sales
Gross margin on retail sales were $6.0 million and $6.8 million for the fiscal years ended September 25, 2008 and 2007, respectively. Sales and gross margins in the consumer segment in fiscal year 2008 were $7.4 million and $3.3 million, respectively, an increase of $0.8 million and $0.3 million over fiscal year 2007. In the automotive segment, sales were $9.5 million, down $2.6 million from fiscal year 2007, and gross margins decreased $1.1 million from $3.8 million to $2.7 million. The decline in vehicle sales is consistent with the auto industry’s overall decrease in sales due to the poor general economic conditions and decline in consumer spending.
Operating Expenses
Operating expenses were $28.5 million and $27.6 million for the fiscal years ended September 25, 2008 and 2007, respectively. Personnel expenses increased $0.2 million in 2008 over 2007 due to increases in bonuses and other incentives. Other operating expenses increased $0.5 million or 9%. Although we have continued to refine our process for customer solicitation that resulted in savings in postage and other costs, we recorded an impairment charge to goodwill of $1.0 million in fiscal year 2008. We also curtailed the advertising for our securities offerings. Travel and related cost were also down from prior year levels due to a decreased number of personnel required to travel. General and administrative expenses increased approximately $0.1 million or 4% as a result of the cost associated with the implementation of a new computer system for our branch operations.
Income Tax Expense (Benefit)
Income tax benefit was $0.7 million and income tax expense was $1.1 million for the fiscal years ended September 25, 2008 and 2007, respectively. For the fiscal year ended September 25, 2008, we increased the valuation allowance for our deferred income tax asset by $3.3 million compared to $2.1 million for the year ended September 25, 2007, resulting in a difference between income taxes calculated using expected annual federal and state rates and actual income tax expense.
Liquidity and Capital Resources
Cash and cash equivalents decreased by approximately $9.6 million during fiscal year 2009 from a balance of $12.5 million at September 25, 2008 to $2.9 million at September 25, 2009, as compared to a decrease of approximately $5.3 million during fiscal year 2008 from a balance of $17.9 million at September 25, 2007 to $12.5 million at September 25, 2008. During 2009, we redeemed an unusually high amount of debentures ($18.6 million) while the proceeds from the sale of debentures were $10.0 million. The primary source of cash was repayments
30
Table of Contents
Index to Financial Statements
from customers on finance receivables ($59.9 million) while cash used for origination of finance receivables was $58.3 million. Other uses of cash were purchases of property and equipment ($0.7 million), redemption of demand notes ($0.5 million) and repayments on senior debt ($0.4 million).
Below is a table showing the net effect of our cash flows from financing activities for our fiscal years ended September 25, 2009 and 2008:
| 2009 | 2008 | |||||||
| Senior debt – borrowing |
$ | 3,959,931 | $ | 2,805,819 | ||||
| Senior debt – repayments |
(4,328,304 | ) | (2,622,592 | ) | ||||
| Net |
$ | (368,373 | ) | $ | 183,227 | |||
| Demand notes – borrowing |
$ | 3,002,554 | $ | 3,151,573 | ||||
| Demand notes – repayments |
(3,514,007 | ) | (5,484,787 | ) | ||||
| Net |
$ | (511,453 | ) | $ | (2,333,214 | ) | ||
| Debentures – borrowing |
$ | 10,028,146 | $ | 15,435,214 | ||||
| Debentures – repayments |
(18,634,536 | ) | (15,087,019 | ) | ||||
| Net |
$ | (8,606,390 | ) | $ | 348,195 | |||
Cash payments for interest for the fiscal years ended September 25, 2009 and 2008 were as follows:
| 2009 | 2008 | |||||
| Senior debt |
$ | 176,312 | $ | 78,174 | ||
| Debentures and demand notes |
8,826,819 | 7,671,351 | ||||
| Total interest payments |
$ | 9,003,131 | $ | 7,749,525 | ||
Debentures and Demand Notes
Historically, we or our subsidiary, The Money Tree of Georgia Inc., have offered debentures and demand notes to investors as a significant source of our required capital. We rely on the sale of debentures and demand notes to fund redemption obligations, make interest payments and to fund other company working capital.
During the fiscal year ended September 25, 2009, we (1) received gross proceeds of $10.0 million from the sale of debentures and $3.0 million from the sale of demand notes, and (2) paid $18.6 million for redemption of debentures and $3.5 million for redemption of demand notes. As of September 25, 2009, we and our subsidiary, The Money Tree of Georgia Inc., had $73.6 million of debentures and $3.1 million of demand notes outstanding, compared to $82.2 million of debentures and $3.6 million of demand notes outstanding as of September 25, 2008. Accrued interest payable on debentures and demand notes was $13.5 million and $14.9 million as of September 25, 2009 and 2008, respectively. This decrease is a result of the unusually high amount of debentures redeemed during fiscal year 2009. See “Risk Factors – We may be unable to meet our debenture and demand note redemption obligations which could force us to sell off our loan receivables and other operating assets or cease our operations.”
Debentures may be redeemed at our investors’ option at the end of the interest adjustment period selected by them (one year, two years or four years) or at maturity. Demand notes may be redeemed by holders at any time.
Our obligations with respect to the debentures and demand notes are governed by the terms of indenture agreements with U.S. Bank National Association, as trustee. Under the indentures, in addition to other possible events of default, if we fail to make a payment of principal or interest under any debenture or demand note and this failure is not cured within 30 days, we will be deemed in default. Upon such a default, the trustee or holders of 25% in principal of the outstanding debentures or demand notes could declare all principal and accrued interest immediately due and payable. Since our total assets do not cover these debt payment obligations, we would most likely be unable to make all payments under the debentures or demand notes when due, and we might be forced to cease our operations.
31
Table of Contents
Index to Financial Statements
Lack of a Significant Line of Credit
Although we have been without a significant line of credit for the past several years, we are evaluating the possibility of obtaining a line of credit or other forms of capital to meet our future liquidity needs. In fiscal year 2009, loans repaid were approximately $60.0 million. This represents approximately 81% of our average gross outstanding finance receivables during the period. The average term of our direct consumer loans is less than seven months; therefore, if we anticipate having short-term cash flow problems over the next 12 months, we could curtail the amount of funds we loan to our customers and focus on collections to increase cash flow, while continuing to explore other financing options if any are available.
We are evaluating the possibility of obtaining a line of credit for our long-term financing needs. If we fail to secure a line of credit, we will continue to be heavily reliant upon the sale of debentures and demand notes for our liquidity. If we are unable to sell sufficient debentures and demand notes for any reason and we fail to obtain a line of credit or other source of financing, our ability to meet our obligations, including our redemption obligations with respect to the debentures and demand notes, could be materially and adversely affected. Please see “Risk Factors – Our lack of a significant line of credit could affect our liquidity” and “Risk Factors – We may be unable to meet our debenture and demand note redemption obligations which could force us to sell off our loan receivables and other operating assets or cease our operations.”
Subsequent Events
As of September 26, 2009, we ceased sales operation at our Columbus, Georgia used car lot due to poor sales performance and operating losses. Collection activity will continue at this location. In conjunction with this action, we moved one of our two loan offices in Columbus, Georgia to this facility.
As of November 25, 2009, we had redeemed $0.4 million more in debentures than we had sold and we had sold $0.1 million more demand notes than we had redeemed. These include amounts that were redeemed through our subsidiary, The Money Tree of Georgia Inc.
Recent Accounting Pronouncements
Set forth below are recent accounting pronouncements that may have a future effect on operations.
In June 2009, the Financial Accounting Standards Board (FASB) issued new guidance effective for financial statements issued for periods ending after September 15, 2009. “The FASB Accounting Standards Codification” (“FASB ASC”) establishes the source of authoritative U.S. generally accepted accounting principles (GAAP) recognized by the FASB to be applied by nongovernmental entities. Rules and interpretive releases of the Securities and Exchange Commission (SEC) under authority of federal securities laws are also sources of authoritative GAAP for SEC registrants. On the effective date, the FASB ASC superseded all then existing non-SEC accounting and reporting standards. All other non-grandfathered non-SEC accounting literature not included in the ASC became non-authoritative. Our adoption of this guidance did not have a material impact on our consolidated financial statements.
In June 2009, the FASB issued revised guidance to improve the reporting for the transfer of financial assets resulting from (1) practices that have developed since the issuance of previous guidance that are not consistent with the original intent and key requirements of that guidance and (2) concerns of financial statement users that many of the financial assets (and related obligations) that have been derecognized should continue to be reported in the financial statements of transferors. These revisions to FASB ASC 860, “Transfers and Servicing,” must be applied as of the beginning of each reporting entity’s first annual reporting period that begins after November 15, 2009, for interim periods within that first annual reporting period and for interim and annual reporting periods thereafter. Earlier application is prohibited. We do not expect that the adoption of this guidance will have a material impact on our consolidated financial statements.
32
Table of Contents
Index to Financial Statements
In June 2009, the FASB issued revised guidance to improve financial reporting by enterprises involved with variable interest entities and to provide more relevant and reliable information to users of financial statements. These revisions to FASB ASC 810, “Consolidation,” is effective as of the beginning of each reporting entity’s first annual reporting period that begins after November 15, 2009, for interim periods within that first annual reporting period, and for interim and annual reporting periods thereafter. Earlier application is prohibited. We do not expect that the adoption of this guidance will have a material impact on our consolidated financial statements.
In April 2009, the FASB issued revised guidance for recognizing and measuring pre-acquisition contingencies in a business combination. These revisions which are a part of FASB ASC 805, “Business Combinations,” addresses application issues raised by preparers, auditors, and members of the legal profession on initial recognition and measurement, subsequent measurement and accounting, and disclosure of assets and liabilities arising from contingencies in a business combination. This guidance is effective for assets or liabilities arising from contingencies in business combinations for which the acquisition date is on or after the beginning of the first annual reporting period beginning on or after December 15, 2008. This guidance is not expected to have a material impact on our consolidated financial statements.
In May 2008, the FASB issued revised guidance for accounting for financial guarantee insurance contracts. These revisions which are a part of FASB ASC 944, “Financial Services-Insurance,” clarifies the application of GAAP to financial guarantee insurance contracts included within the scope of the guidance. The guidance is effective for financial statements issued for fiscal years beginning after December 15, 2008, and all interim periods within those fiscal years. We do not expect this guidance will have a material impact on our consolidated financial statements.
In March 2008, the FASB issued new guidance concerning “Disclosures about Derivative Instruments and Hedging Activities,” which is included in FASB ASC 815. This guidance requires enhanced disclosures about an entity’s derivative and hedging activities and thereby improves the transparency of financial reporting. This guidance is effective for financial statements issued for fiscal years and interim periods beginning after November 15, 2008, with early application encouraged. This guidance encourages, but does not require, comparative disclosures for earlier periods at initial adoption. Management does not expect this guidance to have a material impact on our consolidated financial statements.
In December 2007, the FASB issued new guidance for the accounting of noncontrolling interests. This new guidance, which is part of FASB ASC 810, “Consolidations,” establishes accounting and reporting standards for the noncontrolling (minority) interest in a subsidiary and for the deconsolidation of a subsidiary. It clarifies that a noncontrolling interest in a subsidiary is an ownership interest in the consolidated entity that should be reported as equity in the consolidated financial statements. We have not yet determined the impact, if any, that this guidance will have on its consolidated financial statements. This guidance is effective for our fiscal year beginning September 26, 2009.
In December 2007, the FASB issued revised guidance for the accounting of business combinations. These revisions to FASB ASC 805, “Business Combinations,” require that the acquisition method of accounting (previously the purchase method) be used for all business combinations and that an acquirer be identified for each business combination. This guidance also establishes principles and requirements for how the acquirer: a) recognizes and measures in its financial statements the identifiable assets acquired, the liabilities assumed, and any noncontrolling interest in the acquiree; b) recognizes and measures the goodwill acquired in the business combination or a gain from a bargain purchase; and c) determines what information to disclose to enable users of the financial statements to evaluate the nature and financial effects of the business combination. The guidance will apply prospectively to business combinations for which the acquisition date is on or after September 26, 2009. While we have not yet evaluated this statement for the impact, if any, that this guidance will have on its consolidated financial statements, we will be required to expense costs related to any acquisitions after September 25, 2009.
In June 2009, the FASB issued SFAS No. 167, “Amendments to FASB Interpretation No. 46(R)” (SFAS 167), which has not been codified. SFAS 167 amends FASB Interpretation No. 46 (revised December 2003), “Consolidation of Variable Interest Entities” (FIN 46(R)) to require an enterprise to qualitatively assess the determination of the primary beneficiary of a variable interest entity (VIE) based on whether the entity (1) has the power to direct the activities of a VIE that most significantly impact the entity’s economic performance and (2) has
33
Table of Contents
Index to Financial Statements
the obligation to absorb losses of the entity or the right to receive benefits from the entity that could potentially be significant to the VIE. Also, SFAS 167 requires an ongoing reconsideration of the primary beneficiary, and amends the events that trigger a reassessment of whether an entity is a VIE. Enhanced disclosures are also required to provide information about an enterprise’s involvement in a VIE. SFAS No. 167 is effective for interim and annual reporting periods ending after November 15, 2009. We are currently evaluating the impact, if any, this standard will have on our consolidated financial statements.
Critical Accounting Policies
Our accounting and reporting policies conform with GAAP and predominant practice within the financial services industry. The preparation of financial statements in conformity with GAAP requires management to make estimates and assumptions that affect the amounts reported in the financial statements and the accompanying notes. Actual results could differ from those estimates.
We believe that the determination of our allowance for credit losses involves a higher degree of judgment and complexity than our other significant accounting policies. The allowance for credit losses is calculated with the objective of maintaining a reserve level believed by management to be sufficient to absorb estimated credit losses. Management’s determination of the adequacy of the allowance is based on periodic evaluations of the loan portfolio and other relevant factors. However, this evaluation is inherently subjective, as it requires material estimates including, among others, expected default probabilities, loss given default, the amounts and timing of expected future cash flows on impaired loans, and general amounts for historical loss experience. We also consider economic conditions, uncertainties in estimating losses and inherent risks in the loan portfolio. All of these factors may be susceptible to significant change. To the extent actual outcomes differ from management’s estimates, additional provisions for credit losses may be required that would adversely impact earnings in future periods.
Finance receivables are considered impaired (i.e., income recognition ceases) as a result of past-due status or a judgment by management that, although payments are current, such action is prudent. Finance receivables on which payments are past due 90 days or more are considered impaired unless they are well-secured and in the process of collection or renewal. Any losses incurred from finance receivables that are impaired are charged off at 180 days past due. Related accrued interest and fees are reversed against current period income.
When a loan is impaired, interest accrued but uncollected is generally reversed against interest income. Cash receipts on impaired loans are generally applied to reduce the unpaid principal balance.
We recognize deferred tax assets and liabilities for the future tax effects of temporary differences, net operating loss carry-forwards and tax credits. Deferred tax assets are subject to management’s judgment based upon available evidence that future realization is more likely than not. If management determines that we may be unable to realize all or part of net deferred tax assets in the future, a direct charge to income tax expense may be required to reduce the recorded value of the net deferred tax asset to the expected realizable amount.
In 2007, management revised its methodology in determining the adequacy of the allowance for credit losses and now relies much more heavily on current data available rather than simply looking at average charge-offs over historical periods greater than one year. Otherwise, we have not substantially changed any aspect of our overall approach in the application of the foregoing policies. There have been no other material changes in assumptions or estimation techniques utilized as compared to previous years. Please refer to Note 2 in the notes to our audited consolidated financial statements for details regarding our significant accounting policies.
Impact of Inflation and General Economic Conditions
Although inflation has not had a material adverse effect on our financial condition or results of operations, increases in the inflation rate are generally associated with increased interest rates. A significant and sustained increase in interest rates would likely unfavorably impact our profitability by reducing the interest rate spread between the rate of interest we receive on our customer loans and interest rates we pay to our note holders, banks and finance companies. Inflation may also negatively affect our operating expenses.
34
Table of Contents
Index to Financial Statements
Contractual Commitments and Contingencies
Our operations are carried on in branch office locations which we occupy pursuant to lease agreements. The leases typically provide for a lease term of five years. Please see Notes 11 and 14 in the notes to our audited consolidated financial statements for details relating to our rental commitments and contingent liabilities, respectively. Please also see “Properties” and “Certain Relationships and Related Transactions” for further discussion of our leases. Below is a table showing our contractual obligations under current debt financing and leasing arrangements as of September 25, 2009:
Contractual Obligations
| Payments Due by Period (in thousands) | |||||||||||||||
| Total | Less than 1 year |
1 – 3 years | 3 – 5 years | More than 5 years | |||||||||||
| Long term debt |
$ | 77,076 | $ | 23,770 | $ | 36,815 | $ | 16,491 | $ | — | |||||
| Operating leases |
6,801 | 2,753 | 2,966 | 974 | 108 | ||||||||||
| Total obligations |
$ | 83,877 | $ | 26,523 | $ | 39,781 | $ | 17,465 | $ | 108 | |||||
| Item 7A. | Quantitative and Qualitative Disclosures About Market Risk: |
Our profitability and financial performance are sensitive to changes in the U.S. Treasury yields and the spread between the effective rate of interest we receive on customer loans and the interest rates we pay on our borrowings. Our finance income is generally not sensitive to fluctuations in market interest rates. The primary exposure that we face is changes in interest rates on our borrowings. A substantial and sustained increase in market interest rates would likely adversely affect our growth and profitability since we would be required to increase the interest rates we pay to holders of debentures at the end of each interest adjustment period. We would also face pressure to increase interest rates on our demand notes to stay competitive. The overall objective of our interest rate risk management strategy is to mitigate the effects of changing interest rates on our interest expense through the utilization of short-term variable rate debt and medium- and long-term fixed rate debt. We have not entered into any derivative instruments to manage our interest rate risk. Please see Note 7 in the notes to our audited consolidated financial statements for information on our debt, including maturities and interest rates.
35
Table of Contents
Index to Financial Statements
| Item 8. | Financial Statements and Supplementary Data: |
Index to Consolidated Financial Statements
| Page | ||
| 37 | ||
| Audited Consolidated Financial Statements |
||
| Consolidated Balance Sheets as of September 25, 2009 and 2008, as restated |
38 | |
| 39 | ||
| 40 | ||
| 41 | ||
| 43 | ||
36
Table of Contents
Index to Financial Statements
Report of Independent Registered Public Accounting Firm
To the Directors and Shareholders
The Money Tree Inc. and subsidiaries
We have audited the accompanying consolidated balance sheets of The Money Tree Inc. and subsidiaries (the “Company”) as of September 25, 2009 and 2008, and the related consolidated statements of operations, shareholders’ deficit, and cash flows for each of the three years in the period ended September 25, 2009. These consolidated financial statements are the responsibility of the Company’s management. Our responsibility is to express an opinion on these consolidated financial statements based on our audits.
We conducted our audits in accordance with the standards of the Public Company Accounting Oversight Board (United States). Those standards require that we plan and perform the audit to obtain reasonable assurance about whether the consolidated financial statements are free of material misstatement. An audit includes examining, on a test basis, evidence supporting the amounts and disclosures in the consolidated financial statements. An audit also includes assessing the accounting principles used and significant estimates made by management, as well as evaluating the overall financial statement presentation. We believe that our audits provide a reasonable basis for our opinion.
In our opinion, the consolidated financial statements referred to above present fairly, in all material respects, the financial position of The Money Tree Inc. and subsidiaries as of September 25, 2009 and 2008, and the results of their operations and their cash flows for each of the three years in the period ended September 25, 2009, in conformity with U.S. generally accepted accounting principles.
The accompanying consolidated financial statements for the year ended September 25, 2009 have been prepared assuming the Company will continue as a going concern. As discussed in Note 2 to the consolidated financial statements, the Company has suffered recurring losses from operations and has a net capital deficiency that raise substantial doubt about its ability to continue as a going concern. Management’s plans in regards to these matters are also described in Note 2. The consolidated financial statements do not contain any adjustments that might result from the outcome of these uncertainties.
As described in Note 1 to the consolidated financial statements, the Company’s 2009, 2008 and 2007 consolidated financial statements have been restated to correct a misstatement.
/s/ Carr, Riggs & Ingram, LLC
Tallahassee, Florida
December 23, 2009 except for the matters disclosed in the third paragraph of Note 1, as to which the date is May 26, 2010.
37
Table of Contents
Index to Financial Statements
The Money Tree Inc. and Subsidiaries
Consolidated Balance Sheets, as restated
| September 25, |
2009 | 2008 | ||||||
| Assets |
||||||||
| Cash and cash equivalents |
$ | 2,921,777 | $ | 12,541,302 | ||||
| Finance receivables, net |
47,356,095 | 59,787,584 | ||||||
| Other receivables |
716,661 | 956,752 | ||||||
| Inventory |
2,201,966 | 3,167,021 | ||||||
| Property and equipment, net |
4,226,555 | 4,906,189 | ||||||
| Other assets |
1,831,146 | 2,498,205 | ||||||
| Total assets |
$ | 59,254,200 | $ | 83,857,053 | ||||
| Liabilities and Shareholders’ Deficit |
||||||||
| Liabilities |
||||||||
| Accounts payable and other accrued liabilities |
$ | 2,489,269 | $ | 3,278,870 | ||||
| Accrued interest payable |
13,462,931 | 14,854,877 | ||||||
| Demand notes |
3,146,707 | 3,658,160 | ||||||
| Senior debt |
326,517 | 694,890 | ||||||
| Variable rate subordinated debentures |
73,602,821 | 82,209,211 | ||||||
| Total liabilities |
93,028,245 | 104,696,008 | ||||||
| Commitments and contingencies (see Notes 11 and 14) |
||||||||
| Shareholders’ deficit |
||||||||
| Common stock: |
||||||||
| Class A voting, no par value; 500,000 shares authorized, 2,686 shares issued and outstanding |
1,677,647 | 1,677,647 | ||||||
| Class B non-voting, no par value; 1,500,000 shares authorized, 26,860 shares issued and outstanding |
— | — | ||||||
| Accumulated deficit |
(35,451,692 | ) | (22,516,602 | ) | ||||
| Total shareholders’ deficit |
(33,774,045 | ) | (20,838,955 | ) | ||||
| Total liabilities and shareholders’ deficit |
$ | 59,254,200 | $ | 83,857,053 | ||||
See accompanying notes to the consolidated financial statements.
38
Table of Contents
Index to Financial Statements
The Money Tree Inc. and Subsidiaries
Consolidated Statements of Operations, as restated
| Years ended September 25, |
2009 | 2008 | 2007 | |||||||||
| Interest and fee income |
$ | 15,589,074 | $ | 19,280,069 | $ | 19,480,740 | ||||||
| Interest expense |
(7,611,185 | ) | (8,275,310 | ) | (8,025,969 | ) | ||||||
| Net interest and fee income before provision for credit losses |
7,977,889 | 11,004,759 | 11,454,771 | |||||||||
| Provision for credit losses |
(10,613,619 | ) | (13,042,863 | ) | (7,939,781 | ) | ||||||
| Net revenue (loss) from interest and fees after provision for credit losses |
(2,635,730 | ) | (2,038,104 | ) | 3,514,990 | |||||||
| Insurance commissions |
8,354,410 | 9,615,005 | 10,120,463 | |||||||||
| Commissions from motor club memberships from company owned by related parties |
1,601,482 | 1,844,341 | 1,946,476 | |||||||||
| Delinquency fees |
1,561,013 | 1,719,608 | 1,775,728 | |||||||||
| Income tax service agreement income from company owned by related parties |
— | — | 3,310 | |||||||||
| Other income |
529,541 | 647,406 | 747,829 | |||||||||
| Net revenue before retail sales |
9,410,716 | 11,788,256 | 18,108,796 | |||||||||
| Retail sales |
16,019,081 | 17,164,407 | 19,001,858 | |||||||||
| Cost of sales |
(10,365,638 | ) | (11,131,463 | ) | (12,170,317 | ) | ||||||
| Gross margin on retail sales |
5,653,443 | 6,032,944 | 6,831,541 | |||||||||
| Net revenues |
15,064,159 | 17,821,200 | 24,940,337 | |||||||||
| Operating expenses |
||||||||||||
| Personnel expense |
(15,732,538 | ) | (15,530,590 | ) | (15,349,102 | ) | ||||||
| Facilities expense |
(3,981,370 | ) | (3,807,540 | ) | (3,760,048 | ) | ||||||
| General and adminstrative expenses |
(3,062,752 | ) | (3,287,831 | ) | (3,150,330 | ) | ||||||
| Other operating expenses |
(5,649,625 | ) | (4,852,247 | ) | (4,978,335 | ) | ||||||
| Impairment loss from writedown of goodwill |
— | (991,243 | ) | (365,824 | ) | |||||||
| Total operating expenses |
(28,426,285 | ) | (28,469,451 | ) | (27,603,639 | ) | ||||||
| Net operating loss |
(13,362,126 | ) | (10,648,251 | ) | (2,663,302 | ) | ||||||
| Loss on sale of property and equipment |
(10,497 | ) | (20,980 | ) | (19,012 | ) | ||||||
| Loss before income tax benefit (expense) |
(13,372,623 | ) | (10,669,231 | ) | (2,682,314 | ) | ||||||
| Income tax benefit (expense) |
437,533 | 682,194 | (1,109,336 | ) | ||||||||
| Net loss |
$ | (12,935,090 | ) | $ | (9,987,037 | ) | $ | (3,791,650 | ) | |||
| Net loss per common share, basic and diluted |
$ | (437.79 | ) | $ | (338.02 | ) | $ | (128.33 | ) | |||
See accompanying notes to the consolidated financial statements.
39
Table of Contents
Index to Financial Statements
The Money Tree Inc. and Subsidiaries
Consolidated Statements of Shareholders’ Deficit, as restated
| Common Stock | ||||||||||||||||||
| Class A Voting | Class B Non-voting | Total | ||||||||||||||||
| Stated | Stated | Accumulated | Shareholders’ | |||||||||||||||
| Shares | Value | Shares | Value | Deficit | Deficit | |||||||||||||
| Balance at September 25, 2006, as originally reported |
2,686 | $ | 1,677,647 | 26,860 | $ | — | $ | (2,982,984 | ) | $ | (1,305,337 | ) | ||||||
| Effect of restatement |
— | — | — | — | (5,754,931 | ) | (5,754,931 | ) | ||||||||||
| Balance at September 25, 2006, restated |
2,686 | $ | 1,677,647 | 26,860 | $ | — | $ | (8,737,915 | ) | $ | (7,060,268 | ) | ||||||
| Net loss (as restated) |
— | — | — | — | (3,791,650 | ) | (3,791,650 | ) | ||||||||||
| Balance at September 25, 2007 |
2,686 | 1,677,647 | 26,860 | — | (12,529,565 | ) | (10,851,918 | ) | ||||||||||
| Net loss (as restated) |
— | — | — | — | (9,987,037 | ) | (9,987,037 | ) | ||||||||||
| Balance at September 25, 2008 |
2,686 | 1,677,647 | 26,860 | — | (22,516,602 | ) | (20,838,955 | ) | ||||||||||
| Net loss (as restated) |
— | — | — | — | (12,935,090 | ) | (12,935,090 | ) | ||||||||||
| Balance at September 25, 2009 |
2,686 | $ | 1,677,647 | 26,860 | $ | — | $ | (35,451,692 | ) | $ | (33,774,045 | ) | ||||||
See accompanying notes to the consolidated financial statements.
40
Table of Contents
Index to Financial Statements
The Money Tree Inc. and Subsidiaries
Consolidated Statements of Cash Flows, as restated
| Years ended September 25, |
2009 | 2008 | 2007 | |||||||||
| Cash flows from operating activities |
||||||||||||
| Net loss |
$ | (12,935,090 | ) | $ | (9,987,037 | ) | $ | (3,791,650 | ) | |||
| Adjustments to reconcile net loss to net cash provided by (used in) operating activities: |
||||||||||||
| Provision for credit losses |
10,613,619 | 13,042,863 | 7,939,781 | |||||||||
| Depreciation |
880,119 | 793,776 | 794,418 | |||||||||
| Amortization |
4,524 | 5,714 | 5,714 | |||||||||
| Impairment loss from write-down of goodwill |
— | 991,243 | 365,824 | |||||||||
| Deferred income tax expense (benefit) |
— | — | 645,000 | |||||||||
| Loss on sale of property and equipment |
10,497 | 20,980 | 19,012 | |||||||||
| Loss on sale of finance receivables |
148,063 | — | — | |||||||||
| Change in assets and liabilities: |
||||||||||||
| Other receivables |
240,091 | (93,396 | ) | 151,586 | ||||||||
| Inventory |
965,055 | (110,246 | ) | (861,312 | ) | |||||||
| Other assets |
662,535 | (753,777 | ) | 360,762 | ||||||||
| Accounts payable and other accrued liabilities |
(789,601 | ) | (741,186 | ) | 494,778 | |||||||
| Accrued interest payable |
(1,391,946 | ) | 525,785 | 2,747,680 | ||||||||
| Net cash (used in) provided by operating activities |
(1,592,134 | ) | 3,694,719 | 8,871,593 | ||||||||
| Cash flows from investing activities |
||||||||||||
| Finance receivables originated |
(58,340,423 | ) | (73,335,373 | ) | (76,942,622 | ) | ||||||
| Finance receivables repaid |
59,934,161 | 67,630,531 | 72,779,841 | |||||||||
| Purchase of property and equipment |
(706,512 | ) | (1,586,379 | ) | (1,032,849 | ) | ||||||
| Proceeds from sale of property and equipment |
495,530 | 85,319 | 580,338 | |||||||||
| Proceeds from sale of finance receivables |
76,069 | — | — | |||||||||
| Net cash provided by (used in) investing activities |
1,458,825 | (7,205,902 | ) | (4,615,292 | ) | |||||||
| Cash flows from financing activities |
||||||||||||
| Net proceeds (repayments) on: |
||||||||||||
| Senior debt |
(368,373 | ) | 183,227 | (156,886 | ) | |||||||
| Demand notes |
(511,453 | ) | (2,333,214 | ) | (2,145,476 | ) | ||||||
| Repayments on senior subordinated debt |
— | — | (600,000 | ) | ||||||||
| Repayments on junior subordinated debt to related parties |
— | — | (370,000 | ) | ||||||||
| Proceeds-variable rate subordinated debentures |
10,028,146 | 15,435,214 | 14,132,396 | |||||||||
| Payments-variable rate subordinated debentures |
(18,634,536 | ) | (15,087,019 | ) | (10,181,582 | ) | ||||||
| Net cash (used in) provided by financing activities |
(9,486,216 | ) | (1,801,792 | ) | 678,452 | |||||||
| Net change in cash and cash equivalents |
(9,619,525 | ) | (5,312,975 | ) | 4,934,753 | |||||||
| Cash and cash equivalents, beginning of year |
12,541,302 | 17,854,277 | 12,919,524 | |||||||||
| Cash and cash equivalents, end of year |
$ | 2,921,777 | $ | 12,541,302 | $ | 17,854,277 | ||||||
See accompanying notes to the consolidated financial statements.
41
Table of Contents
Index to Financial Statements
The Money Tree Inc. and Subsidiaries
Consolidated Statements of Cash Flows (continued)
| Years ended September 25, |
2009 | 2008 | 2007 | ||||||
| SUPPLEMENTAL DISCLOSURE OF CASH FLOW INFORMATION: |
|||||||||
| Cash paid during the year for: |
|||||||||
| Interest |
$ | 9,003,131 | $ | 7,749,525 | $ | 5,278,289 | |||
| Income taxes |
$ | — | $ | 268,642 | $ | 198,897 | |||
See accompanying notes to the consolidated financial statements.
42
Table of Contents
Index to Financial Statements
The Money Tree Inc. and Subsidiaries
Notes to Consolidated Financial Statements
NOTE 1 – NATURE OF BUSINESS
The business of The Money Tree Inc. and subsidiaries (the “Company”) consists of the operation of finance company offices which originates direct consumer loans and sales finance contracts in 102 locations throughout Georgia, Alabama, Louisiana and Florida; sales of merchandise (principally furniture, appliances, and electronics) at certain finance company locations; and the operation of three used automobile dealerships in Georgia. The Company also earns revenues from commissions on premiums written for certain insurance products, when requested by loan customers, as an agent for a non-affiliated insurance company. Revenues are also generated from commissions on the sales of automobile club memberships from a company owned by related parties and commissions from sales of prepaid telephone and prepaid cellular services.
The Company’s loan portfolio consists of consumer sales finance contracts receivables, auto sales finance contracts and direct consumer loan receivables. Consumer sales finance contracts receivables consist principally of retail installment sale contracts collateralized primarily by consumer goods sold by our consumer good dealerships, subject to credit approval, in the locations where the Company operates offices. Auto sales finance contracts are motor vehicle installment contracts collateralized by motor vehicles sold by our auto segment dealerships. Direct consumer loan receivables are loans originated directly to customers for general use which are collateralized by existing automobiles or consumer goods, or are unsecured.
Restated Financial Data
Subsequent to issuance of the Company’s 2009 financial statements the Company’s management identified an error related to its recognition of losses related to consumer bankrupt accounts. As a result, the Company has restated certain amounts in the accompanying consolidated financial statements to correct errors in previously reported amounts related to net finance receivables. This restatement affected the provision for credit losses, finance receivables and accumulated deficit. See Note 3 – Finance receivables and allowance for credit losses, Note 9 – Income taxes, Note 16 – Segment financial information, and Note 18 – Restatement of Previously Issued Financial Statements.
NOTE 2 – SUMMARY OF SIGNIFICANT ACCOUNTING POLICIES
Basis of Financial Statement Presentation
The consolidated financial statements include the accounts of The Money Tree Inc. and its subsidiaries, all of which are wholly owned by The Money Tree Inc. All significant intercompany accounts and transactions are eliminated in consolidation. Subsequent events have been evaluated through the date the financial statements were issued.
In preparing the consolidated financial statements in conformity with U.S. generally accepted accounting principles (GAAP), management is required to make estimates and assumptions that affect the reported amounts of assets and liabilities and disclosure of contingent assets and liabilities as of the date of the balance sheet and the reported amounts of revenues and expenses for the reporting period. Actual results could vary from those estimates. Significant estimates include the determination of the allowance for credit losses relating to the Company’s finance receivables. This evaluation is inherently subjective, and, as such, there is at least a reasonable possibility that recorded estimates could change by a material amount in the near term.
The accompanying consolidated financial statements have been prepared on a going concern basis, which contemplates the realization of assets and the satisfaction of liabilities in the normal course of business. The operations of the Company in 2009 reflect continued pressure from an uncertain economy and the negative impact of the turmoil in the credit markets. For the years ended September 25, 2009 and 2008, respectively, the Company has incurred net losses of $12,935,090 and $9,987,037, and has had a deficiency in net interest margin (net loss from interest and fees after provision for credit losses) of $2,635,730 and $2,038,104 and, as of September 25, 2009 and 2008, had a shareholders’ deficit of $33,774,045 and $20,838,955, respectively. These factors among others raise substantial doubt about the Company’s ability to continue as a going concern for a reasonable period of time.
The Company has closely monitored and managed its liquidity position, understanding that this is of critical importance in the current economic environment; however, the current economic environment makes the cash forecast difficult to predict.
43
Table of Contents
Index to Financial Statements
The Money Tree Inc. and Subsidiaries
Notes to Consolidated Financial Statements
NOTE 2 – SUMMARY OF SIGNIFICANT ACCOUNTING POLICIES (CONTINUED)
The average term of our direct consumer loans is less than seven months and, therefore, if we anticipate having short-term cash flow problems, we could curtail the amount of funds we loan to our customers and focus on collections to increase cash flow. During the year ended September 25, 2009, the Company reduced its debt and related accrued interest by $10.9 million and tightened its risk management controls related to new loans, resulting in a decrease in loan originations of $15.0 million from the prior year. The Company’s continuation as a going concern is dependent upon its ability to generate sufficient cash flow to meet its obligations on a timely basis, originate new loans and to ultimately attain successful operations. The consolidated financial statements do not include any adjustments that might result from the outcome of this uncertainty.
Cash and Cash Equivalents
Cash equivalents are short-term, highly liquid investments with original maturities of three months or less when purchased.
Finance Receivables
Finance receivables are stated at the amount of unpaid principal and accrued interest on certain loans where interest is recognized on an interest accrual basis. Finance receivables with precomputed finance charges are stated at the gross amount reduced by unearned interest, unearned insurance commissions and unearned discounts. In addition to these reductions, all finance receivables are stated net of the allowance for credit losses.
For loans acquired at a discount, the initial investment, which is accounted for in the aggregate, includes the amount paid to the seller plus any fees paid or less any fees received. The initial investment frequently differs from the related loan’s principal amount at the date of purchase. This difference is recognized as an adjustment of yield over the life of the loan. All other costs incurred in connection with acquiring loans, or committing to purchase loans are charged to expense as incurred.
Collectibility of the acquired loans is continually evaluated throughout the life of the acquired loan. If upon subsequent evaluation:
| • | the estimate of the total probable collections is more favorable, the amount of the discount to be amortized is adjusted accordingly. |
| • | the estimate of amounts probable of collection is less favorable, the loans may be considered to be impaired. |
| • | it is not possible to estimate the amount and timing of collection, then amortization ceases, and the cost-recovery method is implemented, which requires that all payments be applied to the principal amount of loan first and when that is reduced to zero, any additional amounts are recognized as income. |
Income Recognition
GAAP requires that an interest yield method be used to calculate income recognized on accounts which have precomputed finance charges. An interest yield method is used by the Company on each individual precomputed account to calculate income for ongoing accounts; however, state regulations often allow interest refunds to be made according to the Rule of 78s method for payoffs and renewals when customers take such actions on their accounts. Since the majority of the Company’s precomputed accounts are paid off or renewed prior to maturity, the result is that most precomputed accounts are adjusted to a Rule of 78s basis effective yield. Renewals and refinancings require that the borrower meet the underwriting guidelines similar to a new customer and, as a result, the interest rate and effective yield, as well as the other terms of the refinanced loans are at least as favorable to the lender as comparable loans with customers with similar risks who are not refinancing; therefore, all renewals and refinancings are treated as new loans. Further any unamortized net fees or costs and any prepayment penalties from the original loan are recognized in interest income when the new loan is granted. Rebates of interest, if applicable, are charged to interest income at the time of the new loan. The new loan is originated utilizing a portion of the proceeds to pay off the existing loan and the remaining portion advanced to the customer. The difference between income previously recognized under the interest yield method and the Rule of 78s method is recognized as an adjustment to interest income at the time of the rebate. Adjustments to interest income for the fiscal years ended September 25, 2009, 2008, and 2007 were $1,325,777, $2,227,772, and $2,504,285, respectively.
44
Table of Contents
Index to Financial Statements
The Money Tree Inc. and Subsidiaries
Notes to Consolidated Financial Statements
NOTE 2 – SUMMARY OF SIGNIFICANT ACCOUNTING POLICIES (CONTINUED)
Recognition of interest income is suspended on accounts with precomputed interest charges when the account becomes more than 90 days delinquent. Accrual of interest income on other finance receivables is suspended when no payment has been made on an account for 60 days or more on a contractual basis. Loans are returned to active status and earning or accrual of income is resumed when all of the principal and interest amounts contractually due are brought current (one or more full contractual monthly payments are received and the account is less than 90 or 60 days contractually delinquent), at which time management believes future payments are reasonably assured. Interest accrued on loans charged off is reversed against interest income in the current period. Any amounts charged off that related to prior periods are not material for any period presented.
For loans acquired at a discount, the initial investment, which is accounted for in the aggregate, includes the amount paid to the seller plus any fees paid or less any fees received. The initial investment frequently differs from the related loan’s principal amount at the date of purchase. This difference is recognized as an adjustment of yield over the life of the loan. All other costs incurred in connection with acquiring loans, or committing to purchase loans are charged to expense as incurred.
The discount on an acquired loan is amortized over the period in which the payments are probable of collection. Discounts are amortized using the interest method.
The Company receives commissions from independent insurers for policies issued to finance customers. These insurance commissions are deferred and systematically amortized to income over the life of the related insurance contract since the insurance and lending activities are integral parts of the same transaction. Commissions for credit and non-credit insurance products are recognized over the risk period based on the method applicable to the insurance coverage’s risk exposure, which generally coincides with the term of the related loan contract. Insurance commissions for products that have constant risk exposure are earned using the straight-line method. Insurance commissions for insurance products with declining risk exposure or coverage are recognized using the Rule of 78s method that approximates the interest method. The auto and accidental death and dismemberment policies are earned over the policy’s predetermined schedule of coverage. The Company retains advance commissions that vary by products at the time the policies are written. Retrospective commissions are paid to the Company on an earned premium basis, net of claims and other expenses. Contingencies exist only to the extent of refunds due on early termination of policies that exceed the amount of advanced commissions retained. These refunds are netted against the gross amount of premiums written.
Commissions earned from Interstate Motor Club, Inc., a related party, on the sale of motor club memberships are recognized at the time the membership is sold. The Company has no obligations related to refund of membership fees on cancellations. Claims filed by members are the responsibility of the issuer of the membership.
Retail sales include sales of used automobiles, home furnishings, electronic equipment, and appliances. Warranties on selected used vehicles are available as an add-on item through an unaffiliated warranty company. Home furnishings, electronic equipment and appliances carry their own manufacturer’s warranties. Retail sales revenues are recognized at the time of sale when title and risk of loss is transferred to the customer. Warranty revenues are recognized at the time of sale.
Loan Origination Fees and Costs
Non-refundable loan origination fees and certain direct origination costs are deferred and recognized as an adjustment of the loan yield over the contractual life of the related loan. Unamortized amounts are recognized in income at the time loans are renewed or paid in full.
Credit Losses
The allowance for credit losses is determined by several factors. Recent historical loss experience is the primary factor in the determination of the allowance for credit losses. An evaluation is performed by loan segment to compare the amount of accounts charged off, net of recoveries of such accounts, in relation to the average net outstanding finance receivables for the period being reviewed. Further, the Company adjusts, when deemed appropriate, the allowance to reflect any enhancement or deterioration in the quality of the loan portfolio, primarily based on a review of loan delinquencies and to a lesser extent other qualitative factors. Management believes this evaluation process provides an adequate allowance for credit losses due to the Company’s direct consumer and consumer sales finance loan portfolios which consist of a large number of smaller balance homogeneous loans. Also, a review of loans that comprise the automotive segment is performed monthly to determine if the allowance should be adjusted based on possible exposure related to collectibility of these loans.
45
Table of Contents
Index to Financial Statements
The Money Tree Inc. and Subsidiaries
Notes to Consolidated Financial Statements
NOTE 2 – SUMMARY OF SIGNIFICANT ACCOUNTING POLICIES (CONTINUED)
In accordance with the auto sales contract, the Company may repossess the collateralized vehicle after 30 days without payment to protect the vehicle’s integrity and to minimize the Company’s loss. Management routinely evaluates the inherent risks and change in the composition of the loan portfolio based on their extensive experience in the consumer finance industry in consideration of estimating the adequacy of the allowance. Also considered are delinquency trends, economic conditions, and industry factors. In most instances, an insurance product is purchased in conjunction with the loan. In the event of the death or injury of the customer or damage to pledged collateral, the proceeds from the claims would generally pay off or continue payments on the loan, thereby negating any consideration in the allowance determination. In other instances, a non-filing or non-recording insurance policy is made in conjunction with the loan, (see description of non-filing insurance below). Proceeds from these claims are netted against charge-offs as recoveries in the determination of the allowance. Recoveries represent receipts from non-file insurance claims, cash recoveries and bankruptcy recoveries. Provisions for credit losses are charged to income in amounts sufficient to maintain an allowance for credit losses at a level considered adequate to cover the probable loss inherent in the finance receivable portfolio.
The Company’s charge-off policy requires that balances be charged off when they are 180 days since last payment, unless upon review by management, the balance is deemed collectible by garnishment of wages or other collection methods. Also, an account may be charged off if it is determined by senior management that the account is uncollectible due to certain circumstances, as in the death of the customer who did not elect to purchase credit life insurance for the loan contract or in situations when repossession and sale of collateral occurs and the balance is not recoverable through the legal process or other methods. Loan balances charged off exclude accrued interest, which is reversed against interest income. Accounts that are to be disbursed under a plan of bankruptcy are monitored separately from other accounts. Consumer bankrupt accounts are fully charged-off within 30 days after receipt of the notice of bankruptcy filing. Direct consumer loans are charged off net of proceeds from non-filing insurance (see discussion below). For consumer sales finance and auto sales contracts, the Company is granted a security interest in the collateral for which the loan was made. In the event of default, the collateral on such contracts may be repossessed at 31 to 60 days delinquency (roughly two payments). After repossession, the collateral is sold according to UCC-9 disposition of collateral rules and the proceeds of the sale are applied to the customer’s account. If the likelihood of collection on a judgment is favorable, a suit is filed for the deficiency balance remaining and, if granted, garnishment and/or execution follows for collection of the balance. If the collateral is not conducive for repossession because of it being in unmarketable condition, judgment is sought without repossession and sale of collateral. If collection on a judgment is not favorable, the balance of the account is charged off.
Non-file insurance
Non-file premiums are charged on direct consumer loans at inception and renewal in lieu of recording and perfecting the Company’s security interest in the assets pledged on such loans and are remitted to a third-party insurance company for non-filing insurance coverage. Non-file insurance is not available for motor vehicle installment sales contracts and consumer sales finance contracts. Certain losses related to such direct consumer loans, which are not recoverable through life, accident and health, property, or unemployment insurance claims, are reimbursed through non-filing insurance claims subject to policy limitations. These limitations include: no loans may exceed $5,000 to any one customer; no loans may exceed 36 months in term; and no fraudulent loans. When accounts covered by non-filing insurance are deemed uncollectible, they are charged off and the claim filed with the insurance carrier, usually within 30 days. Proof of coverage and documentation of collection activity are submitted with the claim. Recoveries from non-filing insurance are reflected in the accompanying consolidated financial statements as a reduction in credit losses and receivables related to such claim recoveries are included in other receivables (see Note 3).
Inventory
Inventory is valued at the lower of cost (first-in, first-out basis) or market. Inventory generally consists of home furnishings, electronics and used automobiles.
46
Table of Contents
Index to Financial Statements
The Money Tree Inc. and Subsidiaries
Notes to Consolidated Financial Statements
NOTE 2 – SUMMARY OF SIGNIFICANT ACCOUNTING POLICIES (CONTINUED)
Property and equipment, net
Property and equipment are recorded at cost. Depreciation is provided by the straight-line method over the estimated useful lives of the assets ranging from 5 to 10 years. Leasehold improvements are recorded at cost and amortized using the straight-line method over the shorter of the estimated useful life of the assets or the lease term. Such amortization is included in depreciation expense in the accompanying consolidated statements of cash flows.
Goodwill
During the years ended September 25, 2008 and 2007 in conjunction with the annual goodwill impairment testing process, the Company recorded impairment charges in the amount of $991,243 and $365,824, respectively. No goodwill was recorded as of September 25, 2009 and 2008.
Impairment of Long-Lived Assets (other than Goodwill)
The Company periodically evaluates whether events or circumstances have occurred that indicate the carrying amount of long-lived assets and certain identifiable intangible assets may warrant revision or may not be recoverable. When factors indicate that these long-lived assets and certain identifiable intangible assets should be evaluated for possible impairment, the Company assesses the recoverability by determining whether the carrying value of such assets will be recovered through the future undiscounted cash flows expected from the use of the asset and its eventual disposition. Amounts paid for covenants not to compete are amortized on a straight-line basis over a period of seven years. In management’s opinion, there has been no impairment of value of long-lived assets and certain identifiable intangible assets at September 25, 2009 and 2008.
Income Taxes
The Company provides for income taxes under the asset and liability method. Under this method, deferred income taxes are recognized for expected future tax consequences of temporary differences between financial statement carrying amounts and the tax bases of existing assets and liabilities using tax rates expected in the years in which those temporary differences are expected to be recovered or settled. Valuation allowances are established, when necessary, to reduce deferred tax assets to the amount expected to be realized.
Governmental Regulation
The Company is subject to various state and federal laws and regulations which, among other things, impose limits on interest rates, other charges, insurance premiums, and require licensing and qualification.
Fair Value of Financial Instruments
The following methods and assumptions are used by the Company in estimating fair values for financial instruments:
Cash and cash equivalents. Cash consists of cash on hand and with banks, either in commercial accounts, or money market accounts. The carrying value of cash and cash equivalents approximates fair value due to the relatively short period between the acquisition of the instruments and their expected realization.
Finance receivables. Finance receivables are reported net of unearned interest, insurance commissions, discounts and allowances for credit losses, which are considered short-term because the average life is approximately five months, assuming prepayments. The discounted cash flows of the loans approximate the net finance receivables.
Subordinated debentures. Fair value approximates $76,372,000 compared to the carrying value of $73,603,000 based on the calculation of the present value of the expected future cash flows associated with the debentures. The debenture holder also may redeem the debenture for 100 percent of the principal on demand subject to a 90-day interest penalty.
Demand notes. The carrying value approximates fair value due to rights to withdraw the balance at any time.
Senior debt. The carrying value of the Company’s senior debt approximates fair value due to the relatively short period of time from origination of the instruments and their expected payment.
Advertising Costs
Advertising costs are expensed as incurred. Advertising expenses totaled $412,823, $616,055, and $704,972 for the years ended September 25, 2009, 2008, and 2007, respectively.
47
Table of Contents
Index to Financial Statements
The Money Tree Inc. and Subsidiaries
Notes to Consolidated Financial Statements
NOTE 2 – SUMMARY OF SIGNIFICANT ACCOUNTING POLICIES (CONTINUED)
Allocation of Expenses to Related Party
Employees of The Money Tree Inc. perform services in support of Interstate Motor Club, an affiliate of the Company. The Company assesses Interstate Motor Club an administration fee that approximates the cost of support provided to Interstate Motor Club.
Net Income (loss) Per Common Share
Net income (loss) per common share is computed based upon weighted–average common shares outstanding. There are no potentially dilutive securities issued or outstanding.
Reclassifications
Certain reclassifications have been made to the prior period financial statements to conform with the method of presentation used in 2009.
Recent Accounting Pronouncements
In June 2009, the Financial Accounting Standards Board (FASB) issued new guidance effective for financial statements issued for periods ending after September 15, 2009. “The FASB Accounting Standards Codification” (“FASB ASC”) establishes the source of authoritative GAAP recognized by the FASB to be applied by nongovernmental entities. Rules and interpretive releases of the Securities and Exchange Commission (SEC) under authority of federal securities laws are also sources of authoritative GAAP for SEC registrants. On the effective date, the FASB ASC superseded all then-existing non-SEC accounting and reporting standards. All other non-grandfathered non-SEC accounting literature not included in the ASC became non-authoritative. Our adoption of this guidance did not have a material impact on our consolidated financial statements.
In June 2009, the FASB issued revised guidance to improve the reporting for the transfer of financial assets resulting from (1) practices that have developed since the issuance of previous guidance that are not consistent with the original intent and key requirements of that guidance and (2) concerns of financial statement users that many of the financial assets (and related obligations) that have been derecognized should continue to be reported in the financial statements of transferors. These revisions to FASB ASC 860, “Transfers and Servicing,” must be applied as of the beginning of each reporting entity’s first annual reporting period that begins after November 15, 2009, for interim periods within that first annual reporting period and for interim and annual reporting periods thereafter. Earlier application is prohibited. We do not expect that the adoption of this guidance will have a material impact on our consolidated financial statements.
In June 2009, the FASB issued revised guidance to improve financial reporting by enterprises involved with variable interest entities and to provide more relevant and reliable information to users of financial statements. These revisions to FASB ASC 810, “Consolidation,” is effective as of the beginning of each reporting entity’s first annual reporting period that begins after November 15, 2009, for interim periods within that first annual reporting period, and for interim and annual reporting periods thereafter. Earlier application is prohibited. We do not expect that the adoption of this guidance will have a material impact on our consolidated financial statements.
In April 2009, the FASB issued revised guidance for recognizing and measuring pre-acquisition contingencies in a business combination. These revisions, which are a part of FASB ASC 805, “Business Combinations,” address application issues raised by preparers, auditors, and members of the legal profession on initial recognition and measurement, subsequent measurement and accounting, and disclosure of assets and liabilities arising from contingencies in a business combination. This guidance is effective for assets or liabilities arising from contingencies in business combinations for which the acquisition date is on or after the beginning of the first annual reporting period beginning on or after December 15, 2008. This guidance is not expected to have a material impact on our consolidated financial statements.
In May 2008, the FASB issued revised guidance for accounting for financial guarantee insurance contracts. These revisions, which are a part of FASB ASC 944, “Financial Services-Insurance,” clarify the application of GAAP to certain financial guarantee insurance contracts included within the scope of the guidance. The guidance is effective for financial statements issued for fiscal years beginning after December 15, 2008, and all interim periods within those fiscal years. We do not expect this guidance will have a material impact on our consolidated financial statements.
48
Table of Contents
Index to Financial Statements
The Money Tree Inc. and Subsidiaries
Notes to Consolidated Financial Statements
NOTE 2 – SUMMARY OF SIGNIFICANT ACCOUNTING POLICIES (CONTINUED)
In March 2008, the FASB issued new guidance concerning “Disclosures about Derivative Instruments and Hedging Activities,” which is included in FASB ASC 815. This guidance requires enhanced disclosures about an entity’s derivative and hedging activities and thereby improves the transparency of financial reporting. This guidance is effective for financial statements issued for fiscal years and interim periods beginning after November 15, 2008, with early application encouraged. This guidance encourages, but does not require, comparative disclosures for earlier periods at initial adoption. Management does not expect this guidance to have a material impact on our consolidated financial statements.
In December 2007, the FASB issued new guidance for the accounting of noncontrolling interests. This new guidance, which is part of FASB ASC 810, “Consolidations,” establishes accounting and reporting standards for the noncontrolling (minority) interest in a subsidiary and for the deconsolidation of a subsidiary. It clarifies that a noncontrolling interest in a subsidiary is an ownership interest in the consolidated entity that should be reported as equity in the consolidated financial statements. We have not yet determined the impact, if any, that this guidance will have on its consolidated financial statements. This guidance is effective for our fiscal year beginning September 26, 2009.
In December 2007, the FASB issued revised guidance for the accounting of business combinations. These revisions to FASB ASC 805, “Business Combinations,” require that the acquisition method of accounting (previously the purchase method) be used for all business combinations and that an acquirer be identified for each business combination. This guidance also establishes principles and requirements for how the acquirer: a) recognizes and measures in its financial statements the identifiable assets acquired, the liabilities assumed, and any noncontrolling interest in the acquiree; b) recognizes and measures the goodwill acquired in the business combination or a gain from a bargain purchase; and c) determines what information to disclose to enable users of the financial statements to evaluate the nature and financial effects of the business combination. The guidance will apply prospectively to business combinations for which the acquisition date is on or after September 26, 2009. While we have not yet evaluated this statement for the impact, if any, that this guidance will have on its consolidated financial statements, we will be required to expense costs related to any acquisitions after September 25, 2009.
In June 2009, the FASB issued SFAS No. 167, “Amendments to FASB Interpretation No. 46(R)” (SFAS 167), which has not been codified. SFAS 167 amends FASB Interpretation No. 46 (revised December 2003), “Consolidation of Variable Interest Entities” (FIN 46(R)) to require an enterprise to qualitatively assess the determination of the primary beneficiary of a variable interest entity (VIE) based on whether the entity (1) has the power to direct the activities of a VIE that most significantly impact the entity’s economic performance and (2) has the obligation to absorb losses of the entity or the right to receive benefits from the entity that could potentially be significant to the VIE. Also, SFAS 167 requires an ongoing reconsideration of the primary beneficiary, and amends the events that trigger a reassessment of whether an entity is a VIE. Enhanced disclosures are also required to provide information about an enterprise’s involvement in a VIE. SFAS No. 167 is effective for interim and annual reporting periods ending after November 15, 2009. We are currently evaluating the impact, if any, this standard will have on our consolidated financial statements.
NOTE 3 – FINANCE RECEIVABLES AND ALLOWANCE FOR CREDIT LOSSES, AS RESTATED
Finance receivables consisted of the following:
| September 25, |
2009 | 2008 | ||||||
| Finance receivables, direct consumer |
$ | 20,098,661 | $ | 33,068,727 | ||||
| Finance receivables, consumer sales finance |
16,663,172 | 17,373,830 | ||||||
| Finance receivables, auto sales finance |
30,151,923 | 30,707,329 | ||||||
| Total gross finance receivables |
66,913,756 | 81,149,886 | ||||||
| Unearned insurance commissions |
(1,996,614 | ) | (2,793,425 | ) | ||||
| Unearned finance charges |
(9,243,875 | ) | (10,621,034 | ) | ||||
| Accrued interest receivable |
608,209 | 865,885 | ||||||
| Finance receivables, before allowance for credit losses |
56,281,476 | 68,601,312 | ||||||
| Allowance for credit losses |
(8,925,381 | ) | (8,813,728 | ) | ||||
| Finance receivables, net |
$ | 47,356,095 | $ | 59,787,584 | ||||
49
Table of Contents
Index to Financial Statements
The Money Tree Inc. and Subsidiaries
Notes to Consolidated Financial Statements
NOTE 3 – FINANCE RECEIVABLES AND ALLOWANCE FOR CREDIT LOSSES, AS RESTATED (CONTINUED)
An analysis of the allowance for credit losses is as follows:
| Years ended September 25, |
2009 | 2008 | 2007 | |||||||||
| Beginning balance |
$ | 8,813,728 | $ | 5,150,361 | $ | 2,275,359 | ||||||
| Provisions for credit losses |
10,613,619 | 13,042,863 | 7,939,781 | |||||||||
| Charge-offs: |
||||||||||||
| Direct consumer |
(8,589,238 | ) | (8,894,529 | ) | (5,579,005 | ) | ||||||
| Consumer sales finance |
(3,966,748 | ) | (2,521,245 | ) | (1,758,664 | ) | ||||||
| Motor vehicle sales finance |
(1,768,170 | ) | (1,370,165 | ) | (1,185,753 | ) | ||||||
| Recoveries - non-file insurance (direct consumer) |
2,795,483 | 2,543,459 | 2,569,925 | |||||||||
| Recoveries - other |
963,918 | 880,607 | 897,460 | |||||||||
| Other |
62,789 | (17,623 | ) | (8,742 | ) | |||||||
| Ending balance |
$ | 8,925,381 | $ | 8,813,728 | $ | 5,150,361 | ||||||
It is the Company’s experience that a substantial portion of the loan portfolio generally is renewed or repaid before contractual maturity dates. During the years ended September 25, 2009, 2008, and 2007, cash collections of receivables (including principal, renewals and finance charges since finance receivables are recorded and tracked at their gross precomputed amount) totaled $76,482,092, $87,883,004, and $95,928,382, respectively, and these cash collections were 103 percent, 105 percent, and 110 percent of average gross finance receivable balances, respectively.
Finance receivables in a non-accrual status totaled $7,715,778, $10,984,616, and $14,017,423 at September 25, 2009, 2008 and 2007, respectively. Because of their delinquency status, the Company considers these loans to be impaired. Consequently, the amount of loans in non-accrual status represents the Company’s investment in impaired loans. Since the Company’s portfolio of finance receivables is comprised primarily of small balance, homogenous loans, individual impairment is not performed, but rather evaluated as a group within the segments of direct consumer, consumer sales finance and automotive sales finance. The allowance for credit losses related to the entire portfolio of loans was $8,925,381, $8,813,728, and $5,150,361 at September 25, 2009, 2008 and 2007, respectively.
The Company ceases the accrual of interest income on interest-bearing finance receivables when no payment has been made for 60 days or more. Recognition of interest income suspends at 90 days contractual delinquency on accounts with precomputed interest charges. Suspended interest totaled $916,802, $1,167,918, and $1,149,545 for the years ended September 25, 2009, 2008, and 2007, respectively.
Finance receivables charged off are reduced by proceeds from non-filing insurance. The Company purchases non-filing insurance on certain loans in lieu of filing a Uniform Commercial Code lien. Premiums collected are remitted to the insurance company to cover possible losses from charge-offs as a result of not recording these liens. Amounts recovered from non-filing insurance claims totaled $2,795,483, $2,543,459, and $2,569,925, for the years ended September 25, 2009, 2008, and 2007, respectively. If this insurance product was discontinued, these proceeds would not be available to offset future credit losses and additional provisions for credit losses would be required. Amounts receivable from the insurance company related to non-filing insurance claims were $421,132 and $514,897 at September 25, 2009 and 2008, respectively, and are included in other receivables in the accompanying consolidated balance sheets.
The Company also realizes recoveries of accounts previously charged off as a result of subsequent collection efforts and through receipts of disbursements from bankruptcy proceedings. These are recognized as recoveries when received and totaled $963,918, $880,607 and $897,460 for the years ended September 25, 2009, 2008 and 2007, respectively.
50
Table of Contents
Index to Financial Statements
The Money Tree Inc. and Subsidiaries
Notes to Consolidated Financial Statements
NOTE 4 – INVENTORY
Inventory consisted of the following:
| September 25, |
2009 | 2008 | ||||
| Used automobiles |
$ | 1,159,473 | $ | 1,529,078 | ||
| Home furnishings and electronics |
1,042,493 | 1,637,943 | ||||
| Total inventory |
$ | 2,201,966 | $ | 3,167,021 | ||
NOTE 5 – PROPERTY AND EQUIPMENT, NET
Property and equipment consisted of the following:
| September 25, |
2009 | 2008 | ||||||
| Furniture and equipment |
$ | 6,025,876 | $ | 6,978,418 | ||||
| Airplane |
174,000 | 609,155 | ||||||
| Automotive equipment |
550,181 | 543,154 | ||||||
| Leasehold improvements |
2,833,393 | 2,698,008 | ||||||
| 9,583,450 | 10,828,735 | |||||||
| Accumulated depreciation |
(5,356,895 | ) | (5,922,546 | ) | ||||
| Total property and equipment, net |
$ | 4,226,555 | $ | 4,906,189 | ||||
Depreciation expense totaled $880,119, $793,776, and $794,418, for the years ended September 25, 2009, 2008 and 2007, respectively.
NOTE 6 – ACCOUNTS PAYABLE AND OTHER ACCRUED LIABILITIES
Accounts payable and other accrued liabilities consisted of the following:
| September 25, |
2009 | 2008 | ||||
| Accounts payable |
$ | 150,144 | $ | 271,815 | ||
| Insurance payable, loan related |
414,470 | 639,167 | ||||
| Accrued payroll |
472,772 | 507,484 | ||||
| Accrued payroll taxes |
35,642 | 38,420 | ||||
| Money orders |
— | 530,888 | ||||
| Sales tax payable |
1,072,007 | 1,210,579 | ||||
| Other liabilities |
344,234 | 80,517 | ||||
| Total accounts payable and other accrued liabilities |
$ | 2,489,269 | $ | 3,278,870 | ||
51
Table of Contents
Index to Financial Statements
The Money Tree Inc. and Subsidiaries
Notes to Consolidated Financial Statements
NOTE 7 – DEBT
Debt consisted of the following:
| September 25, |
2009 | 2008 | ||||
| Senior debt: due to banks and commercial finance companies, collateralized by inventory and certain automotive equipment, and certain notes include personal guarantees of a shareholder, interest at prime plus 2%, due in 2010. The carrying values of the collateral at September 25, 2009 and 2008 were $362,206 and $725,910, respectively. |
$ | 326,517 | $ | 694,890 | ||
| Total senior debt |
326,517 | 694,890 | ||||
| Variable rate subordinated debentures issued by The Money Tree of Georgia Inc.: due to individuals, unsecured, interest at 4.25% to 9.6%, due at various dates through 2013. |
30,730,844 | 45,020,194 | ||||
| Variable rate subordinated debentures issued by The Money Tree Inc.: due to individuals, unsecured, interest at 6.0% to 8.7%, due at various dates through 2013. |
42,871,977 | 37,189,017 | ||||
| Total subordinated debentures |
73,602,821 | 82,209,211 | ||||
| Demand notes issued by The Money Tree of Georgia Inc.: due to individuals, unsecured, interest at 3.0% to 4.0%, due on demand. |
441,747 | 613,442 | ||||
| Demand notes issued by The Money Tree Inc.: due to individuals, unsecured, interest at 3.0% to 4.0%, due on demand. |
2,704,960 | 3,044,718 | ||||
| Total demand notes |
3,146,707 | 3,658,160 | ||||
| Total debt |
$ | 77,076,045 | $ | 86,562,261 | ||
There are no pre-payment penalties on the senior debt or subordinated debt. At the Company’s discretion, these debt obligations could be satisfied by paying the outstanding principal balance plus accrued interest.
Effective December 25, 2005, the Company terminated the sale of debentures and demand notes through its subsidiary, The Money Tree of Georgia Inc. and commenced the sale of debentures and demand notes from the parent company.
Interest on the debentures is earned daily and is payable at any time upon request of the holder. Interest on the demand notes is payable only at the time demand is made by the holder for repayment of the note.
52
Table of Contents
Index to Financial Statements
The Money Tree Inc. and Subsidiaries
Notes to Consolidated Financial Statements
NOTE 7 – DEBT (CONTINUED)
The debentures may be redeemed at the holder’s option at the end of the interest adjustment period selected (one year, two years or four years) or at maturity. Redemption prior to maturity or interest adjustment period is at the Company’s discretion and subject to a 90 day interest penalty. Demand notes may be redeemed by holders at any time. The Company intends to meet its obligation to repay such debt with cash generated from sales of the debentures and demand notes, cash on hand, income from operations or working capital.
Our obligations with respect to the debentures and demand notes are governed by the terms of indenture agreements with U.S. Bank National Association, as trustee. Under the indentures, in addition to other possible events of default, if we fail to make a payment of principal or interest under any debenture or demand note and this failure is not cured within 30 days, we will be deemed in default. Upon such a default, the trustee or holders of 25% in principal of the outstanding debentures or demand notes could declare all principal and accrued interest immediately due and payable. Since our total assets do not cover these debt payment obligations, we would most likely be unable to make all payments under the debentures or demand notes when due, and we might be forced to cease our operations.
Aggregate debt maturities at September 25, 2009 are as follows:
| 2010 | 2011 | 2012 | 2013 | Total | |||||||||||
| Senior debt, banks and finance companies |
$ | 326,517 | $ | — | $ | — | $ | — | $ | 326,517 | |||||
| Variable rate subordinated debentures |
20,296,448 | 15,974,606 | 20,840,806 | 16,490,961 | 73,602,821 | ||||||||||
| Demand notes |
3,146,707 | — | — | — | 3,146,707 | ||||||||||
| $ | 23,769,672 | $ | 15,974,606 | $ | 20,840,806 | $ | 16,490,961 | $ | 77,076,045 | ||||||
Interest expense totaled $7,611,185, $8,275,310, and $8,025,969, for the years ended September 25, 2009, 2008 and 2007, respectively.
NOTE 8 – COMMON STOCK
The common stock of the Company is comprised of the following: Class A voting shares, no par value, 500,000 authorized, 2,686 shares issued and outstanding; and Class B non-voting shares, no par value, 1,500,000 authorized, 26,860 shares issued and outstanding.
NOTE 9 – INCOME TAXES, AS RESTATED
The Company accounts for income taxes in accordance with ASC 740, “Income Taxes”; accordingly deferred income taxes are provided at the enacted marginal rates on the difference between the financial statement and income taxes bases of assets and liabilities. Deferred income tax provisions or benefits are based on the change in the deferred tax assets and liabilities from period to period.
53
Table of Contents
Index to Financial Statements
The Money Tree Inc. and Subsidiaries
Notes to Consolidated Financial Statements
NOTE 9 – INCOME TAXES, AS RESTATED (CONTINUED)
The provision for income taxes for the years ended September 25, 2009, 2008 and 2007 consisted of the following:
| Years ended September 25, |
2009 | 2008 | 2007 | |||||||||
| Current tax expense (benefit) |
||||||||||||
| Federal |
$ | (437,533 | ) | $ | (626,984 | ) | $ | 393,010 | ||||
| State |
— | (55,210 | ) | 71,326 | ||||||||
| Total current |
(437,533 | ) | (682,194 | ) | 464,336 | |||||||
| Deferred income tax expense (benefit) |
||||||||||||
| Federal |
(3,806,453 | ) | (2,804,122 | ) | (1,242,149 | ) | ||||||
| State |
(803,034 | ) | (543,840 | ) | (230,025 | ) | ||||||
| (Decrease) increase in valuation allowance |
4,609,487 | 3,347,962 | 2,117,174 | |||||||||
| Total deferred |
— | — | 645,000 | |||||||||
| Total provision (benefit) |
$ | (437,533 | ) | $ | (682,194 | ) | $ | 1,109,336 | ||||
The income tax provision differs from the amount of income tax determined by applying the U.S. federal rate of 34% to pretax income for the years ended September 25, 2009, 2008 and 2007 due to the following:
| Years ended September 25, |
2009 | 2008 | 2007 | |||||||||
| Income tax expense at Federal statutory income tax rates |
$ | (4,546,692 | ) | $ | (3,627,539 | ) | $ | (911,987 | ) | |||
| Increase (decrease) in income taxes resulting from: |
||||||||||||
| State income taxes, net of federal tax benefit |
(529,556 | ) | (422,501 | ) | (106,219 | ) | ||||||
| Non-deductible expenses |
23,807 | 15,966 | 19,207 | |||||||||
| Increase (decrease) in valuation allowance |
4,609,487 | 3,347,962 | 2,117,174 | |||||||||
| Other |
5,421 | 3,918 | (8,839 | ) | ||||||||
| Total provision (benefit) |
$ | (437,533 | ) | $ | (682,194 | ) | $ | 1,109,336 | ||||
Net deferred tax assets consist of the following components:
| September 25, |
2009 | 2008 | ||||||
| Deferred tax liability: |
||||||||
| Property and equipment |
$ | 472,000 | $ | 564,000 | ||||
| 472,000 | 564,000 | |||||||
| Deferred tax assets: |
||||||||
| Allowance for credit losses |
3,867,679 | 3,855,212 | ||||||
| Net operating loss carryforwards |
7,197,356 | 2,444,336 | ||||||
| Interest income |
154,000 | 86,000 | ||||||
| Insurance commissions |
695,000 | 949,000 | ||||||
| Goodwill and intangible assets |
352,000 | 414,000 | ||||||
| 12,266,035 | 7,748,548 | |||||||
| Net deferred tax assets |
11,794,035 | 7,184,548 | ||||||
| Valuation allowance |
(11,794,035 | ) | (7,184,548 | ) | ||||
| Net deferred tax assets, less valuation allowance |
$ | — | $ | — | ||||
54
Table of Contents
Index to Financial Statements
The Money Tree Inc. and Subsidiaries
Notes to Consolidated Financial Statements
NOTE 9 – INCOME TAXES, AS RESTATED (CONTINUED)
In assessing the realizability of deferred tax assets, management considers whether it is more likely than not that some portion or all of the deferred tax assets will not be realized. The ultimate realization of deferred tax assets is dependent upon the generation of future taxable income and tax planning strategies in making this assessment. In order to fully realize the deferred tax asset, the Company will need to generate future taxable income prior to the expiration of the deferred tax assets governed by the tax code.
At the end of the fiscal year 2009, 2008 and 2007, the Company’s statements of operations reflected cumulative losses in recent years, as that term is used in ASC 740. The Company therefore considered such cumulative losses and other evidence affecting the assessment of the realizability of the net deferred tax assets and concluded that it was no longer more likely than not that the net deferred tax assets were realizable based on the guidance provided in ASC 740. Accordingly, the Company increased the valuation allowance to fully offset the net deferred tax assets.
The Company has available at September 25, 2009, unused Federal operating loss and charitable carryforwards of $16,763,080 and unused state operating loss and charitable carryforwards of $24,908,013 that expire in various amounts in years from 2010 through 2029.
NOTE 10 – RELATED PARTY TRANSACTIONS
Related party transactions and balances consisted of the following:
| As of, or for the years ended September 25, |
2009 | 2008 | 2007 | ||||||
| Interest expense, junior subordinated debt, related parties |
$ | — | $ | — | $ | 6,941 | |||
| Rent expense, companies controlled by shareholders |
2,180,780 | 2,150,371 | 2,033,291 | ||||||
| Motor club commissions earned by The Money Tree Inc. and Subsidiaries represents sales of motor club member-ships with the Company acting as agent for an affiliate owned by a shareholder and other related parties |
1,601,482 | 1,844,341 | 1,946,476 | ||||||
| Income tax service agreement income from affiliated company owned by a shareholder and other related parties |
— | — | 3,310 | ||||||
Martin Family Group, LLLP owns the real estate of thirteen branch offices, one used car lot, and the Company’s principal executive offices. The estate of the Company’s founder and former CEO is a limited partner of Martin Family Group, LLLP and also is the holder of the majority of the Company’s common stock. A Company shareholder is the president of Martin Investments, Inc. which is the managing general partner of Martin Family Group, LLLP. The Company has entered into lease agreements whereby rent is paid monthly for use of these locations. In addition, Martin Sublease LLC leases, and then subleases to the Company, another 53 branch office locations and two used car lots for amounts greater than are paid in the underlying leases. This spread is generally to cover property operating cost or improvements made directly by these entities. In the opinion of management, rates paid for these are comparable to those obtained from third parties. A Company shareholder is the president of Martin Investments, Inc., the company which ultimately controls Martin Sublease LLC.
The Company receives commissions from sales of motor club memberships from an entity, owned by the Company’s President and late founder’s three children (of which one is a Director) pursuant to an Agency Sales Agreement.
55
Table of Contents
Index to Financial Statements
The Money Tree Inc. and Subsidiaries
Notes to Consolidated Financial Statements
NOTE 11 – OPERATING LEASES
The Company leases office locations under various non-cancelable agreements that require various minimum annual rentals.
Future minimum rental commitments at September 25, 2009 were as follows:
| Year Ending September 25 |
Companies controlled by related parties |
Other | Total | ||||||
| 2010 |
$ | 1,948,032 | $ | 804,596 | $ | 2,752,628 | |||
| 2011 |
1,326,471 | 651,148 | 1,977,619 | ||||||
| 2012 |
587,607 | 400,311 | 987,918 | ||||||
| 2013 |
309,905 | 291,762 | 601,667 | ||||||
| 2014 |
216,865 | 155,653 | 372,518 | ||||||
| Thereafter |
11,600 | 96,549 | 108,149 | ||||||
| $ | 4,400,480 | $ | 2,400,019 | $ | 6,800,499 | ||||
Substantially all of the lease agreements are for a five-year term with one or more renewal options at end of the initial term. Rental expense totaled $2,981,593, $2,891,508, and $2,818,172, for the years ended September 25, 2009, 2008, and 2007, respectively.
NOTE 12 – CONCENTRATION OF CREDIT RISK
The Company’s portfolio of finance receivables is with consumers living throughout Georgia, Louisiana, Alabama and Florida, and consequently such consumers’ ability to honor their installment contracts may be affected by economic conditions in these areas. On sales finance contracts and certain other loans, the Company has access to any collateral supporting these receivables through repossession. Finance receivables are collateralized by personal property, automobiles, real property and mobile homes. On unsecured loans, a non-filing insurance policy is generally obtained so that in the event of default, a claim can be filed in order to recover the unpaid balance.
The Company maintains demand deposits with financial institutions. The Company’s policy is to maintain its cash balances at reputable financial institutions insured by the Federal Deposit Insurance Corporation (FDIC), which provides $250,000 of insurance coverage on each customer’s cash balances. At times during the years ended September 25, 2009 and 2008 the Company’s cash balances exceeded the FDIC insured coverage at certain financial institutions.
NOTE 13 – RETIREMENT PLAN
The Company has a 401(k) retirement plan and trust. The plan covers substantially all employees, subject to attaining age 21 and completing 1 year of service with the Company. Under the plan, an employee may contribute up to 15 percent of his or her compensation, with the Company matching 25 percent of these contributions up to a maximum of 6 percent of the employee’s compensation.
Retirement plan expense totaled $44,851, $47,337, and $32,946, for the years ended September 25, 2009, 2008, and 2007, respectively.
NOTE 14 – CONTINGENT LIABILITIES
The Company is a party to litigation arising in the normal course of business. With respect to all such lawsuits, claims, and proceedings, the Company establishes reserves when it is probable a liability has been incurred and the amount can reasonably be estimated. In the opinion of management, the resolution of such matters will not have a material effect on the consolidated financial statements.
56
Table of Contents
Index to Financial Statements
The Money Tree Inc. and Subsidiaries
Notes to Consolidated Financial Statements
NOTE 15 – DISCRETIONARY BONUSES
From time to time, the Company pays discretionary bonuses to its employees. The amount of these bonuses charged to operating expenses was $2,295,975, $2,243,839, and $2,075,668, for the years ended September 25, 2009, 2008, and 2007, respectively.
NOTE 16 – SEGMENT FINANCIAL INFORMATION, AS RESTATED
ASC 280, “Segment Reporting”, requires companies to determine segments based on how management makes decisions about allocating resources to segments and measuring their performance.
The Company has two reportable segments: Consumer Finance and Sales and also Automotive Finance and Sales.
Consumer finance and sales segment
This segment is comprised of original core operations of the Company: the small consumer loan business in the four states in which the Company operates. The 102 offices that make up this segment are similar in size and in the market they serve. All, with few exceptions, offer consumer goods for sale acting as an agent for another subsidiary of the Company, Home Furniture Mart Inc., which is aggregated in this segment since its sales are generated through these finance offices. This segment is structured with branch management reporting through a regional management level to an operational manager and ultimately to the chief operating decision maker.
Automotive finance and sales segment
This segment is comprised of three used automobile sales locations and offers financing in conjunction with these sales. These locations target similar customers in the Bainbridge, Columbus and Dublin, Georgia markets and surrounding areas who generally cannot qualify for traditional financing. The sales and the financing organizations are aggregated in the segment. A general manager is responsible for sales and finance administration at each of the locations and reports to an operational manager and ultimately to the chief operating decision maker.
Accounting policies of the segments are the same as those described in the summary of significant accounting policies. Performance is measured by various factors such as segment profit, loan volumes and delinquency and loss management. All corporate expenses are allocated to the segments. Provisions for income taxes are not allocated to segments.
57
Table of Contents
Index to Financial Statements
The Money Tree Inc. and Subsidiaries
Notes to Consolidated Financial Statements
NOTE 16 – SEGMENT FINANCIAL INFORMATION, AS RESTATED (CONTINUED)
| Year ended September 25, 2009 |
Consumer Finance & Sales Division |
Automotive Finance & Sales Division |
Total Segments |
|||||||||
| (In Thousands) | ||||||||||||
| Interest and fee income |
$ | 12,585 | $ | 3,004 | $ | 15,589 | ||||||
| Interest expense |
(5,288 | ) | (2,323 | ) | (7,611 | ) | ||||||
| Net interest and fee income before provision for credit losses |
7,297 | 681 | 7,978 | |||||||||
| Provision for credit losses |
(8,760 | ) | (1,854 | ) | (10,614 | ) | ||||||
| Net interest and fee loss |
(1,463 | ) | (1,173 | ) | (2,636 | ) | ||||||
| Insurance commissions |
8,136 | 218 | 8,354 | |||||||||
| Commissions from sale of motor club memberships from affiliated company |
1,601 | — | 1,601 | |||||||||
| Delinquency fees |
1,437 | 124 | 1,561 | |||||||||
| Other income |
510 | 21 | 531 | |||||||||
| Net revenues (loss) before retail sales |
10,221 | (810 | ) | 9,411 | ||||||||
| Gross margin on retail sales |
2,911 | 2,742 | 5,653 | |||||||||
| Segment operating expenses |
(24,706 | ) | (3,720 | ) | (28,426 | ) | ||||||
| Segment operating loss |
$ | (11,574 | ) | $ | (1,788 | ) | $ | (13,362 | ) | |||
| Depreciation (Included in segment operating expenses) |
$ | 514 | $ | 75 | $ | 589 | ||||||
| Total segment assets |
$ | 30,092 | $ | 25,236 | $ | 55,328 | ||||||
| Capital expenditures |
$ | 338 | $ | 13 | $ | 351 | ||||||
| RECONCILIATION: |
2009 | |||||||||||
| Depreciation: | ||||||||||||
| Segment depreciation |
$ | 589 | ||||||||||
| Depreciation at corporate level |
291 | |||||||||||
| Total depreciation |
$ | 880 | ||||||||||
| Total assets for reportable segments |
$ | 55,328 | ||||||||||
| Cash and cash equivalents at corporate level |
345 | |||||||||||
| Other receivables at corporate level |
717 | |||||||||||
| Property and equipment, net at corporate level |
1,033 | |||||||||||
| Other assets at corporate level |
1,831 | |||||||||||
| Consolidated assets |
$ | 59,254 | ||||||||||
| Total capital expenditures for reportable segments |
$ | 351 | ||||||||||
| Capital expenditures at corporate level |
356 | |||||||||||
| Total capital expenditures |
$ | 707 | ||||||||||
58
Table of Contents
Index to Financial Statements
The Money Tree Inc. and Subsidiaries
Notes to Consolidated Financial Statements
NOTE 16 – SEGMENT FINANCIAL INFORMATION, AS RESTATED (CONTINUED)
| Year ended September 25, 2008 |
Consumer Finance & Sales Division |
Automotive Finance & Sales Division |
Total Segments |
|||||||||
| (In Thousands) | ||||||||||||
| Interest and fee income |
$ | 15,904 | $ | 3,376 | $ | 19,280 | ||||||
| Interest expense |
(5,974 | ) | (2,301 | ) | (8,275 | ) | ||||||
| Net interest and fee income before provision for credit losses |
9,930 | 1,075 | 11,005 | |||||||||
| Provision for credit losses |
(11,491 | ) | (1,552 | ) | (13,043 | ) | ||||||
| Net interest and fee loss |
(1,561 | ) | (477 | ) | (2,038 | ) | ||||||
| Insurance commissions |
9,084 | 531 | 9,615 | |||||||||
| Commissions from sale of motor club memberships from affiliated company |
1,844 | — | 1,844 | |||||||||
| Delinquency fees |
1,616 | 104 | 1,720 | |||||||||
| Other income |
625 | 22 | 647 | |||||||||
| Net revenues before retail sales |
11,608 | 180 | 11,788 | |||||||||
| Gross margin on retail sales |
3,286 | 2,747 | 6,033 | |||||||||
| Segment operating expenses |
(24,768 | ) | (3,701 | ) | (28,469 | ) | ||||||
| Segment operating loss |
$ | (9,874 | ) | $ | (774 | ) | $ | (10,648 | ) | |||
| Depreciation (Included in segment operating expenses) |
$ | 389 | $ | 90 | $ | 479 | ||||||
| Total segment assets |
$ | 44,047 | $ | 26,451 | $ | 70,498 | ||||||
| Capital expenditures |
$ | 1,132 | $ | 13 | $ | 1,145 | ||||||
| RECONCILIATION: |
2008 | |||||||||||
| Depreciation: | ||||||||||||
| Segment depreciation |
$ | 479 | ||||||||||
| Depreciation at corporate level |
314 | |||||||||||
| Total depreciation |
$ | 793 | ||||||||||
| Total assets for reportable segments |
$ | 70,498 | ||||||||||
| Cash and cash equivalents at corporate level |
8,527 | |||||||||||
| Other receivables at corporate level |
957 | |||||||||||
| Property and equipment, net at corporate level |
1,377 | |||||||||||
| Other assets at corporate level |
2,498 | |||||||||||
| Consolidated assets |
$ | 83,857 | ||||||||||
| Total capital expenditures for reportable segments |
$ | 1,145 | ||||||||||
| Capital expenditures at corporate level |
441 | |||||||||||
| Total capital expenditures |
$ | 1,586 | ||||||||||
59
Table of Contents
Index to Financial Statements
The Money Tree Inc. and Subsidiaries
Notes to Consolidated Financial Statements
NOTE 16 – SEGMENT FINANCIAL INFORMATION, AS RESTATED (CONTINUED)
| Year ended September 25, 2007 |
Consumer Finance & Sales Division |
Automotive Finance & Sales Division |
Total Segments |
|||||||||
| (In Thousands) | ||||||||||||
| Interest and fee income |
$ | 16,064 | $ | 3,417 | $ | 19,481 | ||||||
| Interest expense |
(5,708 | ) | (2,318 | ) | (8,026 | ) | ||||||
| Net interest and fee income before provision for credit losses |
10,356 | 1,099 | 11,455 | |||||||||
| Provision for credit losses |
(6,670 | ) | (1,270 | ) | (7,940 | ) | ||||||
| Net interest and fee income (loss) |
3,686 | (171 | ) | 3,515 | ||||||||
| Insurance commissions |
9,569 | 551 | 10,120 | |||||||||
| Commissions from sale of motor club memberships from affiliated company |
1,946 | — | 1,946 | |||||||||
| Delinquency fees |
1,713 | 63 | 1,776 | |||||||||
| Income tax service agreement from affiliated company |
3 | — | 3 | |||||||||
| Other income |
731 | 17 | 748 | |||||||||
| Net revenues before retail sales |
17,648 | 460 | 18,108 | |||||||||
| Gross margin on retail sales |
2,986 | 3,846 | 6,832 | |||||||||
| Segment operating expenses |
(23,638 | ) | (3,965 | ) | (27,603 | ) | ||||||
| Segment operating profit (loss) |
$ | (3,004 | ) | $ | 341 | $ | (2,663 | ) | ||||
| Depreciation (Included in segment operating expenses) |
$ | 423 | $ | 103 | $ | 526 | ||||||
| Total segment assets |
$ | 54,124 | $ | 28,077 | $ | 82,201 | ||||||
| Capital expenditures |
$ | 173 | $ | 76 | $ | 249 | ||||||
| RECONCILIATION: |
2007 | |||||||||||
| Depreciation: |
||||||||||||
| Segment depreciation |
$ | 526 | ||||||||||
| Depreciation at corporate level |
268 | |||||||||||
| Total depreciation |
$ | 794 | ||||||||||
| Assets: |
||||||||||||
| Total assets for reportable segments |
$ | 82,201 | ||||||||||
| Cash and cash equivalents at corporate level |
9,762 | |||||||||||
| Other receivables at corporate level |
861 | |||||||||||
| Employee receivables at corporate level |
2 | |||||||||||
| Property and equipment, net at corporate level |
1,286 | |||||||||||
| Other assets at corporate level |
1,750 | |||||||||||
| Consolidated assets |
$ | 95,862 | ||||||||||
| Total capital expenditures for reportable segments |
$ | 249 | ||||||||||
| Capital expenditures at corporate level |
784 | |||||||||||
| Total capital expenditures |
$ | 1,033 | ||||||||||
60
Table of Contents
Index to Financial Statements
The Money Tree Inc. and Subsidiaries
Notes to Consolidated Financial Statements
NOTE 17 – SUBSEQUENT EVENTS
As of September 26, 2009, we ceased sales operation at our Columbus, Georgia used car lot due to poor sales performance and operating losses. Collection activity will continue at this location. In conjunction with this action, we moved one of our two loan offices in Columbus, Georgia to this facility.
As of November 25, 2009, we had redeemed $0.4 million more in debentures than we had sold and we had sold $0.1 million more demand notes than we had redeemed. These include amounts that were redeemed through our subsidiary, The Money Tree of Georgia Inc.
NOTE 18 – RESTATEMENT OF PREVIOUSLY ISSUED FINANCIAL STATEMENTS
The Company concluded on April 23, 2010, to restate our audited consolidated financial statements as of September 25, 2009 and 2008 and for the three years ended September 25, 2009, 2008 and 2007 (the “Restatement”) to correct errors in previously reported amounts. The Restatement reflects the following adjustments related to net finance receivables, accumulated deficit, and the provision for credit losses.
Events Causing the Restatement
The Company has determined that its policy with respect to consumer bankrupt accounts did not sufficiently reserve for loan losses at the time that customers filed for bankruptcy, and thus did not accurately reflect the likelihood that such accounts eventually would be charged off. After analyzing its consumer bankruptcy portfolio, management of the Company has decided that consumer bankrupt accounts should be charged off fully (i.e. removed from the loan portfolio) within 30 days after receipt of the notice of bankruptcy filing.
The impact of the adjustments for the Restatement of the Consolidated Balance Sheets at September 25, 2009 and 2008 was a decrease in net finance receivables and in accumulated deficit of $8,926,786 and $7,942,889, respectively. The impact of the adjustments for the Restatement of the Consolidated Statements of Operations was an increase in the provision for credit losses by $983,897 and an increase in net loss of $983,897 for the year ended September 25, 2009; a decrease in the provision for credit losses by $769,329, a change in the income tax expense to income tax benefit by $1,210,000, and a decrease in net loss of $1,979,329 for the year ended September 25, 2008; and an increase in the provision for credit losses by $2,957,287, a change in the income tax benefit to income tax expense by $1,210,000, and an increase in the net loss by $4,167,287 for the year ended September 25, 2007. These changes are detailed below.
61
Table of Contents
Index to Financial Statements
The Money Tree Inc. and Subsidiaries
Notes to Consolidated Financial Statements
NOTE 18 – RESTATEMENT OF PREVIOUSLY ISSUED FINANCIAL STATEMENTS (CONTINUED)
Impacts on the Consolidated Balance Sheets
| As of September 25, 2009 |
As reported | Adjustment | As restated | |||||||||
| Assets |
||||||||||||
| Cash and cash equivalents |
$ | 2,921,777 | $ | — | $ | 2,921,777 | ||||||
| Finance receivables, net |
56,282,881 | (8,926,786 | ) | 47,356,095 | ||||||||
| Other receivables |
716,661 | — | 716,661 | |||||||||
| Inventory |
2,201,966 | — | 2,201,966 | |||||||||
| Property and equipment, net |
4,226,555 | — | 4,226,555 | |||||||||
| Other assets |
1,831,146 | 1,831,146 | ||||||||||
| Total assets |
$ | 68,180,986 | $ | (8,926,786 | ) | $ | 59,254,200 | |||||
| Liabilities and Shareholders’ Deficit |
||||||||||||
| Liabilities |
||||||||||||
| Accounts payable and other accrued liabilities |
$ | 2,489,269 | $ | — | $ | 2,489,269 | ||||||
| Accrued interest payable |
13,462,931 | — | 13,462,931 | |||||||||
| Demand notes |
3,146,707 | — | 3,146,707 | |||||||||
| Senior debt |
326,517 | — | 326,517 | |||||||||
| Variable rate subordinated debentures |
73,602,821 | — | 73,602,821 | |||||||||
| Total liabilities |
93,028,245 | — | 93,028,245 | |||||||||
| Commitments and contingencies (see Notes 11 and 14) |
||||||||||||
| Shareholders’ deficit |
||||||||||||
| Common stock: |
||||||||||||
| Class A voting, no par value; 500,000 shares authorized, 2,686 shares issued and outstanding |
1,677,647 | — | 1,677,647 | |||||||||
| Class B non-voting, no par value; 1,500,000 shares authorized, 26,860 shares issued and outstanding |
— | — | — | |||||||||
| Accumulated deficit |
(26,524,906 | ) | (8,926,786 | ) | (35,451,692 | ) | ||||||
| Total shareholders’ deficit |
(24,847,259 | ) | (8,926,786 | ) | (33,774,045 | ) | ||||||
| Total liabilities and shareholders’ deficit |
$ | 68,180,986 | $ | (8,926,786 | ) | $ | 59,254,200 | |||||
62
Table of Contents
Index to Financial Statements
The Money Tree Inc. and Subsidiaries
Notes to Consolidated Financial Statements
NOTE 18 – RESTATEMENT OF PREVIOUSLY ISSUED FINANCIAL STATEMENTS (CONTINUED)
| As of September 25, 2008 |
As reported | Adjustment | As restated | |||||||||
| Assets |
||||||||||||
| Cash and cash equivalents |
$ | 12,541,302 | $ | — | $ | 12,541,302 | ||||||
| Finance receivables, net |
67,730,473 | (7,942,889 | ) | 59,787,584 | ||||||||
| Other receivables |
956,752 | — | 956,752 | |||||||||
| Inventory |
3,167,021 | — | 3,167,021 | |||||||||
| Property and equipment, net |
4,906,189 | — | 4,906,189 | |||||||||
| Other assets |
2,498,205 | — | 2,498,205 | |||||||||
| Total assets |
$ | 91,799,942 | $ | (7,942,889 | ) | $ | 83,857,053 | |||||
| Liabilities and Shareholders’ Deficit |
||||||||||||
| Liabilities |
||||||||||||
| Accounts payable and other accrued liabilities |
$ | 3,278,870 | $ | — | $ | 3,278,870 | ||||||
| Accrued interest payable |
14,854,877 | — | 14,854,877 | |||||||||
| Demand notes |
3,658,160 | — | 3,658,160 | |||||||||
| Senior debt |
694,890 | — | 694,890 | |||||||||
| Variable rate subordinated debentures |
82,209,211 | — | 82,209,211 | |||||||||
| Total liabilities |
104,696,008 | — | 104,696,008 | |||||||||
| Commitments and contingencies (see Notes 11 and 14) |
||||||||||||
| Shareholders’ deficit |
||||||||||||
| Common stock: |
||||||||||||
| Class A voting, no par value; 500,000 shares authorized, 2,686 shares issued and outstanding |
1,677,647 | — | 1,677,647 | |||||||||
| Class B non-voting, no par value; 1,500,000 shares authorized, 26,860 shares issued and outstanding |
— | — | — | |||||||||
| Accumulated deficit |
(14,573,713 | ) | (7,942,889 | ) | (22,516,602 | ) | ||||||
| Total shareholders’ deficit |
(12,896,066 | ) | (7,942,889 | ) | (20,838,955 | ) | ||||||
| Total liabilities and shareholders’ deficit |
$ | 91,799,942 | $ | (7,942,889 | ) | $ | 83,857,053 | |||||
63
Table of Contents
Index to Financial Statements
The Money Tree Inc. and Subsidiaries
Notes to Consolidated Financial Statements
NOTE 18 – RESTATEMENT OF PREVIOUSLY ISSUED FINANCIAL STATEMENTS (CONTINUED)
Impacts on the Consolidated Statements of Operations
| Year ended September 25, 2009 |
As reported | Adjustment | As restated | |||||||||
| Interest and fee income |
$ | 15,589,074 | $ | — | $ | 15,589,074 | ||||||
| Interest expense |
(7,611,185 | ) | — | (7,611,185 | ) | |||||||
| Net interest and fee income before provision for credit losses |
7,977,889 | — | 7,977,889 | |||||||||
| Provision for credit losses |
(9,629,722 | ) | (983,897 | ) | (10,613,619 | ) | ||||||
| Net revenue (loss) from interest and fees after provision for credit losses |
(1,651,833 | ) | (983,897 | ) | (2,635,730 | ) | ||||||
| Insurance commissions |
8,354,410 | — | 8,354,410 | |||||||||
| Commissions from motor club memberships from company owned by related parties |
1,601,482 | — | 1,601,482 | |||||||||
| Delinquency fees |
1,561,013 | — | 1,561,013 | |||||||||
| Income tax service agreement income from company owned by related parties |
— | — | — | |||||||||
| Other income |
529,541 | — | 529,541 | |||||||||
| Net revenue before retail sales |
10,394,613 | (983,897 | ) | 9,410,716 | ||||||||
| Retail sales |
16,019,081 | — | 16,019,081 | |||||||||
| Cost of sales |
(10,365,638 | ) | — | (10,365,638 | ) | |||||||
| Gross margin on retail sales |
5,653,443 | — | 5,653,443 | |||||||||
| Net revenues |
16,048,056 | (983,897 | ) | 15,064,159 | ||||||||
| Operating expenses |
||||||||||||
| Personnel expense |
(15,732,538 | ) | — | (15,732,538 | ) | |||||||
| Facilities expense |
(3,981,370 | ) | — | (3,981,370 | ) | |||||||
| General and administrative expenses |
(3,062,752 | ) | — | (3,062,752 | ) | |||||||
| Other operating expenses |
(5,649,625 | ) | — | (5,649,625 | ) | |||||||
| Impairment loss from writedown of goodwill |
— | — | — | |||||||||
| Total operating expenses |
(28,426,285 | ) | — | (28,426,285 | ) | |||||||
| Net operating loss |
(12,378,229 | ) | (983,897 | ) | (13,362,126 | ) | ||||||
| Loss on sale of property and equipment |
(10,497 | ) | — | (10,497 | ) | |||||||
| Loss before income tax benefit (expense) |
(12,388,726 | ) | (983,897 | ) | (13,372,623 | ) | ||||||
| Income tax benefit (expense) |
437,533 | — | 437,533 | |||||||||
| Net loss |
$ | (11,951,193 | ) | $ | (983,897 | ) | $ | (12,935,090 | ) | |||
| Net loss per common share, basic and diluted |
$ | (404.49 | ) | $ | (33.30 | ) | $ | (437.79 | ) | |||
64
Table of Contents
Index to Financial Statements
The Money Tree Inc. and Subsidiaries
Notes to Consolidated Financial Statements
NOTE 18 – RESTATEMENT OF PREVIOUSLY ISSUED FINANCIAL STATEMENTS (CONTINUED)
| Year ended September 25, 2008 |
As reported | Adjustment | As restated | ||||||||
| Interest and fee income |
$ | 19,280,069 | $ | — | $ | 19,280,069 | |||||
| Interest expense |
(8,275,310 | ) | — | (8,275,310 | ) | ||||||
| Net interest and fee income before provision for credit losses |
11,004,759 | — | 11,004,759 | ||||||||
| Provision for credit losses |
(13,812,192 | ) | 769,329 | (13,042,863 | ) | ||||||
| Net revenue (loss) from interest and fees after provision for credit losses |
(2,807,433 | ) | 769,329 | (2,038,104 | ) | ||||||
| Insurance commissions |
9,615,005 | — | 9,615,005 | ||||||||
| Commissions from motor club memberships from company owned by related parties |
1,844,341 | — | 1,844,341 | ||||||||
| Delinquency fees |
1,719,608 | — | 1,719,608 | ||||||||
| Income tax service agreement income from company owned by related parties |
— | — | — | ||||||||
| Other income |
647,406 | — | 647,406 | ||||||||
| Net revenue before retail sales |
11,018,927 | 769,329 | 11,788,256 | ||||||||
| Retail sales |
17,164,407 | — | 17,164,407 | ||||||||
| Cost of sales |
(11,131,463 | ) | — | (11,131,463 | ) | ||||||
| Gross margin on retail sales |
6,032,944 | — | 6,032,944 | ||||||||
| Net revenues |
17,051,871 | 769,329 | 17,821,200 | ||||||||
| Operating expenses |
|||||||||||
| Personnel expense |
(15,530,590 | ) | — | (15,530,590 | ) | ||||||
| Facilities expense |
(3,807,540 | ) | — | (3,807,540 | ) | ||||||
| General and administrative expenses |
(3,287,831 | ) | — | (3,287,831 | ) | ||||||
| Other operating expenses |
(4,852,247 | ) | — | (4,852,247 | ) | ||||||
| Impairment loss from writedown of goodwill |
(991,243 | ) | — | (991,243 | ) | ||||||
| Total operating expenses |
(28,469,451 | ) | — | (28,469,451 | ) | ||||||
| Net operating loss |
(11,417,580 | ) | 769,329 | (10,648,251 | ) | ||||||
| Loss on sale of property and equipment |
(20,980 | ) | — | (20,980 | ) | ||||||
| Loss before income tax benefit (expense) |
(11,438,560 | ) | 769,329 | (10,669,231 | ) | ||||||
| Income tax benefit (expense) |
(527,806 | ) | 1,210,000 | 682,194 | |||||||
| Net loss |
$ | (11,966,366 | ) | $ | 1,979,329 | $ | (9,987,037 | ) | |||
| Net loss per common share, basic and diluted |
$ | (405.01 | ) | $ | 66.99 | $ | (338.02 | ) | |||
65
Table of Contents
Index to Financial Statements
The Money Tree Inc. and Subsidiaries
Notes to Consolidated Financial Statements
NOTE 18 – RESTATEMENT OF PREVIOUSLY ISSUED FINANCIAL STATEMENTS (CONTINUED)
| Year ended September 25, 2007 |
As reported | Adjustment | As restated | |||||||||
| Interest and fee income |
$ | 19,480,740 | $ | — | $ | 19,480,740 | ||||||
| Interest expense |
(8,025,969 | ) | — | (8,025,969 | ) | |||||||
| Net interest and fee income before provision for credit losses |
11,454,771 | — | 11,454,771 | |||||||||
| Provision for credit losses |
(4,982,494 | ) | (2,957,287 | ) | (7,939,781 | ) | ||||||
| Net revenue (loss) from interest and fees after provision for credit losses |
6,472,277 | (2,957,287 | ) | 3,514,990 | ||||||||
| Insurance commissions |
10,120,463 | — | 10,120,463 | |||||||||
| Commissions from motor club memberships from company owned by related parties |
1,946,476 | — | 1,946,476 | |||||||||
| Delinquency fees |
1,775,728 | — | 1,775,728 | |||||||||
| Income tax service agreement income from company owned by related parties |
3,310 | — | 3,310 | |||||||||
| Other income |
747,829 | — | 747,829 | |||||||||
| Net revenue before retail sales |
21,066,083 | (2,957,287 | ) | 18,108,796 | ||||||||
| Retail sales |
19,001,858 | — | 19,001,858 | |||||||||
| Cost of sales |
(12,170,317 | ) | — | (12,170,317 | ) | |||||||
| Gross margin on retail sales |
6,831,541 | — | 6,831,541 | |||||||||
| Net revenues |
27,897,624 | (2,957,287 | ) | 24,940,337 | ||||||||
| Operating expenses |
||||||||||||
| Personnel expense |
(15,349,102 | ) | — | (15,349,102 | ) | |||||||
| Facilities expense |
(3,760,048 | ) | — | (3,760,048 | ) | |||||||
| General and administrative expenses |
(3,150,330 | ) | — | (3,150,330 | ) | |||||||
| Other operating expenses |
(4,978,335 | ) | — | (4,978,335 | ) | |||||||
| Impairment loss from writedown of goodwill |
(365,824 | ) | — | (365,824 | ) | |||||||
| Total operating expenses |
(27,603,639 | ) | — | (27,603,639 | ) | |||||||
| Net operating loss |
293,985 | (2,957,287 | ) | (2,663,302 | ) | |||||||
| Loss on sale of property and equipment |
(19,012 | ) | — | (19,012 | ) | |||||||
| Loss before income tax benefit (expense) |
274,973 | (2,957,287 | ) | (2,682,314 | ) | |||||||
| Income tax benefit (expense) |
100,664 | (1,210,000 | ) | (1,109,336 | ) | |||||||
| Net income (loss) |
$ | 375,637 | $ | (4,167,287 | ) | $ | (3,791,650 | ) | ||||
| Net loss per common share, basic and diluted |
$ | 12.71 | $ | (141.04 | ) | $ | (128.33 | ) | ||||
66
Table of Contents
Index to Financial Statements
The Money Tree Inc. and Subsidiaries
Notes to Consolidated Financial Statements
NOTE 18 – RESTATEMENT OF PREVIOUSLY ISSUED FINANCIAL STATEMENTS (CONTINUED)
Impacts on the Consolidated Statements of Cash Flows
| Year ended September 25, 2009 |
As reported | Adjustment | As restated | |||||||||
| Cash flows from operating activities |
||||||||||||
| Net loss |
$ | (11,951,193 | ) | $ | (983,897 | ) | $ | (12,935,090 | ) | |||
| Adjustments to reconcile net loss to net cash provided by (used in) operating activities: |
||||||||||||
| Provision for credit losses |
9,629,722 | 983,897 | 10,613,619 | |||||||||
| Depreciation |
880,119 | — | 880,119 | |||||||||
| Amortization |
4,524 | — | 4,524 | |||||||||
| Impairment loss from write-down of goodwill |
— | — | — | |||||||||
| Deferred income tax expense (benefit) |
— | — | — | |||||||||
| Loss on sale of property and equipment |
10,497 | — | 10,497 | |||||||||
| Loss on sale of finance receivables |
148,063 | — | 148,063 | |||||||||
| Change in assets and liabilities: |
||||||||||||
| Other receivables |
240,091 | — | 240,091 | |||||||||
| Inventory |
965,055 | — | 965,055 | |||||||||
| Other assets |
662,535 | — | 662,535 | |||||||||
| Accounts payable and other accrued liabilities |
(789,601 | ) | — | (789,601 | ) | |||||||
| Accrued interest payable |
(1,391,946 | ) | — | (1,391,946 | ) | |||||||
| Net cash (used in) provided by operating activities |
(1,592,134 | ) | — | (1,592,134 | ) | |||||||
| Cash flows from investing activities |
||||||||||||
| Finance receivables originated |
(58,340,423 | ) | — | (58,340,423 | ) | |||||||
| Finance receivables repaid |
59,934,161 | — | 59,934,161 | |||||||||
| Purchase of property and equipment |
(706,512 | ) | — | (706,512 | ) | |||||||
| Proceeds from sale of property and equipment |
495,530 | — | 495,530 | |||||||||
| Proceeds from sale of finance receivables |
76,069 | — | 76,069 | |||||||||
| Net cash provided by (used in) investing activities |
1,458,825 | — | 1,458,825 | |||||||||
| Cash flows from financing activities |
||||||||||||
| Net proceeds (repayments) on: |
||||||||||||
| Senior debt |
(368,373 | ) | — | (368,373 | ) | |||||||
| Demand notes |
(511,453 | ) | — | (511,453 | ) | |||||||
| Repayments on senior subordinated debt |
— | — | — | |||||||||
| Repayments on junior subordinated debt to related parties |
— | — | — | |||||||||
| Proceeds-variable rate subordinated debentures |
10,028,146 | — | 10,028,146 | |||||||||
| Payments-variable rate subordinated debentures |
(18,634,536 | ) | — | (18,634,536 | ) | |||||||
| Net cash (used in) provided by financing activities |
(9,486,216 | ) | — | (9,486,216 | ) | |||||||
| Net change in cash and cash equivalents |
(9,619,525 | ) | — | (9,619,525 | ) | |||||||
| Cash and cash equivalents, beginning of year |
12,541,302 | — | 12,541,302 | |||||||||
| Cash and cash equivalents, end of year |
$ | 2,921,777 | $ | — | $ | 2,921,777 | ||||||
67
Table of Contents
Index to Financial Statements
The Money Tree Inc. and Subsidiaries
Notes to Consolidated Financial Statements
NOTE 18 – RESTATEMENT OF PREVIOUSLY ISSUED FINANCIAL STATEMENTS (CONTINUED)
| Year ended September 25, 2008 |
As reported | Adjustment | As restated | |||||||||
| Cash flows from operating activities |
||||||||||||
| Net loss |
$ | (11,966,366 | ) | $ | 1,979,329 | $ | (9,987,037 | ) | ||||
| Adjustments to reconcile net loss to net cash provided by (used in) operating activities: |
||||||||||||
| Provision for credit losses |
13,812,192 | (769,329 | ) | 13,042,863 | ||||||||
| Depreciation |
793,776 | — | 793,776 | |||||||||
| Amortization |
5,714 | — | 5,714 | |||||||||
| Impairment loss from write-down of goodwill |
991,243 | — | 991,243 | |||||||||
| Deferred income tax expense (benefit) |
1,210,000 | (1,210,000 | ) | — | ||||||||
| Loss on sale of property and equipment |
20,980 | — | 20,980 | |||||||||
| Loss on sale of finance receivables |
— | — | — | |||||||||
| Change in assets and liabilities: |
||||||||||||
| Other receivables |
(93,396 | ) | — | (93,396 | ) | |||||||
| Inventory |
(110,246 | ) | — | (110,246 | ) | |||||||
| Other assets |
(753,777 | ) | — | (753,777 | ) | |||||||
| Accounts payable and other accrued liabilities |
(741,186 | ) | — | (741,186 | ) | |||||||
| Accrued interest payable |
525,785 | — | 525,785 | |||||||||
| Net cash (used in) provided by operating activities |
3,694,719 | — | 3,694,719 | |||||||||
| Cash flows from investing activities |
||||||||||||
| Finance receivables originated |
(73,335,373 | ) | — | (73,335,373 | ) | |||||||
| Finance receivables repaid |
67,630,531 | — | 67,630,531 | |||||||||
| Purchase of property and equipment |
(1,586,379 | ) | — | (1,586,379 | ) | |||||||
| Proceeds from sale of property and equipment |
85,319 | — | 85,319 | |||||||||
| Proceeds from sale of finance receivables |
— | — | — | |||||||||
| Net cash provided by (used in) investing activities |
(7,205,902 | ) | — | (7,205,902 | ) | |||||||
| Cash flows from financing activities |
||||||||||||
| Net proceeds (repayments) on: |
||||||||||||
| Senior debt |
183,227 | — | 183,227 | |||||||||
| Demand notes |
(2,333,214 | ) | — | (2,333,214 | ) | |||||||
| Repayments on senior subordinated debt |
— | — | — | |||||||||
| Repayments on junior subordinated debt to related parties |
— | — | — | |||||||||
| Proceeds-variable rate subordinated debentures |
15,435,214 | — | 15,435,214 | |||||||||
| Payments-variable rate subordinated debentures |
(15,087,019 | ) | — | (15,087,019 | ) | |||||||
| Net cash (used in) provided by financing activities |
(1,801,792 | ) | — | (1,801,792 | ) | |||||||
| Net change in cash and cash equivalents |
(5,312,975 | ) | — | (5,312,975 | ) | |||||||
| Cash and cash equivalents, beginning of year |
17,854,277 | — | 17,854,277 | |||||||||
| Cash and cash equivalents, end of year |
$ | 12,541,302 | $ | — | $ | 12,541,302 | ||||||
68
Table of Contents
Index to Financial Statements
The Money Tree Inc. and Subsidiaries
Notes to Consolidated Financial Statements
NOTE 18 – RESTATEMENT OF PREVIOUSLY ISSUED FINANCIAL STATEMENTS (CONTINUED)
| Year ended September 25, 2007 |
As reported | Adjustment | As restated | |||||||||
| Cash flows from operating activities |
||||||||||||
| Net income (loss) |
$ | 375,637 | $ | (4,167,287 | ) | $ | (3,791,650 | ) | ||||
| Adjustments to reconcile net income (loss) to net cash provided by (used in) operating activities: |
||||||||||||
| Provision for credit losses |
4,982,494 | 2,957,287 | 7,939,781 | |||||||||
| Depreciation |
794,418 | — | 794,418 | |||||||||
| Amortization |
5,714 | — | 5,714 | |||||||||
| Impairment loss from write-down of goodwill |
365,824 | — | 365,824 | |||||||||
| Deferred income tax expense (benefit) |
(565,000 | ) | 1,210,000 | 645,000 | ||||||||
| Loss on sale of property and equipment |
19,012 | — | 19,012 | |||||||||
| Loss on sale of finance receivables |
— | — | — | |||||||||
| Change in assets and liabilities: |
||||||||||||
| Other receivables |
151,586 | — | 151,586 | |||||||||
| Inventory |
(861,312 | ) | — | (861,312 | ) | |||||||
| Other assets |
360,762 | — | 360,762 | |||||||||
| Accounts payable and other accrued liabilities |
494,778 | — | 494,778 | |||||||||
| Accrued interest payable |
2,747,680 | — | 2,747,680 | |||||||||
| Net cash (used in) provided by operating activities |
8,871,593 | — | 8,871,593 | |||||||||
| Cash flows from investing activities |
||||||||||||
| Finance receivables originated |
(76,942,622 | ) | — | (76,942,622 | ) | |||||||
| Finance receivables repaid |
72,779,841 | — | 72,779,841 | |||||||||
| Purchase of property and equipment |
(1,032,849 | ) | — | (1,032,849 | ) | |||||||
| Proceeds from sale of property and equipment |
580,338 | — | 580,338 | |||||||||
| Proceeds from sale of finance receivables |
— | — | — | |||||||||
| Net cash provided by (used in) investing activities |
(4,615,292 | ) | — | (4,615,292 | ) | |||||||
| Cash flows from financing activities |
||||||||||||
| Net proceeds (repayments) on: |
||||||||||||
| Senior debt |
(156,886 | ) | — | (156,886 | ) | |||||||
| Demand notes |
(2,145,476 | ) | — | (2,145,476 | ) | |||||||
| Repayments on senior subordinated debt |
(600,000 | ) | — | (600,000 | ) | |||||||
| Repayments on junior subordinated debt to related parties |
(370,000 | ) | — | (370,000 | ) | |||||||
| Proceeds-variable rate subordinated debentures |
14,132,396 | — | 14,132,396 | |||||||||
| Payments-variable rate subordinated debentures |
(10,181,582 | ) | — | (10,181,582 | ) | |||||||
| Net cash (used in) provided by financing activities |
678,452 | — | 678,452 | |||||||||
| Net change in cash and cash equivalents |
4,934,753 | — | 4,934,753 | |||||||||
| Cash and cash equivalents, beginning of year |
12,919,524 | — | 12,919,524 | |||||||||
| Cash and cash equivalents, end of year |
$ | 17,854,277 | $ | — | $ | 17,854,277 | ||||||
69
Table of Contents
Index to Financial Statements
The Money Tree Inc. and Subsidiaries
Notes to Consolidated Financial Statements
NOTE 18 – RESTATEMENT OF PREVIOUSLY ISSUED FINANCIAL STATEMENTS (CONTINUED)
Impacts on the Quarterly Consolidated Financial Statements
The Company also restated the quarterly consolidated financial statements for each of the quarters in fiscal years 2009, 2008 and 2007 on the following pages in this annual report on Form 10-K/A, in lieu of separately amending each Form 10-Q for the respective quarters in fiscal years 2009, 2008 and 2007.
70
Table of Contents
Index to Financial Statements
The Money Tree Inc. and Subsidiaries
Notes to Consolidated Financial Statements
NOTE 18 – RESTATEMENT OF PREVIOUSLY ISSUED FINANCIAL STATEMENTS (CONTINUED)
| As reported | Adjustment | As restated | ||||||||||
| As of, or for the three months ended December 25, 2008 |
|
|||||||||||
| Finance receivables, net |
$ | 67,213,838 | $ | (8,384,026 | ) | $ | 58,829,812 | |||||
| Accumulated deficit |
$ | (16,202,577 | ) | $ | (8,384,026 | ) | $ | (24,586,603 | ) | |||
| Provision for credit losses |
$ | (2,234,641 | ) | $ | (441,137 | ) | $ | (2,675,778 | ) | |||
| Net loss |
$ | (1,628,864 | ) | $ | (441,137 | ) | $ | (2,070,001 | ) | |||
| As of March 25, 2009 |
||||||||||||
| Finance receivables, net |
$ | 62,119,371 | $ | (8,700,284 | ) | $ | 53,419,087 | |||||
| Accumulated deficit |
$ | (19,310,290 | ) | $ | (8,700,284 | ) | $ | (28,010,574 | ) | |||
| For the three months ended March 25, 2009 |
||||||||||||
| Provision for credit losses |
$ | (1,898,485 | ) | $ | (316,258 | ) | $ | (2,214,743 | ) | |||
| Net loss |
$ | (3,107,713 | ) | $ | (316,258 | ) | $ | (3,423,971 | ) | |||
| For the six months ended March 25, 2009 |
||||||||||||
| Provision for credit losses |
$ | (4,133,127 | ) | $ | (757,394 | ) | $ | (4,890,521 | ) | |||
| Net loss |
$ | (4,736,577 | ) | $ | (757,394 | ) | $ | (5,493,971 | ) | |||
| As of June 25, 2009 |
||||||||||||
| Finance receivables, net |
$ | 60,369,221 | $ | (8,836,175 | ) | $ | 51,533,046 | |||||
| Accumulated deficit |
$ | (22,554,475 | ) | $ | (8,836,175 | ) | $ | (31,390,650 | ) | |||
| For the three months ended June 25, 2009 |
||||||||||||
| Provision for credit losses |
$ | (2,506,052 | ) | $ | (135,890 | ) | $ | (2,641,942 | ) | |||
| Net loss |
$ | (3,244,185 | ) | $ | (135,890 | ) | $ | (3,380,075 | ) | |||
| For the nine months ended June 25, 2009 |
||||||||||||
| Provision for credit losses |
$ | (6,639,178 | ) | $ | (893,285 | ) | $ | (7,532,463 | ) | |||
| Net loss |
$ | (7,980,762 | ) | $ | (893,285 | ) | $ | (8,874,047 | ) | |||
| As of September 25, 2009 |
||||||||||||
| Finance receivables, net |
$ | 56,282,881 | $ | (8,926,786 | ) | $ | 47,356,095 | |||||
| Accumulated deficit |
$ | (26,524,906 | ) | $ | (8,926,786 | ) | $ | (35,451,692 | ) | |||
| For the three months ended September 25, 2009 |
||||||||||||
| Provision for credit losses |
$ | (2,990,544 | ) | $ | (90,612 | ) | $ | (3,081,156 | ) | |||
| Net loss |
$ | (3,970,431 | ) | $ | (90,612 | ) | $ | (4,061,043 | ) | |||
| For the year ended September 25, 2009 |
||||||||||||
| Provision for credit losses |
$ | (9,629,722 | ) | $ | (983,897 | ) | $ | (10,613,619 | ) | |||
| Net loss |
$ | (11,951,193 | ) | $ | (983,897 | ) | $ | (12,935,090 | ) | |||
71
Table of Contents
Index to Financial Statements
The Money Tree Inc. and Subsidiaries
Notes to Consolidated Financial Statements
NOTE 18 – RESTATEMENT OF PREVIOUSLY ISSUED FINANCIAL STATEMENTS (CONTINUED)
| As reported | Adjustment | As restated | ||||||||||
| As of, or for the three months ended December 25, 2007 |
|
|||||||||||
| Finance receivables, net |
$ | 77,421,347 | $ | (8,934,984 | ) | $ | 68,486,363 | |||||
| Accumulated deficit |
$ | (3,187,834 | ) | $ | (8,934,984 | ) | $ | (12,122,818 | ) | |||
| Provision for credit losses |
$ | (2,042,673 | ) | $ | (222,766 | ) | $ | (2,265,439 | ) | |||
| Net loss |
$ | (580,487 | ) | $ | (222,766 | ) | $ | (803,253 | ) | |||
| As of March 25, 2008 |
||||||||||||
| Finance receivables, net |
$ | 73,260,824 | $ | (9,071,185 | ) | $ | 64,189,639 | |||||
| Accumulated deficit |
$ | (5,410,888 | ) | $ | (9,071,185 | ) | $ | (14,482,073 | ) | |||
| For the three months ended March 25, 2008 |
||||||||||||
| Provision for credit losses |
$ | (3,227,625 | ) | $ | (136,201 | ) | $ | (3,363,826 | ) | |||
| Net loss |
$ | (2,223,054 | ) | $ | (136,201 | ) | $ | (2,359,255 | ) | |||
| For the six months ended March 25, 2008 |
||||||||||||
| Provision for credit losses |
$ | (5,270,298 | ) | $ | (358,967 | ) | $ | (5,629,265 | ) | |||
| Net loss |
$ | (2,803,541 | ) | $ | (358,967 | ) | $ | (3,162,508 | ) | |||
| As of June 25, 2008 |
||||||||||||
| Finance receivables, net |
$ | 71,616,173 | $ | (9,375,715 | ) | $ | 62,240,458 | |||||
| Accumulated deficit |
$ | (7,719,021 | ) | $ | (9,375,715 | ) | $ | (17,094,736 | ) | |||
| For the three months ended June 25, 2008 |
||||||||||||
| Provision for credit losses |
$ | (3,612,759 | ) | $ | (304,530 | ) | $ | (3,917,289 | ) | |||
| Net loss |
$ | (2,308,133 | ) | $ | (304,530 | ) | $ | (2,612,663 | ) | |||
| For the nine months ended June 25, 2008 |
||||||||||||
| Provision for credit losses |
$ | (8,883,057 | ) | $ | (663,497 | ) | $ | (9,546,554 | ) | |||
| Net loss |
$ | (5,111,674 | ) | $ | (663,497 | ) | $ | (5,775,171 | ) | |||
| As of September 25, 2008 |
||||||||||||
| Finance receivables, net |
$ | 67,730,473 | $ | (7,942,889 | ) | $ | 59,787,584 | |||||
| Accumulated deficit |
$ | (14,573,713 | ) | $ | (7,942,889 | ) | $ | (22,516,602 | ) | |||
| For the three months ended September 25, 2008 |
||||||||||||
| Provision for credit losses |
$ | (4,929,135 | ) | $ | 1,432,826 | $ | (3,496,309 | ) | ||||
| Income tax benefit (expense) |
$ | (431,112 | ) | $ | 1,210,000 | $ | 778,888 | |||||
| Net loss |
$ | (6,854,692 | ) | $ | 2,642,826 | $ | (4,211,866 | ) | ||||
| For the year ended September 25, 2008 |
||||||||||||
| Provision for credit losses |
$ | (13,812,192 | ) | $ | 769,329 | $ | (13,042,863 | ) | ||||
| Income tax benefit (expense) |
$ | (527,806 | ) | $ | 1,210,000 | $ | 682,194 | |||||
| Net loss |
$ | (11,966,366 | ) | $ | 1,979,329 | $ | (9,987,037 | ) | ||||
72
Table of Contents
Index to Financial Statements
The Money Tree Inc. and Subsidiaries
Notes to Consolidated Financial Statements
NOTE 18 – RESTATEMENT OF PREVIOUSLY ISSUED FINANCIAL STATEMENTS (CONTINUED)
| As reported | Adjustment | As restated | ||||||||||
| As of, or for the three months ended December 25, 2006 |
|
|||||||||||
| Finance receivables, net |
$ | 78,156,778 | $ | (6,570,535 | ) | $ | 71,586,243 | |||||
| Accumulated deficit |
$ | (2,598,312 | ) | $ | (6,570,535 | ) | $ | (9,168,847 | ) | |||
| Provision for credit losses |
$ | (1,126,703 | ) | $ | (815,604 | ) | $ | (1,942,307 | ) | |||
| Net income (loss) |
$ | 384,672 | $ | (815,604 | ) | $ | (430,932 | ) | ||||
| As of March 25, 2007 |
||||||||||||
| Finance receivables, net |
$ | 75,127,081 | $ | (7,248,753 | ) | $ | 67,878,328 | |||||
| Accumulated deficit |
$ | (2,321,208 | ) | $ | (7,248,753 | ) | $ | (9,569,961 | ) | |||
| For the three months ended March 25, 2007 |
||||||||||||
| Provision for credit losses |
$ | (955,897 | ) | $ | (678,218 | ) | $ | (1,634,115 | ) | |||
| Net income |
$ | 277,105 | $ | 678,218 | $ | 955,323 | ||||||
| For the six months ended March 25, 2007 |
||||||||||||
| Provision for credit losses |
$ | (2,082,599 | ) | $ | (1,493,822 | ) | $ | (3,576,421 | ) | |||
| Net income (loss) |
$ | 661,776 | $ | (1,493,822 | ) | $ | (832,046 | ) | ||||
| As of June 25, 2007 |
||||||||||||
| Finance receivables, net |
$ | 75,961,077 | $ | (8,194,693 | ) | $ | 67,766,384 | |||||
| Accumulated deficit |
$ | (2,187,755 | ) | $ | (8,194,693 | ) | $ | (10,382,448 | ) | |||
| For the three months ended June 25, 2007 |
||||||||||||
| Provision for credit losses |
$ | (951,326 | ) | $ | (945,940 | ) | $ | (1,897,266 | ) | |||
| Net income (loss) |
$ | 133,452 | $ | (945,940 | ) | $ | (812,488 | ) | ||||
| For the nine months ended June 25, 2007 |
||||||||||||
| Provision for credit losses |
$ | (3,033,926 | ) | $ | (2,439,762 | ) | $ | (5,473,688 | ) | |||
| Net income (loss) |
$ | 795,229 | $ | (2,439,762 | ) | $ | (1,644,533 | ) | ||||
| As of September 25, 2007 |
||||||||||||
| Finance receivables, net |
$ | 75,837,823 | $ | (8,712,218 | ) | $ | 67,125,605 | |||||
| Deferred tax assets |
$ | 1,210,000 | $ | (1,210,000 | ) | $ | — | |||||
| Accumulated deficit |
$ | (2,607,347 | ) | $ | (9,922,218 | ) | $ | (12,529,565 | ) | |||
| For the three months ended September 25, 2007 |
||||||||||||
| Provision for credit losses |
$ | (1,948,568 | ) | $ | (517,525 | ) | $ | (2,466,093 | ) | |||
| Income tax benefit (expense) |
$ | 517,270 | $ | (1,210,000 | ) | $ | (692,730 | ) | ||||
| Net income (loss) |
$ | (419,592 | ) | $ | (3,372,058 | ) | $ | (3,791,650 | ) | |||
| For the year ended September 25, 2007 |
||||||||||||
| Provision for credit losses |
$ | (4,982,494 | ) | $ | (2,957,287 | ) | $ | (7,939,781 | ) | |||
| Income tax benefit (expense) |
$ | 100,664 | $ | (1,210,000 | ) | $ | (1,109,336 | ) | ||||
| Net income (loss) |
$ | 375,637 | $ | (4,167,287 | ) | $ | (3,791,650 | ) | ||||
73
Table of Contents
Index to Financial Statements
Management’s Report on Internal Control over Financial Reporting
Management of the Company is responsible for establishing and maintaining adequate internal control over financial reporting as such term is defined in Rule 13a-15(f) under the Securities Exchange Act of 1934. The Company’s internal control over financial reporting is designed to provide reasonable assurance regarding the reliability of financial reporting and the preparation of the consolidated financial statements.
Because of its inherent limitations, internal control over financial reporting may not prevent or detect misstatements and even when determined to be effective, can only provide reasonable assurance with respect to financial statement preparation and presentation. Also, projections of any evaluation of effectiveness to future periods are subject to the risk that controls may become inadequate because of changes in conditions, or that the degree of compliance with the policies or procedures may deteriorate.
Management assessed the effectiveness of the Company’s internal control over financial reporting as of September 25, 2009. In making this assessment, management used the criteria set forth in the framework established by the Committee of Sponsoring Organizations of the Treadway Commission (“COSO”) in Internal Control – Integrated Framework. Based on such assessment, management concluded that as of September 25, 2009, the Company’s internal control over financial reporting was not effective due to the existence of the material weakness described below. Management also determined that internal control over financial reporting continued to not be effective as of December 25, 2009 due to this material weakness.
A material weakness is a deficiency, or a combination of deficiencies, in internal control over financial reporting, such that there is a reasonable possibility that a material misstatement of the annual or interim financial statements will not be prevented or detected on a timely basis. Management identified the following material weaknesses as of September 25, 2009:
In response to comments from the Securities and Exchange Commission in connection with the review of Post-Effective Amendment No. 2 to Form S-1 Registration Statement (Commission File No. 333-157700) and Post-Effective Amendment No. 2 to Form S-1 Registration Statement (Commission File No. 333-157701) filed on February 18, 2010, the management of the Company concluded that the provision for credit losses was misstated due to the process used to determine the allowance for credit losses in the consumer loan portfolio. The Company historically has used average charge-off rates for its entire consumer loan portfolio to determine the amount of the related allowance for credit losses. However, consumer loans that have become bankrupt accounts inherently have different risk characteristics and terms than other consumer loans and therefore should be analyzed separately. After analyzing its consumer bankruptcy portfolio, the Company has determined that its policy with respect to consumer bankrupt accounts did not sufficiently reserve for loan losses at the time that customers filed for bankruptcy, and thus did not accurately reflect the likelihood that such accounts eventually would be charged off. Accordingly, the Company has revised its policy to utilize a cost recovery approach to income recognition related to bankrupt accounts. Management of the Company has decided that consumer bankrupt accounts should be fully charged off within 30 days after receipt of the notice of bankruptcy filing. Any amounts later collected with respect to such accounts will be treated as recoveries of charge-offs.
To remedy the material weakness identified above, the Company has implemented the following measures including, among other things:
| • | A change in policy requiring consumer finance receivables to be fully charged off within 30 days after receipt of the notice of bankruptcy filing, and |
| • | The development of a plan to identify when segments of our finance receivable portfolio have developed different risk characteristics and terms than other segments and warrant a separate analysis to determine the allowance for credit losses. |
This annual report does not include an attestation report of the Company’s independent registered public accounting firm regarding internal control over financial reporting. Management was not subject to attestation by the Company’s independent registered public accounting firm pursuant to temporary rules of the Securities and Exchange Commission that permit the Company to provide only management’s report in this annual report.
Item 9A. Controls and Procedures
We maintain a set of disclosure controls and procedures designed to ensure that information required to be disclosed by the Company in reports that it files or submits under the Securities Exchange Act of 1934 is recorded, processed, summarized and reported within the time periods specified in Securities and Exchange Commission rules and forms. Under the supervision and with the participation of our management, including our principal executive officer and principal financial officer, we evaluated the effectiveness of the design and operation of our disclosure controls and procedures (as defined in Rule 13a-15(e) and 15d-15(e) under the Securities Exchange Act of 1934 (the “Exchange Act”)).
Based upon that evaluation the principal executive officer and principal financial officer concluded that, as of the end of the period covered by this report our disclosure controls and procedures over financial reporting were not effective to ensure that information required to be disclosed by us in the reports we file or submit under the Exchange Act is recorded, processed, summarized and reported within the time periods specified in applicable rules and forms because of the material weaknesses discussed in Management’s Report on Internal Controls over Financial Reporting.
In light of the material weaknesses described in Management’s Report on Internal Control over Financial Reporting, the Company (1) changed its policy requiring consumer finance receivables to be fully charged off within 30 days after receipt of the notice of bankruptcy filing and (2) developed a plan to identify when segments of our finance receivable portfolio have developed different risk characteristics and terms than other segments and warrant a separate analysis to determine the allowance for credit losses. These procedures were performed to ensure that our net finance receivables, accumulated deficit, provision for credit losses, and net loss in the consolidated financial statements were properly stated. Accordingly, management believes the consolidated financial statements included in this report fairly present, in all material respects, our financial condition, results of operations and cash flows for the periods presented.
Except as noted above, there were no changes in our internal control over financial reporting that occurred during the fourth quarter of our fiscal year ended September 25, 2009 that have materially affected, or are reasonably likely to materially affect, our internal control over financial reporting.
74
Table of Contents
Index to Financial Statements
In light of the material weakness described above we performed additional analyses and other procedures to ensure that our consolidated financial statements included in this Form 10-K/A were prepared in accordance with generally accepted accounting principles (GAAP). These measures included, among other things, a change in policy for determining the loss provision related to our bankrupt consumer accounts. As a result, we concluded that the consolidated financial statements included in this Form 10-K/A present fairly, in all material respects, our financial position, results of operations and cash flows for the periods presented in conformity with GAAP.
The Company is committed to remedying the weakness and is implementing certain remedial measures, including (i) the full charge-off of consumer bankrupt accounts within 30 days after receipt of the notice of bankruptcy filing, and (ii) the reassessment of our existing finance and accounting policies and procedures.
75
Table of Contents
Index to Financial Statements
PART III
| Item 10. | Directors and Executive Officers of the Registrant: |
| Name |
Age | Position with Company | ||
| Jefferey V. Martin |
46 | Director | ||
| Bradley D. Bellville |
43 | President and Chairman of the Board of Directors | ||
| Steven P. Morrison |
51 | Chief Financial Officer | ||
| D. Michael Wallace |
41 | Vice President – Administration | ||
| Clayton Penhallegon |
74 | Second Vice-President – Investments | ||
| Dellhia “Cissie” Franklin |
53 | Vice President – Customer Service | ||
| Karen V. Harrell |
50 | Vice President – Investments | ||
| Jennifer L. Ard |
33 | Corporate Secretary |
Jefferey V. Martin became a member of the Board of Directors in February 2008. Since October, 1998, Mr. Martin has served as a loan approver in our centralized loan approval department. He is the son of our founder, the late Vance R. Martin. For 11 years prior to joining the Company, Mr. Martin worked in quality control in Columbus, Georgia for Pratt & Whitney, a designer, manufacturer and servicer of aircraft engines, industrial gas turbines and space propulsion systems. Mr. Martin attended Columbus Technical Institute.
Bradley D. Bellville became our President in August 2007 and was elected Chairman of the Board of Directors in February 2008. He is responsible for the day-to-day responsibilities of running the Company and its strategic direction. Mr. Bellville previously served as our Vice President from 2005 to August 2007, and Vice President – Operations from 1997 to 2005. For the six years prior to 1997, Mr. Bellville held the positions of regional manager, trainer, collector, and branch manager with us. Mr. Bellville received a Bachelor of Business Administration degree in Marketing from Valdosta State University in 1990. Mr. Bellville is a member of the Keep Decatur County Beautiful Board of Directors and the Bainbridge College Foundation Board of Trustees.
Steven P. Morrison became our Chief Financial Officer in 2006. He previously served as our Controller from 2000 to 2006. From 1997 to 2000, Mr. Morrison served as Atlanta Area Controller of Loomis, Fargo & Co., a national armored car service company, where his duties included management of the accounting functions and supervision of the accounting staff for the Atlanta service area. Mr. Morrison received a Bachelor of Business Administration degree from Georgia State University in 1983.
D. Michael Wallace became our Vice President – Administration in August 2007. In this capacity, his duties include oversight of the entire loan department in all four states. Mr. Wallace previously served as our Assistant Vice President – Administration from December 2005 to August 2007, where his duties included assisting the Vice President with oversight of the operations for all company locations, including collections for all branch offices. He also assisted in managing the tax program operations conducted by Cash Check. For the nine years prior to 2005, Mr. Wallace held positions of regional manager and branch manager with our company.
Clayton Penhallegon became Second Vice President – Investments in 2002. Mr. Penhallegon’s duties include traveling to each branch to ensure compliance with company policy regarding the investment program. Mr. Penhallegon began serving as the Executive Director of the Decatur County United Way in 2001. Mr. Penhallegon was in retirement for the two years prior to his becoming Executive Director of the United Way. From 1972 to 1999, Mr. Penhallegon was Executive Director of Georgia Industries for the Blind in Bainbridge, Georgia, under the State of Georgia Department of Labor and has served on the Board of the National Industries For The Blind. Mr. Penhallegon received a bachelor’s degree in Industrial Engineering from Auburn University in 1959 and a master’s degree in Business Administration from the University of Georgia in 1972. Mr. Penhallegon also holds a Certified Public Manager certificate from the University of Georgia Institute of Government. Mr. Penhallegon is a Past President of the Bainbridge-Decatur County Chamber of Commerce, Bainbridge Rotary Club and Georgia Society of Certified Public Managers and Past Chairman of the Board of the Georgia Society of Certified Public Managers.
76
Table of Contents
Index to Financial Statements
Dellhia “Cissie” Franklin became Vice President – Customer Service in 2002. Her duties include responsibility for all investor contacts and questions, coordination of branch personnel training for investments and oversight of all company advertising. Ms. Franklin previously held the positions of Assistant Vice President – Investments, Loan Approver Assistant and Collector. Her past duties with us have included collections and follow-up of approved loan customers. Ms. Franklin is a Past Assistant Vice President of the Bainbridge Junior Woman’s Club and a past scout leader.
Karen V. Harrell became our Vice President – Investments in March 2007. Ms. Harrell previously served as our Treasurer from 2005 to 2007, and prior to that, Assistant Corporate Secretary from 2001 until December 2005. She is responsible for the oversight of the funds and securities of the company, including the software and administration of securities. Ms. Harrell also serves as our Lease Administrator. From 1992 to 2001, Ms. Harrell served as Executive Secretary to the President and Assistant Treasurer. From 1982 to 1991, Ms. Harrell served as Textile Manager’s Secretary, Industrial Engineering Secretary and Plant Manager’s Secretary at Amoco Fabrics and Fibers Company in Bainbridge, Georgia. During her employment with Amoco, she served as an officer for the Credit Union Board of Directors for two years.
Jennifer L. Ard was appointed Corporate Secretary in 2008. Ms. Ard’s duties include oversight of loan licensing, insurance and banking relationships for the company. Ms. Ard previously held the positions of Assistant Treasurer with us from 2000 to 2001, Treasurer from 2001 to 2004, Assistant Corporate Secretary from 2005 to 2008 and Vice-President – Individual Retirement Accounts from 2004 to 2009. She has been employed by us since 1999 and prior to that time was primarily a college student. Ms. Ard received a Bachelor of Business Administration degree in Management from Valdosta State University in 1999.
The term of office of each officer expires when a successor is elected and qualified. There is no arrangement or understanding between any officer and any other person pursuant to which the officer was selected. Our directors are not compensated by us in their capacity as directors. Each of the above officers also serves on our Policy Board which meets quarterly and creates and implements our policies and procedures and growth plans.
| Item 11. | Executive Compensation: |
COMPENSATION DISCUSSION AND ANALYSIS
This Compensation Discussion and Analysis describes our compensation philosophy and policies for fiscal year 2009 that applied to the executives named below in the Summary Compensation Table (the “Named Executive Officers”). It explains the structure and rationale associated with each material element of each Named Executive Officer’s total compensation, and it provides important context for the more detailed disclosure tables and specific compensation amounts provided following this discussion and analysis.
The following discussion and analysis contains statements regarding future company performance targets and goals. These targets and goals are disclosed in the limited context of our compensation programs and should not be understood to be statements of management’s expectations or estimates of results or other guidance. We specifically caution investors not to apply these statements to other contexts.
Objectives of the Named Executive Officer Compensation Program
The objectives of our executive compensation program are to attract, retain and motivate highly talented executives and to align each executive’s incentives with our annual and long-term objectives. Specifically, our executive compensation program is designed to accomplish the following goals and objectives:
| • | maintain a compensation program that is equitable in our marketplace; |
| • | provide opportunities that integrate pay with the annual and long-term performance goals; |
| • | encourage achievement of strategic objectives; |
| • | recognize and reward individual initiative and achievements; |
| • | maintain an appropriate balance between base salary and short- and long-term incentive opportunity; and |
77
Table of Contents
Index to Financial Statements
| • | allow us to compete for, retain and motivate talented executives critical to our success and consistent with our quality of life philosophy. |
Determining Named Executive Officer Compensation
We are a family-owned business with W. Derek Martin, our former Chairman of the Board of Directors, and his siblings beneficially owning all of the voting common stock. We do not have an official “compensation committee,” or other committee performing compensation-related activities on behalf of the Board of Directors. Until resigning from his position as President in August 2007, only W. Derek Martin determined the compensation of all of the Named Executive Officers. Thereafter, W. Derek Martin continued to determine Bradley D. Bellville’s compensation until Mr. Martin’s resignation from the Board of Directors in February 2008. With the exception of their own compensation, Mr. Bellville and Jefferey V. Martin, current members of our Board of Directors, now determine the compensation of all of the Named Executive Officers, but may on occasion receive information pertaining to compensation-based decisions from other Named Executive Officers. Mr. Bellville determines Jefferey Martin’s compensation and Jefferey Martin determines Mr. Bellville’s compensation.
Our determination and assessments of executive compensation are primarily driven by the following four factors: (1) market data based on the compensation levels, programs and practices of certain other comparable companies for comparable positions, (2) our financial performance, (3) the Named Executive Officer’s performance, and (4) the Named Executive Officer’s tenure. We believe these four factors provide a reasonably measurable assessment of executive performance in light of building value and creating a healthy financial position for us. The comparable companies that we analyze when making compensation decisions, which operate in similar markets with similar target customers, include 1st Franklin Financial Corporation, Pioneer Financial Services, Inc. and World Acceptance Corporation. Each of these comparable companies is regulated by most, if not all, of the same statutes, rules and regulations that affect us. Other comparable companies that we review are CapitalSouth Bancorp, a financial institution in Alabama with net income levels similar to ours, and PAB Bankshares, Inc., a Georgia-based financial institution with branch locations in several of the cities in which we operate. We rely upon our judgment about each individual Named Executive Officer, and not on rigid formulas or short-term changes in business performance, in determining the amount and mix of compensation elements and whether each particular payment or award provides an appropriate incentive and reward for performance that sustains and enhances our long-term growth.
2009 Named Executive Officer Compensation Components
Our executive compensation program consists primarily of base salary and bonuses. The program is complemented with other benefits such as 401(k) matching contributions, commissions, group health insurance, life insurance premiums and medical insurance premiums for all Named Executive Officers, and the provision of a company vehicle, country club memberships, and professional membership dues for certain Named Executive Officers.
Annual Base Salary
We intend to provide our Named Executive Officers with a level of assured cash compensation based on the individual’s position, experience, performance, past and potential contribution to us, and level of responsibility, as well as our overall financial performance. No specific weighting is applied to any one factor considered, and Mr. Bellville and Jefferey Martin used their own judgment and expertise in determining appropriate salaries for 2009 within the parameters of the compensation philosophy. Base salary is one fixed component of our Named Executive Officers’ total direct compensation. With the exception of W. Derek Martin, prior to his resignation, and Mr. Bellville, each Named Executive Officer’s individual performance was reviewed on a yearly basis by Mr. Bellville and the reviews were then discussed between Mr. Bellville and the Named Executive Officers. Prior to his resignation, W. Derek Martin reviewed Mr. Bellville’s annual performance, and as the Sole Director, W. Derek Martin did not receive an annual employment review. Since their appointment to the Board of Directors in February 2008, Mr. Bellville and Jefferey Martin now review on a yearly basis each Named Executive Officer’s individual performance, and the reviews are then discussed between Mr. Bellville and the Named Executive Officers. Mr. Bellville now reviews Jefferey Martin’s performance, and Jefferey Martin now reviews Mr. Bellville’s performance. The outcome of the yearly process is one tool Mr. Bellville and Jefferey Martin utilize in determining appropriate yearly salaries. For fiscal year 2010, the Named Executive Officers’ salaries are as follows:
| Named Executive Officer |
FY 2010 Salary | Percentage Increase / (Decrease) from FY 2009 Salary |
||||
| Bradley D. Bellville |
$ | 243,000 | 2.53 | % | ||
| Steve Morrison |
$ | 94,800 | 7.48 | % | ||
| Natasha J. Wood |
$ | 131,520 | 2.00 | % | ||
| David Hill |
$ | 79,452 | 0.00 | % | ||
| Claud Haynes |
$ | 106,836 | 2.00 | % | ||
78
Table of Contents
Index to Financial Statements
Bonus Awards
In addition to base salary, Named Executive Officers may receive a monthly cash bonus or sales-based commission. Each monthly bonus is determined based on whether the Named Executive Officer meets certain monthly performance goals which may be based on, but are not limited to, cash collection amounts, loan volume, delinquent account reduction and ancillary product sales. Additionally, sales commissions are given, where applicable, for those Named Executive Officers who meet certain sales-based goals. The President of the Company, Bradley D. Bellville, will receive a bonus equal to 1% of the Company’s income before income taxes for fiscal year 2010, if any, as an incentive to return the Company to and maintain profitability. For fiscal year 2009, the bonus awards paid to Named Executive Officers were as follows:
| Named Executive Officer |
Bonus Award | ||
| Bradley D. Bellville |
$ | 7,219 | |
| Steve Morrison |
$ | 1,750 | |
| Natasha J. Wood |
$ | 7,510 | |
| David Hill |
$ | 42,278 | |
| Claud Haynes |
$ | 34,472 | |
The targets used to determine bonus awards include, but are not limited to:
| • | a minimum collection rate of 85% of payments due on finance receivable in a given month, |
| • | increased collections of delinquent contract receivables, |
| • | increased sales of consumer merchandise above a base amount established each year, |
| • | a minimum loan volume of $25,000 for each regional employee, and |
| • | increased gross profit on and turnover of motor vehicle inventories. |
Bonus amounts paid to each Named Executive Employee varied by their specific responsibilities, achievement of goals and personal performance. The Company believes the achievement of goals is necessary to continue operations and to reduce losses or return to profitability; therefore, awarding cash incentives to Named Executive Officers for achieving or exceeding these goals provides the Company with increased cash flows, retail sales and gross profits.
401(k) Plan
We sponsor The Money Tree 401(k) Plan in which all qualified employees may participate. The purpose of the 401(k) plan is to provide participating employees with an opportunity to accumulate capital for their future economic security through their elective deferrals and our contributions. We believe this plan creates a strong incentive for participating employees to remain with us and to prepare for their individual futures. This benefits both employee retention and employee morale.
Perquisites and Other Named Executive Officer Benefits
Perquisites and other executive benefits are a part of our Named Executive Officers’ overall compensation. Our Named Executive Officers are eligible for the same group health insurance plan as is provided to other eligible employees. This group health insurance plan includes medical, dental, vision, prescription drug coverage, basic life insurance and short-term disability. We reimburse Named Executive Officers for their life insurance premiums, and pay for varying amounts of
79
Table of Contents
Index to Financial Statements
medical insurance premiums for all Named Executive Officers. Additionally, company cars are provided to Messrs. Bellville, Hill and Haynes, and we pay monthly country club memberships for Mr. Bellville. Although we reimburse all Named Executive Officers for professional association dues, civic and social club membership dues for networking and entertaining, business-related meals and entertainment, and business-related cellular phone charges, these expenses are also paid on behalf of other employees for business use so we do not consider them personal perquisites.
For information on the incremental cost of these perquisites and other personal benefits, refer to the Summary Compensation Table. We believe the perquisites we provide to our Named Executive Officers are appropriate to ensure our executive compensation remains competitive.
Employment Agreements
We do not have any employment agreements with any of our Named Executive Officers.
Tax and Accounting Considerations
We consider and review the deductibility of executive compensation under Section 162(m) of the Internal Revenue Code (the “Code”), which generally provides that we may not deduct certain compensation of more than $1,000,000 that is paid to certain individuals. We do not have any Named Executive Officers that met this limit during fiscal year 2009.
We are aware of the regulatory developments under Code Section 409A, which was enacted as part of the American Jobs Creation Act of 2004. Section 409A imposes substantial limitations and conditions on non-qualified deferred compensation plans, including certain types of equity compensation and separation pay arrangements. We have amended our compensation arrangements to ensure their full compliance with Section 409A.
Conclusion
We believe our executive compensation program is reasonable and competitive with the compensation paid by other competing institutions of similar size and geographic location. The program is designed to reward managers for strong personal and company performance. Our Board monitors the various guidelines that make up the program and reserves the right to adjust them as necessary to continue to meet our objectives.
Compensation Committee Report
In the absence of a standing “compensation committee,” our Board of Directors reviewed and discussed with management the Compensation Discussion and Analysis for fiscal year 2009 as required by Item 402(b) of Regulation S-K and, based on such review and discussions, determined that the Compensation Discussion and Analysis be included in this prospectus.
The Board of Directors:
Bradley D. Bellville, Chairman
Jefferey V. Martin
80
Table of Contents
Index to Financial Statements
Summary Compensation Table
The following table provides certain summary information concerning the annual and long-term compensation paid or accrued by The Money Tree Inc. and its subsidiaries to or on behalf of our Named Executive Officers.
| Name and Principal Position |
Fiscal Year |
Salary (2) | Bonus (3) | All Other Compensation (4) |
Total | |||||||||
| Bradley D. Bellville, President and Chairman |
2009 2008 |
$ $ |
237,500 226,000 |
$ $ |
7,219 6,662 |
$ $ |
9,501 15,240 |
$ $ |
254,220 247,902 | |||||
| Steve Morrison, Chief Financial Officer |
2009 2008 |
$ $ |
92,050 86,450 |
$ $ |
1,750 4,400 |
|
— — |
$ $ |
93,800 90,850 | |||||
| Natasha J. Wood, General Counsel |
2009 2008 |
$ $ |
130,123 126,243 |
$ $ |
7,510 5,957 |
|
— — |
$ $ |
137,633 132,200 | |||||
| David Hill, General Manager (1) |
2009 2008 |
$ $ |
79,452 77,947 |
$ $ |
42,278 49,049 |
|
— — |
$ $ |
121,730 126,996 | |||||
| Claud Haynes, Operations Manager |
2009 2008 |
$ $ |
104,736 102,058 |
$ $ |
34,472 27,684 |
|
— — |
$ $ |
139,208 129,742 | |||||
| (1) | Mr. Hill is the General Manager of Best Buy Autos of Bainbridge Inc., a subsidiary of The Money Tree of Georgia Inc. |
| (2) | The salary amounts shown are equal to the gross salary amounts that were paid to the Named Executive Officers during fiscal year 2009. As yearly salary increases are given, where appropriate, on the anniversary of the employee’s hire date, the salary reported may include a portion of the Named Executive Officer’s previous annual base salary and his or her current annual base salary. |
| (3) | This amount includes both performance-based bonuses, as detailed in “2009 Named Executive Officer Compensation Components – Bonus Awards,” and commissions paid to Mr. Haynes by Home Furniture Mart Inc., a subsidiary of The Money Tree Inc. |
| (4) | The details of “All Other Compensation” are set forth below: |
All Other Compensation
| Name |
Fiscal Year |
Company Vehicle |
Medical Insurance |
Country Club Membership |
Life Insurance |
Total | |||||||||||
| Bradley D. Bellville |
2009 2008 |
$ $ |
5,300 6,552 |
$ $ |
1,811 6,306 |
$ $ |
1,886 1,800 |
$ $ |
504 582 |
$ $ |
9,501 15,240 | ||||||
| Item 12. | Security Ownership of Certain Beneficial Owners and Management and Related Stockholder Matters: |
After the death of Vance R. Martin, our founder and former Chief Executive Officer, effective as of August 10, 2006, 1,475 shares of voting common stock were transferred from the Vance Rudolph Martin Defective Grantor Trust u/t/a dated December 28, 2005 to the Vance R. Martin Family Trust u/t/a dated September 20, 2005 (the Trust). W. Derek Martin, our
81
Table of Contents
Index to Financial Statements
former sole director and son of Vance R. Martin, serves as the sole trustee of the Trust and, accordingly, has the power to vote the shares held by the Trust. The Estate of Vance R. Martin was transferred ownership of the remaining 1,211 shares of voting common stock, effective as of August 10, 2006. See “Certain Relationships and Related Transactions” and “Risk Factors – We are controlled by the Martin family and do not have any independent board members overseeing our operations.”
| Item 13. | Certain Relationships and Related Transactions: |
Our officers also serve as the officers of certain of our subsidiaries, and our directors also serve as the directors of each of our subsidiaries. We may be subject to various conflicts of interest in our relationship with Mr. Martin and his other business enterprises. The following is a description of transactions and relationships between us, our executive officers and our directors and each of their affiliates.
Bradley D. Bellville, our President and Chairman of the Board of Directors, owns 40% of the outstanding stock of Interstate Motor Club, Inc. and each of Vance R. Martin’s three children, including Jefferey V. Martin, a director, owns 20%. Interstate Motor Club, Inc. pays us a commission for each membership sold pursuant to an Agency Sales Agreement. During the fiscal year ended September 25, 2009, we received $1.6 million in commissions pursuant to the Agency Sales Agreement.
Martin Family Group, LLLP owns the real estate of thirteen branch offices, one used car lot, and our principal executive offices. The estate of our founder and former CEO, Vance R. Martin, is a limited partner of Martin Family Group, LLLP. Our former sole director, W. Derek Martin, is the president of Martin Investments, Inc. which is the managing general partner of Martin Family Group, LLLP. We have entered into lease agreements whereby rent is paid monthly for use of these locations. In addition, Martin Sublease LLC, which is controlled by Martin Investments, Inc., leases, and then subleases to us, another 53 branch office locations and two used car lots for amounts greater than are paid in the underlying leases. This spread is generally used to cover property operating costs or improvements made directly by these entities. In the opinion of management, rates paid for these subleases are comparable to those obtained from third parties.
| Item 14. | Principal Accounting Fees and Services: |
Audit Fees
The aggregate fees billed for professional services rendered in fiscal years 2009 and 2008 by Carr, Riggs & Ingram, LLC for the audit of our annual financial statements and review of our quarterly financial statements were $245,865 and $255,505, respectively.
82
Table of Contents
Index to Financial Statements
PART IV
| Item 15. | Exhibits, Financial Statement Schedules: |
The following documents are filed as exhibits to this annual report.
| Exhibit No. |
Description | |
| 3.1 | Articles of Incorporation of The Money Tree Inc. (filed as Exhibit 3.1 to the Form S-1 Registration Statement of The Money Tree Inc., Commission File No. 333-122531, on February 4, 2005 and incorporated herein by reference) | |
| 3.2 | Amendment to Articles of Incorporation of The Money Tree Inc. (filed as Exhibit 3.2 to the Form S-1 Registration Statement of The Money Tree Inc., Commission File No. 333-122531, on February 4, 2005 and incorporated herein by reference) | |
| 3.3 | Bylaws of The Money Tree Inc, (filed as Exhibit 3.3 to the Form S-1 Registration Statement of The Money Tree Inc., Commission File No. 333-122531, on February 4, 2005 and incorporated herein by reference) | |
| 3.4 | Amendment to the Bylaws of The Money Tree Inc. (filed as exhibit 3.4 to the Form S-1 Registration Statement of The Money Tree Inc., Commission File No. 333-122531, on February 4, 2005 and incorporated herein by reference) | |
| 4.1 | Amended and Restated Indenture between The Money Tree Inc. and U.S. Bank National Association dated September 20, 2005 (filed as exhibit 4.1 to Amendment No. 4 to the Form S-1 Registration Statement of The Money Tree Inc., Commission File No. 333-122531, on September 21, 2005 and incorporated herein by reference) | |
| 4.2 | Form of debenture (included in Exhibit 4.1) | |
| 4.3 | Indenture between The Money Tree Inc. and U.S. National Bank Association dated April 27, 2005 (filed as Exhibit 4.1 to Amendment No. 2 to the Form S-1 Registration Statement of The Money Tree Inc., Commission file No. 333-122533, on June 30, 2005 and incorporated herein by reference) | |
| 4.4 | Form of demand note (included in Exhibit 4.3) | |
| 10.1 | Agency Sales Agreement between The Money Tree Inc. and Interstate Motor Club, Inc. dated December 9, 1994 (filed as Exhibit 10.1 to the Form S-1 Registration Statement of The Money Tree Inc., Commission File No. 333-122531, on February 4, 2005 and incorporated herein by reference) | |
| 10.2 | Service Agreement between The Money Tree of Georgia Inc. and Cash Check Inc. of Ga. dated January 8, 1997 (filed as Exhibit 10.2 to the Form S-1 Registration Statement of The Money Tree Inc., Commission File No. 333-122531, on February 4, 2005 and incorporated herein by reference) | |
| 12 | Statement regarding computation of ratios | |
| 21 | Subsidiaries of The Money Tree Inc. | |
| 31.1 | Certification of Principal Executive Officer pursuant to Section 302 of The Sarbanes-Oxley Act of 2002 | |
| 31.2 | Certification of Principal Financial Officer pursuant to Section 302 of The Sarbanes-Oxley Act of 2002 | |
| 32.1 | Certifications of Chief Executive Officer and Chief Financial Officer pursuant to Section 906 of the Sarbanes-Oxley Act of 2002 | |
83
Table of Contents
Index to Financial Statements
SIGNATURES
Pursuant to the requirements of Section 13 or 15(d) of the Securities Exchange Act of 1934, the registrant has duly caused the report to be signed on its behalf by the undersigned, thereunto duly authorized.
| THE MONEY TREE INC. | ||||||||
| Date: May 26, 2010 | By: | /s/ Bradley D. Bellville | ||||||
| Bradley D. Bellville President | ||||||||
Pursuant to the requirements of the Securities Exchange Act of 1934, this report has been signed below by the following persons on behalf of the registrant and in the capacities and on the dates indicated.
| Date: May 26, 2010 | By: | /s/ Bradley D. Bellville | ||||||
| Bradley D. Bellville President and Chairman of the Board | ||||||||
| Date: May 26, 2010 | By: | /s/ Steven P. Morrison | ||||||
| Steven P. Morrison Chief Financial Officer | ||||||||
| Date: May 26, 2010 | By: | /s/ Jefferey V. Martin | ||||||
| Jefferey V. Martin Director | ||||||||
84