Attached files
Table of Contents
UNITED STATES
SECURITIES AND EXCHANGE COMMISSION
WASHINGTON, DC 20549
Form 10-K
(Mark One)
| x | ANNUAL REPORT PURSUANT TO SECTION 13 OR 15(d) OF THE SECURITIES EXCHANGE ACT OF 1934 |
For the fiscal year ended March 31, 2010
or
| ¨ | TRANSITION REPORT PURSUANT TO SECTION 13 OR 15(d) OF THE SECURITIES EXCHANGE ACT OF 1934 |
For the transition period from to
Commission file number: 0-27188
Accelrys, Inc.
(Exact name of registrant as specified in its charter)
| Delaware | 33-0557266 | |
| (State or other jurisdiction of incorporation or organization) |
(I.R.S. Employer Identification No.) | |
| 10188 Telesis Court, Suite 100, San Diego, California | 92121 | |
| (Address of principal executive offices) | (Zip Code) |
(858) 799-5000
(Registrant’s telephone number, including area code)
Securities registered pursuant to Section 12(b) of the Act:
| Title of Each Class |
Name of Each Exchange on Which Registered | |
| Common Stock, par value $0.0001 per share | NASDAQ Global Market |
Securities registered pursuant to Section 12(g) of the Act:
None
Indicate by check mark if the registrant is a well-known seasoned issuer, as defined in Rule 405 of the Securities Act. Yes ¨ No x
Indicate by check mark if the registrant is not required to file reports pursuant to Section 13 or Section 15(d) of the Act. Yes ¨ No x
Note—checking the box above will not relieve any registrant required to file reports pursuant to Section 13 of 15(d) of the Exchange Act from their obligations under those Sections.
Indicate by check mark whether the registrant (1) has filed all reports required to be filed by Section 13 or 15(d) of the Securities Exchange Act of 1934 during the preceding 12 months (or for such shorter period that the registrant was required to file such reports), and (2) has been subject to such filing requirements for the past 90 days. Yes x No ¨
Indicate by checkmark whether the registrant has submitted electronically and posted on its corporate Web site, if any, every Interactive Data File required to be submitted and posted pursuant to Rule 405 of Regulation S-T (Section 232.405 of this chapter) during the preceding 12 months (or for such shorter period that the registrant was required to submit and post such files). Yes ¨ No ¨
Indicate by check mark if disclosure of delinquent filers pursuant to Item 405 of Regulation S-K (§229.405 of this chapter) is not contained herein, and will not be contained, to the best of the registrant’s knowledge, in definitive proxy or information statements incorporated by reference in Part III of this Form 10-K or any amendment to this Form 10-K. x
Indicate by check mark whether the registrant is a large accelerated filer, an accelerated filer, a non-accelerated filer, or a smaller reporting company. See the definitions of “large accelerated filer,” “accelerated filer” and “smaller reporting company” in Rule 12b-2 of the Exchange Act. (Check one):
| Large accelerated filer ¨ | Accelerated filer x | |
| Non-accelerated filer ¨ | Smaller reporting company ¨ | |
| (Do not check if a smaller reporting company) |
Indicate by check mark whether the registrant is a shell company (as defined in Rule 12b-2 of the Exchange Act). Yes ¨ No x
The aggregate market value of the voting stock held by non-affiliates of the registrant as of September 30, 2009 was $105.5 million (based upon the September 30, 2009 closing price for shares of the registrant’s common stock as reported by the NASDAQ Global Market). Shares of common stock held by each officer, director and holder of 5% or more of the outstanding common stock have been excluded in that such persons may be deemed to be affiliates. This determination of affiliate status is not necessarily a conclusive determination for other purposes.
The number of outstanding shares of the registrant’s common stock, par value $0.0001 per share, as of May 10, 2010 was 27,764,878, net of treasury shares.
DOCUMENTS INCORPORATED BY REFERENCE
Portions of Part II of this Form 10-K and Items 10, 11, 12, 13 and 14 of Part III of this Form 10-K incorporate information by reference from the registrant’s definitive proxy statement filed pursuant to Regulation 14A in connection with the registrant’s 2010 Annual Meeting of Stockholders or an amendment to this Annual Report on Form 10-K to be filed with the Securities and Exchange Commission within 120 days after the close of the fiscal year covered by this annual report.
The Exhibit Index (Item No. 15) lists several documents incorporated by reference.
Table of Contents
FORM 10-K—ANNUAL REPORT
For the Fiscal Year Ended March 31, 2010
Table of Contents
| Page | ||||
| PART I |
||||
| Item 1 | 3 | |||
| Item 1A | 10 | |||
| Item 1B | 24 | |||
| Item 2 | 24 | |||
| Item 3 | 24 | |||
| Item 4 | 25 | |||
| PART II | ||||
| Item 5 | 26 | |||
| Item 6 | 28 | |||
| Item 7 | Management’s Discussion and Analysis of Financial Condition and Results of Operations |
29 | ||
| Item 7A | 41 | |||
| Item 8 | 43 | |||
| Item 9 | Changes in and Disagreements With Accountants on Accounting and Financial Disclosure |
73 | ||
| Item 9A | 73 | |||
| Item 9B | 73 | |||
| PART III | ||||
| Item 10 | 75 | |||
| Item 11 | 75 | |||
| Item 12 | Security Ownership of Certain Beneficial Owners and Management and Related Stockholder Matters |
75 | ||
| Item 13 | Certain Relationships and Related Transactions, and Director Independence |
75 | ||
| Item 14 | 75 | |||
| PART IV | ||||
| Item 15 | 76 | |||
| Signatures | 81 | |||
2
Table of Contents
Forward-Looking Statements
When used anywhere in this Annual Report on Form 10-K (this “Report”), the words “expect”, “believe”, “anticipate”, “estimate”, “intend”, “plan” and similar expressions are intended to identify forward-looking statements. These forward-looking statements may include statements addressing our future financial and operating results. We have based these forward-looking statements on our current expectations about future events. Such statements are subject to certain risks and uncertainties including those related to the execution of our strategic plans, the successful release and acceptance of new products, the demand for new and existing products, additional competition, changes in economic conditions and those described in documents we have filed with the Securities and Exchange Commission (the “SEC”), including this Report in “Management’s Discussion and Analysis of Financial Condition and Results of Operations,” “Risk Factors,” and subsequent reports on Form 10-Q. All forward-looking statements in this document are qualified entirely by the cautionary statements included in this document and such other filings. These risks and uncertainties could cause actual results to differ materially from results expressed or implied by forward-looking statements contained in this document. These forward-looking statements speak only as of the date of this document. We disclaim any undertaking to publicly update or revise any forward-looking statements contained herein to reflect any change in our expectations with regard thereto or any change in events, conditions or circumstances on which any such statement is based.
Unless the context requires otherwise, in this report the terms “we,” “us” and “our” refer to Accelrys, Inc. and its wholly owned or indirect subsidiaries, and their predecessors.
PART I
| Item 1. | Business |
On April 5, 2010, we entered into an Agreement and Plan of Merger and Reorganization (the “Merger Agreement”) with Symyx Technologies, Inc. (“Symyx”) and Alto Merger Sub, Inc., our wholly-owned subsidiary (“Merger Sub”). Pursuant to the terms and subject to the conditions set forth in the Merger Agreement, Merger Sub will merge with and into Symyx, and Symyx will continue as the surviving corporation and as our wholly-owned subsidiary (the “Merger”). Our board of directors and the Symyx board of directors have approved the Merger Agreement and the transactions contemplated thereby.
The completion of the Merger is subject to various conditions, including obtaining the approval of our stockholders and Symyx’s stockholders. See “Pending Merger with Symyx” for a further description of the Merger. The information presented in this Annual Report on Form 10-K does not give effect to the Merger.
Overview
We develop and commercialize scientific business intelligence software and solutions that enable our customers to accelerate the discovery and development of new drugs and materials. Our customers include pharmaceutical, biotechnology and other life science companies, as well as companies that are in the energy, chemicals, aerospace and consumer packaged goods markets. Our software and service solutions are used by our customers’ scientists, biologists, chemists and information technology professionals in order to aggregate, mine, integrate, analyze, simulate, manage and interactively report scientific data. We are headquartered in San Diego, California and were incorporated in Delaware in 1993.
Description of Our Industry
For companies in the pharmaceutical, biotechnology, energy, chemicals, aerospace and consumer packaged goods industries, innovation in the discovery and development of new products and the rapid, cost-effective commercialization of these products can be crucial to success. Companies in these industries invest considerable
3
Table of Contents
resources in technologies that suggest productive new pathways for research projects, increase the efficiency of discovery and development processes, or enable them to maximize the use of scientific data, information and knowledge. One such set of technologies is software and professional services in the area of computation, analysis, informatics, workflow and knowledge management solutions. These solutions allow users to leverage the vast amounts of information stored in both corporate databases and public data sources and, when combined with predictive analysis, help these users make informed scientific and business decisions during the research and development process.
Description of Our Business
We design, develop, market, and support software based solutions that facilitate the discovery and development of new and improved products and processes in the pharmaceutical, biotechnology, energy, chemicals, aerospace and consumer packaged goods industries. Using our solutions, our customers create and obtain real time access to scientific data that enables them to make informed decisions which increase the probability of success of their chosen path. Our software and services are intended to reduce our customers’ product development costs, shorten the time to market for their new product introductions and improve their business processes. Our customers include leading commercial, government and academic organizations. Many of the largest pharmaceutical, biotechnology, chemicals, energy, aerospace and consumer packaged goods companies worldwide use our software. We market our products and services worldwide, principally through our direct sales force, augmented by the use of third-party distributors.
Business Strategy
We believe the combination of our scientific informatics platform and our computer aided design modeling and simulation software and service solutions enables our customers to better utilize their scientific data in order to solve critical business issues throughout their organizations. Our strategy is to continue to increase the use of our scientific informatics platform so that it remains the de facto standard scientific informatics platform in the industries we serve. In order to increase the use of our platform we continue to develop advanced analysis and reporting component collections which operate with our platform in order to extend its capabilities and value to our customers. Our scientific informatics platform is also the basis of many of our service offerings, including offerings which integrate and enhance our customers’ software, thereby further increasing the use and value of our scientific informatics platform. Because our scientific informatics platform is the underlying operating platform for many products in our broad portfolio of computer aided design modeling and simulation software and service solutions, we expect the usage of these products to increase as the usage of our scientific informatics platform increases, thus further increasing our sales and value to our customers. We also intend to market and distribute our solutions to a broader group of users, including scientists, engineers and information technology professionals within our existing customer base, as well as to new customers in other industries. We also partner with other companies who provide scientific software and services in order to ensure that their software and service solutions operate with our scientific informatics platform, further proliferating its use and value to our customers.
Products and Services
The following is a brief description of each of our product lines:
Scientific Informatics Platform. In research and development intensive industries, such as the pharmaceutical, biotechnology, chemicals, energy, aerospace and the consumer packaged goods industry, managing the explosion of scientific data has become a top priority for product line and information technology executives. While these industries are familiar with business intelligence solutions for extracting insight and knowledge from customer data for sales and marketing teams, they have an unmet need for such a solution for their research and development teams. Our scientific informatics platform forms the basis of our scientific business intelligence and innovation offerings. Its open service oriented architecture allows users to aggregate,
4
Table of Contents
integrate, and mine the vast quantities of both structured and unstructured scientific data such as chemical structures, biological sequences, and complex digital images. It also filters, normalizes, and performs statistical analysis on this scientific data and provides interactive visual reports to both scientists and scientific managers. We continue to develop component collections which operate with our scientific informatics platform to offer our customers advanced scientific functions such as image, text and chemical analysis. In addition, our scientific informatics platform provides the underlying platform on which we have built many of our modeling and simulation and informatics solutions, thus delivering a fully integrated experience for our customers. The openness of the scientific informatics platform allows our users to integrate not only Accelrys solutions, but best of breed scientific applications they have built themselves, or solutions they have acquired from academic collaborators or other commercial independent software vendors (“ISVs”). Accelrys has built an ecosystem of scientific innovation by partnering with over 30 ISVs who build scientific and technology solutions based on our scientific informatics platform.
Computer Aided Design Modeling and Simulation Software. Many factors that affect the behavior of a molecule, including activity, bioavailability, toxicity, shelf life and environmental impact, are governed by fundamental properties such as shape, structure and reactivity that are determined at the sub-atomic, molecular, or near-molecular levels. A spectrum of simulation technologies—quantum mechanical simulation, molecular simulation, and mesoscale simulation—predict these properties and help researchers discover new products, sharpen the focus of experimental activities and improve ultimate product performance. We are the leading provider of such computer aided design modeling and simulation software. This software aids our customers in the discovery, development and enhancement of drugs and materials.
We have a broad array of software products based on proprietary and licensed technologies that employ fundamental scientific principles, advanced computer visualization, molecular modeling techniques and computational chemistry. These products allow scientists to perform computations of chemical, biological and materials properties, to simulate, visualize and analyze chemical and biological systems, and to communicate the results to other scientists. Some of our computer aided design modeling and simulation products are used by scientists in the life science industry, primarily by pharmaceutical and biotechnology companies. Our other computer aided design modeling and simulation products are used by scientists in materials sciences industries, such as energy, chemicals, aerospace and consumer packaged goods companies.
We continually enhance our product and service offerings for scientists, computational chemists and biologists, who are the principal users of our computer aided design modeling and simulation products. These offerings for the life science industry are intended to assist our life science customers in the discovery of new drugs and drug candidates. Most of our offerings for our life science customers are available on our Discovery Studio modeling and simulation platform which features open architecture allowing users to “plug and play” best of breed computational solutions from Accelrys, academia, other ISVs or solutions the customers have developed themselves. This open architecture also helps expert modelers to connect and communicate more effectively to the wider research organization. Further, these products assist organizations in capturing, managing, and sharing the critical knowledge developed through modeling and simulation. Our computer aided design modeling and simulation offerings for the materials sciences industries are intended to assist our materials sciences customers in the discovery of new materials or the enhancement of existing materials. Most of our offerings for the materials sciences industries are available on our Materials Studio modeling and simulation platform which enables our customers to apply modeling and simulation capabilities to large and complex systems, and can be accessed from our scientific informatics platform.
Cheminformatics Software. We are a leading provider of software based solutions designed to capture, store, manage, and mine chemical information. Our cheminformatics software is based on standard database architectures such as Oracle® and Microsoft Access®. We provide comprehensive data visualization and analysis software components based on a services oriented architecture enabling users to search, retrieve, and use chemical structures, biological and chemical data, experimental data, and registration information. Many of these tools use industry standard software components and are compliant with applications such as Microsoft Excel®,
5
Table of Contents
allowing chemists to interact with chemical data within familiar productivity tools. We also use this component technology, combined with our scientific informatics platform and our database architectures to build enterprise-wide systems for our clients.
Services. The value of our software is enhanced by robust service offerings that provide a variety of options to our clients and create greater returns on their investments.
Our solutions consulting team delivers integrated scientific solutions and enhances the value of our software products by creating extensions to functionality to address a client’s specific business needs. Our scientific informatics platform is highlighted as one of the primary technologies used in these solutions. The group delivers a range of solutions, from software wrappers that allow customers to run their own algorithms on our scientific informatics platform to enterprise-wide informatics systems that integrate customers’ internal systems with software from many vendors, including Accelrys. The group specializes in deploying systems for use by customers in all scientific domains, from early research through product manufacturing.
Our contract research services team provides solutions to clients’ proprietary business-critical scientific problems. The world-wide client base for this service ranges from those who don’t have expert modeling resources on staff to those who have expert modelers but need to accommodate peaks in resource requirements or to fill a special skill set. We work on a project by project basis, or provide longer term resources that are located at client sites for a year or more. This scientific collaboration enhances our partnerships with our clients and helps them achieve their research goals. Our value is enhanced by the broad set of scientific domain expertise among our staff, our years of experience solving industrial “real-world” application problems, our commitment to maintaining confidentiality and to protecting our clients’ intellectual property, the accessibility we offer to the extensive Accelrys ecosystem, and all of our modeling tools.
Both internally and through our distribution channels, we offer training conducted by staff knowledgeable in both the theory and application of our products. Our implementation and training services ensure that our clients are able to quickly install our products and become expert users of our solutions. We offer onsite training and implementation services, web-based training, and data migration services.
Our support services give customers access to new releases, technical notes, documentation addenda and other support which enables customers to utilize our products more effectively, including access to our technical and scientific support personnel during extended business hours. Technical newsletters and bulletins are sent to customers to keep them informed and to help them with resource allocation and scheduling. To maintain an ongoing understanding of customer requirements, we sponsor scientific symposia and user group meetings throughout the year.
We are committed to providing customers with superior support, including: telephone, e-mail, fax and Internet-based technical support services; training; user group conferences; and targeted contract services involving application of our technology and scientific expertise to particular research needs of customers. We believe that customer service, support and training are part of the successful adoption and utilization of our products.
Customers
Our customer base consists of commercial, governmental and academic organizations, including many of the world’s largest pharmaceutical, biotechnology, energy, chemicals, aerospace and consumer packaged goods companies. Our academic customers have historically used our products for academic research purposes, but we believe our products increasingly may be used as a part of formal university teaching curricula. No single customer accounted for more than 10% of our revenue during any of the three most recently completed fiscal years.
6
Table of Contents
Strategic and Academic Alliances
We have entered into a number of strategic alliances relating to product development, product distribution and joint marketing. We plan to continue to cultivate relationships with academic, governmental and commercial research organizations for purposes of identifying and licensing new technology to use in product development. In addition, we plan to maintain and expand our alliances focusing on the compatibility of our products with databases and database management systems, other computational chemistry and molecular simulation products, and products in related markets such as imaging and clinical informatics. We also intend to continue to enter into integration and joint marketing arrangements with systems integrators and original equipment manufacturer partners.
Sales and Marketing
We market our products and services worldwide. During fiscal year 2010, we generated 46%, 30% and 24% of our revenues from the United States, Europe and the Asia/Pacific region, respectively. Please refer to Note 2 to our consolidated financial statements included elsewhere in this Report for a breakdown of revenues and long-lived assets by geographic region. Our continuing reliance on sales in international markets exposes us to risks attendant to foreign sales, as described more fully in Item 1A of this Report.
We sell our products and services through our direct sales force, telesales and, in some markets, arrangements with distributors. Our direct sales representatives focus on a defined list of customers or cover an assigned geographic territory. These direct sales representatives typically work closely with our pre-sales scientists in order to demonstrate our products and their applicability to various research and development efforts. Our telesales effort is directed at smaller sized commercial accounts and academic institutions. Our distributor relationships primarily exist in the Asia/Pacific region, specifically in Japan, China and Korea, and complement our direct sales force in those markets.
In support of our sales activities, we participate in industry trade shows, publish our own newsletters, place advertisements in other industry publications, publish articles in industrial and scientific publications, conduct direct mail campaigns, sponsor industry conferences and seminars, and maintain a website that contains information about us and our product and service offerings.
Our products, together with the associated product literature, are generally delivered to our customers at the time of placing and processing their order. Our electronic software distribution program allows our customers to download our products over the World Wide Web.
Our customers’ buying habits have historically resulted in a higher concentration of sales in the third quarter of our fiscal year, due to traditionally higher purchasing activity in the month of December in many commercial organizations.
Product Development
Development of our software is focused on expanding product lines, designing enhancements to our core technology and integrating existing and new products into our principal software architecture and platform technology. We intend to offer regular updates to our products and to continue to look for opportunities to expand our existing product suite.
We develop most of our products internally and, during each of the years ended March 31, 2010 and 2009, we incurred product development expenses totaling $15.1 million, and during the year ended March 31, 2008, we incurred product development expenses totaling $17.8 million. We have also licensed products or have otherwise acquired products, or portions of our products, from the open source community, as well as corporate, governmental and academic institutions. These arrangements sometimes involve joint development efforts and
7
Table of Contents
frequently require the payment of royalties by us. The development and royalty obligations, scope of distribution rights, duration and other terms of these arrangements vary depending on the product, the market, resource requirements, the other parties with which we contract and other factors. We intend to continue to license or otherwise acquire technology or products from third parties.
Competitors
We believe our scientific informatics platform is unique, and that the market for the platform is at an early stage, with limited established competition from commercial software vendors. The competition for our scientific informatics platform includes our customers’ own proprietary software, open source software such as Knime, and workflow and data-pipeline applications of smaller commercial software vendors such as Inforsense Ltd.
The markets for our informatics software products and our computer aided design modeling and simulation products for the pharmaceutical and biotechnology industries are mature and intensely competitive, subject to rapid change and significantly affected by new product introductions and other market activities of industry participants. Our competitors offer a variety of products and services to address this market. We believe that the principal competitive factors in this market are product quality, flexibility, ease-of-use, scientific validation and performance, functionality and features, open architecture, quality of support and service, reputation and price. Competition currently comes from open source software, our customers’ internal tools, as well as the following commercial software vendors (listed by product type and competitors that supply such products): other software packages for analysis of chemical and biological data (Symyx Technologies, IDBS); desktop software applications (CambridgeSoft, Tripos), including chemical drawing applications (CambridgeSoft, Symyx Technologies), molecular modeling and analytical data simulation applications (Chemical Computing Group, OpenEye, Schrodinger, Tripos); and firms supplying databases, such as chemical or genomic information databases (Symyx Technologies), and database management systems and information technology (Symyx Technologies, IDBS).
The market for our computer aided design modeling and simulation offerings aimed at the energy, chemicals, aerospace and consumer packaged goods industries is in its early stages with limited and fragmented competition from established software vendors. The industries which these offerings target generally rely on data from experiments, rather than utilizing computer aided design modeling and simulation software to obtain such data. Our limited competition from commercial software vendors in these industries currently comes from smaller competitors such as Gaussian Inc., Atomistix and Scienomics.
Intellectual Property and Other Proprietary Rights
We rely primarily on a combination of copyright, trademark and trade secret laws, confidentiality procedures and contractual provisions to protect our proprietary rights. We also have 17 United States and foreign patents and several pending patent applications. Some of our patents begin to expire as early as 2012. We believe that factors such as the technological and creative skills of our personnel, new product development, frequent product enhancements, name recognition and reliable product maintenance are essential to establishing and maintaining a technological leadership position. There can be no assurance that our means of protecting our proprietary rights in the United States or abroad will be adequate. We seek to protect our software, documentation and other written materials under trade secret and copyright laws, which afford only limited protection. Further, there can be no assurance that our patents will offer any protection or that they will not be challenged, invalidated or circumvented.
Pending Merger with Symyx
On April 5, 2010, we entered into the Merger Agreement with Symyx and Merger Sub, pursuant to which Merger Sub will merge with and into Symyx, and Symyx will continue as the surviving corporation and as our wholly-owned subsidiary. Our board of directors and the Symyx board of directors have each approved the Merger Agreement and the transactions contemplated thereby.
8
Table of Contents
Upon completion of the Merger, by virtue of the Merger and without any action on the part of the holders of any shares of the capital stock of Symyx, each outstanding share of Symyx common stock will be converted into the right to receive 0.7802 shares of our common stock (the “Exchange Ratio”). In addition, upon completion of the Merger: (i) all outstanding options to purchase Symyx common stock will be assumed by us and converted into options to purchase our common stock, in each case appropriately adjusted based on the Exchange Ratio; and (ii) all outstanding restricted stock units representing rights to receive Symyx common stock will vest in full and will entitle the holders thereof to receive shares of our common stock in accordance with the Exchange Ratio. No fractional shares of our common stock will be issued in the Merger. The Merger is intended to qualify as a “reorganization” within the meaning of Section 368(a) of the Internal Revenue Code of 1986, as amended (the “Code”).
The Merger Agreement specifies that, upon completion of the Merger, our board of directors will be reconstituted such that: (i) Steven Goldby, a current director of Symyx, will join Jeffrey Rodek and Larry Ferguson as a Class I director of Accelrys; (ii) Timothy Harkness, a current director of Symyx, will join Max Carnecchia and Christopher Steffen as a Class II director of the Company; and (iii) Chris van Ingen and Bruce Pasternack, current directors of Symyx, will join Ken Coleman and Ricardo Levy as Class III directors of Accelrys. In addition, the Merger Agreement further provides that following the completion of the Merger, Max Carnecchia and Michael Piraino will continue to serve as our President and Chief Executive Officer and Senior Vice President and Chief Financial Officer, respectively.
Completion of the Merger is subject to various customary conditions, including, among other things, the approval of our stockholders and of Symyx’s stockholders of certain actions required for purposes of completing the Merger and the compliance by us and Symyx with our respective obligations under the Merger Agreement.
The Merger Agreement contains customary representations, warranties and covenants, including covenants obligating us and Symyx to continue to conduct our respective businesses in the ordinary course and to cooperate on seeking regulatory approvals and providing access to each other’s information. The Merger Agreement also contains a customary “no solicitation” provision pursuant to which, prior to the completion of the Merger, neither we nor Symyx are permitted to solicit or engage in discussions with any third party regarding another acquisition proposal unless we or they, as applicable, have received an unsolicited bona fide written proposal or offer that the recipient’s board of directors determines is or would reasonably be expected to result in a “Superior Offer”.
The Merger Agreement contains certain termination rights in favor of us and Symyx, including each party’s right to terminate the Merger Agreement under certain circumstances in connection with the other party’s acceptance of a “Superior Offer”. In addition, the Merger Agreement provides that in connection with certain terminations of the Merger Agreement, depending on the circumstances surrounding the termination, one party may be required to pay to the other a termination fee of $7,500,000 or an expense reimbursement of $1,000,000.
The foregoing summary of the Merger Agreement and the Merger does not purport to be complete and is subject to, and qualified in its entirety by, the full text of the Merger Agreement, a copy of which is filed as Exhibit 2.1 to our Current Report on Form 8-K filed with the SEC on April 6, 2010, and the terms of which are incorporated herein by reference.
Employees
As of March 31, 2010, we had 362 full-time employees. None of our employees are covered by collective bargaining agreements. Substantially all of our employees, other than certain of our executive officers and employees with customary employment arrangements within Europe, are at will employees, which means that each employee can terminate his or her relationship with us and we can terminate our relationship with him or her at any time. We offer industry competitive wages and benefits and are committed to maintaining a workplace environment that promotes employee productivity and satisfaction. We believe our relations with our employees are good.
9
Table of Contents
Website Access to SEC Filings
We are subject to the reporting requirements under the Securities Exchange Act of 1934, as amended (the “Exchange Act”). Consequently, we are required to file reports and information with the SEC, including reports on the following forms: annual reports on Form 10-K, quarterly reports on Form 10-Q, current reports on Form 8-K, and amendments to those reports filed or furnished pursuant to Section 13(a) or 15(d) of the Exchange Act. These reports and other information concerning us may be accessed through the SEC’s website at http://www.sec.gov and on our website at www.accelrys.com. Such filings are placed on our website as soon as reasonably practical after they are filed with the SEC. Any information contained in, or that can be accessed through our website, is not incorporated by reference into, nor is it in any way part of, this Form 10-K.
| Item 1A. | Risk Factors |
You should carefully consider the risks described below before investing in our publicly-traded securities. The risks described below are not the only ones facing us. Our business is also subject to the risks that affect many other companies, such as competition, technological obsolescence, labor relations, general economic conditions, geopolitical changes and international operations. Additional risks not currently known to us or that we currently believe are immaterial also may impair our business operations and our liquidity. The risks described below could cause our actual results to differ materially from those contained in the forward-looking statements we have made in this Report, the information incorporated herein by reference and those forward-looking statements we may make from time to time.
Certain Risks Related to Our Marketplace and Environment
Our revenue from the sale of computer aided design modeling and simulation software to the life science discovery research marketplace, which has historically constituted a significant portion of our overall revenue, has been declining over the past several years and may continue to decline in future years. Historically we have derived a significant portion of our revenue from the sale of computer aided design modeling and simulation software to the discovery research departments in pharmaceutical and biotechnology companies. Based on recurring analyses of incoming orders typically conducted by our sales and marketing departments, we estimate that orders for our computer aided design modeling and simulation software for the life science industry declined approximately 11% between fiscal year 2007 and fiscal year 2008, approximately 18% between fiscal year 2008 and 2009, and approximately 16% between fiscal year 2009 and 2010. While there is not a linear correlation between product orders and resulting revenue, we believe that our estimates of decreased product orders ultimately reflect a decline in revenue attributable to sales of our computer aided design modeling and simulation software products. We believe this decline is due to several factors, including industry consolidation, a general reduction in the level of discovery research activity by our customers, increased competition, including competition from open source software, and reductions in profit and related information technology spending by our customers. If such declines continue and we do not increase the revenue we derive from our other product and service offerings, our business could be adversely impacted.
Our ability to sustain or increase revenues will depend upon our success in entering new markets and in deriving additional revenues from our existing customers. Our products are currently used primarily by molecular modeling and simulation specialists in discovery research organizations. One component of our overall business strategy is to derive more revenues from our existing customers by expanding their usage of our products and services. Such strategy would have our customers utilize our scientific informatics platform and our tools and components to leverage vast amounts of information stored in both corporate databases and public data sources in order to make informed scientific and business decisions during the research and development process. In addition, we seek to expand into new markets and new areas within our existing markets by attracting and retaining personnel knowledgeable in these markets, identifying the needs of these markets and developing marketing programs to address these needs. If successfully implemented, these strategies would increase the usage of our software and services by biologists, chemists, engineers and informaticians operating within our existing pharmaceutical and biotechnology customers, as well as by new customers in other industries. However,
10
Table of Contents
if our strategies are not successfully implemented, our products and services may not achieve market acceptance or penetration in targeted new departments within our existing customers or in new industries. As a result, we may incur additional costs and expend additional resources without being able to sustain or increase revenue.
Our focus on offering scientific business intelligence solutions to both existing and new customers and markets may make it more difficult for us to sustain our revenue from the sale of computer aided design modeling and simulation products to the life science discovery research marketplace. Our strategy involves transforming our product and service offerings by utilizing our scientific informatics platform and our tools and components in order to enable our customers to more effectively utilize the vast amounts of information stored in both their databases and public data sources in order to make informed scientific and business decisions during the research and development process. This strategy is intended to lead us to new and different markets and customers, as well as increase the usage of our offerings by existing customers. Executing this strategy will require significant management focus and utilization of resources. Though we intend to continue to dedicate sufficient resources and management focus to our life science computer aided design modeling and simulation products, it is possible that the strategy will result in loss of management focus and resources relating to these existing products and markets, thereby resulting in decreasing revenues from these markets. If these revenues are not offset by increasing revenues from new markets and/or customers, our overall revenues will suffer.
We may be unable to develop strategic relationships with our customers. Our overall business strategy is to expand usage of our products and services by expanding our current customers’ usage of our products and by marketing and distributing our solutions to a broader, more diversified group of biologists, chemists, engineers and informaticians operating throughout our customers’ research and development organizations. A key component of this strategy is to become a preferred provider of scientific software and solutions. Becoming a preferred vendor will require substantial re-training and new skills development within our sales and service personnel and deployment of a successful account-management sales model. We believe that developing strategic relationships with our customers may lead to additional revenue opportunities. However, executing this strategy may require significant expense, and there can be no assurance that any such relationships will develop or that such relationships will produce additional revenue or profit opportunities.
Consolidation within the pharmaceutical and biotechnology industries may continue to lead to fewer potential customers for our products and services. A significant portion of our customer base consists of pharmaceutical and biotechnology companies. Continued consolidation within the pharmaceutical and biotechnology industries may result in fewer customers for our products and services. If one of the parties to a consolidation uses the products or services of our competitors, we may lose existing customers as a result of such consolidation.
Increasing competition and increasing costs within the pharmaceutical and biotechnology industries may affect the demand for our products and services, which may affect our results of operations and financial condition. Our pharmaceutical and biotechnology customers’ demand for our products is impacted by continued demand for their products and by our customers’ research and development costs. Demand for our customers’ products could decline, and prices charged by our customers for their products may decline, as a result of increasing competition, including competition from companies manufacturing generic drugs. In addition, our customers’ expenses could continue to increase as a result of increasing costs of complying with government regulations and other factors. A decrease in demand for our customers’ products, pricing pressures associated with the sales of these products, and additional costs associated with product development could cause our customers to reduce research and development expenditures. Because our products and services depend on such research and development expenditures, our revenues may be significantly reduced.
Health care reform and restrictions on reimbursement may affect the pharmaceutical, biotechnology and industrial chemical companies that purchase or license our products or services, which may affect our results of operations and financial condition. The continuing efforts of government and third-party payers in the markets we serve to contain or reduce the cost of health care may reduce the profitability of pharmaceutical,
11
Table of Contents
biotechnology and industrial chemical companies causing them to reduce research and development expenditures. Because our products and services depend on such research and development expenditures, our revenues may be significantly reduced. We cannot predict what actions federal, state or private payers for health care goods and services may take in response to any health care reform proposals or legislation.
We face strong competition in the life science market for computer aided design modeling and simulation software and for cheminformatics products. The market for our computer aided design modeling and simulation software products for the life science market is intensely competitive. We currently face competition from other scientific software providers, larger technology and solutions companies, in-house development by our customers, as well as academic and government institutions and the open source community.
Some of our competitors and potential competitors in this sector have longer operating histories than we do and could have greater financial, technical, marketing, research and development and other resources. Many of our competitors offer products and services directed at more specific markets than those we target, enabling these competitors to focus a greater proportion of their efforts and resources on these markets. Some offerings that compete with our products are developed and made available at lower cost by government organizations and academic institutions, and these entities may be able to devote substantial resources to product development and also offer their products to users for little or no charge. We also face competition from open source software initiatives, in which developers provide software and intellectual property free over the Internet. In addition, many of our customers spend significant internal resources in order to develop their own software. Moreover, we intend to leverage our scientific informatics platform in order to enable our customers to more effectively utilize the vast amounts of information stored in both their databases and public data sources in order to make informed scientific and business decisions during the research and development process. This strategy could lead to competition from much larger companies which provide general data storage and management software.
There can be no assurance that our current or potential competitors will not develop products, services or technologies that are comparable to, superior to, or render obsolete, the products, services and technologies we offer. There can be no assurance that our competitors will not adapt more quickly than us to technological advances and customer demands, thereby increasing such competitors’ market share relative to ours. Any material decrease in demand for our technologies or services may have a material adverse effect on our business, financial condition and results of operations.
We are subject to pricing pressures in some of the markets we serve. The market for computer aided design modeling and simulation products for the life science industry is intensely competitive, which has led to significant pricing pressure and declines in average selling price over the past several years. Based on recurring analyses of incoming orders typically conducted by our sales and marketing departments, we estimate that the average sales price of our computer aided design modeling and simulation products for the life science industry declined approximately 6% between fiscal year 2007 and fiscal year 2008, approximately 10% between fiscal year 2008 and fiscal year 2009, and approximately 14% between fiscal year 2009 and fiscal year 2010. While there is not a linear correlation between our product pricing and competition in the marketplace, we believe that our estimates of decreased prices ultimately reflect increased competition that has led and may continue to lead to pricing pressure with respect to sales of these products. In response to such increased competition and general adverse economic conditions in this market, we may be required to further modify our pricing practices. Changes in our pricing model could adversely affect our revenue and earnings.
Our operations may be interrupted by the occurrence of a natural disaster or other catastrophic event at our primary facilities. Our research and development operations and administrative functions are primarily conducted at our facilities in San Diego, California, and Cambridge, United Kingdom. We also conduct sales and customer support activities at our facilities in Burlington, Massachusetts, Paris, France, and Tokyo, Japan. Although we have contingency plans in effect for natural disasters or other catastrophic events, the occurrence of such events could still disrupt our operations. For example, our San Diego and Tokyo facilities are located in areas that are particularly susceptible to earthquakes. Any natural disaster or catastrophic event in our facilities or the areas in which they are located could have a significant negative impact on our operations.
12
Table of Contents
Our insurance coverage may not be sufficient to avoid material impact on our financial position or results of operations resulting from claims or liabilities against us, and we may not be able to obtain insurance coverage in the future. We maintain insurance coverage for protection against many risks of liability. The extent of our insurance coverage is under continuous review and is modified as we deem it necessary. Despite this insurance, it is possible that claims or liabilities against us may have a material adverse impact on our financial position or results of operations. In addition, we may not be able to obtain any insurance coverage, or adequate insurance coverage, when our existing insurance coverage expires. For example, we do not carry earthquake insurance for our facilities in Tokyo, Japan or San Diego, California, because we do not believe the costs of such insurance are reasonable in relation to the potential risk.
Certain Risks Related to Our Operations
Defects or malfunctions in our products could hurt our reputation among our customers, result in delayed or lost revenue and expose us to liability. Our business and the level of customer acceptance of our products depend upon the continuous, effective and reliable operation of our software and related tools and functions. To the extent that defects cause our software to malfunction and our customers’ use of our products is interrupted, our reputation could suffer and our revenue could decline or be delayed while such defects are remedied. We may also be subject to liability for the defects and malfunctions of third-party technology partners and others with whom our products and services are integrated.
Delays in the release of new or enhanced products or services or undetected errors in our products or services may result in increased cost to us, delayed market acceptance of our products and delayed or lost revenue. To achieve market acceptance, new or enhanced products or services can require long development and testing periods, which may result in delays in scheduled introduction. Any delays in the release schedule for new or enhanced products or services may delay market acceptance of these products or services and may result in delays in new customer orders for these new or enhanced products or services or the loss of customer orders. In addition, new or enhanced products or services may contain a number of undetected errors or “bugs” when they are first released. Although we test each new or enhanced software product or service before it is released to the market, there can be no assurance that significant errors will not be found in existing or future releases. As a result, in the months following the introduction of certain releases, we may need to devote significant resources to correct these errors. There can be no assurance, however, that all of these errors can be corrected.
We are subject to risks associated with the operation of a global business. We derive a significant portion of our total revenue from our operations in international markets. In 2010, 2009 and 2008, 54%, 52% and 51%, respectively, of our total revenue was derived from our international operations. Our global business may be affected by local economic conditions, including inflation, recession and currency exchange rate fluctuations. In addition, political and economic changes throughout the world may interfere with our or our customers’ activities in particular locations and result in a material adverse effect on our business, financial condition and operating results. We anticipate that revenue from operations in international markets will continue to account for a significant percentage of future revenue. The following table depicts our region-specific revenue as a percent of total revenue for each of the last three fiscal years:
| Years Ended | |||||||||
| Region |
March 31, 2010 |
March 31, 2009 |
March 31, 2008 |
||||||
| U.S. |
46 | % | 48 | % | 49 | % | |||
| Europe |
30 | % | 28 | % | 29 | % | |||
| Asia-Pacific |
24 | % | 24 | % | 22 | % | |||
Other potential risks inherent in our international business include:
| • | unexpected changes in regulatory requirements; |
| • | longer payment cycles; |
13
Table of Contents
| • | currency exchange rate fluctuations; |
| • | import and export license requirements; |
| • | tariffs and other barriers; |
| • | political unrest, terrorism and economic instability; |
| • | disruption of our operations due to local labor conditions; |
| • | limited intellectual property protection; |
| • | difficulties in collecting trade receivables; |
| • | difficulties in managing distributors or representatives; |
| • | difficulties in managing an organization spread over various countries; |
| • | difficulties in staffing foreign subsidiary or joint venture operations; and |
| • | potentially adverse tax consequences. |
Our success depends, in part, on our ability to anticipate and address these risks. There can be no assurance that we will do so effectively, or that these or other factors relating to our international operations will not adversely affect our business or operating results.
In order to improve our financial position, we have reduced our headcount, which could negatively impact our business. We have undergone several reductions-in-force over the past several years, and our workforce has declined approximately 25% since March 31, 2006. We do not believe that these reductions have had a material adverse effect on our operations or our ability to generate revenue to date. However, while we believe we have sufficient staff to operate our business, we do not have duplicative or redundant resources in many of our functions or operations. As a result, there can be no assurance that further attrition will not impact our ability to operate our business, or adversely impact our revenues.
Failure to attract and retain skilled personnel, could have a material adverse effect on us. Our success depends in part on the continued service of key scientific, sales, business development, marketing, engineering, management and accounting personnel and our ability to identify, hire and retain additional personnel. There is intense competition for qualified personnel. Immigration laws may further restrict our ability to attract or hire qualified personnel. We may not be able to continue to attract and retain the personnel necessary for the development of our business. Failure to attract and retain key personnel could have a material adverse effect on our business, financial condition and results of operations. Further, we are highly dependent on the principal members of our technical, scientific and management staff. One or more of these key employees could retire or otherwise leave our employ within the foreseeable future, and the loss of any of these people could have a material adverse effect on our business, financial condition or results of operations. We do not intend to maintain key person life insurance on the life of any employee.
Continued turmoil in the worldwide financial markets may negatively impact our business, results of operations, and financial condition. As widely reported, financial markets in the United States, Europe and Asia have been experiencing extreme disruption in recent months, including, among other things, extreme volatility in security prices, declining valuations of certain investments, severely diminished liquidity and credit availability, the failure or sale of various financial institutions and an unprecedented level of government intervention. Many economists believe that the United States economy, and possibly the global economy, is in the midst of a prolonged recession. This protracted downturn may hurt our business in a number of ways, including through general decreases in spending and the adverse impact on our customers’ ability to obtain financing, which may lead to delays or failures in our signing customer agreements or signing customer agreements at reduced purchase levels. While we are unable to predict the likely duration and severity of the current disruption in the financial markets and the adverse economic conditions in the U.S. and other countries, any of the circumstances mentioned above could have a material adverse effect on our revenues, financial condition and results of operations
14
Table of Contents
If we choose to acquire businesses, products or technologies instead of developing them ourselves, we may be unable to complete these acquisitions or to successfully integrate an acquired business or technology in a cost-effective and non-disruptive manner. From time to time, we may choose to acquire businesses, products or technologies instead of developing them ourselves. We do not know if we will be able to complete any acquisitions, or whether we will be able to successfully integrate any acquired businesses, operate them profitably or retain their key employees. Integrating any business, product or technology we acquire could be expensive and time-consuming, disrupt our ongoing business and distract company management. In addition, in order to finance any acquisition, we may utilize our existing funds, thereby lowering the amount of funds we currently have, or might need to raise additional funds through public or private equity or debt financings. Prolonged tightening of the financial markets may impact our ability to obtain financing to fund future acquisitions and we could be forced to obtain financing on less than favorable terms. Additionally, equity financings may result in dilution to our stockholders. If we are unable to integrate any acquired entities, products or technologies effectively, our business could suffer. In addition, under certain circumstances, amortization of assets or charges resulting from the costs of acquisitions could harm our business, financial condition, or operating results.
Certain Risks Related To Our Financial Performance
We have a history of losses and our future profitability is uncertain. We generated net losses for the years ended March 31, 2007 and 2006. Although we generated net income for the years ended March 31, 2010, 2009 and 2008, we may experience future net losses which may limit our ability to fund our operations and we may not generate income from operations in the future. Our future profitability depends upon many factors, including several that are beyond our control. These factors include without limitation:
| • | changes in the demand for our products and services; |
| • | the introduction of competitive software; |
| • | our ability to license desirable technologies; |
| • | changes in the research and development budgets of our customers and potential customers; |
| • | our ability to successfully, cost effectively and timely develop, introduce and market new products, services and product enhancements; and |
| • | the acquisition of any new entities or businesses which may have a dilutive effect upon our earnings. |
Our sales forecast and/or revenue projections may not be accurate. We use a “pipeline” system, a common industry practice, to forecast sales and trends in our business. Our sales personnel monitor the status of proposals, including the date when they estimate a customer will make a purchase decision and the potential size of the order. We aggregate these estimates on a quarterly basis in order to generate a sales pipeline. While the pipeline process provides us with some guidance in business planning and forecasting, it is based on estimates only and is therefore subject to risks and uncertainties. Any variation in the conversion of the pipeline into revenue or the pipeline itself could cause us to improperly plan or budget and thereby adversely affect our business, results of operations and financial condition.
If we are unable to license software to, or collect receivables from, our customers our operating results may be adversely affected. While the majority of our current customers are well-established, large pharmaceutical customers and universities, we also provide products and services to smaller biotechnology companies. We have not experienced significant customer defaults during the past three fiscal years. Our financial success depends upon the creditworthiness and ultimate collection of amounts due from our customers, including our smaller customers with fewer financial resources. If we are not able to collect from our customers, we may be required to write-off significant accounts receivable and recognize bad debt expenses which could materially and adversely affect our operating results.
15
Table of Contents
Our quarterly operating results, particularly our quarterly cash flows, may fluctuate. Quarterly operating results may fluctuate as a result of a number of factors, including lengthy sales cycles, market acceptance of new products and upgrades, timing of new product introductions, changes in pricing policies, changes in general economic and competitive conditions, and the timing and integration of acquisitions. We may also experience fluctuations in quarterly operating results due to general and industry specific economic conditions that may affect the research and development expenditures of pharmaceutical and biotechnology companies. In particular, historically we have received approximately two-thirds of our annual customer orders in the second half of our fiscal year. In accordance with our revenue recognition policies, the revenue associated with these orders is generally recognized over the contractual license term. Therefore, because we accrue sales commissions and royalties upon the receipt of customer orders, we generally experience an increase in operating costs and expenses during the second half of our fiscal year with only a minimal corresponding incremental increase in revenue. Additionally, our cash flows from operations have historically been positive in the fiscal quarter ended March 31 as we collect the accounts receivable generated from these customer orders, while we have historically experienced negative cash flows from operations in the other three fiscal quarters. As a result of these seasonal variations, we believe that quarter-to-quarter comparisons of our operating results are not a good indication of our future performance and that our interim financial results are not necessarily indicative of results for a full year or for any subsequent interim period.
We may be required to indemnify Pharmacopeia Drug Discovery, Inc. (“PDD”), or may not be able to collect on indemnification rights from PDD. On April 30, 2004, we spun-off our drug discovery subsidiary, PDD, into an independent, separately traded, publicly held company through the distribution to our stockholders of a dividend of one share of PDD common stock for every two shares of our common stock. As part of the spin-off, we agreed to indemnify the indebtedness, liabilities and obligations of PDD. One such obligation includes a guarantee by us to the landlord of PDD’s obligations under certain facility leases, with respect to which PDD will indemnify us should we be required to make any payment under the guarantee. These indemnification obligations could be as significant as the remaining future minimum lease payments, which totaled approximately $14.9 million as of March 31, 2010. PDD’s ability to satisfy any such indemnification obligations (including, without limitation, PDD’s commitment to indemnify us in the event of our payment under our guarantee of its leases) will depend upon PDD’s future financial strength. We cannot assure you that, if PDD becomes obligated to indemnify us for any substantial obligations, PDD will have the ability to do so. There also can be no assurance that we will be able to satisfy any indemnification obligations to PDD. Any failure by PDD to satisfy its obligations and any required payment by us could have a material adverse effect on our business.
Enacted and proposed changes in securities laws and regulations have increased our costs and may continue to increase our costs in the future. The Sarbanes-Oxley Act of 2002 (“Sarbanes-Oxley”) required changes in some of our corporate governance and securities disclosure and compliance practices. Under Sarbanes-Oxley, publicly-held companies, including us, are required to, among other things, furnish independent annual audit reports regarding the existence and reliability of their internal control over financial reporting and have their chief executive officer and chief financial officer certify as to the accuracy and completeness of their financial reports.
We expect continued compliance with Sarbanes-Oxley to remain costly. Further, Sarbanes-Oxley and the related SEC and NASDAQ compliance rules may make it more difficult and expensive for us to maintain director and officer liability insurance, and we may be required to accept reduced coverage or incur substantially higher costs to obtain coverage. These laws and regulations could also make it more difficult for us to attract and retain qualified members of our board of directors, or qualified executive officers. We continually evaluate and monitor regulatory developments and cannot estimate the timing or magnitude of additional costs we may incur as a result.
Our business, financial condition and results of operations may be adversely impacted by fluctuations in foreign currency exchange rates. Our international sales generally are denominated in local currencies. Fluctuations in the value of currencies in which we conduct business relative to the United States dollar result in
16
Table of Contents
currency transaction gains and losses, and the impact of future exchange rate fluctuations cannot be accurately predicted. Future fluctuations in currency exchange rates may have a material adverse impact on revenue from international sales, and thus on our business, financial condition and results of operations. When deemed appropriate, we may engage in currency exchange rate hedging transactions in an attempt to mitigate the impact of adverse exchange rate fluctuations. However, currency hedging policies may not be successful, and they may increase the negative impact of exchange rate fluctuations.
If we consume cash more quickly than expected, we may be unable to raise additional capital and we may be forced to curtail operations. We anticipate that our existing capital resources will be adequate to fund our operations for at least the next twelve months. However, our capital requirements will depend on many factors, including the potential acquisition of other businesses or technologies. If we determine that we must raise additional capital, we may attempt to do so through public or private financings involving debt or equity. However, additional capital may not be available on favorable terms, or at all. If adequate funds are not available, we may be required to curtail operations significantly or to obtain funds by entering into arrangements with collaborative partners or others that may require us to relinquish rights to certain of our technologies, products or potential markets that we would not otherwise relinquish.
Negative conditions in the global credit markets may materially impair the value or reduce the liquidity of a portion of our investment portfolio. Recent U.S. sub-prime mortgage defaults have had a significant impact across various sectors of the financial markets, causing global credit and liquidity issues. The short-term funding markets experienced credit issues from the second half of calendar 2007 and through the fourth quarter of calendar 2008, which led to liquidity issues and failed auctions in the auction rate securities (“ARS”) market. If the global credit market continues to deteriorate, the liquidity of our investment portfolio may continue to be impacted.
Included in our marketable securities portfolio at March 31, 2010 were ARS that we purchased for $11.8 million. Under the terms of the agreement (the “ARS Agreement”) that we entered into on November 11, 2008 (the “Acceptance Date”) with one of our investment securities firms (the “Investment Firm”), we have the right to sell our ARS at par value to the Investment Firm between June 30, 2010 and July 2, 2012 and the Investment Firm has the right to purchase the ARS from us any time after the Acceptance Date as long as we receive par value. If the ARS Agreement expires or is otherwise terminated prior to the purchase or sale of the ARS under the terms of the ARS Agreement, or if the Investment Firm is unable to fulfill its obligations under the ARS Agreement, we may have no recourse beyond recovering or retaining the ARS for sale at future auctions. If such future auctions fail and the credit ratings of these investments deteriorate, the fair value of these ARS may decline further and we may incur additional impairment charges in connection with these securities, which would negatively affect our reported earnings, cash flows and financial condition.
Certain Risks Related to Owning Our Stock
We expect that our stock price will fluctuate significantly, and as a result, our stockholders may not be able to resell their shares at or above their original investment price. The stock market, historically and in recent years, has experienced significant volatility particularly with technology company stocks. The volatility of technology company stock prices often does not relate to the operating performance of the companies represented by the stock. Factors that could cause volatility in the price of our common stock include without limitation:
| • | actual and anticipated fluctuations in our quarterly financial and operating results; |
| • | market conditions in the technology and software sectors; |
| • | issuance of new or changed securities analysts’ reports or recommendations; |
| • | developments or disputes concerning our intellectual property or other proprietary rights or other legal claims; |
17
Table of Contents
| • | introduction of technological innovations or new commercial products by us or our competitors; |
| • | market acceptance of our products and services; |
| • | additions or departures of key personnel; and |
| • | the acquisition of new businesses or technologies |
These and other external factors may cause the market price and demand for our common stock to fluctuate substantially, which may limit or prevent investors from readily selling their shares of common stock and may otherwise negatively affect the liquidity of our common stock.
As institutions hold the majority of our common stock in large blocks, substantial sales by these stockholders could depress the market price for our shares. As of April 14, 2010, the top ten institutional holders of our common stock held approximately 44% of our outstanding common stock. As a result, if one or more of these major stockholders were to sell all or a portion of their holdings, or if the market were to perceive that such sale or sales may occur, the market price of our common stock may fall significantly.
Because we do not intend to pay dividends, our stockholders will benefit from an investment in our common stock only if our stock price appreciates in value. We have never declared or paid any cash dividends on our common stock. We currently intend to retain our future earnings, if any, to finance the expansion of our business and do not expect to pay any cash dividends in the foreseeable future. As a result, the success of an investment in our common stock will depend entirely upon any future appreciation in its value. There is no guarantee that our common stock will appreciate in value or even maintain the price at which it was purchased.
Anti-takeover provisions under the Delaware General Corporation Law, provisions in our certificate of incorporation and bylaws, and our adoption of a stockholder rights plan may make the accomplishment of mergers or the assumption of control by a principal stockholder more difficult, thereby making the removal of management more difficult. Certain provisions of the Delaware General Corporation Law may delay or deter attempts to secure control of our company without the consent of our management. Also, our governing documents provide for a staggered board of directors, which will make it more difficult for a potential acquirer to gain control of our board of directors. In 2002, we adopted a stockholder rights plan, which is triggered upon commencement or announcement of a hostile tender offer or when any one person or group acquires 15% or more of our common stock. The rights plan, once triggered, enables our stockholders (other than the stockholder responsible for triggering the rights plan) to purchase our common stock at reduced prices. These provisions of our governing documents and stockholder rights plan, and of Delaware law, could have the effect of delaying, deferring or preventing a change of control, including without limitation a proxy contest, making the acquisition of a substantial block of our common stock more difficult. The provisions could also limit the price that investors might be willing to pay in the future for shares of our common stock. Further, the existence of these anti-takeover measures may cause potential bidders to look elsewhere, rather than initiating acquisition discussions with us.
Certain Risks Related to Intellectual Property
We may not be able to protect adequately the trade secrets and confidential information that we disclose to our employees. We rely upon trade secrets, technical know-how and continuing technological innovation to develop and maintain our competitive position. Competitors through their independent discovery (or improper means, such as unauthorized disclosure or industrial espionage) may come to know our proprietary information. We generally require employees and consultants to execute confidentiality and assignment-of-inventions agreements. These agreements typically provide that all materials and confidential information developed by or made known to the employee or consultant during his, her or its relationship with us are to be kept confidential, and that all inventions arising out of the employee’s or consultant’s relationship with us are our exclusive property. Our employees and consultants may breach these agreements, and in some instances we may not have an adequate remedy. Additionally, in some instances, we may have failed to require that employees and consultants execute confidentiality and assignment-of-inventions agreements.
18
Table of Contents
Foreign laws may not afford us sufficient protections for our intellectual property, and we may not seek patent protection outside the United States. We believe that our success depends, in part, upon our ability to obtain international protection for our intellectual property. However, the laws of some foreign countries may not be as comprehensive as those of the United States and may not be sufficient to protect our proprietary rights abroad. In addition, we generally do not pursue patent protection outside the United States because of cost and confidentiality concerns. Accordingly, our international competitors could obtain foreign patent protection for, and market overseas, products and technologies for which we are seeking patent protection in the United States.
A patent issued to us may not be sufficiently broad to protect adequately our rights in intellectual property to which the patent relates. Due to cost and other considerations, we generally do not rely on patent protection to enforce our intellectual property rights, and have filed only a limited number of patent applications. Even if patents are issued to us, these patents may not sufficiently protect our interest in our software or other technologies because the scope of protection provided by any patents issued to or licensed by us are subject to the uncertainty inherent in patent law. Third parties may be able to design around these patents or develop unique products providing effects similar to our products. In addition, others may discover uses for our software or technologies other than those uses covered in our patents, and these other uses may be separately patentable. A number of pharmaceutical and biotechnology companies, software organizations and research and academic institutions, have developed technologies, filed patent applications or received patents on various technologies that may be related to our business. Some of these technologies, patent applications or patents may conflict with our technologies, patent applications or patents. These conflicts could also limit the scope of patents, if any, that we may be able to obtain, or result in the denial of our patent applications.
We may be subject to claims of infringement by third parties. A number of patents may have been issued or may be issued in the future that could cover certain aspects of our technology or functionality of our products and could prevent us from using technology that we use or expect to use, or making or selling certain of our products. In addition, to the extent our employees are involved in research areas similar to those areas in which they were involved at their former employers, we may inadvertently use or disclose alleged trade secrets or other proprietary information of their former employer. Thus, our products may infringe patent or other intellectual property rights of third parties, and we may be subject to infringement claims by third parties. Any such claims, with or without merit, could be time consuming to defend, result in costly litigation, divert management’s attention and resources, cause product shipment delays or require us to enter into royalty or licensing agreements. Such licenses may not be available on terms acceptable to us, if at all. In the event of a successful claim of product infringement against us, our failure or inability to license or design around the infringed technology could have a material adverse effect on our business, financial condition and results of operations.
Third-party software codes incorporated into our products could subject us to liability or limit our ability to sell such products. Some of our products include software codes licensed from third parties, including the open source community. Some of these licenses impose certain obligations upon us, including royalty and indemnification obligations. In the case of codes licensed from the open source community, the licenses may also limit our ability to sell products containing such code. Though we generally review the applicable licenses prior to incorporating third party code into our software products, there can be no assurance that such third party codes incorporated into our products would not subject us to liability or limit our ability to sell the products containing such code, thereby having a material adverse affect upon our business.
Risks Related to the Merger
Because the Exchange Ratio is fixed and will not be adjusted in the event of changes in the price of either Accelrys’s or Symyx’s common stock, the market value of the shares of Accelrys common stock to be received by the Symyx stockholders in connection with the Merger is subject to change prior to the completion of the Merger. The Exchange Ratio is fixed such that each share of Symyx common stock will be converted into the right to receive 0.7802 shares of Accelrys common stock in connection with the Merger. No adjustments to this Exchange Ratio will be made based on changes in the price of either the Accelrys common stock or Symyx common stock prior to the completion of the Merger. Changes in stock price may result from a variety of factors,
19
Table of Contents
including, among others, general market and economic conditions, changes in Accelrys’s or Symyx’s respective businesses, operations and prospects, market assessment of the likelihood that the Merger will be completed as anticipated or at all and regulatory considerations. Many of these factors are beyond Accelrys’s or Symyx’s control.
As a result of any such changes in stock price, the market value of the shares of Accelrys common stock that the Symyx stockholders will receive at the time that the Merger is completed could vary significantly from the value of such shares on the date of this Report, the dates of the stockholder meetings we and Symyx plan to conduct or the date on which the Symyx stockholders actually receive their shares of Accelrys common stock in connection with the Merger. For example, based on the range of closing prices of Accelrys common stock during the period from April 1, 2010, the last trading day before the public announcement of the Merger, through May 13, 2010, the Exchange Ratio represented a market value ranging from a low of $5.07 to a high of $5.79 for each share of Symyx common stock. Accordingly, at the time of each company’s upcoming stockholder meeting, neither the Accelrys stockholders nor the Symyx stockholders, as the case may be, will know or be able to calculate the exact market value of the consideration the Symyx stockholders will receive upon completion of the Merger.
Changes in the number of shares of outstanding common stock of either Accelrys or Symyx prior to the completion of the Merger would result in a corresponding change to the relative ownership percentages of the current Accelrys stockholders and the current Symyx stockholders of the combined company. Based on the number of shares of Accelrys common stock and Symyx common stock outstanding as of May 13, 2010, if the Merger had been completed on such date, the holders of Symyx common stock would have been entitled to receive shares of Accelrys common stock representing approximately 49.8% of all shares of Accelrys common stock outstanding as of immediately following the completion of the Merger. Accelrys stockholders would have continued to own their existing shares, which would not be affected by the Merger, and such shares would have represented approximately 50.2% of all shares of Accelrys common stock outstanding as of immediately following the completion of the Merger. However, because the Exchange Ratio is fixed, to the extent that the number of shares of outstanding common stock of either Accelrys or Symyx changes prior to the completion of the Merger, whether due to any new issuance of shares of Accelrys common stock or Symyx common stock, any exercise of any outstanding options or other rights to purchase shares of Accelrys common stock or Symyx common stock or otherwise, there will automatically occur a corresponding change in the relative ownership percentages of the current Accelrys stockholders and the current Symyx stockholders of the combined company. Though it is theoretically possible that this change in relative ownership percentages could result in Symyx stockholders holding more than a majority of the outstanding shares of Accelrys common stock following the completion of the Merger, each of Accelrys and Symyx believes that the probability of such outcome is highly unlikely. Accordingly, the disclosure relating to the effects of the Merger assumes that the Symyx stockholders are issued shares of Accelrys common stock representing less than 50% of the combined company upon completion of the Merger.
The announcement and pendency of the Merger could have an adverse effect on Accelrys’s stock price, business, financial condition, results of operations or business prospects. While there have been no significant adverse effects to date, the announcement and pendency of the Merger could disrupt Accelrys’s business in the following ways, among others:
| • | customers and other third-party business partners of Accelrys or Symyx may seek to terminate and/or renegotiate their relationships with Accelrys as a result of the Merger, whether pursuant to the terms of their existing agreements with Accelrys or otherwise; |
| • | the attention of Accelrys management may be directed toward the completion of the Merger and related matters and may be diverted from the day-to-day business operations of their respective companies, including from other opportunities that might otherwise be beneficial to Accelrys; and |
| • | current and prospective employees may experience uncertainty regarding their future roles with the combined company, which might adversely affect Accelrys’s ability to retain, recruit and motivate key personnel. |
20
Table of Contents
Should they occur, any of these matters could adversely affect the stock prices of, or harm the financial condition, results of operations or business prospects of, Accelrys.
Some of the directors and executive officers of Accelrys have interests in the Merger that are different from, or in addition to, those of the other Accelrys stockholders. Certain of the directors and executive officers of Accelrys have arrangements that provide them with interests in the Merger that are different from, or in addition to, those of the stockholders of Accelrys . For instance, in connection with the Merger, each director of the Accelrys board of directors will continue to serve as a director of the combined company following the completion of the Merger. Likewise, Messrs. Carnecchia and Piraino will continue to serve as the President and Chief Executive Officer and the Chief Financial Officer, respectively, of the combined company following the completion of the Merger.
The Merger Agreement contains provisions that could discourage or make it difficult for a third party to acquire Accelrys prior to the completion of the Merger. The Merger Agreement contains provisions that make it difficult for Accelrys to entertain a third-party proposal for an acquisition of Accelrys. These provisions include the general prohibition on Accelrys’s soliciting or engaging in discussions or negotiations regarding any alternative acquisition proposal, the requirement that Accelrys pay a termination fee of $7.5 million to Symyx if the Merger Agreement is terminated in specified circumstances and the requirement that Accelrys submit certain proposals relating to the Merger, to a vote of its stockholders even if the Accelrys board of directors changes its recommendation with respect to such proposals.
These provisions might discourage an otherwise-interested third party from considering or proposing an acquisition of Accelrys, even one that may be deemed of greater value than the Merger to Accelrys stockholders. Furthermore, even if a third party elects to propose an acquisition, the concept of a termination fee may result in that third party’s offering of a lower value to Accelrys stockholders than such third party might otherwise have offered.
Failure to complete the Merger could negatively impact Accelrys’s business, financial condition, results of operations or stock price. The completion of the Merger is subject to a number of conditions and there can be no assurance that the conditions to the completion of the Merger will be satisfied. If the Merger is not completed, Accelrys will be subject to several risks, including:
| • | the current prices of Accelrys common stock may reflect a market assumption that the Merger will occur, meaning that a failure to complete the Merger could result in a decline in the price of the Accelrys common stock ; |
| • | Accelrys , may be required to pay a termination fee of $7.5 million (or reimbursement of expenses of $1 million) to Symyx if the Merger Agreement is terminated under certain circumstances; |
| • | Accelrys is expected to incur substantial transaction costs in connection with the Merger whether or not the Merger is completed; |
| • | Accelrys would not realize any of the anticipated benefits of having completed the Merger; and |
| • | under the Merger Agreement, Accelrys is subject to certain restrictions on the conduct of its business prior to completing the Merger, which restrictions could adversely affect its ability to realize certain of its business strategies. |
If the Merger is not completed, these risks may materialize and materially and adversely affect our business, financial condition, results of operations or stock prices.
Several lawsuits have been filed against Symyx, the members of its board of directors, certain of its executive officers, Accelrys and Merger Sub challenging the Merger, and an adverse judgment in any such lawsuit may prevent the Merger from becoming effective or from becoming effective within the expected timeframe. Symyx, the members of the Symyx board of directors, certain executive officers of Symyx, Accelrys
21
Table of Contents
and Merger Sub have been named as defendants in several purported class action lawsuits brought by individual Symyx stockholders challenging the proposed Merger and seeking, among other things, to enjoin the defendants from completing the Merger pursuant to the terms of the Merger Agreement. These lawsuits have been consolidated into a single action. One of the conditions to the completion of the Merger is that no temporary restraining order, preliminary or permanent injunction or other order preventing the completion of the Merger shall have been issued by any court of competent jurisdiction and be in effect. Consequently, if the plaintiffs are successful in obtaining an injunction prohibiting the parties from completing the Merger pursuant to the terms of the Merger Agreement, such an injunction may prevent the completion of the Merger in the expected timeframe (or altogether).
Obtaining required approvals necessary to satisfy the conditions to the completion of the Merger may delay or prevent completion of the Merger. The completion of the Merger is conditioned upon the receipt of certain governmental authorizations, consents, orders or other approvals. Accelrys and Symyx intend to pursue all required approvals in accordance with the Merger Agreement. Further, no assurance can be given that the required approvals will be obtained and, even if all such approvals are obtained, no assurance can be given as to the terms, conditions and timing of the approvals or that they will satisfy the terms of the Merger Agreement.
Risks Related to the Combined Company if the Merger Is Completed
The failure to integrate successfully the businesses of Accelrys and Symyx in the expected timeframe would adversely affect the combined company’s future results following the completion of the Merger. The success of the Merger will depend, in large part, on the ability of the combined company following the completion of the Merger to realize the anticipated benefits, including annual net operating synergies, from combining the businesses of Accelrys and Symyx. To realize these anticipated benefits, the combined company must successfully integrate the businesses of Accelrys and Symyx. This integration will be complex and time-consuming.
The failure to integrate successfully and to manage successfully the challenges presented by the integration process may result in the combined company’s failure to achieve some or all of the anticipated benefits of the Merger.
Potential difficulties that may be encountered in the integration process include the following:
| • | lost sales and customers as a result of customers of either of the two companies deciding not to do business with the combined company; |
| • | complexities associated with managing the larger, more complex, combined business; |
| • | integrating personnel from the two companies while maintaining focus on providing consistent, high quality products; |
| • | potential unknown liabilities and unforeseen expenses, delays or regulatory conditions associated with the Merger; and |
| • | performance shortfalls at one or both of the companies as a result of the diversion of management’s attention caused by completing the Merger and integrating the companies’ operations. |
The combined company’s future results will suffer if the combined company does not effectively manage its expanded operations following the Merger. Following the Merger, the size of the combined company’s business will be significantly larger than the current businesses of Accelrys and Symyx. The combined company’s future success depends, in part, upon its ability to manage this expanded business, which will pose substantial challenges for the combined company’s management, including challenges related to the management and monitoring of new operations and associated increased costs and complexity. Neither Accelrys nor Symyx can assure you that the combined company will be successful or that the combined company will realize the expected operating efficiencies, annual net operating synergies, revenue enhancements and other benefits currently anticipated to result from the Merger.
22
Table of Contents
The Merger may not be accretive and may cause dilution to the combined company’s earnings per share, which may negatively impact the price of the common stock of the combined company following the completion of the Merger. Accelrys and Symyx currently anticipate that the Merger will be accretive to the earnings per share of the combined company during the first full calendar year after the Merger is completed. This expectation is based on preliminary estimates and assumes certain synergies expected to be realized by the combined company during such time. Such estimates and assumptions could materially change due to additional transaction-related costs, the failure to realize any or all of the benefits expected in the Merger or other factors beyond the control of Accelrys and Symyx. All of these factors could delay, decrease or eliminate the expected accretive effect of the Merger and cause resulting dilution to the combined company’s earnings per share or to the price of the common stock of the combined company.
The issuance of shares of Accelrys common stock to Symyx stockholders in connection with the Merger will substantially dilute the voting power of current Accelrys stockholders. Pursuant to the terms of the Merger Agreement, and based on the number of shares of Symyx common stock and restricted stock units outstanding as of the date of the Merger Agreement, it is anticipated that Accelrys will issue shares of Accelrys common stock to Symyx stockholders representing slightly less than a majority of the outstanding shares of common stock of Accelrys as of immediately following the completion of the Merger. Accordingly, the issuance of shares of Accelrys common stock to Symyx stockholders in connection with the Merger will significantly reduce the relative voting power of each share of Accelrys common stock held by current Accelrys stockholders.
The Merger will result in changes to the Accelrys board of directors that may affect the combined company’s operations. If the parties complete the Merger, the composition of the Accelrys board of directors will change in accordance with the Merger Agreement. Following the completion of the Merger, the combined company’s board of directors will consist of 10 members, including the six current directors of Accelrys and four of the current directors of Symyx. This new composition of the board of directors may affect the business strategy and operating decisions of the combined company upon completion of the Merger.
The loss of key personnel could have a material adverse effect on the combined company’s business, financial condition or results of operations. The success of the Merger will depend in part on the combined company’s ability to retain key Accelrys and Symyx employees who continue employment with the combined company after the Merger is completed. It is possible that these employees might decide not to remain with the combined company after the Merger is completed. If these key employees terminate their employment, the combined company’s sales, marketing or development activities might be adversely affected, management’s attention might be diverted from successfully integrating Symyx’s operations to recruiting suitable replacements and the combined company’s business, financial condition or results of operations could be adversely affected. In addition, the combined company might not be able to locate suitable replacements for any such key employees who leave the combined company or offer employment to potential replacements on reasonable terms.
The success of the combined company will also depend on relationships with third parties and pre-existing customers of Accelrys and Symyx, which relationships may be affected by customer preferences or public attitudes about the Merger. Any adverse changes in these relationships could adversely affect the combined company’s business, financial condition or results of operations. The combined company’s success will be dependent on the ability to maintain and renew relationships with pre-existing customers and other clients of both Accelrys and Symyx and to establish new client relationships. There can be no assurance that the business of the combined company will be able to maintain pre-existing customer contracts and other business relationships, or enter into or maintain new customer contracts and other business relationships, on acceptable terms, if at all. The failure to maintain important customer relationships could have a material adverse effect on the business, financial condition or results of operations of the combined company.
The combined company’s ability to utilize its net operating loss carryforwards in the future may be substantially limited by Section 382 of the Code. In general, under Section 382 of the Code, a corporation that undergoes an “ownership change” is subject to limitations on its ability to utilize its pre-change net operating loss
23
Table of Contents
carryforwards to offset future taxable income. In general, an ownership change occurs if the aggregate stock ownership of certain stockholders increases by more than 50 percentage points over such stockholders’ lowest percentage ownership during the testing period (which is generally three years). The amount of the annual limitation is generally equal to the value of the stock of the corporation immediately prior to the ownership change, multiplied by the adjusted federal tax-exempt rate set by the IRS.
As a result of the Merger, it is possible that either or both of Accelrys and Symyx will be deemed to have undergone an “ownership change” for purposes of Section 382 of the Code. Accordingly, the combined company’s ability to utilize Accelrys’s and Symyx’s net operating loss carryforwards may be substantially limited as described in the preceding paragraph. These limitations could in turn result in increased future tax payments for the combined company, which could have a material adverse effect on the business, financial condition or results of operations of the combined company.
The price of Accelrys common stock after the Merger is completed may be affected by factors different from those currently affecting the shares of Accelrys or Symyx. Upon completion of the Merger, holders of Symyx common stock will become holders of Accelrys common stock. The business of Accelrys differs from the business of Symyx in important respects and, accordingly, the results of operations of the combined company and the price of Accelrys common stock following the completion of the Merger may be affected by factors different from those currently affecting the independent results of operations of Accelrys and Symyx.
| Item 1B. | Unresolved Staff Comments |
None.
| Item 2. | Properties |
The following is a summary of our principal business locations:
| Location |
Principal activities |
Lease Ends (Fiscal Year) |
Square Feet | |||
| San Diego, California, USA |
Corporate headquarters, sales, customer support, marketing, product development and administration | 2014 | 68,436 | |||
| Burlington, Massachusetts, USA |
Sales | 2014 | 4,830 | |||
| Cambridge, UK |
Sales, customer support, marketing, product development and administration | 2022 | 24,451 | |||
| Paris, France |
Sales and administration | 2016 | 2,486 | |||
| Tokyo, Japan |
Sales, marketing and administration | 2012 | 5,405 | |||
| Bangalore, India |
Sales | 2011 | 1,500 |
| Item 3. | Legal Proceedings |
Several lawsuits have been filed against Symyx, the members of the Symyx board of directors, certain executive officers of Symyx, Accelrys and Merger Sub in purported class action lawsuits brought by individual Symyx stockholders challenging the proposed Merger and seeking, among other things, to enjoin the defendants from completing the Merger on the agreed-upon terms. If the plaintiffs are successful in obtaining an injunction prohibiting the parties from completing the Merger on the agreed-upon terms, such an injunction may prevent the completion of the Merger in the expected timeframe (or altogether). The first of such lawsuits was a class action lawsuit filed in the Superior Court of the State of California, County of Santa Clara, purportedly on behalf of the stockholders of Symyx, against Symyx and its directors and chief financial officer, as well as Accelrys and Merger Sub, alleging, among other things, that Symyx’s directors breached their fiduciary duties to the
24
Table of Contents
stockholders of Symyx in connection with the proposed Merger. Subsequent to the filing of such lawsuit, several additional suits were filed, also in Santa Clara County, each of which is substantially similar to the first lawsuit. The lawsuits were ultimately consolidated into a single action. It is expected that the plaintiffs will file a single, consolidated complaint, which will serve as the only complaint in the combined litigation going forward. We expect that the consolidated complaint, like the four filed complaints, will seek, among other things, to enjoin the defendants from completing the Merger as currently contemplated. We intend to take all appropriate actions to defend the suit.
In addition, we are subject to various claims and legal proceedings arising in the ordinary course of our business. While any legal proceeding has an element of uncertainty, management believes that the disposition of such matters, in the aggregate, will not have a material effect on our results of operations.
| Item 4. | Reserved |
25
Table of Contents
PART II
| Item 5. | Market for Registrant’s Common Equity, Related Stockholder Matters and Issuer Purchases of Equity Securities |
Market for Common Stock
Our common stock trades on the NASDAQ Global Market tier of The NASDAQ Stock Market under the symbol ACCL. The following table sets forth, for the periods indicated, the range of high and low sale prices per share of our common stock:
| High | Low | |||||
| Year Ended March 31, 2010 |
||||||
| First Quarter |
$ | 6.25 | $ | 3.85 | ||
| Second Quarter |
$ | 6.28 | $ | 5.43 | ||
| Third Quarter |
$ | 5.88 | $ | 4.92 | ||
| Fourth Quarter |
$ | 6.75 | $ | 5.33 | ||
| Year Ended March 31, 2009 |
||||||
| First Quarter |
$ | 7.03 | $ | 4.81 | ||
| Second Quarter |
$ | 5.73 | $ | 4.24 | ||
| Third Quarter |
$ | 5.63 | $ | 2.63 | ||
| Fourth Quarter |
$ | 4.56 | $ | 3.05 | ||
From the date of our initial public offering on December 5, 1995 until February 26, 2004, our stock traded under the symbol PCOP. Since February 27, 2004, our common stock has traded under the symbol ACCL.
Holders of Record
As of May 10, 2010, there were 356 holders of record of our common stock.
Dividends
No cash dividends have been paid on the common stock to date, nor do we anticipate paying dividends in the foreseeable future.
Equity Compensation Plan Information
The information required by Item 201(d) of Regulation S-K will be included in the definitive proxy statement for our 2010 annual meeting of stockholders or an amendment to this Report (either of the foregoing, a “Subsequent Filing”) to be filed with the SEC within 120 days after our fiscal year ended March 31, 2010, and is incorporated into this Report by reference.
26
Table of Contents
Comparison of Stockholder Return
The following information shall not be deemed to be “filed” with the SEC nor shall this information be incorporated by reference into any future filing under the Securities Act of 1933, as amended, or the Exchange Act, except to the extent that we specifically incorporate it by reference into a filing.
The following graph compares the five-year cumulative total return through March 31, 2010 for our common stock, which is traded under the symbol ACCL on the NASDAQ Global Market tier of The NASDAQ Stock Market, a broad market index, namely the NASDAQ U.S. Composite Index (the “NASDAQ Index”) and an industry index, namely the NASDAQ Computer and Data Processing Services Index (the “Industry Index”). This graph assumes an investment of $100 was made in both our common stock and in each index on March 31, 2005 and further assumes that all dividends were reinvested. The stock price performance on the graph is not necessarily indicative of future stock price performance.
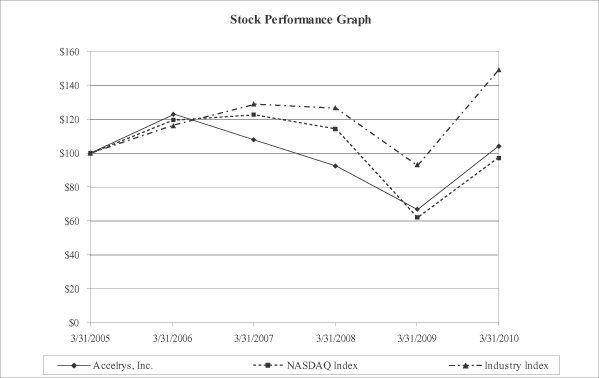
| Accelrys, Inc. | NASDAQ Index | Industry Index | |||||||
| March 31, 2005 |
$ | 100.00 | $ | 100.00 | $ | 100.00 | |||
| March 31, 2006 |
122.60 | 117.94 | 117.76 | ||||||
| March 31, 2007 |
107.59 | 122.29 | 128.49 | ||||||
| March 31, 2008 |
92.41 | 114.07 | 126.58 | ||||||
| March 31, 2009 |
67.12 | 61.83 | 93.51 | ||||||
| March 31, 2010 |
103.88 | 96.99 | 148.54 | ||||||
27
Table of Contents
| Item 6. | Selected Consolidated Financial Data |
The following selected consolidated financial data have been derived from our audited consolidated financial statements. This data should be read in conjunction with “Management’s Discussion and Analysis of Financial Condition and Results of Operations” and our consolidated financial statements and related notes thereto included elsewhere in this Report. The following table sets forth our selected consolidated financial data as of and for the years ended March 31, 2010, 2009, 2008, 2007 and 2006.
| Years Ended | ||||||||||||||||||||
| March 31, 2010 |
March 31, 2009 |
March 31, 2008 |
March 31, 2007 |
March 31, 2006 |
||||||||||||||||
| Consolidated Statements of Operations: |
||||||||||||||||||||
| Revenue |
$ | 82,959 | $ | 80,981 | $ | 79,739 | $ | 80,955 | $ | 82,001 | ||||||||||
| Cost of revenue |
14,381 | 15,674 | 15,204 | 15,498 | 16,029 | |||||||||||||||
| Gross margin |
68,578 | 65,310 | 64,535 | 65,457 | 65,972 | |||||||||||||||
| Operating expenses: |
||||||||||||||||||||
| Product development |
15,131 | 15,053 | 17,762 | 18,931 | 21,721 | |||||||||||||||
| Sales and marketing |
36,658 | 34,718 | 32,974 | 30,680 | 33,723 | |||||||||||||||
| General and administrative |
15,376 | 14,962 | 14,475 | 17,342 | 16,090 | |||||||||||||||
| Restructuring charges (recoveries) |
(86 | ) | 896 | 179 | 1,201 | 3,178 | ||||||||||||||
| Total operating expenses |
67,079 | 65,629 | 65,390 | 68,154 | 74,682 | |||||||||||||||
| Operating income (loss) from continuing operations |
1,499 | (319 | ) | (855 | ) | (2,697 | ) | (8,710 | ) | |||||||||||
| Interest and other income, net |
914 | 1,608 | 3,237 | 1,954 | 1,869 | |||||||||||||||
| Income (loss) from continuing operations before income taxes |
2,413 | 1,289 | 2,382 | (743 | ) | (6,841 | ) | |||||||||||||
| Income tax expense |
1,218 | 1,195 | 1,061 | 782 | 898 | |||||||||||||||
| Net income (loss) |
$ | 1,195 | $ | 94 | $ | 1,321 | $ | (1,525 | ) | $ | (7,739 | ) | ||||||||
| Basic and diluted income (loss) per share amounts: |
$ | 0.04 | $ | 0.00 | $ | 0.05 | $ | (0.06 | ) | $ | (0.30 | ) | ||||||||
| Weighted average shares used in computing basic and diluted income (loss) per share amounts |
||||||||||||||||||||
| Basic |
27,504 | 27,093 | 26,692 | 26,351 | 26,116 | |||||||||||||||
| Diluted |
27,760 | 27,203 | 27,185 | 26,351 | 26,116 | |||||||||||||||
| March 31, 2010 |
March 31, 2009 |
March 31, 2008 |
March 31, 2007 |
March 31, 2006 |
||||||||||||||||
| Consolidated Balance Sheet Data: |
||||||||||||||||||||
| Cash, cash equivalents, marketable securities and restricted cash and marketable securities |
$ | 93,082 | $ | 81,769 | $ | 76,381 | $ | 70,757 | $ | 66,022 | ||||||||||
| Total assets |
171,205 | 160,614 | 156,091 | 154,601 | 146,755 | |||||||||||||||
| Total deferred revenue |
61,325 | 57,224 | 58,341 | 56,133 | 61,269 | |||||||||||||||
| Noncurrent liabilities(1) |
6,953 | 7,204 | 8,140 | 8,342 | 5,718 | |||||||||||||||
| Accumulated deficit |
(179,365 | ) | (180,560 | ) | (180,654 | ) | (182,681 | ) | (181,156 | ) | ||||||||||
| Total stockholders’ equity |
86,104 | 80,759 | 74,882 | 68,990 | 63,208 | |||||||||||||||
| (1) | Noncurrent liabilities primarily consist of long-term, lease-related liabilities. |
28
Table of Contents
| Item 7. | Management’s Discussion and Analysis of Financial Condition and Results of Operations |
The following discussion and analysis of our financial condition and results of operations should be read in conjunction with “Selected Consolidated Financial Data” and our consolidated financial statements and related notes thereto included elsewhere in this Report.
In addition to historical information, the following discussion contains forward-looking statements that are subject to certain risks and uncertainties, including those risks and uncertainties described in Item 1A of this Report. Actual results may differ substantially from those referred to herein due to a number of factors, including but not limited to those risks and uncertainties.
Overview
Our Business
We develop and commercialize scientific business intelligence software and solutions that enable our customers to accelerate the discovery and development of new drugs and materials. Our customers include pharmaceutical, biotechnology and other life science companies, as well as companies that are in the energy, chemicals, aerospace and consumer packaged goods markets. Our software and service solutions are used by our customers’ scientists, biologists, chemists and information technology professionals in order to aggregate, mine, integrate, analyze, simulate, manage and interactively report scientific data. Our customers include leading commercial, government and academic organizations. Many of the largest pharmaceutical, biotechnology, chemicals, energy, aerospace and consumer packaged goods companies worldwide use our software. We market our products and services worldwide, principally through our direct sales force, augmented by the use of third-party distributors.
Our Marketplace
Historically, we have primarily sold molecular modeling and simulation software. The market for molecular modeling and simulation products in the pharmaceutical and biotechnology industries is challenging due to the maturity of the market, industry consolidation, reduction in the level of discovery research activity, and increased competition, including competition from open source software. We also sell modeling and simulation products to the energy, aerospace, chemical and consumer packaged goods industries. We believe these industries are in the early stages of adoption of these technologies. Thus we believe the market for our products within these industries is nascent. Following the acquisition of SciTegic, we began offering data-pipelining and workflow software. This technology is widely applicable within our target industries and represents a significant growth opportunity in all industries which our computer aided modeling and simulation and cheminformatics products currently serve. There is currently limited competition with this technology in our targeted industries.
Our Strategy
We believe the combination of our scientific informatics platform and our computer aided design modeling and simulation software and service solutions enables our customers to better utilize their scientific data in order to solve critical business issues throughout their organizations. Our strategy is to continue to increase the use of our scientific informatics platform so that it remains the de facto standard scientific informatics platform in the industries we serve. In order to increase the use of our platform we continue to develop advanced analysis and reporting component collections which operate with our scientific informatics platform in order to extend its capabilities and value to our customers. Our scientific informatics platform is also the basis of many of our service offerings, including offerings which integrate and enhance our customers’ software, thereby further increasing the use and value of our platform. Because our scientific informatics platform is the underlying operating platform for many products in our broad portfolio of computer aided design modeling and simulation software and service solutions, we expect the usage of these products to increase as the usage of our scientific informatics platform increases, thus further increasing our sales and value to our customers. We also intend to
29
Table of Contents
market and distribute our solutions to a broader group of users, including scientists, engineers and information technology professionals within our existing customer base, as well as to new customers in other industries. We also partner with other companies who provide scientific software and services in order to ensure that their software and service solutions operate with our scientific informatics platform, further proliferating its use and value to our customers.
Critical Accounting Policies
Our discussion and analysis of our financial condition and results of operations are based on our consolidated financial statements, which have been prepared in accordance with accounting principles generally accepted in the United States (“GAAP”). The preparation of the consolidated financial statements requires us to make estimates and judgments that affect the reported amounts of assets, liabilities, revenues and expenses and the related disclosure of contingent assets and liabilities. We review our estimates on an on-going basis, including those related to income taxes and the valuation of goodwill, intangibles and other long-lived assets. We base our estimates on historical experience and on various other assumptions that we believe to be reasonable under the circumstances, the results of which form the basis for making judgments about the carrying values of assets and liabilities. Actual results may differ from these estimates under different assumptions or conditions. Our accounting policies are described in more detail in Note 2 to our consolidated financial statements included elsewhere in this Report. We have identified the following as the most critical accounting policies and estimates used in the preparation of our consolidated financial statements.
Revenue Recognition
We generate revenue from the following primary sources:
| • | software licenses, |
| • | post-contract customer support and maintenance services on licensed software, collectively referred to as PCS, and |
| • | professional services. |
Customer billings generated in connection with our revenue-generating activities are initially recorded as deferred revenue. We then recognize the revenue from these customer billings as set forth below and when all of the following criteria are met:
| • | a fully executed written contract and/or purchase order has been obtained from the customer (i.e., persuasive evidence of an arrangement exists), |
| • | the contractual price of the product or services has been defined and agreed to in the contract (i.e., price is fixed or determinable), |
| • | delivery of the product or service has occurred and no material uncertainties regarding customer acceptance of the delivered product or service exist, and |
| • | collection of the purchase price from the customer is considered probable. |
Software Licenses. We license software predominantly on a term basis. When sold perpetually, our standard perpetual software licensing arrangements generally include twelve months of bundled PCS, while our standard term-based software licensing arrangements typically include PCS for the full duration of the term license. Because we do not have vendor specific objective evidence of the fair value of these elements, we recognize as revenue the entire fee for such perpetual and term-based licenses ratably over the term of the bundled PCS.
Renewal of PCS Under Perpetual Software Licenses. Our PCS includes the right to receive unspecified upgrades or enhancements and technical support. Fees from customer renewals of PCS related to previously purchased perpetual licenses are recognized ratably over the term of the PCS.
30
Table of Contents
Professional Services. We provide certain services to our customers, including non-complex product training, installation, implementation and other professional services which are non-essential to the operation of the software. We also perform professional services for our customers designed to enhance the value of our software products by creating extensions to functionality to address a client’s specific business needs. When sold separately, revenue from these services is recorded under the proportional performance or completed performance method.
Multi-Element Arrangements. For multi-element arrangements which include software licenses, PCS and non-complex training, installation and implementation services which are non-essential to the operation of the software, the entire revenue and cost of revenue for such arrangements are recognized as revenue ratably over the term of the PCS or the delivery of the services, whichever is longer. For multi-element arrangements which also include services that are essential to the operation of the software, the revenue and cost of revenue for such arrangements are generally deferred until the services essential to the operation of the software have been performed, at which point the entire revenue and cost of revenue for such arrangements are recognized as revenue ratably over the remaining term of the PCS or the delivery of non-essential services, whichever is longer.
Valuation of Goodwill
Our goodwill resulted from acquisitions in fiscal years 1999 through 2005. In accordance with the Financial Accounting Standards Board (“FASB”) Accounting Standards Codification (“ASC”) Topic 350, Intangibles—Goodwill and Other (“ASC Topic 350”), we review goodwill for impairment at least annually and more frequently if events or changes in circumstances occur that indicate a potential reduction in the fair value of the reporting unit to which the goodwill has been assigned below its carrying value. Examples of such events or circumstances include: a significant adverse change in legal factors or in the business climate, a significant decline in our stock price, a significant decline in our projected revenue or cash flows, an adverse action or assessment by a regulator, unanticipated competition, a loss of key personnel, or the presence of other indicators that would indicate a reduction in the fair value of a reporting unit.
Our goodwill is considered to be impaired if we determine that the carrying value of the reporting unit to which the goodwill has been assigned exceeds its estimated fair value. In the fourth quarter of fiscal year 2010, we completed our annual goodwill impairment test and concluded that our goodwill was not impaired. Based on the guidance provided by ASC Topic 350 and ASC Topic 280, Segment Reporting, management has determined that our company consists of one reporting unit given the similarities of economic characteristics between our operations and the common nature of our products, services and customers. Because we have only one reporting unit, and because we are publicly traded, we determine the fair value of the reporting unit based on our market capitalization as we believe this represents the best evidence of fair value. Our conclusion that goodwill was not impaired was based on a comparison of our net assets as of March 31, 2010 to our market capitalization.
Because we determine the fair value of our reporting unit based on our market capitalization, our future reviews of goodwill for impairment may be impacted by changes in the price of our common stock. For example, a significant decline in the price of our common stock may cause the fair value of our goodwill to fall below its carrying value. Therefore, we cannot assure you that when we complete our future reviews of goodwill for impairment a material impairment charge will not be recorded.
Valuation of Indefinite-Lived Intangible Asset
In connection with our acquisition of SciTegic in September 2004, we acquired the SciTegic trade name which was determined to be indefinitely lived. In accordance with ASC Topic 350, we review our indefinite-lived intangible asset for impairment at least annually in our fiscal fourth quarter and more frequently if events or changes in circumstances occur that indicate a potential reduction in the fair value of the asset below its carrying value. Examples of such events or circumstances include: a significant adverse change in legal factors or in the business climate, a significant decline in our stock price, a significant decline in our projected revenue or cash
31
Table of Contents
flows, an adverse action or assessment by a regulator, unanticipated competition, a loss of key personnel, or the presence of other indicators that would indicate a reduction in the fair value of an asset.
Our indefinite-lived intangible asset is considered to be impaired if we determine that the carrying value of the asset exceeds its estimated fair value. In the fourth quarter of fiscal year 2010, we completed our annual indefinite-lived intangible asset impairment test and concluded that our indefinite-lived intangible asset was not impaired. We estimated the fair value of our indefinite-lived intangible asset utilizing a discounted cash flow analysis which considers the estimated future customer orders for our scientific informatics platform and the associated direct and incremental selling, marketing, and product development costs. Key assumptions included in the discounted cash flow analysis include projections of future customer order growth for our scientific informatics platform and developing an appropriate discount rate.
We cannot assure you that the underlying assumptions used to forecast the cash flows will materialize as estimated. For example, if our projections of future customer order growth do not materialize, the fair value of our indefinite-lived intangible asset may fall below its carrying value. Therefore, we cannot assure you that when we complete our future reviews of our indefinite-lived intangible asset for impairment that a material impairment charge will not be recorded.
Impairment of Long-Lived Assets
In accordance with ASC Topic 350 and ASC Topic 360, Property, Plant and Equipment, we review long-lived assets to be held and used, including acquired intangible assets subject to amortization and property and equipment, for impairment whenever events or changes in circumstances indicate that the carrying amount of the assets may not be fully recoverable. Conditions that would necessitate an impairment assessment include a significant decline in the market price of an asset or asset group, a significant adverse change in the extent or manner in which an asset or asset group is being used, the loss of legal ownership or title to the asset, significant negative industry or economic trends or the presence of other indicators that would indicate that the carrying amount of an asset or asset group is not recoverable.
A long-lived asset is considered to be impaired if the estimated undiscounted future cash flows resulting from the use of the asset and its eventual disposition are not sufficient to recover the carrying value of the asset. In order to estimate an asset’s undiscounted future cash flows, we utilize our internal forecast of our future operating results and cash flows, our strategic business plans and anticipated future economic and market conditions. There are inherent estimates and assumptions underlying this information and management’s judgment is required in the application of this information to the determination of an asset’s undiscounted future cash flows. No assurance can be given that the underlying estimates and assumptions utilized in our determination of an asset’s undiscounted future cash flows will materialize as anticipated.
Valuation of Marketable Securities
We assess our marketable securities for impairment under the guidance provided by ASC Topic 320, Investments—Debt and Equity Securities. Accordingly, we review the fair value of our marketable securities at least quarterly to determine if declines in the fair value of individual securities are other-than-temporary in nature. If we believe the decline in the fair value of an individual security is other-than-temporary, we write-down the carrying value of the security to its estimated fair value, with a corresponding charge against income. To determine if a decline in the fair value of an investment is other-than-temporary, we consider several factors including, among others, the period of time and extent to which the estimated fair value has been less than cost, overall market conditions, the historical and projected future financial condition of the issuer of the security and our ability and intent to hold the security for a period of time sufficient to allow for a recovery of the market value.
32
Table of Contents
Valuation of Share-Based Awards
We account for our share-based awards in accordance with ASC Topic 718, Compensation—Stock Compensation (“ASC Topic 718”). We estimate the fair value of our share-based stock awards on the date of grant using the Black-Scholes option-pricing model. The Black-Scholes option-pricing model requires the use of certain input variables, as follows:
Expected Volatility. Volatility is a measure of the amount the stock price will fluctuate during the expected life of an award. We determine volatility based on our historical stock price volatility over the most recent period equivalent to the expected life of the award, giving consideration to company-specific events impacting our historical volatility that are unlikely to occur in the future, as well as anticipated future events that may impact volatility. We also consider the historical stock price volatilities of comparable publicly traded companies.
Risk-Free Interest Rate. Our assumption of the risk-free interest rate is based on the interest rates on U.S. constant rate treasury securities with contractual terms approximately equal to the expected life of the award.
Expected Dividend Yield. Because we have not paid any cash dividends since our inception and do not anticipate paying dividends in the foreseeable future, we assume a dividend yield of zero.
Expected Award Life. We determine the expected life of an award by considering various relevant factors, including the vesting period and contractual term of the award, our employees’ historical exercise patterns and length of service, the expected future volatility of our stock price and employee characteristics. We also consider the expected award lives of comparable publicly traded companies. For stock purchase plan purchase rights, the expected life is equal to the current offering period under the stock purchase plan.
Under ASC Topic 718, we are also required to estimate at grant the likelihood that the award will ultimately vest (the “pre-vesting forfeiture rate”), and to revise the estimate, if necessary, in future periods if the actual forfeiture rate differs. We determine the pre-vesting forfeiture rate of an award based on our historical pre-vesting award forfeiture experience, giving consideration to company-specific events impacting historical pre-vesting award forfeiture experience that are unlikely to occur in the future as well as anticipated future events that may impact forfeiture rates.
Our determination of the input variables used in the Black-Scholes option pricing model as well as the pre-vesting forfeiture rate is based on various underlying estimates and assumptions that are highly subjective and are affected by our stock price, among other factors. Changes in these underlying estimates and assumptions could materially affect the fair value of our share-based awards and, therefore, the amount of share-based compensation expense to be recognized in our results of operations.
Income Taxes
We account for income taxes in accordance with ASC Topic 740, Income Taxes (“ASC Topic 740”). Significant judgment is required in determining our worldwide provision for income taxes. In the ordinary course of a global business, there are many transactions for which the ultimate tax outcome is uncertain. Some of these uncertainties arise as a consequence of intercompany arrangements to share revenue and costs. In such arrangements there are uncertainties about the amount and manner of such sharing which could ultimately result in changes once the arrangements are reviewed by taxing authorities. Although we believe that our approach to determining the amount of such arrangements is reasonable, no assurance can be given that the final resolution of these matters will not be materially different than that which is reflected in our historical income tax provisions and accruals. Such differences could have a material effect on our income tax expense or benefit in the period in which such determination is made.
Despite our belief that our tax return positions are consistent with applicable tax laws, we expect that certain positions may be challenged by taxing authorities. Settlement of any challenge can result in no change, a complete disallowance, or a partial adjustment reached through negotiations or litigation. Significant judgment is
33
Table of Contents
required in evaluating our tax reserves. Our reserves are adjusted in light of changing facts and circumstances, such as the progress of our tax audits. Our income tax expense includes the impact of reserve provisions, if any, and changes to reserves that we consider appropriate, as well as related interest and penalties. Favorable resolution of such an income tax matter would be recognized as a reduction to income tax expense.
We establish a valuation allowance against our net deferred tax assets to reduce deferred tax assets to the amount expected to be realized. The likelihood of a material change in the expected realization of our deferred tax assets depends on our ability to generate sufficient future taxable income. Our ability to generate enough taxable income to utilize our deferred tax assets depends on many factors, among which are our ability to deduct tax loss carryforwards against future taxable income, the effectiveness of our tax planning strategies, reversing deferred tax liabilities and any significant changes in the tax treatment received with respect to our business combinations. Since our inception, we have provided a full valuation allowance against our net U.S. deferred tax assets as we believe it is more likely than not that we will not ultimately realize our deferred tax assets.
We adopted the provision of ASC Topic 740 as it relates to uncertain tax positions effective April 1, 2007. ASC Topic 740 prescribes a recognition threshold and measurement attribute for the financial statement recognition and measurement of a tax position taken or expected to be taken in a tax return. ASC Topic 740 requires that we determine whether the benefits of our tax positions are more–likely-than-not to be sustained upon audit based on the technical merits of the tax position. We recognize the impact of an uncertain income tax position taken on our income tax return at the largest amount that is more-likely-than-not to be sustained upon audit by the relevant taxing authority. An uncertain income tax position is not recognized if it has less than a 50% likelihood of being sustained.
Results of Operations
Comparison of the Years Ended March 31, 2010 and 2009
The following table summarizes our results of operations as a percentage of revenue for the respective periods:
| Years Ended March 31, | ||||||
| 2010 | 2009 | |||||
| Revenue |
100 | % | 100 | % | ||
| Cost of revenue |
17 | % | 19 | % | ||
| Gross margin |
83 | % | 81 | % | ||
| Operating expenses: |
||||||
| Product development |
18 | % | 19 | % | ||
| Sales and marketing |
44 | % | 43 | % | ||
| General and administrative |
19 | % | 18 | % | ||
| Restructuring charges (recoveries) |
(— | )% | 1 | % | ||
| Total operating expenses |
81 | % | 81 | % | ||
| Operating income (loss) |
2 | % | (— | )% | ||
| Interest and other income, net |
1 | % | 2 | % | ||
| Income before income taxes |
3 | % | 2 | % | ||
| Income tax expense |
1 | % | 1 | % | ||
| Net income |
1 | % | — | % | ||
34
Table of Contents
Revenue
Revenue increased 2% to $83.0 million for the year ended March 31, 2010 compared to $81.0 million for the year ended March 31, 2009. The increase was due to an increase in software revenue of approximately $2.4 million and an increase in service revenue of approximately $0.3 million, partially offset by a decrease in maintenance and other revenue of approximately $0.7 million.
Operating Costs and Expenses
Cost of Revenue. Cost of revenue decreased 8% to $14.4 million for the year ended March 31, 2010, as compared to $15.7 million for the year ended March 31, 2009. As a percentage of revenue, cost of revenue was 17% and 19% for the years ended March 31, 2010 and 2009, respectively. The decrease in cost of revenue was primarily attributable to a decrease in purchased intangible asset amortization of $0.7 million, a decrease in distributor commissions of $0.4 million and lower personnel costs in our service departments of $0.4 million primarily, partially offset by an increase in professional fees of $0.3 million.
Product Development Expenses. Product development expenses were consistent at approximately $15.1 million for each of the years ended March 31, 2010 and 2009. As a percentage of revenue, product development expenses decreased to 18% for the year ended March 31, 2010, as compared to 19% for the year ended March 31, 2009. The slight increase in product development expenses was attributable to an increase in personnel related costs of approximately $0.4 million, partially offset by a decrease in consulting costs of $0.1 million and overhead costs of $0.1 million.
Sales and Marketing Expenses. Sales and marketing expenses increased 6% to $36.7 million for the year ended March 31, 2010, as compared to $34.7 million for the year ended March 31, 2009. As a percentage of revenue, sales and marketing expenses increased to 44% for the year ended March 31, 2010, as compared to 43% for the year ended March 31, 2009. The increase in sales and marketing expense is primarily attributable to additional personnel and incentive compensation of approximately $1.2 million, as well as an increase in professional fees of $0.6 million related to new marketing initiatives.
General and Administrative Expenses. General and administrative expenses increased 3% to $15.4 million for the year ended March 31, 2010, as compared to $15.0 million for the year ended March 31, 2009. As a percentage of revenue, general and administrative expenses increased to 19% for the year ended March 31, 2010, as compared to 18% for the year ended March 31, 2009. The increase in general and administrative expenses was primarily attributable to an increase in merger and acquisition related costs of $0.7 million, partially offset by a decrease in personnel related costs of $0.3 million.
Net Interest and Other Income
Net interest and other income was $0.9 million for the year ended March 31, 2010, as compared to $1.6 million for the year ended March 31, 2009. Net interest and other income were primarily affected by a decrease in interest income of $1.0 million, as well as a decrease in other income of $0.2 million. These items were partially offset by a prior year unrealized loss on our ARS portfolio of $0.2 million turning to an unrealized gain of $0.2 million during the year ended March 31, 2010.
Income Tax Expense
Income tax expense was consistent at $1.2 million for each of the years ended March 31, 2010 and 2009.
35
Table of Contents
Comparison of the Years Ended March 31, 2009 and 2008
The following table summarizes our results of operations as a percentage of revenue for the respective periods:
| Years Ended March 31, | ||||||
| 2009 | 2008 | |||||
| Revenue |
100 | % | 100 | % | ||
| Cost of revenue |
19 | % | 19 | % | ||
| Gross margin |
81 | % | 81 | % | ||
| Operating expenses: |
||||||
| Product development |
19 | % | 22 | % | ||
| Sales and marketing |
43 | % | 42 | % | ||
| General and administrative |
18 | % | 18 | % | ||
| Restructuring charges |
1 | % | — | % | ||
| Total operating expenses |
81 | % | 82 | % | ||
| Operating loss |
(— | )% | (1 | )% | ||
| Interest and other income, net |
2 | % | 4 | % | ||
| Income before income taxes |
2 | % | 3 | % | ||
| Income tax expense |
1 | % | 1 | % | ||
| Net income |
— | % | 2 | % | ||
Revenue
Revenue increased 2% to $81.0 million for the year ended March 31, 2009 compared to $79.7 million for the year ended March 31, 2008. The increase was due to an increase in software revenue of approximately $1.7 million and an increase in service revenue of approximately $0.6 million, partially offset by a decrease in maintenance revenue of approximately $1.1 million.
Operating Costs and Expenses
Cost of Revenue. Cost of revenue increased 3% to $15.7 million for the year ended March 31, 2009, as compared to $15.2 million for the year ended March 31, 2008. As a percentage of revenue, cost of revenue was consistent at 19% for each of the years ended March 31, 2009 and 2008. The increase in cost of revenue was primarily attributable to higher personnel, travel and overhead costs in our service departments of $1.2 million primarily as a result of increased headcount, partially offset by a decrease in royalties and distributor commissions of $0.7 million.
Product Development Expenses. Product development expenses decreased 15% to $15.1 million for the year ended March 31, 2009, as compared to $17.8 million for the year ended March 31, 2008. As a percentage of revenue, product development expenses decreased to 19% for the year ended March 31, 2009, as compared to 22% for the year ended March 31, 2008. The decrease in product development expenses was primarily attributable to a decrease in personnel and overhead costs related to a decreased headcount.
Sales and Marketing Expenses. Sales and marketing expenses increased 5% to $34.7 million for the year ended March 31, 2009, as compared to $33.0 million for the year ended March 31, 2008. As a percentage of revenue, sales and marketing expenses increased to 43% for the year ended March 31, 2009, as compared to 42% for the year ended March 31, 2008. The increase in sales and marketing expense was primarily attributable to additional personnel and overhead costs of approximately $1.1 million, as well as an increase in professional fees of $0.6 million related to new marketing initiatives.
36
Table of Contents
General and Administrative Expenses. General and administrative expenses increased 3% to $15.0 million for the year ended March 31, 2009, as compared to $14.5 million for the year ended March 31, 2008. As a percentage of revenue, general and administrative expenses were consistent at 18% for each of the years ended March 31, 2009 and 2008. The increase in general and administrative expenses was primarily attributable to an increase in personnel costs of $1.8 million, partially offset by a decrease in accounting and legal fees of $0.6 million and a reduction in overhead costs of $0.5 million.
Restructuring Charges. Restructuring charges were $0.9 million for the year ended March 31, 2009, as compared to $0.2 million for the year ended March 31, 2008. Restructuring charges in the current period were primarily related to our plan completed in the first quarter of fiscal year 2009 to realign our workforce in order to support our growth products.
Net Interest and Other Income
Net interest and other income was $1.6 million for the year ended March 31, 2009, as compared to $3.2 million for the year ended March 31, 2008. Net interest and other income were unfavorably impacted by a reduction of $1.3 million in interest earned on our cash, cash equivalents and marketable securities balances during fiscal year 2009, in addition to $0.4 million in unfavorable fluctuations in foreign currencies and a $0.2 million unrealized loss related to our ARS portfolio. These items were partially offset by an increase in other income of $0.2 million.
Income Tax Expense
Income tax expense was $1.2 million for the year ended March 31, 2009, as compared to $1.1 million for the year ended March 31, 2008. The increase in income tax expense was primarily attributable to timing differences in the deductibility of indefinite-lived intangible asset amortization for income tax purposes.
Liquidity and Capital Resources
We had cash, cash equivalents, marketable securities, and restricted cash and marketable securities of $93.1 million as of March 31, 2010, as compared to $81.8 million as of March 31, 2009, an increase of $11.3 million. Significant components of this increase include cash provided by operations of $12.5 million, proceeds from the sale of common stock of $0.6 million and a $0.5 million favorable effect on cash and cash equivalents related to changes in foreign currency rates, offset by net purchases of property and equipment and software licenses of $0.8 million.
Net cash provided by operating activities was $12.5 million for the year ended March 31, 2010, as compared to $11.9 million for the year ended March 31, 2009. The increase in cash flows from operating activities was primarily attributable to an increase in deferred revenue which was driven by an overall increase in order intake over the prior year, as well as an increase in other assets over the prior period.
Net cash provided by investing activities was $23.0 million for the year ended March 31, 2010, as compared to net cash used in investing activities of $22.6 million for the year ended March 31, 2009. Significant components of cash flows provided by investing activities for the year ended March 31, 2010 included net purchases of property and equipment of $0.7 million, purchases of software licenses of $0.1 million, and a net decrease in our marketable securities portfolio of $23.8 million. Significant components of cash flows used in investing activities for the year ended March 31, 2009 included net purchases of property and equipment of $0.9 million, purchases of software licenses of $1.9 million and a net increase in our marketable securities portfolio of $19.8 million.
Net cash provided by financing activities was $0.6 million for the year ended March 31, 2010, as compared to $0.7 million for the year ended March 31, 2009. Cash flows from financing activities for the years ended
37
Table of Contents
March 31, 2010 and 2009 consist entirely of proceeds from the issuance of our common stock under our employee stock plans, reduced by payments made to taxing authorities on behalf of our employees when tendering stock to us for settlement of minimum income tax liability upon vesting of restricted stock units.
As of March 31, 2010, we held $11.8 million in ARS at face value, which are collateralized by student loans, most of which were originated under the Federal Family Education Loan Program and are guaranteed by the United States Federal Department of Education. All of our ARS are AAA rated (or equivalent) by one or more of the major credit rating agencies.
Through February 2008, the face value of our ARS has approximated fair value due to the frequent auction periods, generally every 7 to 28 days, which provided liquidity to these investments. However, since February 2008, all auctions for the ARS we hold have failed as the amount of ARS submitted for sale has exceeded the amount of purchase orders. The result of a failed auction is that these ARS continue to pay interest at contractually stated rates at each respective auction date; however, the liquidity of the ARS will be limited until there is a successful auction, the issuer redeems the securities, the securities mature or until such time as other markets for these ARS develop. We have concluded that the estimated fair value of the ARS no longer approximates the face value due to the lack of liquidity. The ARS have been classified within Level 3 under ASC Topic 820, Fair Value Measurements and Disclosures (“ASC Topic 820”). Their valuation requires substantial judgment and estimation of factors that are not currently observable in the market due to the lack of trading in the ARS.
We estimated the fair value of our ARS utilizing a discounted cash flow analysis as of March 31, 2010. The analysis considered, among other items, the collateralization underlying the security investments, the creditworthiness of the issuer, expected future cash flows and the estimated weighted average life of the contractual maturity of the underlying assets. Due to entering into an agreement whereby the Investment Firm will repurchase our ARS at par value, as discussed further below, we no longer intend to hold the securities to maturity and we have determined that the decline in value of our ARS as of March 31, 2009 is other-than-temporary. Accordingly, in fiscal year 2009 we reversed prior unrealized losses on our ARS from accumulated other comprehensive income and recorded the losses as a charge to income during the same period. The gain recognized for the change in fair value of the ARS was $0.2 million for the year ended March 31, 2010.
On November 11, 2008, we entered into the ARS Agreement with the Investment Firm whereby the Investment Firm has agreed to repurchase all of our ARS at par value. By accepting the ARS Agreement, we (1) received the right to sell our ARS at par value to the Investment Firm between June 30, 2010 and July 2, 2012 and (2) gave the Investment Firm the right to purchase the ARS from us at any time after the Acceptance Date as long as we receive par value.
The ARS Agreement covers ARS with a par value of $11.8 million and a fair value of $10.5 million as of March 31, 2010. We have accounted for the Put Option as a freestanding financial instrument and elected to record the value under the fair value option of ASC Topic 825. This resulted in our recording a $1.3 million asset with a corresponding credit to income for the value of the Put Option. We estimated the fair value of the Put Option utilizing a discounted cash flow analysis as of March 31, 2010. The analysis considered, among other items, the collateralization underlying the security investments, the creditworthiness of the issuer, expected future cash flows, and the remaining life of the ARS Agreement with the Investment Firm.
The combined gain on the ARS and Put Option of $0.2 million is recorded in the “Interest and other income, net” line in the accompanying consolidated statement of income for year ended March 31, 2010. As we have the right to put our ARS to the Investment Firm beginning June 30, 2010 and we intend to do so, the ARS and the Put Option are classified as current assets on our consolidated balance sheet as of March 31, 2010.
We have funded our activities to date primarily through the sales of software licenses and related services and the issuance of equity securities.
38
Table of Contents
We anticipate that our capital requirements may increase in future periods as a result of seasonal sales trends, additional product development activities and the acquisition of additional equipment. Our capital requirements may also increase in future periods as we seek to expand our technology platform through investments, licensing arrangements, technology alliances or acquisitions.
We anticipate that our existing capital resources will be adequate to fund our operations for at least the next 12 months. However, there can be no assurance that changes will not occur that would consume available capital resources before then. Our capital requirements depend on numerous factors, including our ability to continue to generate software sales, the purchase of additional capital equipment and acquisitions of other businesses or technologies. There can be no assurance that additional funding, if necessary, will be available to us on favorable terms, if at all. Our forecast for the period of time through which our financial resources will be adequate to support our operations should be considered a forward-looking statement subject to all of the uncertainties and risks described elsewhere in this Report, and actual results could vary.
Contractual Obligations
Our long-term contractual obligations as of March 31, 2010 are as follows (in thousands):
| Payment Due by Period | |||||||||||||||
| Contractual Obligations |
Total | Less than 1 Year |
1 to 3 Years |
3 to 5 Years |
After 5 Years | ||||||||||
| Operating leases, net of subleases |
$ | 24,912 | $ | 3,800 | $ | 8,158 | $ | 3,741 | $ | 9,213 | |||||
| Minimum royalty payments(1) |
4,299 | 408 | 812 | 758 | 2,321 | ||||||||||
| Total |
$ | 29,211 | $ | 4,208 | $ | 8,970 | $ | 4,499 | $ | 11,534 | |||||
| (1) | For purposes of the contractual obligations table, we have included indefinite-lived contractual minimum royalty payments due in the ten fiscal years following fiscal year 2010. |
We are obligated to pay royalties for licenses to enhance and market certain software used in connection with our product offerings. In addition to the contractual minimum royalties included in the table above, we have several royalty agreements that are long term or perpetual in nature with royalty obligations that are generally based on a percentage of revenues derived from certain software license sales and associated sales of PCS. The royalty agreements require quarterly payments and generally do not limit the maximum royalties owed. During each of the years ended March 31, 2010 and 2009, we incurred royalty expense of $2.2 million, and during the year ended March 31, 2008, we incurred royalty expense of $2.9 million. Our future annual royalty obligations will vary based on the volume and mix of our product sales and, as a result, may increase in the future.
On April 30, 2004, in connection with the spin-off of PDD, the landlords of our New Jersey facilities, which were used by our PDD operations, consented to the assignment of the leases to PDD. Despite the assignment, the landlords required us to guarantee the remaining lease obligations, which totaled approximately $14.9 million as of March 31, 2010. In accordance with ASC Topic 460, Guarantor’s Accounting and Disclosure Requirements for Guarantees, Including Indirect Guarantees of Indebtedness of Others, we recognized a liability and corresponding charge to stockholders’ equity for the probability-weighted fair market value of the guarantee. Changes to the fair market value of the liability are recognized in stockholders’ equity. The liability for our guarantee of the lease obligation for each of the years as of March 31, 2010 and 2009 was $0.4 million.
Off-Balance Sheet Arrangements and Related Party Transactions
As of March 31, 2010, we did not have any relationships with unconsolidated entities or financial partnerships, such as entities often referred to as structured finance or special purpose entities, which would have been established for the purpose of facilitating off-balance sheet arrangements or other contractually narrow or limited purposes. As such, we are not materially exposed to any financing, liquidity, market or credit risk that could arise if we had engaged in such relationships.
39
Table of Contents
We do not have relationships or transactions with persons or entities that derive benefits from their non-independent relationship with us or our related parties.
New Accounting Standards
In January 2010, the FASB issued ASC 820-10-65-7, Improving Disclosures about Fair Value Measurements. This guidance requires additional disclosures for fair value measurements including the following: 1) amounts transferred in and out of Level 1 and 2 fair value measurements, which is effective for interim and annual reporting periods beginning after December 15, 2009 and 2) activities in Level 3 fair value measurements including purchases, sales, issuances, and settlements, which is effective for interim and annual reporting periods beginning after December 15, 2010. We do not expect that the adoption of the revised guidance for fair value measurements disclosures will have a significant impact on our financial statements.
In September 2009, the FASB issued ASC 605-25-65-1, Multiple-Deliverable Revenue Arrangements. The new guidance states that if vendor specific objective evidence or third party evidence for deliverables in an arrangement cannot be determined, companies will be required to develop a best estimate of the selling price to separate deliverables and allocate arrangement consideration using the relative selling price method. The new guidance is effective for revenue arrangements entered into or materially modified in fiscal years beginning on or after June 15, 2010. Early adoption is permitted. We are currently evaluating the impact this guidance may have on our results of operations, financial position and cash flows.
In September 2009, the FASB issued ASC 985-605-65-1, Certain Revenue Arrangements That Include Software Elements. Previously, companies that sold tangible products with “more than incidental” software were required to apply software revenue recognition guidance. This guidance often delayed revenue recognition for the delivery of the tangible product. Under the new guidance, tangible products that have software components that are “essential to the functionality” of the tangible product will be excluded from the software revenue recognition guidance. The new guidance will include factors to help companies determine what is “essential to the functionality” of the tangible product. Software-enabled products will now be subject to other revenue guidance and will likely follow the guidance for multiple deliverable arrangements issued by the FASB in September 2009. The new guidance is effective for revenue arrangements entered into or materially modified in fiscal years beginning on or after June 15, 2010. Early adoption is permitted. We are currently evaluating the impact this guidance may have on our results of operations, financial position and cash flows.
During the quarter ended September 30, 2009, we adopted ASC 105-10-65-1, The FASB Accounting Standards Codification and the Hierarchy of Generally Accepted Accounting Principles. The ASC has become the source of authoritative GAAP recognized by the FASB to be applied by nongovernmental entities. The ASC is not intended to change or alter existing GAAP. The adoption of this guidance did not have a material impact on our results of operations, financial position or cash flows.
During the quarter ended June 30, 2009, we adopted ASC 855-10-45-1, Subsequent Events. This new accounting guidance establishes general standards of accounting for, and requires disclosure of, events that occur after the balance sheet date but before financial statements are issued or are available to be issued. The adoption of this guidance did not have a material impact on our results of operations, financial position or cash flows.
During the quarter ended June 30, 2009, we adopted ASC 825-10-65-1, Interim Disclosures about Fair Value of Financial Instruments, and ASC 820-10-65-4, Determining Fair Value When the Volume and Level of Activity for the Asset or Liability Have Significantly Decreased and Identifying Transactions That Are Not Orderly. This new accounting guidance as issued by the FASB which requires disclosures about fair value of financial instruments in interim reporting periods, provides additional guidance for estimating fair value when the volume and level of activity for the asset or liability have significantly decreased, provides guidance when a transaction is not deemed an orderly transaction, and provides guidance related to the determination of other-than-temporary impairments to include the intent and ability of the holder as an indicator in the determination of
40
Table of Contents
whether an other-than-temporary impairment exists. The adoption of this guidance did not have a material impact on our results of operations, financial position or cash flows.
During the quarter ended June 30, 2009, we adopted ASC 350-30-65-1, Determination of the Useful Life of Intangible Assets. The new guidance amends the factors that should be considered in developing renewal or extension assumptions used to determine the useful life of a recognized intangible asset. The intent of this pronouncement is to improve the consistency between the useful life of a recognized intangible asset and the period of expected cash flows used to measure the fair value of the asset under other GAAP. The adoption of this guidance did not have a material impact on our results of operations, financial position or cash flows.
During the quarter ended June 30, 2009, we adopted ASC 820-10-65-1, Effective Date of FASB Statement No. 157. This new accounting guidance as issued by the FASB delayed the effective date of fair value accounting for all non-financial assets and non-financial liabilities by one year, except those recognized or disclosed at fair value in the financial statements on a recurring basis. The adoption of this guidance did not have a material impact on our results of operations, financial position or cash flows.
| Item 7A. | Quantitative and Qualitative Disclosures About Market Risk |
In addition to our U.S. operations, we have operations in Europe and the Asia/Pacific region. As a result, our financial position, results of operations and cash flows can be affected by fluctuations in foreign currency exchange rates, particularly fluctuations in the pound sterling, euro and yen exchange rates. Many of our reporting entities conduct a portion of their business in currencies other than the entity’s functional currency. These transactions give rise to receivables and payables that are denominated in currencies other than the entity’s functional currency. The value of these receivables and payables is subject to changes in exchange rates because the receivables and payables may become worth more or less than they were worth at the time we entered into the transaction due to changes in currency exchange rates. Both realized and unrealized gains or losses on the value of these receivables and payables, along with the settlement of certain intercompany transactions, are included in the determination of net income. We analyze our exposure to currency fluctuations and may engage in financial hedging techniques in the future to reduce the effect of these potential fluctuations. We do not currently have hedging contracts in effect since, historically, exchange rate fluctuations have had little impact on our operating results and cash flows. The majority of our software license agreements are denominated in U.S. dollars.
Our investment portfolio is maintained in accordance with our investment policy that defines allowable investments, specifies credit quality standards and limits the credit exposure of any single issuer. None of our investments are held for trading or speculative purposes. The fair value of our cash equivalents and marketable securities is subject to change as a result of changes in market interest rates and investment risk related to the issuers’ credit worthiness. We do not utilize financial contracts to manage our exposure in our investment portfolio to changes in interest rates. A hypothetical 100 basis point increase or decrease in market interest rates would not have a material impact on the fair value of our cash equivalents and marketable securities due to the relatively short maturities of these investments. While changes in interest rates may affect the fair value of our investment portfolio, any gains or losses will not be recognized in our results of operations until the investment is sold or if the reduction in fair value was determined to be an other-than-temporary impairment.
As of March 31, 2010, we held $11.8 million in ARS at face value, which are collateralized by student loans, most of which were originated under the Federal Family Education Loan Program and are guaranteed by the United States Federal Department of Education. All of our ARS are AAA rated (or equivalent) by one or more of the major credit rating agencies.
Through February 2008, the face value of our ARS has approximated fair value due to the frequent auction periods, generally every 7 to 28 days, which provided liquidity to these investments. However, since February 2008, all auctions for the ARS we hold have failed as the amount of ARS submitted for sale has exceeded the
41
Table of Contents
amount of purchase orders. The result of a failed auction is that these ARS continue to pay interest at contractually stated rates at each respective auction date; however, the liquidity of the ARS will be limited until there is a successful auction, the issuer redeems the securities, the securities mature or until such time as other markets for these ARS develop. We have concluded that the estimated fair value of the ARS no longer approximates the face value due to the lack of liquidity. The ARS have been classified within Level 3 under ASC Topic 820. Their valuation requires substantial judgment and estimation of factors that are not currently observable in the market due to the lack of trading in the ARS.
We estimated the fair value of our ARS utilizing a discounted cash flow analysis as of March 31, 2010. The analysis considered, among other items, the collateralization underlying the security investments, the creditworthiness of the issuer, expected future cash flows and the estimated weighted average life of the contractual maturity of the underlying assets. Due to entering into an agreement whereby the Investment Firm will repurchase our ARS at par value, as discussed further below, we no longer intend to hold the securities to maturity and have determined that the decline in value of our ARS as of March 31, 2010 is other-than-temporary. Accordingly, in fiscal year 2009 we reversed prior unrealized losses on our ARS from accumulated other comprehensive income and recorded the losses as a charge to income during the same period. The gain recognized for the change in fair value of the ARS was $0.2 million for the year ended March 31, 2010.
On November 11, 2008, we entered into the ARS Agreement with the Investment Firm whereby the Investment Firm agreed to repurchase all of our ARS at par value. By accepting the ARS Agreement, we (1) received the right to sell our ARS at par value to the Investment Firm between June 30, 2010 and July 2, 2012 and (2) gave the Investment Firm the right to purchase the ARS from us at any time after the Acceptance Date, as long as we receive par value.
The ARS Agreement covers ARS with a par value of $11.8 million and a fair value of $10.5 million as of March 31, 2010. We have accounted for the Put Option as a freestanding financial instrument and elected to record the value under the fair value option of ASC Topic 825. This resulted in our recording a $1.3 million asset with a corresponding credit to income for the value of the Put Option. We estimated the fair value of the Put Option utilizing a discounted cash flow analysis as of March 31, 2010. The analysis considered, among other items, the collateralization underlying the security investments, the creditworthiness of the issuer, expected future cash flows, and the remaining life of the ARS Agreement with the Investment Firm.
The combined gain on the ARS and Put Option of $0.2 million is recorded in the interest and other income, net line in the accompanying consolidated statement of income for the year ended March 31, 2010. As we have the right to put our ARS to the Investment Firm beginning June 30, 2010 and we intend to do so, the ARS and the Put Option are classified as current assets on our consolidated balance sheet as of March 31, 2010.
42
Table of Contents
| Item 8. | Financial Statements and Supplementary Data |
REPORT OF INDEPENDENT REGISTERED PUBLIC ACCOUNTING FIRM
The Board of Directors and Stockholders
Accelrys, Inc.
We have audited the accompanying consolidated balance sheets of Accelrys, Inc. as of March 31, 2010 and 2009, and the related consolidated statements of income, stockholders’ equity, and cash flows for each of the three years in the period ended March 31, 2010. Our audits also included the financial statement schedule listed in the index at Item 15(a)(2). These financial statements and schedule are the responsibility of the Company’s management. Our responsibility is to express an opinion on these financial statements and schedule based on our audits.
We conducted our audits in accordance with the standards of the Public Company Accounting Oversight Board (United States). Those standards require that we plan and perform the audit to obtain reasonable assurance about whether the financial statements are free of material misstatement. An audit includes examining, on a test basis, evidence supporting the amounts and disclosures in the financial statements. An audit also includes assessing the accounting principles used and significant estimates made by management, as well as evaluating the overall financial statement presentation. We believe that our audits provide a reasonable basis for our opinion.
In our opinion, the financial statements referred to above present fairly, in all material respects, the consolidated financial position of Accelrys, Inc. at March 31, 2010 and 2009, and the consolidated results of its operations and its cash flows for each of the three years in the period ended March 31, 2010, in conformity with U.S. generally accepted accounting principles. Also, in our opinion, the related financial statement schedule, when considered in relation to the basic financial statements taken as a whole, presents fairly in all material respects the information set forth therein.
We have also audited, in accordance with the standards of the Public Company Accounting Oversight Board (United States), Accelrys, Inc.’s internal control over financial reporting as of March 31, 2010, based on the criteria established in Internal Control-Integrated Framework issued by the Committee of Sponsoring Organizations of the Treadway Commission and our report dated May 27, 2010 expressed an unqualified opinion thereon.
/s/ ERNST & YOUNG LLP
San Diego, California
May 27, 2010
43
Table of Contents
Consolidated Balance Sheets
(In thousands, except par value amounts)
| March 31, | ||||||||
| 2010 | 2009 | |||||||
| Assets |
||||||||
| Current assets: |
||||||||
| Cash and cash equivalents |
$ | 77,121 | $ | 40,595 | ||||
| Marketable securities |
10,461 | 20,915 | ||||||
| Trade receivables, net of allowance for doubtful accounts of $163 and $172 as of March 31, 2010 and 2009, respectively |
22,745 | 21,860 | ||||||
| Prepaid expenses, deferred tax asset and other current assets |
5,201 | 3,403 | ||||||
| Total current assets |
115,528 | 86,773 | ||||||
| Marketable securities, net of current portion |
— | 12,703 | ||||||
| Restricted cash and marketable securities |
5,500 | 7,556 | ||||||
| Property and equipment, net |
2,324 | 3,099 | ||||||
| Goodwill |
42,663 | 42,663 | ||||||
| Purchased intangible assets, net |
4,515 | 5,627 | ||||||
| Other assets |
675 | 2,193 | ||||||
| Total assets |
$ | 171,205 | $ | 160,614 | ||||
| Liabilities and stockholders’ equity |
||||||||
| Current liabilities: |
||||||||
| Accounts payable |
$ | 1,823 | $ | 1,411 | ||||
| Accrued liabilities |
4,684 | 4,380 | ||||||
| Accrued compensation and benefits |
10,207 | 9,308 | ||||||
| Current portion of accrued restructuring charges |
109 | 328 | ||||||
| Current portion of deferred revenue |
58,403 | 56,179 | ||||||
| Total current liabilities |
75,226 | 71,606 | ||||||
| Deferred revenue, net of current portion |
2,922 | 1,045 | ||||||
| Deferred tax liability |
2,309 | 1,723 | ||||||
| Accrued restructuring charges, net of current portion |
531 | 664 | ||||||
| Lease-related liabilities, net of current portion |
4,113 | 4,817 | ||||||
| Stockholders’ equity: |
||||||||
| Preferred stock, $.0001 par value; 2,000 shares authorized; no shares issued and outstanding |
— | — | ||||||
| Common stock, $.0001 par value; 60,000 shares authorized; 28,409 and 27,871 shares issued at March 31, 2010 and 2009, respectively |
3 | 3 | ||||||
| Additional paid-in capital |
272,726 | 268,194 | ||||||
| Lease guarantee |
(383 | ) | (446 | ) | ||||
| Treasury stock; 644 shares at March 31, 2010 and 2009 |
(8,340 | ) | (8,340 | ) | ||||
| Accumulated deficit |
(179,365 | ) | (180,560 | ) | ||||
| Accumulated other comprehensive income |
1,463 | 1,908 | ||||||
| Total stockholders’ equity |
86,104 | 80,759 | ||||||
| Total liabilities and stockholders’ equity |
$ | 171,205 | $ | 160,614 | ||||
See accompanying notes to these consolidated financial statements.
44
Table of Contents
Consolidated Statements of Income
(In thousands, except per share amounts)
| Years Ended March 31, | ||||||||||||
| 2010 | 2009 | 2008 | ||||||||||
| Revenue |
$ | 82,959 | $ | 80,981 | $ | 79,739 | ||||||
| Cost of revenue |
14,381 | 15,671 | 15,204 | |||||||||
| Gross margin |
68,578 | 65,310 | 64,535 | |||||||||
| Operating expenses: |
||||||||||||
| Product development |
15,131 | 15,053 | 17,762 | |||||||||
| Sales and marketing |
36,658 | 34,718 | 32,974 | |||||||||
| General and administrative |
15,376 | 14,962 | 14,475 | |||||||||
| Restructuring charges (recoveries) |
(86 | ) | 896 | 179 | ||||||||
| Total operating expenses |
67,079 | 65,629 | 65,390 | |||||||||
| Operating income (loss) |
1,499 | (319 | ) | (855 | ) | |||||||
| Interest and other income, net |
914 | 1,608 | 3,237 | |||||||||
| Income from continuing operations before taxes |
2,413 | 1,289 | 2,382 | |||||||||
| Income tax expense |
1,218 | 1,195 | 1,061 | |||||||||
| Net income |
$ | 1,195 | $ | 94 | $ | 1,321 | ||||||
| Basic and diluted net income per share amounts |
$ | 0.04 | $ | 0.00 | $ | 0.05 | ||||||
| Weighted average shares used to compute basic and diluted net income |
||||||||||||
| Basic |
27,504 | 27,093 | 26,692 | |||||||||
| Diluted |
27,760 | 27,203 | 27,185 | |||||||||
See accompanying notes to these consolidated financial statements.
45
Table of Contents
Consolidated Statements of Stockholders’ Equity
(In thousands)
| Common Stock | Additional Paid-In Capital |
Lease Guarantee |
Treasury Stock | Accumulated Deficit |
Accumulated Other Comprehensive Income (Loss) |
Total Stockholders’ Equity |
||||||||||||||||||||||||
| Shares | Amount | Shares | Amount | |||||||||||||||||||||||||||
| Balance at March 31, 2007 |
27,155 | $ | 3 | $ | 259,435 | $ | (572 | ) | 644 | $ | (8,340 | ) | $ | (182,681 | ) | $ | 1,145 | $ | 68,990 | |||||||||||
| Cumulative impact of change in accounting for uncertainties in income |
— | — | — | — | — | — | 706 | — | 706 | |||||||||||||||||||||
| Balance at April 1, 2007 upon adoption of FIN No. 48 |
27,155 | 3 | 259,435 | (572 | ) | 644 | (8,340 | ) | (181,975 | ) | 1,145 | 69,696 | ||||||||||||||||||
| Comprehensive income: |
||||||||||||||||||||||||||||||
| Net income |
— | — | — | — | — | — | 1,321 | — | 1,321 | |||||||||||||||||||||
| Foreign currency translation adjustment |
— | — | — | — | — | — | — | (257 | ) | (257 | ) | |||||||||||||||||||
| Unrealized gain on marketable securities |
— | — | — | — | — | — | — | (524 | ) | (524 | ) | |||||||||||||||||||
| Total comprehensive income |
— | — | — | — | — | — | — | — | 540 | |||||||||||||||||||||
| Change in value of lease guarantee |
— | — | — | 63 | — | — | — | — | 63 | |||||||||||||||||||||
| Stock-based compensation expense |
— | — | 3,927 | — | — | — | — | — | 3,927 | |||||||||||||||||||||
| Issuance of common stock upon exercise of stock options and under employee stock purchase plan |
281 | — | 656 | — | — | — | — | — | 656 | |||||||||||||||||||||
| Balance at March 31, 2008 |
27,436 | 3 | 264,018 | (509 | ) | 644 | (8,340 | ) | (180,654 | ) | 364 | 74,882 | ||||||||||||||||||
| Comprehensive income: |
||||||||||||||||||||||||||||||
| Net income |
— | — | — | — | — | — | 94 | — | 94 | |||||||||||||||||||||
| Foreign currency translation adjustment |
— | — | — | — | — | — | — | 887 | 887 | |||||||||||||||||||||
| Unrealized loss on marketable securities |
— | — | — | — | — | — | — | (2,219 | ) | (2,219 | ) | |||||||||||||||||||
| Reclassification of unrealized loss on marketable securities to net income |
— | — | — | — | — | — | — | 2,876 | 2,876 | |||||||||||||||||||||
| Total comprehensive income |
— | — | — | — | — | — | — | — | 1,638 | |||||||||||||||||||||
| Change in value of lease guarantee |
— | — | — | 63 | — | — | — | — | 63 | |||||||||||||||||||||
| Stock-based compensation expense |
— | — | 3,460 | — | — | — | — | — | 3,460 | |||||||||||||||||||||
| Issuance of common stock upon exercise of stock options and under employee |
735 | — | 716 | — | — | — | — | — | 716 | |||||||||||||||||||||
| Balance at March 31, 2009 |
27,871 | 3 | 268,194 | (446 | ) | 644 | (8,340 | ) | (180,560 | ) | 1,908 | 80,759 | ||||||||||||||||||
| Comprehensive income: |
||||||||||||||||||||||||||||||
| Net income |
— | — | — | — | — | — | 1,195 | — | 1,195 | |||||||||||||||||||||
| Foreign currency translation adjustment |
— | — | — | — | — | — | — | (470 | ) | (470 | ) | |||||||||||||||||||
| Realized gain on marketable securities |
— | — | — | — | — | — | — | 25 | 25 | |||||||||||||||||||||
| Total comprehensive income |
— | — | — | — | — | — | — | — | 750 | |||||||||||||||||||||
| Change in value of lease guarantee |
— | — | — | 63 | — | — | — | — | 63 | |||||||||||||||||||||
| Stock-based compensation expense |
— | — | 3,932 | — | — | — | — | — | 3,932 | |||||||||||||||||||||
| Issuance of common stock upon exercise of stock options and under employee |
538 | — | 600 | — | — | — | — | — | 600 | |||||||||||||||||||||
| Balance at March 31, 2010 |
28,409 | $ | 3 | $ | 272,726 | $ | (383 | ) | 644 | $ | (8,340 | ) | $ | (179,365 | ) | $ | 1,463 | $ | 86,104 | |||||||||||
See accompanying notes to these consolidated financial statements.
46
Table of Contents
Consolidated Statements of Cash Flows
(In thousands)
| Years Ended March 31, | ||||||||||||
| 2010 | 2009 | 2008 | ||||||||||
| Cash flows from operating activities: |
||||||||||||
| Net income |
$ | 1,195 | $ | 94 | $ | 1,321 | ||||||
| Adjustments to reconcile net income to net cash provided by |
||||||||||||
| Depreciation |
1,530 | 1,895 | 2,192 | |||||||||
| Amortization of purchased intangible assets |
1,225 | 1,871 | 1,525 | |||||||||
| Non-cash stock-based compensation |
3,932 | 3,460 | 3,927 | |||||||||
| Deferred income taxes |
586 | 707 | 341 | |||||||||
| Other |
(1,138 | ) | (547 | ) | (412 | ) | ||||||
| Changes in operating assets and liabilities: |
||||||||||||
| Trade receivables |
(233 | ) | (2,136 | ) | (2,240 | ) | ||||||
| Prepaid expenses and other current assets |
(418 | ) | 368 | (580 | ) | |||||||
| Other assets |
2,002 | 361 | 152 | |||||||||
| Accounts payable |
423 | 290 | 25 | |||||||||
| Accrued liabilities |
719 | 1,665 | (1,063 | ) | ||||||||
| Deferred revenue |
2,642 | 3,836 | (1,013 | ) | ||||||||
| Net cash provided by operating activities |
12,465 | 11,864 | 4,175 | |||||||||
| Cash flows from investing activities: |
||||||||||||
| Purchases of property and equipment, net |
(665 | ) | (920 | ) | (790 | ) | ||||||
| Purchase of software license |
(113 | ) | (1,885 | ) | — | |||||||
| Purchases of marketable securities |
(19,192 | ) | (20,979 | ) | (13,758 | ) | ||||||
| Proceeds from maturities of marketable securities |
42,977 | 1,147 | 27,497 | |||||||||
| Net cash provided by (used in) investing activities |
23,007 | (22,637 | ) | 12,949 | ||||||||
| Cash flows from financing activities: |
||||||||||||
| Proceeds from issuance of common stock |
600 | 716 | 656 | |||||||||
| Net cash provided by financing activities |
600 | 716 | 656 | |||||||||
| Effect of changes in exchange rates on cash and cash equivalents |
454 | (2,474 | ) | 2,099 | ||||||||
| Increase (decrease) in cash and cash equivalents |
36,526 | (12,531 | ) | 19,879 | ||||||||
| Cash and cash equivalents at beginning of year |
40,595 | 53,126 | 33,247 | |||||||||
| Cash and cash equivalents at end of year |
$ | 77,121 | $ | 40,595 | $ | 53,126 | ||||||
| Supplemental cash flow information: |
||||||||||||
| Cash paid during the year for income taxes |
$ | 831 | $ | 603 | $ | 1,115 | ||||||
See accompanying notes to these consolidated financial statements.
47
Table of Contents
Notes to Consolidated Financial Statements
| 1. | Organization and Description of Business |
Accelrys, Inc. (“we”, “our”, or “us”) develops and commercializes scientific business intelligence software for the integration, mining, analysis, modeling and simulation, management and interactive reporting of scientific data. Our solutions are used by biologists, chemists, materials scientists, and information technology professionals for product design as well as drug discovery and development.
| 2. | Significant Accounting Policies |
Principles of Consolidation
These consolidated financial statements include our accounts and those of our wholly-owned subsidiaries. All intercompany balances and transactions have been eliminated in consolidation.
Use of Estimates
The preparation of financial statements in conformity with accounting principles generally accepted in the U.S. requires management to make estimates and assumptions that affect the reported amounts of assets, liabilities, revenues and expenses, and the disclosure of contingent assets and liabilities. On an on-going basis, we evaluate our estimates, including those related to income taxes and the valuation of marketable securities, goodwill, intangibles other long-lived assets and lease guarantee liability. We base our estimates on historical experience and on various other assumptions that we believe to be reasonable under the circumstances. Actual future results could differ from those estimates.
Cash and Cash Equivalents
We consider all highly liquid investments with an original maturity of three months or less to be cash equivalents. We invest our cash with financial institutions in money market funds and other investment grade securities such as certificates of deposits.
Marketable Securities
Our marketable securities consist of debt securities with original maturities of greater than three months and include obligations of U.S. government sponsored enterprises, certificates of deposits and auction rate securities (“ARS”). We account for our investments in marketable securities in accordance with Financial Accounting Standards Board (“FASB”) Accounting Standards Codification (“ASC”) Topic 320, Investments—Debt and Equity Securities (“ASC Topic 320”). Accordingly, our marketable securities have been classified as available-for-sale and are recorded at their estimated fair value. Unrealized losses which are not considered other than temporary and unrealized gains are included in accumulated other comprehensive income in stockholders’ equity. Unrealized losses which are determined to be other than temporary are recorded as a charge against income. The cost of marketable securities sold is determined based on the specific identification method.
Marketable securities consist of the following:
| Amortized Cost |
Gross Unrealized Gains |
Gross Unrealized Losses |
Fair Value | |||||||||
| (In thousands) | ||||||||||||
| March 31, 2010: |
||||||||||||
| Auction rate securities |
$ | 10,461 | $ | — | $ | — | $ | 10,461 | ||||
| $ | 10,461 | $ | — | $ | — | $ | 10,461 | |||||
48
Table of Contents
Accelrys, Inc.
Notes to Consolidated Financial Statements (Continued)
| Amortized Cost |
Gross Unrealized Gains |
Gross Unrealized Losses |
Fair Value | ||||||||||
| (In thousands) | |||||||||||||
| March 31, 2009: |
|||||||||||||
| Certificates of deposit |
$ | 20,940 | $ | — | $ | (25 | ) | $ | 20,915 | ||||
| Auction rate securities |
12,703 | — | — | 12,703 | |||||||||
| $ | 33,643 | $ | — | $ | (25 | ) | $ | 33,618 | |||||
The contractual maturities of our marketable securities at March 31, 2010 are as follows (in thousands):
| Due within one year |
$ | — | |
| Due in one to five years |
— | ||
| Due in five to ten years |
— | ||
| Due after ten years |
10,461 | ||
| $ | 10,461 | ||
ARS have been included in the above contractual maturities table based on the stated maturity date of the bond.
We assess our marketable securities for impairment under the guidance provided by ASC Topic 320. Accordingly, we review the fair value of our marketable securities at least quarterly to determine if declines in the fair value of individual securities are other-than-temporary in nature. If we believe the decline in the fair value of an individual security is other-than-temporary, we write-down the carrying value of the security to its estimated fair value, with a corresponding charge against income. To determine if a decline in the fair value of an investment is other-than-temporary, we consider several factors including, among others, the period of time and extent to which the estimated fair value has been less than cost, overall market conditions, the historical and projected future financial condition of the issuer of the security and our ability and intent to hold the security for a period of time sufficient to allow for a recovery of the market value.
As of March 31, 2010, we held $11.8 million in ARS at face value, which are collateralized by student loans, most of which were originated under the Federal Family Education Loan Program and are guaranteed by the United States Federal Department of Education. All of our ARS are AAA rated (or equivalent) by one or more of the major credit rating agencies.
Through February 2008, the par value of our ARS had approximated fair value due to the frequent auction periods, generally every 7 to 28 days, which provided liquidity to these investments. However, since February 2008, all auctions for the ARS we hold have failed as the amount of ARS submitted for sale has exceeded the amount of purchase orders. The result of a failed auction is that these ARS continue to pay interest at contractually stated rates at each respective auction date; however, the liquidity of the ARS will be limited until there is a successful auction, the issuer redeems the ARS, the ARS mature or until such time as other markets for these ARS develop. We have concluded that the estimated fair value of the ARS no longer approximates the par value due to the lack of liquidity. The ARS have been classified within Level 3 under ASC Topic 820, Fair Value Measurements and Disclosures. Their valuation requires substantial judgment and estimation of factors that are not currently observable in the market due to the lack of trading in the ARS.
We estimated the fair value of our ARS utilizing a discounted cash flow analysis as of March 31, 2010. The analysis considered, among other items, the collateralization underlying the security investments, the creditworthiness of the issuer, expected future cash flows and the estimated weighted average life of the
49
Table of Contents
Accelrys, Inc.
Notes to Consolidated Financial Statements (Continued)
contractual maturity of the underlying assets. Due to entering into an agreement whereby one of our investment firms (the “Investment Firm”) will repurchase our ARS at par value, as discussed further below, we no longer intend to hold the securities to maturity and have determined that the decline in value of our ARS as of March 31, 2010 is other-than-temporary. Accordingly, in fiscal year 2009 we reversed prior unrealized losses on our ARS from accumulated other comprehensive income and recorded the losses as a charge to income during the same period. The gain recognized for the change in fair value of the ARS was $0.2 million for the year ended March 31, 2010.
On November 11, 2008 (the “Acceptance Date”), we entered into an agreement (the “ARS Agreement”) with the Investment Firm pursuant to which the Investment Firm has agreed to repurchase all of our ARS at par value. By accepting the ARS Agreement, we (1) received the right to sell our ARS at par value to the Investment Firm between June 30, 2010 and July 2, 2012 (the “Put Option”) and (2) gave the Investment Firm the right to purchase the ARS from us at any time after the Acceptance Date as long as we receive par value.
The ARS Agreement covers ARS with a par value of $11.8 million and a fair value of $10.5 million as of March 31, 2010. We have accounted for the Put Option as a freestanding financial instrument and elected to record the value under the fair value option of ASC Topic 825, Financial Instruments. This resulted in our recording a $1.3 million asset with a corresponding credit to income for the value of the Put Option. We estimated the fair value of the Put Option utilizing a discounted cash flow analysis as of March 31, 2010. The analysis considered, among other items, the collateralization underlying the security investments, the creditworthiness of the issuer, expected future cash flows and the remaining life of the ARS Agreement with the Investment Firm.
The combined gain on the ARS and Put Option of $0.2 million for the year ended March 31, 2010 is recorded in the “Interest and other income, net” line in the accompanying consolidated statement of income. As we have the right to put our ARS to the Investment Firm beginning June 30, 2010 and we intend to so, the ARS and the Put Option are classified as current assets on our consolidated balance sheet as of March 31, 2010.
Allowance for Doubtful Accounts
We maintain an allowance for doubtful accounts for estimated losses resulting from the inability of our customers to make required payments on accounts receivable. This estimate is based on a specific customer analysis and an analysis of our historical write-offs as a percent of outstanding accounts receivable balances. If the financial condition of a customer were to deteriorate, resulting in an impairment of its ability to make payments against outstanding balances owed to us, an additional allowance may be required.
Fair Value of Financial Instruments
We carry our cash equivalents, marketable securities and restricted marketable securities at market value. The carrying amount of accounts receivable, accounts payable and accrued liabilities are considered to be representative of their respective fair values due to their short-term nature.
50
Table of Contents
Accelrys, Inc.
Notes to Consolidated Financial Statements (Continued)
Property and Equipment
Property and equipment, stated at cost, consists of the following:
| Useful Lives (Yrs) | March 31, | |||||||||
| 2010 | 2009 | |||||||||
| (In thousands) | ||||||||||
| Computers and software |
2-3 | $ | 10,954 | $ | 11,242 | |||||
| Furniture and fixtures |
3 | 860 | 836 | |||||||
| Leasehold improvements |
5-10 | 3,492 | 3,415 | |||||||
| 15,306 | 15,493 | |||||||||
| Less accumulated depreciation and amortization |
(12,982 | ) | (12,394 | ) | ||||||
| $ | 2,324 | $ | 3,099 | |||||||
During fiscal year 2010 we wrote off the cost and associated accumulated depreciation of approximately $1.2 million of fully depreciated assets which were no longer in use. Depreciation is provided on the straight-line method over the estimated useful lives of the related assets. Leasehold improvements are amortized over the shorter of their estimated useful lives or the remaining lease term. Repair and maintenance costs are charged to expense as incurred.
Software Development Costs
We account for costs incurred for computer software to be sold in accordance with ASC Topic 985, Software. Accordingly, costs incurred internally in the research and development of new software products and significant enhancements to existing software products are expensed as incurred until the technological feasibility of the product has been established. Technological feasibility occurs shortly before our internally developed software products are available for general release. We have determined that the internal costs eligible for capitalization are not material. Costs paid to third parties for products in which technological feasibility has been established are capitalized upon purchase of the software.
At March 31, 2010 and 2009, we had $2.0 million and $1.9 million, respectively, of capitalized software purchased from third parties. This amount is included in purchased intangible assets, net, in the accompanying consolidated balance sheet. These costs are being amortized to cost of revenue on a straight-line basis over their estimated useful life of five years. Amortization expense was approximately $0.4 million and $0.3 million for the years ended March 31, 2010 and 2009, respectively.
51
Table of Contents
Accelrys, Inc.
Notes to Consolidated Financial Statements (Continued)
Goodwill and Purchased Intangible Assets
Intangible assets consist of the following:
| March 31, 2010 | March 31, 2009 | |||||||||||||||
| Weighted Average Life (yrs) |
Gross Carrying Amount |
Accumulated Amortization |
Weighted Average Life (yrs) |
Gross Carrying Amount |
Accumulated Amortization | |||||||||||
| (In thousands) | (In thousands) | |||||||||||||||
| Intangible assets subject to amortization: |
||||||||||||||||
| Purchased technology |
5 | $ | 6,750 | $ | 6,750 | 5 | $ | 6,750 | $ | 6,075 | ||||||
| Purchased customer relationships |
10 | 1,650 | 907 | 10 | 1,650 | 741 | ||||||||||
| Purchased backlog |
2.25 | 550 | 550 | 2.25 | 550 | 550 | ||||||||||
| Purchased contract base |
5 | 50 | 50 | 5 | 50 | 45 | ||||||||||
| Purchased intellectual property |
5 | 1,998 | 726 | — | 1,885 | 347 | ||||||||||
| $ | 10,998 | $ | 8,983 | $ | 10,885 | $ | 7,758 | |||||||||
| Intangible assets not subject to amortization: |
||||||||||||||||
| Purchased trademark/tradename |
$ | 2,500 | $ | 2,500 | ||||||||||||
Intangible assets are amortized using the straight-line method over their estimated useful lives. Intangible asset amortization expense totaled $1.2 million, $1.9 million and $1.5 million, for the years ended March 31, 2010, 2009 and 2008, respectively.
Future estimated amortization expense for intangible assets as of March 31, 2010 for each of the succeeding five years is as follows (in thousands):
| Fiscal Year 2011 |
$ | 569 | |
| Fiscal Year 2012 |
569 | ||
| Fiscal Year 2013 |
569 | ||
| Fiscal Year 2014 |
223 | ||
| Fiscal Year 2015 |
85 |
In accordance with ASC Topic 350, Intangibles—Goodwill and Other (“ASC Topic 350”), we review our goodwill and indefinite-lived intangible asset for impairment at least annually in our fiscal fourth quarter and more frequently if events or changes in circumstances occur that indicate a potential reduction in the fair value of our reporting unit and/or our indefinite-lived intangible asset below their respective carrying values. Examples of such events or circumstances include: a significant adverse change in legal factors or in the business climate, a significant decline in our stock price, a significant decline in our projected revenue or cash flows, an adverse action or assessment by a regulator, unanticipated competition, a loss of key personnel, or the presence of other indicators that would indicate a reduction in the fair value of a reporting unit.
Our goodwill is considered to be impaired if we determine that the carrying value of the reporting unit to which the goodwill has been assigned exceeds management’s estimate of its fair value. Based on the guidance provided by ASC Topic 350 and ASC Topic 280, Segment Reporting, (“ASC Topic 280”) management has determined that our company consists of one reporting unit given the similarities in economic characteristics between our operations and the common nature of our products, services and customers. Because we have only one reporting unit, and because we are publicly traded, we determine the fair value of the reporting unit based on our market capitalization as we believe this represents the best evidence of fair value. In the fourth quarter of
52
Table of Contents
Accelrys, Inc.
Notes to Consolidated Financial Statements (Continued)
fiscal year 2010, we completed our annual goodwill impairment test for fiscal year 2010 and concluded that our goodwill was not impaired. Our conclusion that goodwill was not impaired was based on a comparison of our net assets as of March 31, 2010 to our market capitalization.
Our indefinite-lived intangible asset is considered to be impaired if we determine that the carrying value of the asset exceeds its estimated fair value. In the fourth quarter of fiscal year 2010, we completed our annual indefinite-lived intangible asset impairment test and concluded that our indefinite-lived intangible asset was not impaired. We estimated the fair value of our indefinite-lived intangible asset utilizing a discounted cash flow analysis which considers the estimated future customer orders for our scientific informatics platform product line and the associated direct and incremental selling, marketing and development costs. Key assumptions included in the discounted cash flow analysis include projections of future customer order growth for our scientific informatics platform product line and developing an appropriate discount rate.
Impairment of Long-Lived Assets
In accordance with ASC Topic 350 and ASC Topic 360, Property, Plant and Equipment, we review long-lived assets to be held and used, including acquired intangible assets subject to amortization and property and equipment, for impairment whenever events or changes in circumstances indicate that the carrying amount of the assets may not be fully recoverable. Conditions that would necessitate an impairment assessment include a significant decline in the market price of an asset or asset group, a significant adverse change in the extent or manner in which an asset or asset group is being used, the loss of legal ownership or title to the asset, significant negative industry or economic trends or the presence of other indicators that would indicate that the carrying amount of an asset or asset group is not recoverable. An asset is considered to be impaired if management’s estimate of the undiscounted future cash flows anticipated to result from the use of the asset and its eventual disposition are not sufficient to recover the carrying value of the asset.
Revenue Recognition
We generate revenue from the following primary sources:
| • | software licenses, |
| • | post-contract customer support and maintenance services on licensed software, collectively referred to as PCS, and |
| • | professional services. |
Customer billings generated in connection with our revenue-generating activities are initially recorded as deferred revenue. We then recognize the revenue from these customer billings as set forth below and when all of the following criteria are met:
| • | a fully executed written contract and/or purchase order has been obtained from the customer (i.e., persuasive evidence of an arrangement exists), |
| • | the contractual price of the product or service has been defined and agreed to in the contract (i.e., price is fixed or determinable), |
| • | delivery of the product or service has occurred and no material uncertainties regarding customer acceptance of the delivered product or service exist, and |
| • | collection of the purchase price from the customer is considered probable. |
53
Table of Contents
Accelrys, Inc.
Notes to Consolidated Financial Statements (Continued)
Software Licenses. We license software predominantly on a term basis. When sold perpetually, our standard perpetual software licensing arrangements include twelve months of PCS, while our standard term-based software licensing arrangements typically include PCS for the full duration of the term license. Because we do not have vendor specific objective evidence of the fair value of these undelivered elements, we recognize as revenue the entire fee for such perpetual and term-based licenses ratably over the term of the PCS.
Renewal of PCS Under Perpetual Software Licenses. Our PCS includes the right to receive unspecified upgrades or enhancements and technical support. Fees from customer renewals of PCS related to previously purchased perpetual licenses are recognized ratably over the term of the PCS.
Professional Services. We provide certain services to our customers, including non-complex product training, installation, implementation and other professional services which are non-essential to the operation of the software. We also perform professional services for our customers designed to enhance the value of our software products by creating extensions to functionality to address a client’s specific business needs. When sold separately, revenue from these services is recorded under the proportional performance or completed performance method.
Multi-Element Arrangements. For multi-element arrangements which include software licenses, PCS and non-complex training, installation and implementation services which are non-essential to the operation of the software, the entire revenue and cost of revenue for such arrangements are recognized as revenue ratably over the term of the PCS or the delivery of the services, whichever is longer. For multi-element arrangements which also include services that are essential to the operation of the software, the revenue and cost of revenue for such arrangements are generally deferred until the services essential to the operation of the software have been performed, at which point the entire revenue and cost of revenue for such arrangements are recognized as revenue ratably over the remaining term of the PCS or the delivery of the non-essential services, whichever is longer.
Sales Taxes Collected
Sales taxes collected from customers and remitted to various governmental agencies are excluded from revenues in our consolidated statements of income.
Shipping Costs
The costs of shipping products to our customers are expensed as incurred and are included in cost of revenue in our consolidated statements of income. We incurred $0.3 million in shipping costs during the year ended March 31, 2010 and $0.4 million in each of the years ended March 31, 2009 and 2008.
Advertising Costs
The costs of advertising are expensed as incurred and are included in sales and marketing expenses in our consolidated statements of income. We incurred $0.3 million in advertising costs for the year ended March 31, 2010 and $0.1 million in advertising costs for each of the years ended March 31, 2009 and 2008.
Foreign Currency Translation
In accordance with ASC Topic 830, Foreign Currency Matters, we translate the financial statements of our foreign subsidiaries into U.S. dollars using period-end exchange rates for assets and liabilities and average exchange rates during each reporting period for results of operations. Gains and losses resulting from foreign currency translation are excluded from results of operations and recorded as accumulated other comprehensive income in stockholders’ equity.
54
Table of Contents
Accelrys, Inc.
Notes to Consolidated Financial Statements (Continued)
Gains and losses resulting from the cash settlement of certain intercompany transactions as well as transactions with customers and vendors that are denominated in currencies other than the functional currency of each entity give rise to foreign exchange gains. These foreign exchange gains are included in interest and other income, net in our consolidated statements of income and totaled $0.4 million, $0.3 million and $0.2 million for the years ended March 31, 2010, 2009 and 2008, respectively.
Concentrations of Risk
We maintain deposits in federally insured financial institutions in excess of federally insured limits. We do not believe we are exposed to significant credit risk due to the financial position of the depository institutions in which those deposits are held. Additionally, we have established guidelines regarding diversification of our investment portfolio, credit quality of issuers and maturities of investments, which are designed to maintain the safety and liquidity of our deposits and investments.
As of March 31, 2010, we held $11.8 million in ARS which we are unable to liquidate due to deterioration in global credit markets. See the discussion under the heading “Marketable Securities” for further information on our current ARS holdings.
In addition to our U.S. operations, we conduct business in Europe and in the Asia/Pacific region, primarily in Japan. Any significant decline in the economies or the value of the currencies in these regions could have a material adverse impact on us.
Income Taxes
We account for income taxes in accordance with ASC Topic 740, Income Taxes (“ASC Topic 740”). Accordingly, deferred tax assets and liabilities are recognized for the tax consequences of temporary differences between the financial carrying amounts and the tax basis of existing assets and liabilities by applying enacted statutory tax rates applicable to future years. The provision for income taxes is based on our estimates for taxable income of the various legal entities and jurisdictions in which we operate. As such, income tax expense may vary from the customary relationship between income tax expense and pre-tax accounting income. We establish a valuation allowance against our net deferred tax assets to reduce deferred tax assets to the amount expected to be realized.
Despite our belief that our tax return positions are consistent with applicable tax laws, we acknowledge that certain positions may be challenged by taxing authorities. Settlement of any challenge can result in no change, a complete disallowance, or a partial adjustment reached through negotiations or litigation. Significant judgment is required in evaluating our tax reserves. Our reserves are adjusted in light of changing facts and circumstances, such as the progress of our tax audits. Our income tax expense includes the impact of reserve provisions and changes to reserves that we consider appropriate, as well as related interest and penalties. Favorable resolution of such an income tax matter would be recognized as a reduction to income tax expense.
We adopted the provisions of ASC Topic 740 as it relates to uncertain tax positions effective April 1, 2007. ASC Topic 740 prescribes a recognition threshold and measurement attribute for the financial statement recognition and measurement of a tax position taken or expected to be taken in a tax return. ASC Topic 740 requires that we determine whether the benefits of our tax positions are more-likely-than-not of being sustained upon audit based on the technical merits of the tax position. We recognize the impact of an uncertain income tax position taken on our income tax return at the largest amount that is more-likely-than-not to be sustained upon audit by the relevant taxing authority. An uncertain income tax position is not recognized if it has less than a 50% likelihood of being sustained. See Note 4 for additional information on our adoption of the provisions of ASC Topic 740.
55
Table of Contents
Accelrys, Inc.
Notes to Consolidated Financial Statements (Continued)
Interest and penalties related to income tax matters are recognized in income tax expense. During the years ended March 31, 2010, 2009 and 2008 we did not incur any expense related to interest or penalties for income tax matters, and no such amounts were accrued as of March 31, 2010.
Net Income Per Share
We compute net income per share pursuant to ASC Topic 260, Earnings Per Share. Accordingly, basic net income per share and diluted net loss per share are computed by dividing the net income for the period by the weighted average number of common shares outstanding during the period, without consideration for common stock equivalents. Diluted net income per share is computed by dividing the net income for the period by the weighted average number of common stock and common stock equivalents outstanding during the period. Potentially dilutive common stock equivalents consist of in-the-money common stock options and unvested restricted stock units (“RSUs”).
| Years ended March 31, | |||||||||
| 2010 | 2009 | 2008 | |||||||
| (In thousands, except per share amounts) | |||||||||
| Numerator: |
|||||||||
| Net income |
$ | 1,195 | $ | 94 | $ | 1,321 | |||
| Denominator: |
|||||||||
| Weighted average common shares outstanding |
27,504 | 27,093 | 26,692 | ||||||
| Dilutive potential common stock equivalents |
256 | 110 | 493 | ||||||
| Weighted average shares and dilutive potential common shares |
27,760 | 27,203 | 27,185 | ||||||
| Basic and diluted net income per share: |
$ | 0.04 | $ | 0.00 | $ | 0.05 | |||
Potentially dilutive common stock equivalents that were excluded from the basic and diluted net loss per share calculations as their effect would be anti-dilutive totaled approximately 3.1 million shares for each of the years ended March 31, 2010 and 2009, and 2.6 million shares for the year ended March 31, 2008.
Share Based Compensation
We account for our share-based awards in accordance with ASC Topic 718, Compensation—Stock Compensation (“ASC Topic 718”). We estimate the fair value of our share-based stock awards on the date of grant using the Black-Scholes option-pricing model. The Black-Scholes option-pricing model requires the use of certain input variables, which are further discussed in Note 3.
Segment and Geographic Information
In accordance with ASC Topic 280, our operations have been aggregated into one reportable segment given the similarities in economic characteristics between our operations and the common nature of our products, services and customers.
56
Table of Contents
Accelrys, Inc.
Notes to Consolidated Financial Statements (Continued)
Financial information by geographic region is as follows:
| Years Ended | ||||||||||||||||||
| March 31, 2010 | March 31, 2009 | March 31, 2008 | ||||||||||||||||
| Amount | Percentage of Total |
Amount | Percentage of Total |
Amount | Percentage of Total |
|||||||||||||
| (In thousands, except percentages) | ||||||||||||||||||
| Revenues: |
||||||||||||||||||
| U.S. |
$ | 38,208 | 46 | % | $ | 39,126 | 48 | % | $ | 38,935 | 49 | % | ||||||
| Europe |
25,001 | 30 | % | 22,754 | 28 | % | 23,139 | 29 | % | |||||||||
| Asia-Pacific |
19,750 | 24 | % | 19,101 | 24 | % | 17,665 | 22 | % | |||||||||
| Total |
$ | 82,959 | 100 | % | $ | 80,981 | 100 | % | $ | 79,739 | 100 | % | ||||||
| As of March 31 | ||||||||||||||||||
| 2010 | 2009 | 2008 | ||||||||||||||||
| Amount | Percentage of Total |
Amount | Percentage of Total |
Amount | Percentage of Total |
|||||||||||||
| (In thousands, except percentages) | ||||||||||||||||||
| Long-lived assets: |
||||||||||||||||||
| U.S. |
$ | 48,195 | 97 | % | $ | 50,005 | 97 | % | $ | 50,727 | 95 | % | ||||||
| Europe |
1,285 | 3 | % | 1,325 | 3 | % | 2,158 | 4 | % | |||||||||
| Asia-Pacific |
363 | — | % | 399 | — | % | 482 | 1 | % | |||||||||
| Total |
$ | 49,843 | 100 | % | $ | 51,729 | 100 | % | $ | 53,367 | 100 | % | ||||||
Comprehensive Income
In accordance with ASC Topic 220, Comprehensive Income, we report the components of comprehensive income, including net income, in the financial statements in the period in which they are recognized. Comprehensive income is defined as all changes in equity during a period from non-owner sources, including foreign currency translation adjustments and unrealized gains and losses on marketable securities. We present comprehensive income in our consolidated statements of stockholders’ equity. Accumulated other comprehensive income in stockholders’ equity consists of the following:
| March 31, | |||||||
| 2010 | 2009 | ||||||
| (In thousands) | |||||||
| Foreign currency translation adjustment |
$ | 1,463 | $ | 1,933 | |||
| Unrealized loss on marketable securities |
— | (2,901 | ) | ||||
| Reclassification of unrealized losses to net income |
— | 2,876 | |||||
| $ | 1,463 | $ | 1,908 | ||||
Guarantees
We account for guarantees in accordance with ASC Topic 460, Guarantees (“ASC Topic 460”). ASC Topic 460 requires that a guarantor recognize, at the inception of a guarantee, a liability for the fair value of certain guarantees and requires certain disclosures to be made by a guarantor about its obligations under certain guarantees that it has issued.
57
Table of Contents
Accelrys, Inc.
Notes to Consolidated Financial Statements (Continued)
Effect of New Accounting Standards
In January 2010, the FASB issued ASC 820-10-65-7, Improving Disclosures about Fair Value Measurements. This guidance requires additional disclosures for fair value measurements including the following: 1) amounts transferred in and out of Level 1 and 2 fair value measurements, which is effective for interim and annual reporting periods beginning after December 15, 2009 and 2) activities in Level 3 fair value measurements including purchases, sales, issuances, and settlements, which is effective for interim and annual reporting periods beginning after December 15, 2010. The adoption of the revised guidance related to amounts transferred in and out of Level 1 and 2 fair value measurements did not have a significant impact on our financial statement disclosures, and we do not believe that the adoption of the revised guidance related to Level 3 activities will have a material impact on our financial statement disclosures.
In September 2009, the FASB issued ASC 605-25-65-1, Multiple-Deliverable Revenue Arrangements. The new guidance states that if vendor specific objective evidence or third party evidence for deliverables in an arrangement cannot be determined, companies will be required to develop a best estimate of the selling price to separate deliverables and allocate arrangement consideration using the relative selling price method. The new guidance is effective for revenue arrangements entered into or materially modified in fiscal years beginning on or after June 15, 2010. Early adoption is permitted. We are currently evaluating the impact this guidance may have on our results of operations, financial position and cash flows.
In September 2009, the FASB issued ASC 985-605-65-1, Certain Revenue Arrangements That Include Software Elements. Previously, companies that sold tangible products with “more than incidental” software were required to apply software revenue recognition guidance. This guidance often delayed revenue recognition for the delivery of the tangible product. Under the new guidance, tangible products that have software components that are “essential to the functionality” of the tangible product will be excluded from the software revenue recognition guidance. The new guidance will include factors to help companies determine what is “essential to the functionality” of the tangible product. Software-enabled products will now be subject to other revenue guidance and will likely follow the guidance for multiple deliverable arrangements issued by the FASB in September 2009. The new guidance is effective for revenue arrangements entered into or materially modified in fiscal years beginning on or after June 15, 2010. Early adoption is permitted. We are currently evaluating the impact this guidance may have on our results of operations, financial position and cash flows.
During the quarter ended September 30, 2009, we adopted ASC 105-10-65-1, The FASB Accounting Standards Codification and the Hierarchy of Generally Accepted Accounting Principles. The ASC has become the source of authoritative GAAP recognized by the FASB to be applied by nongovernmental entities. The ASC is not intended to change or alter existing GAAP. The adoption of this guidance did not have a material impact on our results of operations, financial position or cash flows.
During the quarter ended June 30, 2009, we adopted ASC 855-10-45-1, Subsequent Events. This new accounting guidance establishes general standards of accounting for, and requires disclosure of, events that occur after the balance sheet date but before financial statements are issued or are available to be issued. The FASB further revised this guidance in February 2010 to conform to current SEC regulations. The adoption of this guidance did not have a material impact on our results of operations, financial position or cash flows.
During the quarter ended June 30, 2009, we adopted ASC 825-10-65-1, Interim Disclosures about Fair Value of Financial Instruments, and ASC 820-10-65-4, Determining Fair Value When the Volume and Level of Activity for the Asset or Liability Have Significantly Decreased and Identifying Transactions That Are Not Orderly. This new accounting guidance as issued by the FASB which requires disclosures about fair value of financial instruments in interim reporting periods, provides additional guidance for estimating fair value when
58
Table of Contents
Accelrys, Inc.
Notes to Consolidated Financial Statements (Continued)
the volume and level of activity for the asset or liability have significantly decreased, provides guidance when a transaction is not deemed an orderly transaction, and provides guidance related to the determination of other-than-temporary impairments to include the intent and ability of the holder as an indicator in the determination of whether an other-than-temporary impairment exists. The adoption of this guidance did not have a material impact on our results of operations, financial position or cash flows.
During the quarter ended June 30, 2009, we adopted ASC 350-30-65-1, Determination of the Useful Life of Intangible Assets. The new guidance amends the factors that should be considered in developing renewal or extension assumptions used to determine the useful life of a recognized intangible asset. The intent of this pronouncement is to improve the consistency between the useful life of a recognized intangible asset and the period of expected cash flows used to measure the fair value of the asset under other GAAP. The adoption of this guidance did not have a material impact on our results of operations, financial position or cash flows.
During the quarter ended June 30, 2009, we adopted ASC 820-10-65-1, Effective Date of FASB Statement No. 157. This new accounting guidance as issued by the FASB delayed the effective date of fair value accounting for all non-financial assets and non-financial liabilities by one year, except those recognized or disclosed at fair value in the financial statements on a recurring basis. The adoption of this guidance did not have a material impact on our results of operations, financial position or cash flows.
| 3. | Share-Based Payments |
Share-Based Compensation Plans
On August 2, 2005, our stockholders approved the Amended and Restated 2004 Stock Incentive Plan (the “2004 Plan”). The 2004 Plan authorizes the grant of equity awards to purchase the number of shares of our common stock equal to the sum of (i) 1,900,000 shares and (ii) the number of shares of common stock underlying any stock awards granted under certain prior share-based compensation plans that expire or are cancelled or forfeited without having been exercised in full or that are repurchased by us. Potential types of equity awards that may be granted under the 2004 Plan to our officers, directors, employees and consultants include stock options, RSUs, restricted stock awards, common stock awards, stock appreciation rights, performance awards and deferred stock units. Pursuant to the 2004 Plan, any shares of common stock that are awarded under the 2004 Plan as RSUs, restricted stock awards, common stock awards, performance awards or deferred stock units (but not as stock options or stock appreciation rights) are counted against the maximum number of shares of common stock available for issuance under the 2004 Plan based on a 1.15-to-1 ratio. The terms and conditions of specific awards are set at the discretion of our board of directors although generally awards vest over not more than four years, expire no later than ten years from the date of grant and do not have exercise prices less than the fair market value of the underlying common stock on the date of grant. At March 31, 2010, approximately 1,183,000 shares of our common stock remain available for issuance pursuant to awards granted under the 2004 Plan.
On August 2, 2005, our stockholders also approved the 2005 Employee Stock Purchase Plan (the “ESPP”), under which we have reserved 1,000,000 shares of our common stock for issuance. Under the ESPP, employees may defer up to 10% of their base salary to purchase shares of our common stock, up to a maximum of 1,000 shares per offering period. The purchase price of the common stock is equal to 85% of the lower of the fair market value per share of our common stock on the commencement date of the applicable offering period or the applicable purchase date. To date, we have issued 505,000 shares under the ESPP and 495,000 shares remain available for future issuance under the ESPP as of March 31, 2010.
We also maintain certain other share-based compensation plans, pursuant to which we have not granted awards during fiscal year 2010 and do not intend to grant any further awards in the future. Notwithstanding the foregoing, we also entered into a Stock Option Agreement, dated June 15, 2009 (the “Carnecchia Option
59
Table of Contents
Accelrys, Inc.
Notes to Consolidated Financial Statements (Continued)
Agreement”), with Max Carnecchia, our President and Chief Executive Officer. Pursuant to the Carnecchia Option Agreement, we granted Mr. Carnecchia an option to purchase up to 800,000 shares of our common stock, at an exercise price equal to the fair market value of the stock as of the date of the grant. Subject to certain acceleration provisions in the event of a change of control or Mr. Carnecchia’s death or disability, the option will vest over four years with 200,000 shares vesting on the first anniversary of the grant date, and the remaining 600,000 shares vesting in equal monthly installments over the three-year period thereafter.
Our share-based compensation plans contain a provision that allows eligible participants to continue to vest in their stock options upon their retirement, as that term is defined in the plans. To be eligible for continued vesting, participants must be at least 55 years of age and have 5 years of service at the time of their retirement. Beginning in fiscal year 2008, we no longer offered this retirement benefit for grants of RSUs or stock options.
Share-Based Award Activity
Our stock options generally vest over four years and have a contractual term of 10 years. A summary of stock option activity under our share-based compensation plans is as follows:
| Number of Shares |
Weighted Average Exercise Price |
Aggregate Intrinsic Value |
Weighted Average Remaining Contractual Life | ||||||||
| (In thousands, except per share amounts and years) | |||||||||||
| Outstanding at April 1, 2009 |
2,935 | $ | 7.15 | ||||||||
| Granted |
1,839 | 5.70 | |||||||||
| Exercised |
(135 | ) | 5.40 | ||||||||
| Expired/Forfeited |
(1,095 | ) | 7.38 | ||||||||
| Outstanding at March 31, 2010 |
3,544 | $ | 6.39 | $ | 1,425 | 7.07 | |||||
| Exercisable at March 31, 2010 |
1,585 | $ | 7.25 | $ | 443 | 4.49 | |||||
The aggregate intrinsic value of stock options outstanding and exercisable at March 31, 2010 was based on the closing price of our common stock on March 31, 2010 of $6.16 per share. The total cash received from the exercise of stock options during the year ended March 31, 2010 was $0.7 million.
In fiscal year 2010, we granted RSUs under the 2004 Plan that vest annually over three years and, once vested, do not expire. A summary of RSU activity under our share-based compensation plans is as follows:
| Number of Shares |
Weighted Average Grant Date Fair Value | |||||
| (In thousands, except per share amounts) | ||||||
| Unvested at April 1, 2009 |
1,055 | $ | 5.72 | |||
| Granted |
489 | 5.85 | ||||
| Vested |
(343 | ) | 5.44 | |||
| Forfeited |
(251 | ) | 6.80 | |||
| Unvested at March 31, 2010 |
950 | $ | 5.60 | |||
Included in the vested shares for the period are approximately 102,000 shares tendered to us by employees for payment of minimum income tax obligations upon vesting of RSUs.
60
Table of Contents
Accelrys, Inc.
Notes to Consolidated Financial Statements (Continued)
Valuation of Share-Based Awards
We estimate the fair value of our share-based awards on the date of grant using the Black-Scholes option-pricing model. The Black-Scholes option-pricing model requires the use of certain input variables, as follows:
Expected Volatility. Volatility is a measure of the amount the stock price will fluctuate during the expected life of an award. We determine volatility based on our historical stock price volatility over the most recent period equivalent to the expected life of the award, giving consideration to company-specific events impacting historical volatility that are unlikely to occur in the future, as well as anticipated future events that may impact volatility. We also consider the historical stock price volatilities of comparable publicly traded companies.
Risk-Free Interest Rate. Our assumption of the risk-free interest rate is based on the interest rates on U.S. constant rate treasury securities with contractual terms approximately equal to the expected life of the award.
Expected Dividend Yield. Because we have not paid any cash dividends since our inception and do not anticipate paying dividends in the foreseeable future, we assume a dividend yield of zero.
Expected Award Life. We determine the expected life of an award by considering various relevant factors, including the vesting period and contractual term of the award, our employees’ historical exercise patterns and length of service, the expected future volatility of our stock price and employee characteristics. We also consider the expected terms of comparable publicly traded companies. For ESPP purchase rights, the expected life is equal to the current offering period under the ESPP.
Under ASC Topic 718, we are also required to estimate at grant the likelihood that the award will ultimately vest (the “pre-vesting forfeiture rate”) and revise the estimate, if necessary, in future periods if the actual forfeiture rate differs. We determine the pre-vesting forfeiture rate of an award based on our historical pre-vesting award forfeiture experience, giving consideration to company-specific events impacting our historical pre-vesting award forfeiture experience that are unlikely to occur in the future as well as anticipated future events that may impact forfeiture rates.
Our determination of the input variables used in the Black-Scholes option pricing model as well as the pre-vesting forfeiture rate is based on various underlying estimates and assumptions that are highly subjective and are affected by our stock price, among other factors. Changes in these underlying estimates and assumptions could materially affect the fair value of our share-based awards and, therefore, the amount of share-based compensation expense to be recognized in our results of operations.
The fair value of stock options and ESPP purchase rights granted during the years ended March 31, 2010 and 2009 was estimated at the date of grant using the Black-Scholes option pricing model with the following weighted average assumptions:
| Year ended March 31, 2010 | ||||||||
| Stock Options | ESPP Purchase Rights |
|||||||
| Expected volatility |
58 | % | 64 | % | ||||
| Risk-free interest rate |
2.5 | % | 0.3 | % | ||||
| Expected option life in years |
5 | 0.5 | ||||||
| Expected dividend yield |
0 | % | 0 | % | ||||
| Weighted average per share grant date fair value |
$ | 2.91 | $ | 1.22 | ||||
61
Table of Contents
Accelrys, Inc.
Notes to Consolidated Financial Statements (Continued)
| Year ended March 31, 2009 | ||||||||
| Stock Options | ESPP Purchase Rights |
|||||||
| Expected volatility |
54 | % | 68 | % | ||||
| Risk-free interest rate |
2.9 | % | 1.1 | % | ||||
| Expected option life in years |
5 | 0.5 | ||||||
| Expected dividend yield |
0 | % | 0 | % | ||||
| Weighted average per share grant date fair value |
$ | 2.72 | $ | 1.46 | ||||
| Year ended March 31, 2008 | ||||||||
| Stock Options | ESPP Purchase Rights |
|||||||
| Expected volatility |
55 | % | 55 | % | ||||
| Risk-free interest rate |
4.2 | % | 4.3 | % | ||||
| Expected option life in years |
5 | 0.5 | ||||||
| Expected dividend yield |
0 | % | 0 | % | ||||
| Weighted average per share grant date fair value |
$ | 3.57 | $ | 2.17 | ||||
The fair value of RSUs granted during the years ended March 31, 2010, 2009 and 2008 was based on the market price of our common stock on the date of grant.
Share-Based Compensation Expense
The estimated fair value of our share-based awards is recognized as a charge against income on a straight-line basis over the requisite service period, which is the shorter of the vesting period of the award or, for applicable awards, the period until the participant becomes eligible for retirement. The estimated fair value of applicable share-based awards granted to retirement-eligible participants is recognized as a charge against income immediately upon grant. Total share-based compensation expense recognized in our consolidated statements of income for the years ended March 31, 2010, 2009 and 2008 was as follows:
| Years Ended March 31, | |||||||||
| 2010 | 2009 | 2008 | |||||||
| (In thousands) | |||||||||
| Cost of revenue |
$ | 276 | $ | 264 | $ | 323 | |||
| Product development |
930 | 859 | 931 | ||||||
| Sales and marketing |
1,052 | 952 | 945 | ||||||
| General and administrative |
1,674 | 1,385 | 1,728 | ||||||
| Total share-based compensation expense |
$ | 3,932 | $ | 3,460 | $ | 3,927 | |||
No share-based compensation expense was capitalized in the periods presented. At March 31, 2010, the gross amount of unrecognized share-based compensation expense relating to unvested share-based awards was approximately $8.5 million, which we anticipate recognizing as a charge against income over a weighted average period of 2.6 years. The total fair value of RSUs vested during the years ended March 31, 2010, 2009 and 2008 was $1.9 million, $1.5 million and $0.9 million, respectively.
62
Table of Contents
Accelrys, Inc.
Notes to Consolidated Financial Statements (Continued)
| 4. | Income Taxes |
Income from continuing operations before taxes was as follows:
| Years Ended March 31, | |||||||||
| 2010 | 2009 | 2008 | |||||||
| (In thousands) | |||||||||
| U.S. |
$ | 1,083 | $ | 1,131 | $ | 2,043 | |||
| Foreign |
1,330 | 158 | 339 | ||||||
| Total |
$ | 2,413 | $ | 1,289 | $ | 2,382 | |||
Income tax expense consists of the following:
| Years Ended March 31, | |||||||||||
| 2010 | 2009 | 2008 | |||||||||
| (In thousands) | |||||||||||
| Current: |
|||||||||||
| Federal |
$ | (15 | ) | $ | — | $ | — | ||||
| State |
172 | 90 | 87 | ||||||||
| Foreign |
431 | 308 | (4,282 | ) | |||||||
| Total current income tax expense (benefit) |
588 | 398 | (4,195 | ) | |||||||
| Deferred: |
|||||||||||
| Federal |
585 | 707 | 512 | ||||||||
| State |
— | — | — | ||||||||
| Foreign |
45 | 90 | 4,744 | ||||||||
| Total deferred income tax expense (benefit) |
630 | 797 | 5,256 | ||||||||
| Total income tax expense |
$ | 1,218 | $ | 1,195 | $ | 1,061 | |||||
The change in current and deferred income tax expense incurred in foreign jurisdictions from fiscal year 2008 to fiscal year 2009 is attributable to the reversal in the first quarter of fiscal year 2009 of the temporary book-tax timing difference related to revenue recognized by our wholly-owned Japanese subsidiary, Accelrys, K.K., for Japanese income tax purposes in advance of being recognized for book purposes, as discussed further below.
The following reconciles income taxes computed at the U.S. statutory federal tax rate to income tax expense:
| Years Ended March 31, | |||||||||||
| 2010 | 2009 | 2008 | |||||||||
| (In thousands) | |||||||||||
| Income tax at U.S. statutory rate |
$ | 821 | $ | 439 | $ | 777 | |||||
| State income taxes, net of federal benefit |
97 | 77 | 224 | ||||||||
| Foreign taxes |
156 | (9 | ) | 88 | |||||||
| Change in valuation allowance and other |
144 | 688 | (28 | ) | |||||||
| Income tax expense |
$ | 1,218 | $ | 1,195 | $ | 1,061 | |||||
63
Table of Contents
Accelrys, Inc.
Notes to Consolidated Financial Statements (Continued)
Significant components of our deferred tax assets and liabilities are as follows:
| March 31, | ||||||||
| 2010 | 2009 | |||||||
| (In thousands) | ||||||||
| Deferred tax assets: |
||||||||
| Net operating loss carryforwards |
$ | 44,124 | $ | 49,847 | ||||
| Goodwill and intangibles |
4,402 | 5,531 | ||||||
| Property and equipment |
331 | 581 | ||||||
| Unused tax credits |
6,885 | 6,064 | ||||||
| Accruals and reserves |
7,424 | 7,079 | ||||||
| Gross deferred tax assets |
63,166 | 69,102 | ||||||
| Deferred tax liabilities: |
||||||||
| Property and equipment |
— | — | ||||||
| Intangible assets |
1,051 | 1,543 | ||||||
| Indefinite lived intangible assets |
2,309 | 1,723 | ||||||
| Gross deferred tax liabilities |
3,360 | 3,266 | ||||||
| Total net deferred tax assets |
59,806 | 67,168 | ||||||
| Valuation allowance for deferred tax assets |
(61,326 | ) | (66,816 | ) | ||||
| Net deferred taxes |
$ | (1,520 | ) | $ | (980 | ) | ||
At March 31, 2010 and 2009, we had $2.3 million and $1.7 million, respectively, of net deferred tax liabilities in the U.S. related to indefinite-lived goodwill and intangible assets that are amortized for income tax purposes. For book purposes, the indefinite-lived goodwill and intangible assets will be charged to results of operations when they are determined to be impaired in accordance with ASC Topic 350. Because we cannot predict when these assets will be impaired and therefore when the associated deferred tax liabilities will reverse, we cannot assume that there will be sufficient deferred tax assets to offset against these deferred tax liabilities when they ultimately reverse. We have provided a full valuation allowance for our remaining net U.S. deferred tax assets as we do not believe that the ultimate realization of such deferred tax assets is more-likely-than-not.
At March 31, 2010 and 2009, we also had $0.8 million and $0.7 million, respectively, of net deferred tax assets related to Accelrys, K.K. We believe that the ultimate realization of these deferred tax assets is more-likely-than-not since our intercompany transfer pricing arrangement provides for Accelrys, K.K. to achieve an annual operating profit margin.
The change in the valuation allowance for deferred tax assets for the years ended March 31, 2010 and 2009 of $5.5 million and ($2.7) million, respectively, was due primarily to the change in net operating loss carryforwards (“NOLs”) in the U.S. and a change in state effective tax rate.
As of March 31, 2010, we had U.S. federal NOLs of approximately $117.1 million and tax credit carryforwards of approximately $3.0 million. We also had California NOLs of approximately $30.6 million and tax credit carryforwards of approximately $5.9 million. The Company also has approximately $7.5 million of UK NOLs. Approximately $46.7 million of the federal NOLs relate to stock option deductions which, upon realization, will result in an increase to paid-in capital and a decrease in income taxes payable. Approximately $11.0 million federal NOLs expired as of March 31, 2010. If not fully utilized, portions of our U.S. federal NOLs and tax credit carryforwards will expire in varying amounts from 2011 through 2027, and portions of our
64
Table of Contents
Accelrys, Inc.
Notes to Consolidated Financial Statements (Continued)
California NOLs will expire in varying amounts from 2011 through 2018. The California tax credit carryforwards do not expire. Realization of our NOLs and credits is dependent upon our generating sufficient taxable income prior to expiration of those attributes.
In addition to the NOLs reflected above, as of March 31, 2010, we had pre-acquisition NOLs of $38.4 million from acquisitions outside the U.S. which have been reserved as unrecognized tax benefits. The pre- acquisition NOLs, if ultimately realized, will result in an increase to income tax benefit. No pre-acquisition NOLs were utilized during the years ended March 31, 2010, 2009 or 2008.
The Company recognizes windfall tax benefits associated with the exercise of stock options directly to stockholders’ equity only when realized. Accordingly, deferred tax assets are not recognized for NOLs resulting from windfall tax benefits. At March 31, 2010, deferred tax assets do not include $0.2 million of excess tax benefits from share-based compensation.
Due to uncertainties surrounding our ability to generate future taxable income, a valuation allowance of $71.6 million was established to offset our gross deferred tax asset as of April 1, 2007, which primarily consisted of federal and state NOLs. At March 31, 2010 the valuation allowance was reduced to $61.3 million. The future utilization of our NOLs to offset future taxable income may be subject to a substantial annual limitation as a result of certain changes in ownership by our stockholders that hold 5% or more of our common stock that may have occurred previously or that could occur in the future. An assessment of such ownership changes under Sections 382 and 383 of the Internal Revenue Code was completed through December 31, 2007. As a result of this assessment, we have determined that there are currently no limitations under Sections 382 and 383 for our NOL and tax credit carryforwards. However, future ownership changes may impact the utilization of the NOLs and tax credit carryforwards.
Upon the adoption of new accounting principles relating to uncertain tax positions as of April 1, 2007, we did not record any reserves for uncertain tax positions. In the third quarter for the year ended March 31, 2010 we identified an uncertain tax position of $10.8 million relating to the NOL carryovers obtained in connection with the acquisition of one of our foreign subsidiaries. We do not expect any changes in our uncertain tax positions within the next 12 months.
Following is a tabular reconciliation of the Unrecognized Tax Benefits (“UTB”) activity during the year ended March 31, 2010 (excluding interest and penalties):
| March
31, 2010 | |||
| (In thousands) | |||
| Beginning balance, excluding interest and penalties of $0 |
$ | 10,225 | |
| Additions based on tax positions related to the current year |
— | ||
| Additions based on tax positions of prior year |
— | ||
| Reductions for tax positions of prior year |
— | ||
| Settlements |
— | ||
| Reductions due to lapse of applicable statute of limitations |
— | ||
| Impact of foreign currency fluctuations |
575 | ||
| Ending Balance, excluding interest and penalties of $0 |
$ | 10,800 | |
We are subject to taxation in the U.S., various state jurisdictions, the United Kingdom, France, Germany, and Japan. Our tax years from 1994 forward are subject to examination by the U.S. and various other state jurisdictions due to the carryforward of unutilized NOLs and research and development credits. Our tax years
65
Table of Contents
Accelrys, Inc.
Notes to Consolidated Financial Statements (Continued)
from fiscal year 2007 forward are subject to examination by the United Kingdom taxing authorities and from fiscal year 2004 forward are subject to examination by the Japanese taxing authorities.
In April 2003, we established a wholly-owned subsidiary, Accelrys Software Solutions Pvt. Ltd. (“Accelrys, Pvt.”), in Bangalore, India, that qualifies under applicable Indian law for a tax holiday through March 2009. The aggregate dollar amount of the tax holiday was $0.4 million, or $0.01 per share, as of March 31, 2007. As discussed further in Note 7, in the fourth quarter of fiscal year 2007, we closed our research and development facility in Bangalore and terminated the approximately 60 employees of Accelrys, Pvt. A final tax return was filed with the Indian authorities for the March 2008 year end. The return was filed late and therefore the Company has accrued for a potential tax exposure of $0.1 million related to the late return filing.
| 5. | Retirement Savings Plans |
U.S. Based Employees
We have an employee savings and retirement plan (the “401(K) Plan”). The 401(K) Plan is intended to be a tax-qualified plan covering substantially all U.S.-based employees. Under the terms of the 401(K) Plan, employees may elect to contribute up to 20% of their compensation, or the statutory prescribed limit, if less. We may, at our discretion, match employee contributions up to a maximum of 4% of the employee’s compensation. Employer matching contributions totaled $0.6 million, $0.7 million and $0.7 million for the years ended March 31, 2010, 2009 and 2008, respectively.
Non-U.S. Based Employees
We provide retirement benefits for employees located outside the U.S. commensurate with other similar companies in those respective locations. Employer contributions, in the form of cash, totaled $0.6 million for the year ended March 31, 2010, and $0.7 million for each of the years ended March 31, 2009 and 2008.
| 6. | Fair Value |
We adopted fair value accounting guidance as of April 1, 2008 as required for financial assets and liabilities. Fair value accounting provides a definition of fair value, establishes acceptable methods of measuring fair value and expands disclosures for fair value measurements. The principles apply under accounting pronouncements which require measurement of fair value and do not require any new fair value measurements in accounting pronouncements where fair value is the relevant measurement attribute. Fair value accounting also specifies a fair value hierarchy based upon the observability of inputs used in valuation techniques. Observable inputs (highest level) reflect market data obtained from independent sources, while unobservable inputs (lowest level) reflect internally developed market assumptions.
In accordance with fair value accounting, fair value measurements are classified under the following hierarchy:
Level 1—Quoted prices for identical instruments in active markets.
Level 2—Quoted prices for similar instruments in active markets; quoted prices for identical or similar instruments in markets that are not active; and model-derived valuations in which all significant inputs or significant value-drivers are observable in active markets.
Level 3—Model-derived valuations in which one or more significant inputs or significant value-drivers are unobservable.
66
Table of Contents
Accelrys, Inc.
Notes to Consolidated Financial Statements (Continued)
Fair value measurements are classified according to the lowest level input or value-driver that is significant to the valuation. A measurement may therefore be classified within Level 3 even though there may be significant inputs that are readily observable. The following table summarizes our assets and liabilities that require fair value measurements on a recurring basis and their respective input levels based on the fair value hierarchy:
| Carrying Value at March 31, 2010 |
Quoted Market Prices for Identical Assets (Level 1) |
Significant Other Observable Inputs (Level 2) |
Significant Unobservable Inputs (Level 3) | |||||||
| (In thousands) | ||||||||||
| March 31, 2010: |
||||||||||
| Auction rate securities |
$ | 10,461 | — | — | $ | 10,461 | ||||
| Auction rate securities put option |
1,289 | — | — | 1,289 | ||||||
| Total |
$ | 11,750 | — | — | $ | 11,750 | ||||
The following table summarizes the assets and liabilities measured at fair value on a recurring basis using significant unobservable inputs (Level 3):
| Fair Value Measurements Using Significant Unobservable Level 3 Inputs Auction Rate Securities |
||||
| (In thousands) | ||||
| Balance at April 1, 2009 |
$ | 14,353 | ||
| Redemption of auction rate securities |
(2,850 | ) | ||
| Change in fair value of auction rate securities put option |
28 | |||
| Realized gain on auction rate securities included in net income |
219 | |||
| Balance at March 31, 2010 |
$ | 11,750 | ||
| 7. | Commitments and Contingencies |
Operating Leases
We lease office space in several facilities under operating leases that expire through 2022. Certain of our lease agreements contain renewal options, rent holidays or rent escalation clauses. In accordance with ASC Topic 840, Leases, we recognize rent expense on a straight-line basis over the term of the related operating leases, including any cancelable option periods where failure to exercise such options would result in economic penalty. Rent expense recognized in excess of rent paid is reflected as a deferred rent liability, which is included in lease-related liabilities in the accompanying consolidated balance sheets. Rent expense under our operating leases for each of the years ended March 31, 2010, 2009 and 2008, was $3.3 million.
Additionally, under the terms of the lease for our San Diego, California corporate office, we were required to obtain an irrevocable letter of credit for $6.6 million to ensure our performance under the lease agreement. On September 1, 2009, the letter of credit requirement decreased to $4.4 million. If we are not in default under the lease, the letter of credit requirement will decrease to $3.0 million on September 1, 2011 and will expire upon termination of the lease on September 1, 2013. The letter of credit is fully secured by cash and cash equivalents, which are included in restricted cash and marketable securities in the accompanying consolidated balance sheets.
67
Table of Contents
Accelrys, Inc.
Notes to Consolidated Financial Statements (Continued)
We sublease certain facilities abandoned in connection with previous restructuring activities, and sublease income is recorded as a reduction of the restructuring liability and related restructuring expense upon abandonment of the facility. Accordingly, no sublease income was recognized in our consolidated statements of income for the years ended March 31, 2010, 2009 or 2008.
Future minimum lease commitments and future committed sublease income as of March 31, 2010 are as follows:
| Operating Lease Commitments |
Sublease Income |
Net | |||||||
| (In thousands) | |||||||||
| Fiscal year 2011 |
$ | 4,205 | $ | 405 | $ | 3,800 | |||
| Fiscal year 2012 |
4,239 | 34 | 4,205 | ||||||
| Fiscal year 2013 |
3,953 | — | 3,953 | ||||||
| Fiscal year 2014 |
2,353 | — | 2,353 | ||||||
| Fiscal year 2015 |
1,388 | — | 1,388 | ||||||
| Thereafter |
9,213 | — | 9,213 | ||||||
| $ | 25,351 | $ | 439 | $ | 24,912 | ||||
Lease Guarantee
On April 30, 2004, we spun-off our drug discovery subsidiary, PDD, into an independent, separately traded, publicly held company through the distribution to our stockholders of a dividend of one share of PDD common stock for every two shares of our common stock. The landlords of our New Jersey facilities, which were used by our PDD operations, consented to the assignment of the leases to PDD. Despite the assignment, the landlords required us to guarantee the remaining lease obligations, which totaled approximately $14.9 million as of March 31, 2010. In the event that PDD defaults on their lease obligation, we are permitted under the guarantee to sublease the facility in order to mitigate our lease obligation. In accordance with ASC Topic 460, we recognized a liability and corresponding charge to stockholders’ equity for the probability-weighted fair market value of the guarantee. Changes to the fair market value of the liability are recognized in stockholders’ equity. The liability for our guarantee of the lease obligation was $0.4 million for each of the years ended March 31, 2010 and 2009.
Royalties
We are obligated to pay royalties for licenses to enhance and market certain software used in connection with our product offerings. Annual contractual minimum royalty payments as of March 31, 2010 are as follows (in thousands):
| Fiscal year 2011 |
$ | 408 | |
| Fiscal year 2012 |
406 | ||
| Fiscal year 2013 |
406 | ||
| Fiscal year 2014 |
367 | ||
| Fiscal year 2015 |
391 | ||
| Thereafter(1) |
2,321 | ||
| $ | 4,299 | ||
| (1) | For purposes of the contractual minimum royalty payments table, we have included indefinite-lived contractual minimum royalty payments due in the ten fiscal years following fiscal year 2010. |
68
Table of Contents
Accelrys, Inc.
Notes to Consolidated Financial Statements (Continued)
In addition to the contractual minimum royalties included in the table above, we have several royalty agreements that are long term or perpetual in nature and the royalty obligations are generally based on a percentage of revenues derived from certain software license sales and associated sales of PCS. The royalty agreements require quarterly payments and generally do not limit the maximum royalties owed. During each of the years ended March 31, 2010 and 2009 we incurred royalty related expense of $2.2 million, and during the year ended March 31, 2008, we incurred related royalty expense of $2.9 million.
Litigation
We are subject to various claims and legal proceedings arising in the ordinary course of our business. While any legal proceeding has an element of uncertainty, management believes that the disposition of such matters, in the aggregate, will not have a material effect on our results of operations.
Other Guarantees and Indemnifications
We provide indemnifications of varying scope and size to certain customers against claims of intellectual property infringement made by third parties arising from the use of our products. We have also entered into indemnification agreements with our officers and directors. Although the maximum potential amount of future payments we could be required to make under these indemnifications is unlimited, to date we have not incurred material costs to defend lawsuits or settle claims related to these indemnification provisions. Additionally, we have insurance policies that, in most cases, would limit our exposure and enable us to recover a portion of any amounts paid. Therefore, we believe the estimated fair value of these agreements is minimal and the likelihood of incurring an obligation is remote. Accordingly, we have not accrued any liabilities in connection with these indemnification obligations as of March 31, 2010.
| 8. | Restructuring Activities |
The following summarizes the changes in our accrued restructuring charges liability:
| Severance and Related Costs |
Lease Obligation Exit and Facility Closure Costs |
Total | ||||||||||
| (In thousands) | ||||||||||||
| Balance at March 31, 2008 |
$ | 137 | $ | 1,397 | $ | 1,534 | ||||||
| Additional severance and lease abandonment charges |
896 | — | 896 | |||||||||
| Adjustments to liability |
— | 78 | 78 | |||||||||
| Cash payments |
(835 | ) | (302 | ) | (1,137 | ) | ||||||
| Effect of foreign exchange |
(23 | ) | (356 | ) | (379 | ) | ||||||
| Balance at March 31, 2009 |
$ | 175 | $ | 817 | $ | 992 | ||||||
| Additional severance and lease abandonment recoveries (net of additional charges) |
(74 | ) | (12 | ) | (86 | ) | ||||||
| Adjustments to liability |
(61 | ) | 142 | 81 | ||||||||
| Cash payments |
(43 | ) | (370 | ) | (413 | ) | ||||||
| Effect of foreign exchange |
3 | 63 | 66 | |||||||||
| Balance at March 31, 2010 |
$ | — | $ | 640 | $ | 640 | ||||||
69
Table of Contents
Accelrys, Inc.
Notes to Consolidated Financial Statements (Continued)
In periods prior to fiscal year 2007, we implemented various actions designed to improve our operations and overall financial performance through workforce reductions and the abandonment of leased facilities. All severance benefits related to these workforce reductions have been fully paid. The lease obligation for the remaining abandoned facility terminates in fiscal year 2022.
In April 2008, as part of a plan to continue to realign our workforce in order to support our growth products, we terminated approximately 30 employees in the U.S. and the U.K. In connection with the termination, we incurred and paid approximately $0.8 million in severance charges in the first quarter of fiscal year 2009.
All amounts incurred in connection with the above activities are recorded in restructuring charges in the accompanying consolidated statements of income.
| 9. | Subsequent Events |
On April 5, 2010, we entered into an Agreement and Plan of Merger and Reorganization (the “Merger Agreement”) with Symyx Technologies, Inc. (“Symyx”) and Alto Merger Sub, Inc., our wholly-owned subsidiary (“Merger Sub”). Pursuant to the terms and subject to the conditions set forth in the Merger Agreement, Merger Sub will merge with and into Symyx, and Symyx will continue as the surviving corporation and as our wholly-owned subsidiary (the “Merger”). Our board of directors and the Symyx board of directors have each approved the Merger Agreement and the transactions contemplated thereby.
Upon completion of the Merger, by virtue of the Merger and without any action on the part of the holders of any shares of the capital stock of Symyx, each outstanding share of Symyx common stock will be converted into the right to receive 0.7802 shares of our common stock (the “Exchange Ratio”). In addition, upon completion of the Merger: (i) all outstanding options to purchase Symyx common stock will be assumed by us and converted into options to purchase our common stock, in each case appropriately adjusted based on the Exchange Ratio; and (ii) all outstanding restricted stock units representing rights to receive Symyx common stock will vest in full and will entitle the holders thereof to receive shares of our common stock in accordance with the Exchange Ratio. No fractional shares of our common stock will be issued in the Merger. The Merger is intended to qualify as a “reorganization” within the meaning of Section 368(a) of the Internal Revenue Code of 1986, as amended.
Completion of the Merger is subject to various customary conditions, including, among other things, the approval of our stockholders and the Symyx stockholders of certain actions required for purposes of completing the Merger and the compliance by us and Symyx with our respective obligations under the Merger Agreement.
The Merger Agreement contains customary representations, warranties and covenants, including covenants obligating us and Symyx to continue to conduct our respective businesses in the ordinary course and to cooperate on seeking regulatory approvals and providing access to each other’s information. The Merger Agreement also contains a customary “no solicitation” provision pursuant to which, prior to the completion of the Merger, neither we nor Symyx are permitted to solicit or engage in discussions with any third party regarding another acquisition proposal unless we or they, as applicable, have received an unsolicited bona fide written proposal or offer that the recipient’s board of directors determines is or would reasonably be expected to result in a “Superior Offer”.
The Merger Agreement contains certain termination rights in favor of us and Symyx, including each party’s right to terminate the Merger Agreement under certain circumstances in connection with the other party’s acceptance of a “Superior Offer”. In addition, the Merger Agreement provides that in connection with certain terminations of the Merger Agreement, depending on the circumstances surrounding the termination, one party may be required to pay to the other a termination fee of $7,500,000 or an expense reimbursement of $1,000,000.
70
Table of Contents
Accelrys, Inc.
Notes to Consolidated Financial Statements (Continued)
The foregoing summary of the Merger Agreement and the Merger does not purport to be complete and is subject to, and qualified in its entirety by, the full text of the Merger Agreement, a copy of which is filed as Exhibit 2.1 to our Current Report on Form 8-K filed with the SEC on April 6, 2010, and the terms of which are incorporated herein by reference.
Several lawsuits have been filed against Symyx, the members of the Symyx board of directors, certain executive officers of Symyx, Accelrys and Merger Sub in purported class action lawsuits brought by individual Symyx stockholders challenging the proposed Merger and seeking, among other things, to enjoin the defendants from completing the Merger on the agreed-upon terms. If the plaintiffs are successful in obtaining an injunction prohibiting the parties from completing the Merger on the agreed-upon terms, such an injunction may prevent the completion of the Merger in the expected timeframe (or altogether). The first of such lawsuits was a class action lawsuit filed in the Superior Court of the State of California, County of Santa Clara, purportedly on behalf of the stockholders of Symyx, against Symyx and its directors and chief financial officer, as well as Accelrys and Merger Sub, alleging, among other things, that Symyx’s directors breached their fiduciary duties to the stockholders of Symyx in connection with the proposed Merger. Subsequent to the filing of such lawsuit, several additional suits were filed, also in Santa Clara County, each of which is substantially similar to the first lawsuit. The lawsuits were ultimately consolidated into a single action. It is expected that the plaintiffs will file a single, consolidated complaint, which will serve as the only complaint in the combined litigation going forward. We expect that the consolidated complaint, like the four filed complaints, will seek, among other things, to enjoin the defendants from completing the Merger as currently contemplated. We intend to take all appropriate actions to defend the suit.
| 10. | Selected Quarterly Financial Information (unaudited) |
The following quarterly financial data, in the opinion of management, reflects all adjustments, consisting of normal recurring adjustments necessary for a fair presentation of results for the periods presented.
| Year Ended March 31, 2010 | |||||||||||||||
| First Quarter |
Second Quarter |
Third Quarter |
Fourth Quarter |
||||||||||||
| (In thousands, except per share amounts) | |||||||||||||||
| Revenue |
$ | 20,141 | $ | 19,988 | $ | 22,071 | $ | 20,759 | |||||||
| Cost of revenue |
3,450 | 3,350 | 4,096 | 3,485 | |||||||||||
| Gross margin |
16,691 | 16,638 | 17,975 | 17,274 | |||||||||||
| Operating expenses: |
|||||||||||||||
| Product development |
3,903 | 3,551 | 3,526 | 4,151 | |||||||||||
| Sales and marketing |
8,143 | 7,812 | 9,387 | 11,316 | |||||||||||
| General and administrative |
3,658 | 3,412 | 3,956 | 4,350 | |||||||||||
| Restructuring charges (recoveries) |
(91 | ) | 17 | (16 | ) | 4 | |||||||||
| Total operating expenses |
15,613 | 14,792 | 16,853 | 19,821 | |||||||||||
| Operating income (loss) |
1,078 | 1,846 | 1,122 | (2,547 | ) | ||||||||||
| Interest and other (expense) income, net |
(5 | ) | 273 | 352 | 294 | ||||||||||
| Income (loss) before taxes |
1,073 | 2,119 | 1,474 | (2,253 | ) | ||||||||||
| Income tax expense |
329 | 273 | 495 | 121 | |||||||||||
| Net income (loss) |
744 | 1,846 | 979 | (2,374 | ) | ||||||||||
| Basic and diluted net income (loss) per share |
$ | 0.03 | $ | 0.07 | $ | 0.04 | $ | (0.09 | ) | ||||||
71
Table of Contents
Accelrys, Inc.
Notes to Consolidated Financial Statements (Continued)
| Year Ended March 31, 2009 | |||||||||||||
| First Quarter |
Second Quarter |
Third Quarter |
Fourth Quarter |
||||||||||
| (In thousands, except per share amounts) | |||||||||||||
| Revenue |
$ | 20,300 | $ | 20,112 | $ | 20,609 | $ | 19,960 | |||||
| Cost of revenue |
3,460 | 3,545 | 4,385 | 4,281 | |||||||||
| Gross margin |
16,840 | 16,567 | 16,224 | 15,679 | |||||||||
| Operating expenses: |
|||||||||||||
| Product development |
4,278 | 3,832 | 3,440 | 3,503 | |||||||||
| Sales and marketing |
8,117 | 8,190 | 8,815 | 9,596 | |||||||||
| General and administrative |
3,461 | 3,259 | 3,205 | 5,037 | |||||||||
| Restructuring charges |
842 | 8 | — | 46 | |||||||||
| Total operating expenses |
16,698 | 15,289 | 15,460 | 18,182 | |||||||||
| Operating income (loss) |
142 | 1,278 | 764 | (2,503 | ) | ||||||||
| Interest and other income, net |
273 | 350 | 423 | 562 | |||||||||
| Income before taxes |
415 | 1,628 | 1,187 | 1,941 | |||||||||
| Income tax expense |
329 | 401 | 177 | 288 | |||||||||
| Net income (loss) |
86 | 1,227 | 1,010 | (2,229 | ) | ||||||||
| Basic and diluted net income (loss) per share |
$ | 0.00 | $ | 0.05 | $ | 0.04 | $ | (0.08 | ) | ||||
72
Table of Contents
| Item 9. | Changes in and Disagreements with Accountants on Accounting and Financial Disclosure |
None
| Item 9A. | Controls and Procedures |
Conclusion Regarding the Effectiveness of Disclosure Controls and Procedures
We maintain disclosure controls and procedures, as such term is defined in Rules 13a-15(e) and 15d-15(e) under the Exchange Act that are designed to provide reasonable assurance that information required to be disclosed by us in the reports that we file or submit under the Exchange Act is recorded, processed, summarized and reported within the time periods specified in the SEC rules and forms, and that such information is accumulated and communicated to our management, including our principal executive officer and principal financial officer, as appropriate, to allow timely decisions regarding required financial disclosures.
As of the end of the period covered by this Report, we conducted an evaluation, under the supervision and with the participation of our management, including our principal executive officer and principal financial officer, of the effectiveness of the design and operation of our disclosure controls and procedures pursuant to Exchange Act Rules 13a-15(b) and 15d-15(b). Based on this evaluation, our principal executive officer and principal financial officer concluded that our disclosure controls and procedures were effective as of March 31, 2010.
Management’s Report on Internal Control Over Financial Reporting
Our management is responsible for establishing and maintaining adequate internal control over financial reporting, as such term is defined in Exchange Act Rules 13a-15(f) and 15d-15(f). Our internal control over financial reporting is a process designed to provide reasonable assurance regarding the reliability of financial reporting and the preparation of the financial statements for external purposes in accordance with generally accepted accounting principles. Because of its inherent limitations, internal control over financial reporting may not prevent or detect misstatements. Also, projections of any evaluation of effectiveness to future periods are subject to the risk that internal controls may become inadequate because of changes in conditions, or that the degree of compliance with policies and procedures may deteriorate.
Under the supervision and with the participation of our management, including our principal executive officer and principal financial officer, we conducted an evaluation of the effectiveness of our internal control over financial reporting based on the framework set forth in Internal Control—Integrated Framework issued by the Committee of Sponsoring Organizations of the Treadway Commission. Based on our evaluation under the framework in Internal Control—Integrated Framework, our management concluded that our internal control over financial reporting was effective as of March 31, 2010.
Ernst & Young LLP, the independent registered public accounting firm that audited the consolidated financial statements included in this Annual Report on Form 10-K, has also audited our internal control over financial reporting as of March 31, 2010, as stated in their report which is included herein.
Changes in Internal Control Over Financial Reporting
There have been no changes in our internal control over financial reporting during the fourth quarter of fiscal year ended March 31, 2010 that have or are reasonably likely to materially affect our internal control over financial reporting identified in connection with the previously mentioned evaluation.
| Item 9B. | Other Information |
None
73
Table of Contents
REPORT OF INDEPENDENT REGISTERED PUBLIC ACCOUNTING FIRM
The Board of Directors and Stockholders of
Accelrys, Inc.
We have audited Accelrys Inc.’s internal control over financial reporting as of March 31, 2010, based on criteria established in Internal Control—Integrated Framework issued by the Committee of Sponsoring Organizations of the Treadway Commission (the COSO criteria). Accelrys, Inc.’s management is responsible for maintaining effective internal control over financial reporting, and for its assessment of the effectiveness of internal control over financial reporting included in the accompanying Management’s Report on Internal Control Over Financial Reporting. Our responsibility is to express an opinion on the company’s internal control over financial reporting based on our audit.
We conducted our audit in accordance with the standards of the Public Company Accounting Oversight Board (United States). Those standards require that we plan and perform the audit to obtain reasonable assurance about whether effective internal control over financial reporting was maintained in all material respects. Our audit included obtaining an understanding of internal control over financial reporting, assessing the risk that a material weakness exists, testing and evaluating the design and operating effectiveness of internal control based on the assessed risk, and performing such other procedures as we considered necessary in the circumstances. We believe that our audit provides a reasonable basis for our opinion.
A company’s internal control over financial reporting is a process designed to provide reasonable assurance regarding the reliability of financial reporting and the preparation of financial statements for external purposes in accordance with generally accepted accounting principles. A company’s internal control over financial reporting includes those policies and procedures that (1) pertain to the maintenance of records that, in reasonable detail, accurately and fairly reflect the transactions and dispositions of the assets of the company; (2) provide reasonable assurance that transactions are recorded as necessary to permit preparation of financial statements in accordance with generally accepted accounting principles, and that receipts and expenditures of the company are being made only in accordance with authorizations of management and directors of the company; and (3) provide reasonable assurance regarding prevention or timely detection of unauthorized acquisition, use, or disposition of the company’s assets that could have a material effect on the financial statements.
Because of its inherent limitations, internal control over financial reporting may not prevent or detect misstatements. Also, projections of any evaluation of effectiveness to future periods are subject to the risk that controls may become inadequate because of changes in conditions, or that the degree of compliance with the policies or procedures may deteriorate.
In our opinion, Accelrys, Inc. maintained, in all material respects, effective internal control over financial reporting as of March 31, 2010, based on the COSO criteria.
We also have audited, in accordance with the standards of the Public Company Accounting Oversight Board (United States), the consolidated balance sheets of Accelrys, Inc. as of March 31, 2010 and 2009, and the related consolidated statements of income, stockholders’ equity, and cash flows for each of the three years in the period ended March 31, 2010 of Accelrys, Inc. and our report dated May 27, 2010 expressed an unqualified opinion thereon.
/s/ ERNST & YOUNG LLP
San Diego, California
May 27, 2010
74
Table of Contents
PART III
| Item 10. | Directors, Executive Officers and Corporate Governance |
The information required by this item will be included in the applicable Subsequent Filing to be filed within 120 days of our fiscal year ended March 31, 2010.
| Item 11. | Executive Compensation |
The information required by this item will be included in the applicable Subsequent Filing to be filed within 120 days of our fiscal year ended March 31, 2010.
| Item 12. | Security Ownership of Certain Beneficial Owners and Management and Related Stockholder Matters |
The information required by this item will be included in the applicable Subsequent Filing to be filed within 120 days of our fiscal year ended March 31, 2010.
| Item 13. | Certain Relationships and Related Transactions, and Director Independence |
The information required by this item will be included in the applicable Subsequent Filing to be filed within 120 days of our fiscal year ended March 31, 2010.
| Item 14. | Principal Accountant Fees and Services |
The information required by this item will be included in the applicable Subsequent Filing to be filed within 120 days of our fiscal year ended March 31, 2010.
75
Table of Contents
PART IV
| Item 15. | Exhibits, Financial Statement Schedules |
(a)(1) Financial Statements
The following Consolidated Financial Statements are included:
(a)(2) Financial Statement Schedules
Schedule II—Valuation and Qualifying Accounts
| Description |
Balance at Beginning of Year |
Additions Charged to Costs and Expenses |
Deductions(1) | Balance at End of Year | ||||||||
| (In thousands) | ||||||||||||
| Allowance for doubtful accounts: |
||||||||||||
| Year ended March 31, 2010 |
$ | 172 | $ | — | $ | 9 | $ | 163 | ||||
| Year ended March 31, 2009 |
$ | 200 | $ | — | $ | 28 | $ | 172 | ||||
| Year ended March 31, 2008 |
$ | 213 | $ | 4 | $ | 17 | $ | 200 | ||||
| (1) | Represents write-offs, net of recoveries. |
All other schedules are omitted because they are not applicable, or not required, or because the required information is included in the financial statements or notes thereto.
(a)(3) Exhibits:
| Exhibit |
Description | |
| 2.1 | Agreement and Plan of Merger and Reorganization dated September 13, 2004 by and among Accelrys, Inc., Nashville Acquisition Corporation, SciTegic, Inc., Mathew Hahn and David Rogers as Principal Shareholders, and Mathew Hahn as Shareholder Representative (incorporated by reference to Exhibit 2.1 to Accelrys, Inc.’s Report on Form 8-K dated September 16, 2004). | |
| 2.2 | Agreement and Plan of Merger and Reorganization, dated April 5, 2010, by and among Accelrys, Inc., Alto Merger Sub, Inc. and Symyx Technologies, Inc. (incorporated by reference to Exhibit 2.1 of Accelrys, Inc.’s Report on Form 8-K filed on April 6, 2010). | |
| 3.1 | Restated Certificate of Incorporation of Pharmacopeia, Inc., as amended (including a Certificate of Designation, Preferences and Rights of Series A Junior Participating Preferred Stock) (incorporated by reference to Exhibit 3.2 to Accelrys, Inc.’s Report on Form 10-K for the year ended March 31, 2005). | |
| 3.2 | Certificate of Amendment of the Restated Certificate of Incorporation of Accelrys, Inc. (incorporated by reference to Exhibit 3.4 to Accelrys, Inc.’s Report on Form 10-Q for the quarter ended September 30, 2007). | |
76
Table of Contents
| Exhibit |
Description | |
| 3.3 | Amended and Restated Bylaws of Accelrys, Inc. (incorporated by reference to Exhibit 3.3 to Accelrys, Inc.’s Report on Form 10-K for the year ended March 31, 2005). | |
| 4.1 | Rights Agreement, dated as of September 6, 2002, between Pharmacopeia, Inc. and American Stock Transfer & Trust Company, as Rights Agent, which includes as Exhibit A thereto the Certificate of Designation, Preferences and Rights of Series A Junior Participating Preferred Stock and Exhibit B thereto the Form of Right Certificate (incorporated by reference to Exhibit 4.1 to Accelrys, Inc.’s Report on Form 8-K dated September 4, 2002). | |
| 4.2 | First Amendment to Rights Agreement, dated as of April 5, 2010, by and between Accelrys, Inc. and American Stock Transfer & Trust Company, as Rights Agent (incorporated by reference to Exhibit 4.1 to Accelrys, Inc.’s Report on Form 8-K dated April 6, 2010). | |
| 10.1# | Amended 1994 Incentive Stock Plan (incorporated by reference to Exhibit 10.5 to Accelrys, Inc.’s Report on Form 10-K for the year ended December 31, 1995). | |
| 10.1(a)# | Amendment No. 1 to the 1994 Incentive Stock Plan (incorporated by reference to Exhibit 10.1(a) to Accelrys, Inc.’s Report on Form 10-K for the year ended December 31, 2000). | |
| 10.1(b)# | Amendment No. 2 to the 1994 Incentive Stock Plan (incorporated by reference to Exhibit 10.1(b) to Accelrys, Inc.’s Report on Form 10-K for the year ended December 31, 2000). | |
| 10.1(c)# | Amendment No. 3 to the 1994 Incentive Stock Plan (incorporated by reference to Exhibit 10.5(a) to Accelrys, Inc.’s Report on Form 10-Q for the quarter ended June 30, 1997). | |
| 10.1(d)# | Amendment No. 4 to the 1994 Incentive Stock Plan (incorporated by reference to Exhibit 10.1(d) to Accelrys, Inc.’s Report on Form 10-K for the year ended December 31, 2000). | |
| 10.1(e)# | Amendment No. 5 to the 1994 Incentive Stock Plan (incorporated by reference to Exhibit 10.1(e) to Accelrys, Inc.’s Report on Form 10-K for the year ended December 31, 2000). | |
| 10.1(f)# | Amendment No. 6 to the 1994 Incentive Stock Plan (incorporated by reference to Exhibit 10.1(f) to Accelrys, Inc.’s Report on Form 10-K for the year ended December 31, 2000). | |
| 10.1(g)# | Amendment No. 7 to the 1994 Incentive Stock Plan (incorporated by reference to Exhibit 10.1(g) to Accelrys, Inc.’s Report on Form 10-K for the year ended December 31, 2000). | |
| 10.1(h)# | Amendment No. 8 to the 1994 Incentive Stock Plan (incorporated by reference to Exhibit 10.54 to Accelrys, Inc.’s Report on Form 10-Q for the quarter ended June 30, 2000). | |
| 10.1(i)# | Amendment No. 9 to the 1994 Incentive Stock Plan (incorporated by reference to Exhibit 10.1(i) to Accelrys, Inc.’s Report on Form 10-Q for the quarter ended March 31, 2002). | |
| 10.2# | 1995 Director Option Plan (incorporated by reference to Exhibit 10.7 to Accelrys, Inc.’s Registration Statement on Form S-1 (Reg. No. 33-98246)). | |
| 10.2(a)# | Amendment No. 1 to 1995 Director Option Plan (incorporated by reference to Exhibit 10.3(a) to Accelrys, Inc.’s report on form 10-K for the year ended December 31, 2000). | |
| 10.2(b)# | Amendment No. 2 to the 1995 Director Option Plan (incorporated by reference to Exhibit 10.3(b) to Accelrys, Inc.’s report on Form 10-Q for the quarter ended March 31, 2001). | |
| 10.2(c) | Accelrys, Inc. 2004 New Hire Equity Incentive Plan (incorporated by reference to Exhibit 10.3(c) to Accelrys, Inc.’s Report on Form 10-K for the year ended March 31, 2005). | |
| 10.4# | Form of Indemnity Agreement for Directors and Executive Officers (incorporated by reference to Exhibit 10.48 to Accelrys, Inc.’s Report on Form 10-K for the year ended December 31, 1998). | |
77
Table of Contents
| Exhibit |
Description | |
| 10.5# | Accelrys, Inc. 2000 Stock Option Plan (incorporated by reference to Exhibit 10.23 to Accelrys, Inc.’s Report on form 10-K for the year ended December 31, 2000). | |
| 10.6# | Accelrys, Inc. Executive Non-Qualified Deferred Compensation Plan (incorporated by reference to Exhibit 10.52 to Accelrys, Inc.’s Report on Form 10-Q for the quarter ended March 31, 2000). | |
| 10.7 | Lease, dated August 20, 2003, between Accelrys, Inc. and Eastpark at 8A (Building 1000) (incorporated by reference to Exhibit 10.35 to Accelrys, Inc.’s Report on Form 10-Q for the quarter ended September 30, 2003). | |
| 10.8 | Lease, dated August 20, 2003, between Accelrys, Inc. and Eastpark at 8A (Building 3000) (incorporated by reference to Exhibit 10.36 to Accelrys, Inc.’s Report on Form 10-Q for the quarter ended September 30, 2003). | |
| 10.9 | Sublease, dated May 18, 2004, between Accelrys, Inc. and Pfizer Inc. (incorporated by reference to Exhibit 10.18 to Accelrys, Inc.’s Report on Form 10-Q for the quarter ended December 31, 2004). | |
| 10.10 | Lease, dated May 18, 2004, between Accelrys, Inc. and AGRRI Seaview, L.LC. (incorporated by reference to Exhibit 10.19 to Accelrys, Inc.’s Report on Form 10-Q for the quarter ended December 31, 2004). | |
| 10.11# | Letter of Employment, dated September 29, 2005, between Accelrys, Inc. and Richard Murphy (incorporated by reference to Exhibit 99.1 to Accelrys, Inc.’s Form 8-K dated October 19, 2005). | |
| 10.12# | Accelrys, Inc. Amended and Restated 2004 Stock Incentive Plan (incorporated by reference to Exhibit 4.2 to Accelrys, Inc.’s Report on Form S-8 filed on August 26, 2005). | |
| 10.13# | Accelrys, Inc. Amendment to Amended and Restated 2004 Stock Incentive Plan, dated August 28, 2008 (incorporated by reference to Exhibit 10.2 to Accelrys, Inc.’s Report on Form 10-Q for the quarter ended September 30, 2008). | |
| 10.14# | Form of Stock Option Award Agreement pursuant to Amended and Restated 2004 Stock Incentive Plan (incorporated by reference to Exhibit 4.3 to Accelrys, Inc.’s Report on Form S-8 filed on August 26, 2005). | |
| 10.15# | Form of SAR Award Agreement pursuant to Amended and Restated 2004 Stock Incentive Plan (incorporated by reference to Exhibit 4.4 to Accelrys, Inc.’s Report on Form S-8 filed on August 26, 2005). | |
| 10.16# | Form of Restricted Stock Award Agreement pursuant to Amended and Restated 2004 Stock Incentive Plan (incorporated by reference to Exhibit 4.5 to Accelrys, Inc.’s Report on Form S-8 filed on August 26, 2005). | |
| 10.17# | Form of Restricted Stock Unit Award Agreement pursuant to Amended and Restated 2004 Stock Incentive Plan (incorporated by reference to Exhibit 4.6 to Accelrys, Inc.’s Report on Form S-8 filed on August 26, 2005). | |
| 10.18# | Terms of continuing employment of Matthew Hahn, dated as of August 12, 2005 (incorporated by reference to Exhibit 10.3 to Accelrys, Inc.’s Report on Form 10-Q for the quarter ended September 30, 2005). | |
| 10.19 | Sublease, dated May 10, 2006, between Accelrys, Inc., Accelrys, Ltd., QUALCOMM Inc., and QUALCOMM UK Ltd. (incorporated by reference to Exhibit 10.33 to Accelrys, Inc.’s Report on Form 10-K for the year ended March 31, 2006). | |
| 10.20# | Employment Agreement dated May 21, 2006 by and between Accelrys, Inc. and Mark J. Emkjer. (incorporated by reference to Exhibit 10.34 to Accelrys, Inc.’s Report on Form 10-K for the year ended March 31, 2006). | |
78
Table of Contents
| Exhibit |
Description | |
| 10.21# | Letter of Employment, dated September 1, 2006, between Accelrys, Inc. and Rick E. Russo (incorporated by reference to Exhibit 99.1 to Accelrys, Inc.’s Form 8-K dated September 6, 2006) | |
| 10.22# | Letter of Employment, dated September 6, 2006, between Accelrys, Inc. and Frank K. Brown, Ph.D. (incorporated by reference to Exhibit 99.3 to Accelrys, Inc.’s Form 8-K dated September 28, 2006) | |
| 10.23# | Second Amendment to Employment Agreement, dated September 26, 2006, between Accelrys, Inc. and Mathew Hahn, Ph.D. (incorporated by reference to Exhibit 99.2 to Accelrys, Inc.’s Form 8-K dated September 28, 2006) | |
| 10.24# | Form of Employment Agreement between Accelrys, Inc. and certain of its executives (incorporated by reference to Exhibit 10.5 to Accelrys, Inc.’s Form 10-Q for the quarter ended September 30, 2006) | |
| 10.25# | Form of Director Restricted Stock Unit Award Agreement (incorporated by reference to Exhibit 99.1 to Accelrys, Inc.’s Report on Form 8-K dated August 21, 2007). | |
| 10.26# | Form of Performance Based Restricted Stock Unit Award Agreement between Accelrys, Inc. and certain of its executives (incorporated by reference to Exhibit 10.3 to Accelrys, Inc.’s Report on Form 10-Q for the quarter ended June 30, 2008). | |
| 10.27# | Separation Agreement and Release for Mark Emkjer (incorporated by reference to Exhibit 10.1 to Accelrys, Inc.’s Report on Form 8-K dated January 5, 2009). | |
| 10.28# | Letter of Employment, dated January 5, 2009, between the Company and Todd Johnson (incorporated by reference to Exhibit 10.2 to Accelrys, Inc.’s Report on Form 8-K dated January 5, 2009). | |
| 10.29 | Employment Separation Agreement and Release, dated August 4, 2008, between Accelrys, Inc. and Richard Murphy (incorporated by reference to Exhibit 10.1 to Accelrys, Inc.’s Report on Form 10-Q for the quarter ended June 30, 2008). | |
| 10.30 | Employment Agreement, dated August 6, 2008, between Accelrys, Inc. and Ilene Vogt (incorporated by reference to Exhibit 10.2 to Accelrys, Inc.’s Report on Form 10-Q for the quarter ended June 30, 2008). | |
| 10.31 | Agreement between Accelrys and UBS dated November 11, 2008 (incorporated by reference to Exhibit 10.1 to Accelrys, Inc.’s Report on Form 8-K dated November 11, 2008). | |
| 10.32# | Fiscal year 2010 Management Incentive Plan (incorporated by reference to Exhibit 10.36 to Accelrys, Inc.’s Annual Report on Form 10-K for the year ended March 31, 2009) | |
| 10.33# | Employment Agreement, dated June 15, 2009, between Max Carnecchia and Accelrys, Inc. (incorporated by reference to Exhibit 10.2 to Accelrys, Inc.’s Report on Form 8-K dated June 16, 2009). | |
| 10.34# | Letter of Employment, dated June 15, 2009, between Max Carnecchia and Accelrys, Inc. (incorporated by reference to Exhibit 10.3 to Accelrys, Inc.’s Report on Form 8-K dated June 16, 2009). | |
| 10.35# | Stock Option Agreement, dated June 15, 2009, between Max Carnecchia and Accelrys, Inc. (incorporated by reference to Exhibit 10.4 to Accelrys, Inc.’s Report on Form 8-K dated June 16, 2009). | |
| 10.36# | Letter Agreement, dated July 15, 2009, between Todd Johnson and Accelrys, Inc. (incorporated by reference to Exhibit 10.1 to Accelrys, Inc.’s Report on Form 8-K dated July 20, 2009). | |
79
Table of Contents
| Exhibit |
Description | |
| 10.37# | Separation Agreement and Release, dated December 31, 2009, between Rick Russo and Accelrys, Inc. (incorporated by reference to Exhibit 10.4 to Accelrys, Inc.’s Report on Form 8-K dated January 5, 2010). | |
| 10.38# | Letter of Employment, dated December 14, 2009, between Accelrys, Inc. and Paul Burrin (incorporated by reference to Exhibit 10.1 to Accelrys, Inc.’s Report on Form 8-K dated January 5, 2010). | |
| 10.39# | Letter of Employment, dated December 23, 2009, between Accelrys, Inc. and Michael Piraino (incorporated by reference to Exhibit 10.2 to Accelrys, Inc.’s Report on Form 8-K dated January 5, 2010). | |
| 10.40# | Employment Agreement, dated January 5, 2010, between Michael Piraino and Accelrys, Inc. (incorporated by reference to Exhibit 10.3 to Accelrys, Inc.’s Report on Form 8-K dated January 5, 2010). | |
| 10.41 | Form of Voting Agreement, dated April 5, 2010, by and between Accelrys, Inc. and the directors and certain executive officers of Symyx Technologies, Inc. (incorporated by reference to Annex D to the joint proxy statement/prospectus forming part of Accelrys, Inc.’s Registration Statement on Form S-4 filed on May 5, 2010). | |
| 14.1 | Code of Ethics (incorporated by reference to Exhibit 14.1 to Accelrys, Inc.’s Report on Form 8-K filed on February 5, 2005). | |
| 21.1* | Subsidiaries of Accelrys, Inc. | |
| 23.1* | Consent of Independent Registered Public Accounting Firm | |
| 31.1* | Section 302 Certification of the Principal Executive Officer | |
| 31.2* | Section 302 Certification of the Principal Financial Officer | |
| 32.1* | Section 906 Certification of the Chief Executive Officer and Chief Financial Officer | |
| # | Represents a management contract or compensatory plan or arrangement. |
| * | Filed herewith |
| (b) | Exhibits |
See Item 15(a)(3) above.
| (c) | Financial Statement Schedules |
See Item 15(a)(2) above.
80
Table of Contents
Pursuant to the requirements of Section 13 or 15(d) of the Securities Exchange Act of 1934, the registrant has duly caused this report to be signed on its behalf by the undersigned, thereunto duly authorized.
| ACCELRYS, INC. | ||
| By: | /s/ MICHAEL A. PIRAINO | |
| Michael A. Piraino Senior Vice President and Chief Financial Officer | ||
| Date: May 27, 2010 | ||
81
Table of Contents
POWER OF ATTORNEY
KNOW ALL PERSONS BY THESE PRESENTS, that each person whose signature appears below constitutes and appoints Max Carnecchia and Michael A. Piraino, jointly and severally, as his or her attorney-in-fact, each with full power of substitution, for him or her, in any and all capacities, to sign each amendment to this report on Form 10-K, and to file the same, with exhibits thereto and other documents in connection therewith, with the Securities and Exchange Commission, hereby ratifying and confirming all that each of said attorneys-in-fact or his or her substitute or substitutes may lawfully do or cause to be done by virtue hereof.
Pursuant to the requirements of the Securities Exchange Act of 1934, this Report has been signed below by the following persons on behalf of the registrant and in the capacities and on the dates indicated:
| Signatures |
Title |
Date | ||
| /s/ MAX CARNECCHIA Max Carnecchia |
President and Chief Executive Officer (Principal Executive Officer) | May 27, 2010 | ||
| /s/ MICHAEL A. PIRAINO Michael A. Piraino |
Senior Vice President and Chief Financial Officer (Principal Accounting and Financial Officer) | May 27, 2010 | ||
| /s/ KENNETH L. COLEMAN Kenneth L. Coleman |
Chairman of the Board of Directors | May 27, 2010 | ||
| /s/ JEFFREY RODEK Jeffrey Rodek |
Director | May 27, 2010 | ||
| /s/ RICARDO B. LEVY, Ph.D. Ricardo B. Levy, Ph.D. |
Director | May 27, 2010 | ||
| /s/ CHRISTOPHER J. STEFFEN Christopher J. Steffen |
Director | May 27, 2010 | ||
| /s/ LARRY FERGUSON Larry Ferguson |
Director | May 27, 2010 | ||