Attached files
| file | filename |
|---|---|
| EX-32 - EX-32 - COMPUWARE CORP | k49078exv32.htm |
| EX-21.1 - EX-21.1 - COMPUWARE CORP | k49078exv21w1.htm |
| EX-31.1 - EX-31.1 - COMPUWARE CORP | k49078exv31w1.htm |
| EX-31.2 - EX-31.2 - COMPUWARE CORP | k49078exv31w2.htm |
| EX-23.1 - EX-23.1 - COMPUWARE CORP | k49078exv23w1.htm |
Table of Contents
UNITED STATES
SECURITIES AND EXCHANGE COMMISSION
SECURITIES AND EXCHANGE COMMISSION
Washington, D.C. 20549
FORM 10-K
| þ | ANNUAL REPORT PURSUANT TO SECTION 13 OR 15(d) OF THE SECURITIES EXCHANGE ACT OF 1934 |
FOR THE FISCAL YEAR ENDED MARCH 31, 2010
Commission File Number: 000-20900
COMPUWARE CORPORATION
(Exact name of registrant as specified in its charter)
| Michigan | 38-2007430 | |
| (State or other jurisdiction of incorporation or organization) | (I.R.S. Employer Identification No.) |
One Campus Martius, Detroit, MI 48226-5099
(Address of principal executive offices including zip code)
(Address of principal executive offices including zip code)
Registrant’s telephone number, including area code: (313) 227-7300
Securities registered pursuant to Section 12(b) of the Act:
Title of Each Class
|
Name of Each Exchange on Which Registered | |
Common Stock, par value $.01 per share
|
Nasdaq Global Select Market | |
Preferred Stock Purchase Rights
|
Nasdaq Global Select Market |
Securities registered pursuant to Section 12(g) of the Act: None
Indicate by check mark if the registrant is a well-known seasoned issuer, as defined in Rule 405 of
the Securities Act of 1933. Yes þ No o
Indicate by check mark if the registrant is not required to file reports pursuant to Section 13 or
Section 15(d) of the Securities Exchange Act of 1934. Yes o No þ
Indicate by check mark whether the registrant (1) has filed all reports required to be filed by
Section 13 or 15(d) of the Securities Exchange Act of 1934 during the preceding 12 months (or for
such shorter period that the registrant was required to file such reports), and (2) has been
subject to such filing requirements for the past 90 days. Yes þ No o
Indicate by check mark whether the registrant has submitted electronically and posted on its
corporate Web site, if any, every Interactive Data File required to be submitted and posted
pursuant to Rule 405 of Regulation S-T during the preceding 12 months (or for such shorter period
that the registrant was required to submit and post such files). Yes o No o
Indicate by check mark if disclosure of delinquent filers pursuant to Item 405 of Regulation S-K is
not contained herein, and will not be contained, to the best of the registrant’s knowledge, in
definitive proxy or information statements incorporated by reference in Part III of this Form 10-K
or any amendment to this Form 10-K. o
Indicate by check mark whether the registrant is a large accelerated filer, an accelerated filer, a
non-accelerated filer, or a smaller reporting company. See definitions of “large accelerated
filer”, “accelerated filer” and “smaller reporting company” in Rule 12b-2 of the Exchange Act.
(Check one):
| Large accelerated filer þ | Accelerated filer o | Non-accelerated filer o | Smaller reporting company o | |||
| (Do not check if a smaller reporting company) |
Indicate by check mark whether the registrant is a shell company (as defined in Rule 12b-2 of the
Exchange Act). Yes o No þ
The aggregate market value of the voting stock held by non-affiliates of the registrant as of
September 30, 2009, the last business day of the registrant’s most recently completed second fiscal
quarter, was $1,290,470,770, based upon the closing sales price of the common stock on that date of
$7.33 as reported on The NASDAQ Global Select Market. For purposes of this computation, all
executive officers, directors and 10% beneficial owners of the registrant are assumed to be
affiliates. Such determination should not be deemed an admission that such officers, directors and
beneficial owners are, in fact, affiliates of the registrant.
There were 225,026,430 shares of $.01 par value common stock outstanding as of May 14, 2010.
DOCUMENTS INCORPORATED BY REFERENCE
Portions of the definitive Proxy Statement for the Registrant’s 2010 Annual Meeting of Shareholders
(the “Proxy Statement”) filed pursuant to Regulation 14A are incorporated by reference in Part III.
COMPUWARE CORPORATION AND SUBSIDIARIES
FORM 10-K
Table of Contents
FORM 10-K
Table of Contents
| Item | ||||||||
| Number |
Page | |||||||
| PART I |
||||||||
| 3 | ||||||||
| 18 | ||||||||
| 24 | ||||||||
| 24 | ||||||||
| 24 | ||||||||
| PART II |
||||||||
| 25 | ||||||||
| 28 | ||||||||
| 29 | ||||||||
| 50 | ||||||||
| 52 | ||||||||
| 92 | ||||||||
| 92 | ||||||||
| 94 | ||||||||
| PART III |
||||||||
| 95 | ||||||||
| 95 | ||||||||
| 95 | ||||||||
| 96 | ||||||||
| 96 | ||||||||
| PART IV |
||||||||
| 97 | ||||||||
| EX-21.1 | ||||||||
| EX-23.1 | ||||||||
| EX-31.1 | ||||||||
| EX-31.2 | ||||||||
| EX-32 | ||||||||
2
Table of Contents
PART I
ITEM 1. BUSINESS
We deliver value to businesses worldwide by providing software and web performance solutions,
professional services and application services that improve the performance of information
technology (“IT”) organizations. Originally founded in 1973 as a professional services company, we
began to offer mainframe productivity tools for fault diagnosis, file and data management, and
application debugging in the late 1970’s.
In the 1990’s and 2000’s, IT moved toward distributed and web-based platforms. Our solutions
portfolio grew in response, and we now market a comprehensive portfolio of IT solutions across the
full range of enterprise computing platforms that help:
| • | Develop and deliver high quality, high performance enterprise business applications in a timely and cost-effective manner. |
| • | Measure, manage and communicate IT service delivery in business terms, and maintain consistent, high levels of service delivery. |
| • | Optimize the performance, availability and quality of web and mobile applications. |
| • | Provide executive visibility, decision support and process automation across the entire IT organization to enable all available resources to be harnessed in alignment with business priorities. |
Additionally, to be competitive in today’s global economy, enterprises must securely share
applications, information and business processes. We address this market need through our
application services, which are marketed under the brand name “Covisint”. Our application services
offerings provide a software-as-a-service platform that enables industries and business communities
to securely integrate vital information and processes across users, business partners, customers,
vendors and suppliers.
We operate in four business segments in the software and technology services industries: products,
web performance services, professional services and application services (see Note 13 of the notes
to consolidated financial statements, included in Item 8 of this report).
For a discussion of developments in our business during fiscal 2010, see Item 7, Management’s
Discussion and Analysis of Financial Condition and Results of Operations.
We were incorporated in Michigan in 1973. Our executive offices are located at One Campus Martius,
Detroit, Michigan 48226-5099, and our telephone number is (313) 227-7300. Our Internet address is
www.compuware.com. We make available in the investor relations section of our external web site,
our Codes of Conduct and our Board committee charters, as well as copies of reports we file with
the Securities and Exchange Commission as soon as reasonably practicable after we electronically
file such reports. The information contained on our web site should not be considered part of this
report.
This report contains certain forward-looking statements within the meaning of the federal
securities laws. When we use words such as “may”, “might”, “will”, “should”, “believe”, “expect”,
“anticipate”, “estimate”, “continue”, “predict”, “forecast”, “projected”, “intend” or similar
expressions, or make statements regarding our future plans, objectives or expectations, we are
making forward-looking statements. Numerous important factors, risks and uncertainties affect our
operating results, including, without limitation, those discussed in Item 1A. Risk Factors and
elsewhere in this report, and could cause actual results to differ materially from the results
implied by these or any other forward-looking statements made by us, or on our behalf. There can be
no assurance that future results will meet expectations. While we believe that our forward-looking
statements are reasonable, you should not
place undue reliance on any such forward-looking statements, which speak only as of the date made.
Except as required by applicable law, we do not undertake any obligation to publicly release any
3
Table of Contents
revisions which may be made to any forward-looking statements to reflect events or circumstances
occurring after the date of this report.
OUR BUSINESS STRATEGY
Our business strategy is to focus on providing software products, web application performance
management services, professional services and application services that deliver value to the
largest users of information technology in the world. Our enterprise IT solutions are focused on
providing a real return on investment for our customers by increasing the performance of the entire
IT organization and enabling IT management to deliver maximum business impact in support of the
organization’s strategic objectives.
During fiscal 2009, we launched our Compuware 2.0 initiative with the main objective of delivering
superior end-to-end application performance, called Business Service Delivery (“BSD”), to meet the
growing and ever-more critical demand from enterprises that application systems deliver value to
their business. Compuware’s BSD approach enables IT to move from a reactive and operations-oriented
approach to one that is proactive and business-driven across distributed, mainframe and web-based
environments.
During fiscal 2010, we advanced the Compuware 2.0 initiative by divesting our Quality and
DevPartner software products which were non-core to our BSD approach and expanded our BSD product
offerings by acquiring Gomez Inc. (“Gomez”) which offers web application performance management
services (“web performance services”) delivered through an on-demand software-as-a-service
platform. Gomez’s web performance services combined with our Vantage family of IT service
management products offers an application performance management solution that provides
organizations with broad visibility and deep-dive resolution across their entire application
delivery chain, spanning both the enterprise and the Internet.
Furthermore, we continue to execute on our strategy to deliver a broad range of IT services in our
Professional Services business. The objective is to focus on engagements where we can provide value
that allows us to achieve our contribution margin targets.
In addition, we continue to advance our Application Services business (“Covisint”) strategy with an
increased focus on the healthcare market while maintaining customer satisfaction in the automotive
industry. Hospitals, physicians and the United States government continue to move towards
establishing electronic patient health and medical records which will require secure computerized
databases and environments for storing and sharing of information. Our healthcare portal and
messaging solutions are designed to meet this demand and will be a factor in our future growth of
the application services segment.
4
Table of Contents
SOFTWARE PRODUCTS
The following table sets forth, for the periods indicated, a breakdown of total products segment
revenue (license and maintenance fees) by product line and the percentage of total revenues for
each line (dollars in thousands):
| Year Ended March 31, | Percentage of Total Revenues | |||||||||||||||||||||||
| Products Segment Revenue | 2010 | 2009 | 2008 | 2010 | 2009 | 2008 | ||||||||||||||||||
Mainframe Products |
||||||||||||||||||||||||
File-AID |
$ | 140,490 | $ | 148,134 | $ | 157,207 | 15.7 | % | 13.6 | % | 12.8 | % | ||||||||||||
Xpediter |
84,102 | 88,863 | 98,507 | 9.4 | 8.1 | 8.0 | ||||||||||||||||||
Hiperstation |
15,309 | 17,147 | 18,787 | 1.7 | 1.6 | 1.5 | ||||||||||||||||||
Abend-AID |
118,317 | 118,309 | 125,942 | 13.3 | 10.9 | 10.3 | ||||||||||||||||||
Strobe |
77,262 | 77,948 | 86,244 | 8.7 | 7.1 | 7.0 | ||||||||||||||||||
Total Mainframe Products Revenue |
435,480 | 450,401 | 486,687 | 48.8 | 41.3 | 39.6 | ||||||||||||||||||
Distributed Products |
||||||||||||||||||||||||
Vantage |
119,342 | 114,568 | 130,064 | 13.4 | 10.5 | 10.6 | ||||||||||||||||||
Changepoint |
22,642 | 24,982 | 28,479 | 2.5 | 2.3 | 2.3 | ||||||||||||||||||
Uniface |
39,281 | 44,730 | 48,493 | 4.4 | 4.1 | 3.9 | ||||||||||||||||||
File-AID/EX |
3,687 | 4,191 | 5,536 | 0.4 | 0.4 | 0.4 | ||||||||||||||||||
Total Distributed Products Revenue |
184,952 | 188,471 | 212,572 | 20.7 | 17.3 | 17.2 | ||||||||||||||||||
Divested Products Revenue * |
13,563 | 60,242 | 74,621 | 1.6 | 5.5 | 6.1 | ||||||||||||||||||
Total Products Segment Revenue |
$ | 633,995 | $ | 699,114 | $ | 773,880 | 71.1 | % | 64.1 | % | 62.9 | % | ||||||||||||
| * | Divested products relate to our Quality and DevPartner product lines that were sold during fiscal 2010. See Note 3 of the notes to consolidated financial statements, included in Item 8 of this report, for more information on this divestiture. |
COMPUWARE SOFTWARE PRODUCTS
Our software products consist of four major product lines: Mainframe, Vantage, Changepoint and
Uniface – all of which are primarily intended for use by IT organizations and IT service providers.
These solutions enhance the effectiveness of key disciplines throughout the IT organization and
support all major enterprise computing platforms.
In May 2009, we sold our Quality and DevPartner distributed product lines, other than File-AID/EX,
to Micro Focus International PLC. See Note 3 of the Notes to Consolidated Financial Statements,
included in Item 8 of this report.
MAINFRAME MARKET
The market for mainframe products is well-defined and the drive to extend legacy applications into
distributed environments continues to underscore the need for reliable, high-volume business
application processing.
We intend to remain focused on developing, marketing and supporting high-quality software products,
both to support traditional uses of the mainframe and to enable IT organizations to rationalize,
modernize and extend their legacy application portfolios. In addition, we have enhanced product
integration and built new graphical user interfaces to increase the value that our customers obtain
from the use of our products, to enhance the synergy among the functional groups working on key
business applications and to make IT processes more streamlined, automated and repeatable.
5
Table of Contents
Mainframe Solutions
Our mainframe software products (“mainframe products”) focus on improving the productivity of
development, maintenance and support teams in application analysis, testing, defect detection and
remediation, fault management, file and data management, data compliance and application service
management in the IBM z/OS environment. We believe these products are and will continue to be among
the industry’s leading solutions for this platform.
Our mainframe products are functionally rich, are focused on customer needs and are easy to
install, with minimal user training. We strive to ensure a common look and feel across our products
and emphasize ease of use in all aspects of product design and functionality. Most products can be
used immediately without modification of customer development practices and standards. These
products can be quickly integrated into day-to-day development, testing, debugging and maintenance
activities.
Our mainframe products are grouped into five product families: File-AID, Xpediter, Hiperstation,
Abend-AID and Strobe.
File-AID
File-AID products provide a consistent, familiar and secure method for IT professionals to
access, analyze, edit, compare, move and transform data across all strategic environments.
File-AID products are used to quickly resolve production data problems and manage ongoing
changes to data and databases at any stage of the application life cycle, including building
test data environments to provide the right data in the shortest time. The File-AID product
family can also be used to address data privacy compliance requirements in pre-production test
environments.
Xpediter
Xpediter interactive debugging products help developers integrate enterprise applications, build
new applications and modernize and extend their legacy applications, satisfying corporate
scalability, reliability and security requirements. Xpediter products deliver powerful analysis
and testing capabilities across multiple environments, helping developers test more accurately
and reliably, in less time.
Hiperstation
Hiperstation products deliver complete pre-production testing functionality for automating test
creation and execution, test results analysis and documentation. Hiperstation also provides
application auditing capabilities to address regulatory compliance and other business
requirements. The products simulate the on-line systems environment, allowing programmers to
test applications under production conditions without requiring actual users at terminals. The
products’ powerful functions and features enhance unit, concurrency, integration, migration,
capacity, regression and stress testing. When deployed in production, Hiperstation products
allow scalable logging of application transactions and provide audit reporting to aid in problem
resolution and to support other uses of the captured transaction information such as analysis of
security breaches.
Abend-AID
Abend-AID products enable IT professionals to quickly diagnose and resolve application and
system failures. The products automatically collect program and environmental information,
analyze the information and present diagnostic and supporting data in a way that can be easily
understood by all levels of IT staff. Automated failure notification helps speed problem
resolution and reduce downtime.
6
Table of Contents
Strobe
Strobe products work together to help customers locate and eliminate sources of performance
issues and excessive resource demands during every phase of an application’s life cycle. Strobe
products measure the activity of z/OS-based online and batch applications, providing reports on
where and how time is spent during execution. Strobe products support an extensive array of
subsystems, databases and languages. These products can be applied via a systematic program to
reduce the consumption of mainframe resources and reduce associated costs and/or make resources
available for additional business workloads.
DISTRIBUTED MARKET
In contrast to the mainframe market, the distributed market is characterized by multiple hardware,
software and network configurations. Combined with the push to provide enhanced versatility through
service-oriented architectures, IT organizations are challenged to combine agility, cost
effectiveness and control in developing and delivering reliable, scalable and high quality
enterprise applications that meet business needs, while facing an exponential increase in
environment complexity. We believe our distributed products address these challenges and that we
are emerging as a premier provider of application performance management solutions to enterprise IT
organizations.
Distributed Software Products
Our distributed software products (“distributed products”) focus on maximizing the performance of
the entire IT organization, including applications and operations organizations, as well as
enabling top-level IT management decision-making. These products support service delivery through
comprehensive service management capabilities encompassing business service management, end-user
experience monitoring and application performance management. These products also support
business-centric IT management through comprehensive IT portfolio management; enabling investment
prioritization driven by business strategy, portfolio-driven management decision making, effective
visibility and control over IT supply and demand, and value transparency back to line-of-business
management.
Our strategy for distributed products is to focus on IT software solutions in the following three
areas: (1) Application Performance Management (Vantage); (2) Business Portfolio Management
(Changepoint); and (3) Enterprise Application Development (Uniface). Compuware’s distributed
products enable IT to move from a reactive and operations-oriented approach to one that is
proactive and business-driven. Compuware distributed products ensure that applications are
available, performing, and meet the needs of end users; that problems are proactively detected and
resolved; that application investments are aligned with business priorities; and that IT is able to
define and understand a view of service that matter most to the business.
Application Performance Management
The Vantage family of IT service management products provides an end-to-end approach for managing
application performance by combining: (1) End User Experience Monitoring; (2) Business Service
Management; and (3) Vantage Application Performance Management.
End User Experience Monitoring (“EUEM”) provides visibility into application service from the
end user perspective. This enables proactive IT service management by allowing IT organizations
to continuously monitor all applications. EUEM also puts application performance in context of
key business entities: applications, users and locations. With this perspective, EUEM helps IT
organizations assess the scope of a performance problem and isolate it to the client, network,
server or application tier, making it more efficient to resolve the performance problem.
Business Service Management (“BSM”) provides real-time views of IT service delivery so that
Chief Information Officers (“CIOs”), IT managers and line-of-business counterparts can
understand the
7
Table of Contents
impact that IT services have on business operations. As a result, BSM helps the customer
communicate service delivery more effectively, meet service level agreements, improve
operational efficiency, reduce costs and increase satisfaction with the IT organization. BSM
also enhances collaboration both within the IT organization as well as between the IT
organization and the business by centralizing and correlating technical and key business
performance indicators.
Vantage Application Performance Management (“VAPM”) provides detailed application insight that
identifies and helps correct the causes of poor application performance within client
workstations, the network, a server, and Java and .NET environments, reducing time-consuming
guesswork. In addition, VAPM helps ensure successful application rollouts and provides crucial
information for establishing and meeting service requirements.
Our Vantage products, complemented with our Gomez web performance services, which are used by
enterprises to test and monitor the performance, availability and quality of their web
applications, and our Strobe product, which measures application performance and inefficiencies
within the mainframe environment, provide IT organizations with a comprehensive set of solutions
that provide visibility and deep-dive resolution across the entire application delivery chain,
spanning both the enterprise and the Internet. We believe these solutions will be significant
contributors to the future growth of our revenues.
Business Portfolio Management
Compuware Changepoint is a governance and management solution addressing the needs of executives at
the helm of technology companies, enterprise IT and professional services organizations. Our
business portfolio offering is the first integrated solution to enable the management of the IT,
product and service portfolio, providing visibility into the health of key business deliverables
from a financial, project and customer perspective.
Changepoint helps to maximize business value by improving an organization’s ability to manage key
processes, provide visibility and govern decision-making. Changepoint does this by automating core
business processes in and across IT, product delivery and services functions to reduce costs and
increase the efficiency and quality of deliverables while allowing companies to do more with their
scarce resources.
Changepoint for Technology Companies allows technology companies to maximize professional
services profitability while maintaining a focus on effective product decisions and delivery.
Changepoint’s integrated solution combines professional services automation (“PSA”) with project
portfolio management to provide total operational visibility allowing product-centric technology
companies to drive services growth with strong margins, deliver a competitive product and
services mix for high return on investment, and maintain top-line revenues and bottom-line
profitability.
Changepoint for IT Portfolio Management is a business-centric IT management solution that
enables IT executives to take a comprehensive approach to managing supply and demand, unlocking
the potential of an IT organization to effectively meet the needs of the business. Using
Changepoint, CIOs can deliver maximum business value through enhanced IT performance, improved
collaboration between IT and business leadership, closer alignment of resources and activities
with the business strategy, increased responsiveness to changing business needs and more
effective life cycle management of the entire IT portfolio.
Changepoint PSA provides a single business management solution designed specifically to automate
and integrate the processes of services organizations at every stage of an engagement. With
Changepoint PSA, professional services organizations can support key service delivery processes,
easily pinpoint areas for improvement and track critical service performance metrics, paving the
way to greater resource utilization, financial control and analysis and customer satisfaction.
8
Table of Contents
Enterprise Application Development
Uniface is our service oriented architecture-based Application Platform Suite. With Uniface,
developers can develop, integrate, maintain and deploy complex business-critical applications.
Uniface combines the following three development techniques into one integrated tool:
| • | Component-based development, to develop individual components that will eventually become uniquely designated business services. This is mostly done in web-based environments. | ||
| • | Process-driven design and development to create, orchestrate, monitor and tune the business flows needed to activate and execute the services. | ||
| • | Legacy integration facilities to preserve as many legacy assets as possible, maximizing the return on investment and eliminating redevelopment risks. |
Uniface is available on a wide variety of deployment platforms including Windows, Unix, Web,
Mainframe and Mobile computers.
Divested Products
Our Quality and DevPartner products, except for File-AID/EX, were divested in May 2009 as discussed
in Note 3 of the notes to consolidated financial statements, included in Item 8 of this report. The
Quality family of products delivered a full spectrum of automated testing capabilities designed to
validate applications running across various distributed environments, isolate and correct problems
and ensure that applications would meet performance requirements before they were deployed in
production. The DevPartner Studio family of products provided analysis, automation and metrics to
help application delivery teams build reliable, high-performance applications and components for
Microsoft.NET. These products provided code, memory and performance analysis and measured testing
code coverage.
SEASONALITY
We tend to experience a higher volume of product transactions and associated license revenue in the
quarter ended December 31, which is our third fiscal quarter, and the quarter ended March 31, which
is our fourth fiscal quarter, as a result of customer spending patterns.
SOFTWARE LICENSING, PRODUCT MAINTENANCE AND CUSTOMER SUPPORT
We license software to customers using two types of software licenses, perpetual and term.
Generally, perpetual software licenses allow customers a perpetual right to run our software on
hardware up to a licensed aggregate MIPS (Millions of Instructions Per Second) capacity or to run
our distributed software for a specified number of users or servers. Term licenses allow customers
a right to run our software for a limited period of time on hardware up to a licensed aggregate
MIPS capacity or for a specific number of users or servers. We also offer perpetual or term license
rights that allow our customers a right to run our mainframe software on hardware with an unlimited
MIPS capacity.
Our customers also purchase maintenance and support services that provide technical support and
advice, including problem resolution services and assistance in product installation, error
corrections and any product enhancements released during the maintenance period. Maintenance and
support services are provided online, through our FrontLine technical support web site, by
telephone access to technical personnel located in our development labs and by support personnel in
the offices of our foreign subsidiaries and distributors.
Licensees have the option of renewing their maintenance agreements on an annual or multi-year basis
for an annual fee based on the license price of the product. We also enter into agreements with our
9
Table of Contents
customers that allow them to license software and purchase multiple years of maintenance in a
single transaction (multi-year transactions). In support of these multi-year transactions, we allow
extended payment terms to qualifying customers.
We believe that effective support of our customers and products during both the trial period and
for the maintenance term is a substantial factor in product satisfaction and subsequent new product
sales. We believe our installed base is a significant asset and intend to continue to provide
customer support and product enhancements to ensure a continuing high level of customer
satisfaction. In fiscal 2010, 2009 and 2008, we experienced high customer maintenance renewal
rates.
For fiscal 2010, 2009 and 2008, software license fees represented approximately 21.8%, 20.1% and
24.2%, respectively, and maintenance fees represented approximately 49.3%, 44.0% and 38.7%,
respectively, of our total revenues.
WEB PERFORMANCE SERVICES
Through the acquisition of Gomez in fiscal 2010, we expanded our solutions to include web
performance services, which are used by enterprises to test and monitor the performance,
availability and quality of their web applications while in development and after deployment. The
web environment is becoming increasingly fragmented and complex, and a user’s experience with a
company’s web application often comes together for the first time at the user’s browser, outside
the view and control of the company. In order to deliver a web experience of consistently high
quality in the increasingly complex web environment, companies require a web application delivery
management solution capable of testing new applications accurately before deployment and testing
and monitoring the quality of web application after deployment. The Gomez software-as-a-service
platform enables organizations to test and monitor web applications from outside their firewall
using our web performance services network (“Gomez Performance Network”). Gomez’s web performance
services are delivered entirely through an on-demand, hosted model built on a multi-tenant
architecture in which a single instance of the software serves all customers. This service is
provided on a subscription basis, principally through tiered usage plans that contain committed
testing measurement levels based on the number of web page measurements performed. Gomez customers
are organizations that use the Internet to conduct commerce, convey and receive content, and
communicate with customers, partners, employees and vendors.
Customers access Gomez’s web performance services through a self-service portal that provides
access to services in four basic functional areas: (1) Web Cross-Browser Testing, (2) Web Load and
Performance Testing, (3) Web Performance Management and (4) Web Performance Business Analysis.
Web Cross-Browser Testing — Helps ensure that an organization’s web application renders and
functions optimally across numerous combinations of browsers, operating systems and access
devices, including mobile devices using our Reality View XF and Reality Check XF services.
Web Load and Performance Testing — Measures web application performance, availability and
quality, at normal and peak loads generated by the Gomez Performance Network, across geographic
locations using our Reality Load XF service.
Web Performance Management — Monitors a web application’s performance availability and quality
to provide diagnostic detail and actionable data that a customer can use to address user
problems and improve response times using our Active Network XF, Active Last Mile XF, Active
Data Center XF, Active Mobile XF, Active Experience XF, Private Network XF and Private Location
XF services.
Web Performance Business Analysis — Provides analytics, benchmarks and dashboards that help a
customer understand and manage the impact of user web experiences on the customer’s business
using our Industry Benchmarks services.
10
Table of Contents
For fiscal 2010, web performance services segment fees (subscription fees) represented 1.9% of our
total revenues.
PROFESSIONAL SERVICES
We offer a broad range of IT services for distributed and mainframe environments, including IT
portfolio management services, application delivery management services, application outsourcing
services and enterprise legacy modernization services. Our service offerings are focused on six key
practice areas: (1) Governance; (2) Requirements Management; (3) Quality Management; (4) Business
Intelligence and Data Management; (5) Architecture and Development; and (6) Operations Management.
In addition, our Solution Delivery Group offers implementation, consulting and training services in
tandem with the Company’s product solutions offerings, which are referred to as product related
services.
We believe that the demand for professional services will continue to be driven by our customers’
need to control costs, the significant level of resources necessary to support complex and rapidly
changing hardware, software and communication technologies and our customers’ need for a larger
technical staff for ongoing maintenance. Our business approach to professional services delivery
emphasizes hiring experienced staff, ongoing training, high staff utilization and immediate,
productive deployment of new personnel at client locations.
Our objective in the professional services division is to create long-term relationships with
customers in which our professional staff join with the customer’s IT organization to plan, design,
program, implement and maintain technology-based solutions that achieve customer business goals.
Typically, the professional services staff is integrated with the customer’s development team on a
specific application or project. Professional services staff work primarily at customer sites or at
our professional services offices located throughout the world. In addition, we offer a development
center that serves customers looking for flexible, cost-effective and high-quality services
delivered remotely from our facility in Montreal, Canada.
For fiscal 2010, 2009, and 2008, professional services segment fees represented approximately
22.5%, 32.7%, and 34.1%, respectively, of our total revenue. See “Management’s Discussion and
Analysis of Financial Condition and Results of Operations”, included in Item 7 of this report, for
information on how our business strategy has impacted our professional services segment fees.
APPLICATION SERVICES
Our application services, which are marketed under the brand name “Covisint”, provide a
software-as-a-service platform, referred to as the Covisint ExchangeLink, which offers
industry-specific solutions for organizations in automotive, healthcare, public sector, and
financial services industries, and offers support services in seven languages in emerging markets.
Covisint streamlines and automates business processes, globally connecting business communities,
organizations and systems. Companies of all sizes, locations, and technical capacities rely on
Covisint to enable the secure sharing of vital business information, applications and business
processes across their internal and extended enterprise to deliver innovative approaches in solving
their business problems.
Covisint uses an industry-centric approach that leverages deep expertise and state-of-the-art
technology to address industry specific needs. With this approach, Covisint bridges the gap created
by dissimilar business systems, and allows businesses to work with the myriad of processes and
technologies used by its partners.
11
Table of Contents
Covisint ExchangeLink is a platform that includes services for identity management, community
collaboration, and electronic messaging. Underlying these core service offerings are Covisint
Support Services including security, availability, response times and global customer support.
The Covisint ExchangeLink platform allows us to provide four types of services: (1) Collaboration
Portal Services; (2) Identity Services; (3) Data Exchange Services; and (4) AppCloud:
Collaboration Portal Services (“CPS”) — is based on a highly scalable, reliable, and secure
service-oriented architecture solution that is deployed using a software-as-a-service model to
provide a secure, modular framework that supports sharing information and applications with
entities outside the organization.
Identity Services – allows companies and governments to securely share information and provide
access to applications inside the organization. Identity Services provides a broad range of
identity management features that can be utilized to implement custom identity management
solutions.
Data Exchange Services (“DES”) — supports mission critical processes for companies worldwide.
Our DES offers industry compliant electronic data interchange (“EDI”) solutions for companies of
any size or complexity. Supporting a broad range of system interfaces, document types and
protocols, DES provides the flexibility and power for a global EDI solution.
AppCloud — Provides a self-service environment that allows a single point of integration for
application providers who want to share their applications and/or data with members of Covisint
user communities. It also provides sponsoring organizations with a single location to obtain
business relevant third-party applications for their users.
For fiscal 2010, 2009 and 2008, application services segment fees represented approximately 4.5%,
3.2% and 3.0%, respectively, of our total revenue.
CUSTOMERS
Our products, web performance services, professional services and application services are used by
the IT departments of a wide variety of commercial and government organizations.
We did not have a single customer that accounted for greater than 10% of total revenue during
fiscal 2010, 2009 or 2008, or greater than 10% of accounts receivable at March 31, 2010 and 2009.
RESEARCH AND DEVELOPMENT
We have been successful in developing acquired products and technologies into marketable software.
Our research and development organization is primarily focused on enhancing and strengthening the
capabilities of our current software products, web performance services network and application
services network; along with designing and developing new web performance services and application
services.
We believe that our future growth lies in part in continuing to identify promising technologies
from all potential sources, including independent software developers, customers, other companies
and internal research and development.
As of March 31, 2010, development activities associated with our software product, web performance
services network and application services network are performed primarily at our headquarters in
Detroit, Michigan; and at our development labs in Amsterdam, The Netherlands; Gdansk, Poland;
Toronto, Canada; Lexington, Massachusetts; and Beijing, China.
12
Table of Contents
Research and development (“R&D”) costs were $65.8 million, $64.3 million and $76.2 million,
respectively, during fiscal 2010, 2009 and 2008 of which $9.8 million, $15.1 million and $14.4
million, respectively, were capitalized for internally developed software technology. R&D costs
related to our software products and web performance services network are reported as “Technology
development and support” in the consolidated statements of operations and for our application
services network, the costs are reported as “Cost of professional services”.
TECHNOLOGY AND NETWORKS OPERATIONS
Web Performance Services Network
We designed our web performance services as multi-tenant networked computing applications and
deliver those services entirely through an on-demand, hosted model. As such, we provide customer
provisioning, application installation, application configuration, server maintenance, server
co-location, data center maintenance, short-term data backup and data security.
Our web performance services enable a company to test and monitor the web experience from outside
its firewall using the Gomez Performance Network, which encompasses the following:
| • | over 150 backbone nodes located in more than 30 countries, and 11 mobile carriers in 3 countries; | ||
| • | over 100,000 last mile measurement points located in more than 160 countries; | ||
| • | our central data warehouse and three other third-party data center facilities; and | ||
| • | our portal into our customer data warehouse. |
Our backbone nodes are measurement computers, or sets of multiple computers, co-located at the data
center facilities of major telecommunication providers. In addition, backbone nodes can be
configured for use exclusively by a single customer as part of our Private Network XF service.
In order to establish our last mile measurement points, we engage individuals, or peers, located in
more than 160 countries to provide bandwidth and computing resources on personal computers
connected via local Internet service providers.
Our backbone nodes and last mile measurement points emulate a user accessing a web application from
a web browser. As the software accesses the web application and executes transactions as a user
would, it performs timing and availability measurements for the objects that comprise the web pages
it traverses. When a customer measures the web experience using our backbone nodes or last mile
measurement points, the test results and other measurement data are collected and stored in
near-real-time at our data warehouses. Customers can access our Gomez portal in order to reach the
measurement data that have been captured in our data warehouses.
We service customers from four third-party data center facilities, including our central data
warehouse. Two of these facilities are located in Massachusetts, one in Texas and one in Virginia.
Our data centers are designed to be scalable and to support control and data replication for large
numbers of measurement nodes. Each of the facilities has multiple high bandwidth interconnects to
the Internet.
13
Table of Contents
Application Services Network
Our application services are delivered through an on-demand, hosted model providing access across
the globe referred to as the Covisint ExchangeLink Network. The network’s primary data center is
hosted by a Savvis Communications Generation 5 facility located in Elk Grove, Illinois and is
connected globally through a federated network that interconnects to Network Access Points (“NAP”)
located in Shanghai, China; Frankfurt, Germany; and Tokyo, Japan. These NAPs are used to support
local network protocols and reduce network latency and are hosted by a major telecommunications
provider. The network connections between our primary data center and the NAPs are fully redundant,
high speed Internet connections using content caching to reduce network latency. Covisint’s
disaster recovery center is located in our headquarters building in Detroit, Michigan.
SALES AND MARKETING
We market software products, web performance services and product related professional services
primarily through a direct sales force in the United States, Canada, Europe, Japan, Asia-Pacific,
Brazil, Mexico and South Africa; an inside sales force in Lexington, Massachusetts for our web
performance services; and through independent distributors, giving us a presence in approximately
60 countries. We market our professional and application services primarily through account
managers located in offices throughout North America. This marketing structure enables us to keep
abreast of, and respond quickly to; the changing needs of our customers and to call on the actual
users of our products and services on a regular basis.
COMPETITION
The markets for our software products are highly competitive and characterized by continual change
and improvement in technology. We consider more than 40 firms to be directly competitive with one
or more of our products. These competitors include BMC Software, Inc., CA, Inc., International
Business Machines Corporation (“IBM”) and Hewlett-Packard Company. Some of these competitors have
substantially greater financial, marketing, recruiting and training resources than we do. The
principal competitive factors affecting the market for our software products include:
responsiveness to customer needs; functionality, performance and reliability of our software
products; ease of use; quality of customer support; vendor reputation; distribution channels; and
price.
The distributed software market in which we operate has many more competitors than our traditional
mainframe market. Our ability to compete effectively and our growth prospects depend upon many
factors, including the success of our existing distributed products, the timely introduction and
success of future software products, the ability of our products to interoperate and perform well
with existing and future leading databases and other platforms supported by our products and our
ability to bring products to market that meet ever-changing customer requirements.
The market for our web performance services is competitive and rapidly changing. Our competitors
currently include Keynote Systems, Hewlett-Packard, Neustar and a number of smaller, privately held
companies. The principal competitive factors affecting the market for our web performance services
include real-time availability of data and reporting; the proven performance, security,
scalability, flexibility and reliability of services offered; the usability of services offered,
including ease of implementation and use; and pricing.
The market for professional services is highly competitive, fragmented and characterized by low
barriers to entry. Our principal competitors include Accenture Ltd., Computer Sciences Corporation,
HP Enterprise Services (a Hewlett-Packard Company), IBM Global Services, Analysts International
Corporation, Keane, Inc., Infosys Technologies, Sun Microsystems (an Oracle Corporation Company)
and numerous other regional and local firms in the markets in which we have professional services
offices. Several of these competitors have substantially greater financial, marketing, recruiting
and
14
Table of Contents
training resources than we do. The principal competitive factors affecting the market for our
professional services include responsiveness to customer needs, breadth and depth of technical
skills offered, availability and productivity of personnel, the ability to demonstrate achievement
of results, and price.
The market for application services includes communication and collaboration services, user
identity and access management services and system to system communications provided in a
software-as-a service model. We provide application services primarily in the automotive and
healthcare vertical markets (“verticals”). The application services market is competitive in some
verticals and highly competitive related to system to system communications. Our principal
competitors within the automotive and healthcare verticals include HP Enterprise Services (a
Hewlett-Packard Company), IBM Global Services, GXS Strategies, General Electric Company and other
regional and local firms in the markets in which we have customers or potential customers. In the
other verticals served, since the market is not yet fully developed, the competition is not as
entrenched but other traditional software companies are beginning to provide offerings in a
software-as-a-service model. Some key competitive factors are speed of implementation, reduced
capital investment, reduced risk related to regulatory compliance and implementation problems,
inclusion of state of the art technology features, solution performance, ability to meet customer
service level requirements and price.
A variety of external and internal events and circumstances could adversely affect our competitive
capacity. Our ability to remain competitive will depend, to a great extent, upon our performance in
product development and customer support, effective sales execution and our ability to acquire and
integrate new technologies. To be successful in the future, we must respond promptly and
effectively to the challenges of technological change and our competitors’ innovations by
continually enhancing our own software products, web performance services, professional services
and application services.
PROPRIETARY RIGHTS
We regard our intellectual property and technology as proprietary trade secrets and confidential
information. We rely largely upon a combination of trade secret, copyright and trademark laws
together with our license and service agreements with customers and our internal security systems,
confidentiality procedures and employee agreements to maintain the trade secrecy of our
intellectual property and technology. We typically provide our products to users under
nonexclusive, nontransferable, perpetual licenses. We protect our proprietary rights under license
agreements which define how our customers use our products. Under certain limited circumstances, we
may be required to make source code for our products available to our customers under an escrow
agreement, which restricts access to and use of the source code. Although we take steps to protect
our trade secrets, there can be no assurance that misappropriation will not occur. In addition, the
laws of some foreign countries do not protect our proprietary rights to the same extent as the laws
of the United States.
In addition to trade secret protection, we seek to protect our software technology, documentation
and other written materials under copyright law, which affords only limited protection. We also
assert registered trademark rights in our product names. As of March 31, 2010, we have been granted
35 patents issued primarily in the United States and have 26 patent applications pending primarily
with the United States Patent and Trademark Office for certain product technology and have plans to
seek additional patents in the future. Once granted, we expect the duration of each patent will be
up to 20 years from the effective date of filing of the applications. Our earliest issued patent
filing date is fiscal 1992. In addition, we are a party to a patent cross license agreement with
IBM under which each party is granted a perpetual, irrevocable, nonexclusive license to certain of
each other’s patents issued or pending prior to March 21, 2009.
Because the industry is characterized by rapid technological change, we believe that factors such
as the technological and creative skills of our personnel, new technology developments, frequent
software enhancements, name recognition and reliable product maintenance are more important to
establishing and maintaining a technology leadership position than legal protection of our
technology.
15
Table of Contents
There can be no assurance that third parties will not assert infringement claims against us with
respect to current and future products and technology or that any such assertion will not require
us to enter into royalty arrangements which could require a payment to the third party upon sale of
the product, or result in costly litigation.
EMPLOYEES
As of March 31, 2010, we employed 4,336 people worldwide, with 977 in product and web performance
sales, sales support and marketing; 1,143 in technology development and support; 1,290 in
professional services, 305 in application services and 621 in other general and administrative
functions. Only a small number of our international employees are represented by labor unions. We
have experienced no work stoppages and believe that our relations with our employees are good. Our
success will depend in part on our continued ability to attract and retain highly qualified,
experienced and talented personnel.
Executive Officers of the Registrant
Our current executive officers, which serve at the discretion of our Board of Directors, are listed
below:
| Name | Age | Position | ||||
Peter Karmanos, Jr.
|
67 | Chairman of the Board and Chief Executive Officer | ||||
Robert C. Paul
|
47 | President, Chief Operating Officer and member of the Board of Directors | ||||
Laura L. Fournier
|
57 | Executive Vice President and Chief Financial Officer | ||||
Paul A. Czarnik
|
54 | Chief Technology Officer | ||||
Denise A. Knobblock Starr
|
55 | Executive Vice President and Chief Administrative Officer | ||||
Daniel S. Follis, Jr.
|
44 | Vice President, General Counsel and Secretary | ||||
Peter Karmanos, Jr., is a founder of the Company and has served as Chairman of the Board since
November 1978, as Chief Executive Officer since July 1987 and as President from January 1992
through October 1994 and October 2003 through March 2008.
Robert C. Paul has served as President and Chief Operating Officer of Compuware since April 2008
and was appointed a member of the Board of Directors in March 2010. Prior to that time, Mr. Paul
was President and Chief Operating Officer of Compuware Covisint since its acquisition by Compuware
in March 2004. Mr. Paul had spent nearly three years at Covisint prior to the acquisition.
Laura L. Fournier has served as Executive Vice President since April 2008 and as Chief Financial
Officer since April 1998. Ms. Fournier was Corporate Controller from June 1995 through March 1998.
From February 1990 through May 1995, Ms. Fournier was Director of Internal Audit.
Paul A. Czarnik has served as Chief Technology Officer since December 2008. Prior to that time, Mr.
Czarnik held numerous management positions in the Technology Department, including Senior Vice
President of Technology from April 2008 through December 2008 and Vice President of Product
Architecture from April 2002 through March 2008. Mr. Czarnik joined Compuware in 1981 as a
Professional Services Consultant.
16
Table of Contents
Denise A. Knobblock Starr has served as Executive Vice President of Administration since April 2002
and as Chief Administrative Officer since April 2007. Ms. Knobblock Starr was Executive Vice
President of Human Resources and Administration from April 1998 through March 2002. From April 1995
through March 1998, she was Senior Vice President of Purchasing, Facilities, Administration and
Travel. Ms. Knobblock Starr served as the Director of Administration and Facilities from April 1991
to March 1995. She joined Compuware in January 1989 as Manager of Administration and Facilities.
Daniel S. Follis, Jr. has served as Vice President, General Counsel and Secretary since March 2008.
From January 2006 through February 2008, he served as Vice President, Associate General Counsel.
Mr. Follis joined Compuware in March 1998 as Senior Counsel.
SEGMENT INFORMATION, PAYMENT TERMS AND FOREIGN REVENUES
For a description of revenues and operating profit by segment and for financial information
regarding geographic operations for each of the last three fiscal years, see Note 13 of the notes
to consolidated financial statements, included in Item 8 of this report. For a description of
extended payment terms offered to some customers, see Note 1 of the notes to consolidated financial
statements, included in Item 8 of this report. The Company’s foreign operations are subject to
risks related to foreign exchange rates and other risks. For a discussion of risks associated with
our foreign operations, see Item 1A. Risk Factors and Item 7A. Quantitative and Qualitative
Disclosure about Market Risk.
17
Table of Contents
ITEM 1A. RISK FACTORS
An investment in our common stock is subject to risks inherent to our business. The material risks
and uncertainties that we believe affect us are described below. The risks and uncertainties
described below are not the only ones we face. Additional risks and uncertainties that we are not
aware of or focused on or that we currently deem immaterial may also impair business operations.
This report is qualified in its entirety by these risk factors. If any of the following risks
actually occur, our financial condition and results of operations could be materially and adversely
affected. If this were to happen, the value of our common stock could decline significantly, and
shareholders could lose all or part of their investment.
The majority of our products segment revenue is dependent on our customers’ continued use of
International Business Machines Corporation and IBM-compatible products.
The majority of our revenue from software products is generated from products designed for use with IBM and IBM-compatible mainframe operating systems. As a result, the majority of our revenue from software products is dependent on our customers’ continued use of these systems. In addition, because our products operate in conjunction with IBM operating systems software, changes to IBM’s mainframe operating systems may require us to adapt our products to these changes. IBM also provides competing products designed for use with their mainframe operating systems. A decline in our customer’s use of IBM and IBM-compatible mainframe operating systems, delays or the inability to keep our products current with changes to IBM’s mainframe operating systems, or the loss of market share to IBM’s competing products could have a material adverse effect on our results of operations and cash flow.
The majority of our revenue from software products is generated from products designed for use with IBM and IBM-compatible mainframe operating systems. As a result, the majority of our revenue from software products is dependent on our customers’ continued use of these systems. In addition, because our products operate in conjunction with IBM operating systems software, changes to IBM’s mainframe operating systems may require us to adapt our products to these changes. IBM also provides competing products designed for use with their mainframe operating systems. A decline in our customer’s use of IBM and IBM-compatible mainframe operating systems, delays or the inability to keep our products current with changes to IBM’s mainframe operating systems, or the loss of market share to IBM’s competing products could have a material adverse effect on our results of operations and cash flow.
Our product revenue is dependent on the acceptance of our pricing structure for software licenses,
maintenance services and web performance services.
The pricing of our software licenses, maintenance services and web performance services is under constant pressure from customers and competitive vendors that can negatively impact our product revenue. These competitive pressures could have a material adverse effect on our results of operations and cash flow.
The pricing of our software licenses, maintenance services and web performance services is under constant pressure from customers and competitive vendors that can negatively impact our product revenue. These competitive pressures could have a material adverse effect on our results of operations and cash flow.
Maintenance revenue could continue to decline.
Our maintenance revenue has been negatively affected by reduced pricing for mainframe maintenance renewals and the decline in new mainframe maintenance arrangements. If we are unable to increase new product sales and maintenance contract renewals to outpace the combined impact of maintenance cancellations, reduced pricing for maintenance renewals and currency fluctuations, our maintenance revenues will continue to decline, which could have a material adverse effect on our results of operations and cash flow.
Our maintenance revenue has been negatively affected by reduced pricing for mainframe maintenance renewals and the decline in new mainframe maintenance arrangements. If we are unable to increase new product sales and maintenance contract renewals to outpace the combined impact of maintenance cancellations, reduced pricing for maintenance renewals and currency fluctuations, our maintenance revenues will continue to decline, which could have a material adverse effect on our results of operations and cash flow.
The markets for web performance services are at an early stage of development with emerging
competitors. If these markets do not develop or develop more slowly than we expect, or if there is
an increase in competition, our revenue may decline or fail to grow.
We derive revenue from providing on-demand web performance services. While web applications have become increasingly significant for a growing number of companies, the market for web performance services is in an early stage of development, and it is uncertain whether these services will achieve and sustain high levels of demand and market acceptance. Growth in revenue generated from these services will depend on the willingness of organizations to increase their use of web performance services. Some businesses may be reluctant or unwilling to use these services for a number of reasons, including failure to perceive the need for improved testing and monitoring of web applications and lack of knowledge about the potential benefits these services may provide. This market is also competitive and rapidly changing, and several of our competitors have greater financial and marketing resources than we do. As a result, our competitors may be more efficient and effective at achieving the following principal competitive factors affecting the market for web performance services: real-time availability of data and reporting, the proven performance, security, scalability, flexibility and reliability of services offered; the usability of services offered, including ease of implementation and use; and pricing. If we are less successful at achieving one or more of these factors than our competitors or the
We derive revenue from providing on-demand web performance services. While web applications have become increasingly significant for a growing number of companies, the market for web performance services is in an early stage of development, and it is uncertain whether these services will achieve and sustain high levels of demand and market acceptance. Growth in revenue generated from these services will depend on the willingness of organizations to increase their use of web performance services. Some businesses may be reluctant or unwilling to use these services for a number of reasons, including failure to perceive the need for improved testing and monitoring of web applications and lack of knowledge about the potential benefits these services may provide. This market is also competitive and rapidly changing, and several of our competitors have greater financial and marketing resources than we do. As a result, our competitors may be more efficient and effective at achieving the following principal competitive factors affecting the market for web performance services: real-time availability of data and reporting, the proven performance, security, scalability, flexibility and reliability of services offered; the usability of services offered, including ease of implementation and use; and pricing. If we are less successful at achieving one or more of these factors than our competitors or the
18
Table of Contents
demand for web performance services declines or does not grow, we may lose market share which could
have a material adverse effect on our business, financial condition and operating results.
The market for application services is in its early stages of development with emerging
competitors. As the market matures, competition may increase and could have a material negative
impact on our results of operations.
Several of our competitors in the application services market have substantially greater financial, marketing, recruiting and training resources than we do. As a result, our competitors may be more efficient and effective at achieving the following principal competitive factors affecting the market for application services: speed of implementation, reduced risk related to regulatory compliance and implementation problems, inclusion of state of the art technology features, solution performance, ability to meet customer service level requirements and price. If we are less successful at achieving one or more of these factors than our competitors, we may lose market share which could have a material adverse effect on our business, financial condition and operating results.
Several of our competitors in the application services market have substantially greater financial, marketing, recruiting and training resources than we do. As a result, our competitors may be more efficient and effective at achieving the following principal competitive factors affecting the market for application services: speed of implementation, reduced risk related to regulatory compliance and implementation problems, inclusion of state of the art technology features, solution performance, ability to meet customer service level requirements and price. If we are less successful at achieving one or more of these factors than our competitors, we may lose market share which could have a material adverse effect on our business, financial condition and operating results.
If we are not successful in implementing our professional services strategy, our operating margins
may decline materially.
Our business strategy for the professional services segment is to improve the segment’s operating margin by requiring certain margin thresholds for all new business and managing the segment operating expenses accordingly. If our customers will not accept the higher billing rates necessary to achieve these minimum thresholds, our revenues and operating margins may be negatively impacted which could have a material adverse effect on our results of operations and cash flow.
Our business strategy for the professional services segment is to improve the segment’s operating margin by requiring certain margin thresholds for all new business and managing the segment operating expenses accordingly. If our customers will not accept the higher billing rates necessary to achieve these minimum thresholds, our revenues and operating margins may be negatively impacted which could have a material adverse effect on our results of operations and cash flow.
We may fail to achieve our forecasted financial results due to inaccurate sales forecasts or other
unpredictable factors. If we fail to meet the expectations of analysts or investors, our stock
price could decline substantially.
Our revenues, particularly our software license revenues, are difficult to forecast. Software license revenues in any quarter are substantially dependent on orders booked in the quarter. Our sales personnel monitor the status of all proposals and estimate when a customer will make a purchase decision and the dollar amount of the sale. These estimates are aggregated periodically to generate the sales forecast. Our sales forecast estimates could prove to be unreliable both in a particular quarter and over a longer period of time as a significant amount of our transactions are completed during the final weeks and days of the quarter. Therefore, we generally do not know whether revenues or earnings will have met expectations until after the end of the quarter. Also, the manner in which our customers license our products can cause revenues to be deferred or recognized ratably over time and changes in the mix of customer agreements could adversely affect our revenues. As a result, our actual financial results can vary substantially from our forecasted results.
Our revenues, particularly our software license revenues, are difficult to forecast. Software license revenues in any quarter are substantially dependent on orders booked in the quarter. Our sales personnel monitor the status of all proposals and estimate when a customer will make a purchase decision and the dollar amount of the sale. These estimates are aggregated periodically to generate the sales forecast. Our sales forecast estimates could prove to be unreliable both in a particular quarter and over a longer period of time as a significant amount of our transactions are completed during the final weeks and days of the quarter. Therefore, we generally do not know whether revenues or earnings will have met expectations until after the end of the quarter. Also, the manner in which our customers license our products can cause revenues to be deferred or recognized ratably over time and changes in the mix of customer agreements could adversely affect our revenues. As a result, our actual financial results can vary substantially from our forecasted results.
In addition, investors should not rely on the results of prior periods or on historical seasonality
in license revenue as an indication of our future performance. Our operating expense levels are
relatively fixed in the short-term and are based, in part, on our expectations of future revenue.
If we have unanticipated lower sales in any given quarter, we will not be able to reduce our
operating expenses for that quarter proportionately in response. Therefore, net income may be
disproportionately affected by a fluctuation in revenue.
Any significant shortfall in revenues or earnings; or lowered expectations could cause our common
stock price to decline.
19
Table of Contents
Future changes in the United States and global economies may reduce demand for our products and
services, which may have a material adverse effect on our revenues and operating results.
Our revenues and profitability depend on the overall demand for our software products, web performance services, professional services and application services. Regional and global economic change and uncertainty have resulted in companies reassessing their spending for technology projects. If the economies within the United States and/or other geographic regions in which we operate experience a slowdown or recession, it could have a material adverse effect on our results of operations and cash flow.
Our revenues and profitability depend on the overall demand for our software products, web performance services, professional services and application services. Regional and global economic change and uncertainty have resulted in companies reassessing their spending for technology projects. If the economies within the United States and/or other geographic regions in which we operate experience a slowdown or recession, it could have a material adverse effect on our results of operations and cash flow.
Defects or disruptions in our web performance services or application services networks or
interruptions or delays in service would impair the delivery of our on-demand service and could
diminish demand for our services and subject us to substantial liability.
Defects in our web performance services or application services networks could result in service disruptions for our customers. Our network performance and service level could be disrupted by numerous events, including natural disasters and power losses. We might inadvertently operate or misuse the system in ways that could cause a service disruption for some or all of our customers. We might have insufficient redundancy or server capacity to address any such disruption, which could result in interruptions in our services or degradations of our service levels. Our customers might use our web performance services in ways that cause a service disruption for other customers. These defects or disruptions could undermine confidence in our services and cause us to lose customers or make it more difficult to attract new ones, either of which could have a material adverse effect on our results of operations and cash flow.
Defects in our web performance services or application services networks could result in service disruptions for our customers. Our network performance and service level could be disrupted by numerous events, including natural disasters and power losses. We might inadvertently operate or misuse the system in ways that could cause a service disruption for some or all of our customers. We might have insufficient redundancy or server capacity to address any such disruption, which could result in interruptions in our services or degradations of our service levels. Our customers might use our web performance services in ways that cause a service disruption for other customers. These defects or disruptions could undermine confidence in our services and cause us to lose customers or make it more difficult to attract new ones, either of which could have a material adverse effect on our results of operations and cash flow.
Future changes in the U.S. domestic automotive manufacturing business could reduce demand for our
professional services and application services, which may have a material negative effect on our
revenues and operating results.
A substantial portion of our worldwide professional services revenue, which includes the professional services segment and the application services segment, has been generated from customers in the automotive industry, with General Motors Company currently being our largest customer.
A substantial portion of our worldwide professional services revenue, which includes the professional services segment and the application services segment, has been generated from customers in the automotive industry, with General Motors Company currently being our largest customer.
Many of our customers in the domestic automotive industry are engaged in restructuring and other
efforts to cut costs, including IT expenditures. Further negative developments in this industry,
including additional bankruptcies, could reduce the demand for our services and increase the
collection risk of accounts receivables from these customers, which could have a material adverse
effect on our professional and application services results of operations and operating margin in this business.
If the fair value of our long-lived assets deteriorated below the carrying value of these assets,
recognition of an impairment loss would be required, which could materially and adversely affect
our financial results.
We evaluate our long-lived assets, including property and equipment, goodwill, acquired product rights and other intangible assets, whenever events or circumstances occur that may indicate these assets are impaired or periodically as required by generally accepted accounting principles. In the continuing process of evaluating the recoverability of the carrying amount of our long-lived assets, there is the possibility that we could identify a substantial impairment, which could have a material adverse effect on our results of operations.
We evaluate our long-lived assets, including property and equipment, goodwill, acquired product rights and other intangible assets, whenever events or circumstances occur that may indicate these assets are impaired or periodically as required by generally accepted accounting principles. In the continuing process of evaluating the recoverability of the carrying amount of our long-lived assets, there is the possibility that we could identify a substantial impairment, which could have a material adverse effect on our results of operations.
Our software technology may infringe the proprietary rights of others.
Our software technology is developed or enhanced internally or acquired through acquisitions.
Our software technology is developed or enhanced internally or acquired through acquisitions.
All employees sign an agreement that states the employee was hired for his or her talent and skill
rather than for any trade secrets or proprietary information of others of which he or she may have
knowledge. Further, our employees execute an agreement stating that work developed for us or our
clients belongs to us or our clients, respectively.
20
Table of Contents
During the due diligence stage of any software technology acquisition, we research and investigate
the title to the software technology we will be acquiring from the seller. This investigation
generally includes without limitation, litigation searches, copyright and trademark searches,
review of development documents and interviews with key employees of the seller regarding
development, title and ownership of the software technology being acquired. The acquisition
document itself generally contains representations, warranties and covenants concerning the title
and ownership of the software technology as well as indemnification and remedy provisions in the
event the representations, warranties and covenants are breached by the seller.
Although we use all reasonable efforts to ensure we do not infringe on third party intellectual
property rights, there can be no assurance that third parties will not assert infringement claims
against us with respect to our current and future software technology or that any such assertion
will not require us to enter into royalty arrangements or result in costly litigation.
Our results could be adversely affected by increased competition, pricing pressures and
technological changes within the software products market.
The markets for our software products are highly competitive. We consider over 40 firms to be directly competitive with one or more of our products and several of these have greater financial and marketing resources than we do. The principal competitive factors affecting the market for our software products include: responsiveness to customer needs, functionality, performance, reliability, ease of use, quality of customer support, sales channels, vendor reputation and price. A variety of external and internal events and circumstances could adversely affect our competitive capacity. Our ability to remain competitive will depend, to a great extent, upon our performance in sales, product development and customer support. To be successful in the future, we must respond promptly and effectively to our customers’ purchasing methodologies, challenges of technological change and our competitors’ innovations by continually enhancing our product offerings.
The markets for our software products are highly competitive. We consider over 40 firms to be directly competitive with one or more of our products and several of these have greater financial and marketing resources than we do. The principal competitive factors affecting the market for our software products include: responsiveness to customer needs, functionality, performance, reliability, ease of use, quality of customer support, sales channels, vendor reputation and price. A variety of external and internal events and circumstances could adversely affect our competitive capacity. Our ability to remain competitive will depend, to a great extent, upon our performance in sales, product development and customer support. To be successful in the future, we must respond promptly and effectively to our customers’ purchasing methodologies, challenges of technological change and our competitors’ innovations by continually enhancing our product offerings.
We operate in an industry characterized by rapid technological change, evolving industry standards,
changes in customer requirements and frequent new product introductions and enhancements. If we
fail to keep pace with technological change in our industry, such failure would have an adverse
effect on our revenues. During the past several years, many new technological advancements and
competing products entered the marketplace. To the extent that our current product portfolio does
not meet such changing requirements, our revenues will suffer. Delays in new product introductions
or less-than-anticipated market acceptance of these new products are possible and could have a
material adverse effect on our revenues.
Developers of third party products, including operating systems, databases, systems software,
applications, networks, servers and computer hardware, frequently introduce new or modified
products. These new or modified third party products could incorporate features which perform
functions currently performed by our products or could require substantial modification of our
products to maintain compatibility with these companies’ hardware or software. While we have
generally been able to adapt our products and our business to changes introduced by new or modified
third party product offerings, there can be no assurance that we will be able to do so in the
future. Failure to adapt our products in a timely manner to such changes or customer decisions to
forego the use of our products in favor of those with comparable functionality contained either in
the hardware or other software could have a material adverse effect on our results of operations
and cash flow.
The market for professional services is highly competitive, fragmented and characterized by low
barriers to entry.
We have numerous competitors in the professional services markets in which we operate. Several of these competitors have substantially greater financial, marketing, recruiting and training resources than we do. The principal competitive factors affecting the market for our professional services include responsiveness to customer needs, breadth and depth of technical skills offered, availability and productivity of personnel, ability to demonstrate achievement of results and price. There is no assurance that we will be able to compete successfully in the future.
We have numerous competitors in the professional services markets in which we operate. Several of these competitors have substantially greater financial, marketing, recruiting and training resources than we do. The principal competitive factors affecting the market for our professional services include responsiveness to customer needs, breadth and depth of technical skills offered, availability and productivity of personnel, ability to demonstrate achievement of results and price. There is no assurance that we will be able to compete successfully in the future.
21
Table of Contents
We must develop or acquire product enhancements and new products to succeed.
Our success depends in part on our ability to develop product enhancements and new products that keep pace with continuing changes in technology and customer preferences. The majority of our products have been developed from acquired technology and products. We believe that our future growth lies, in part, in continuing to identify, acquire and then develop promising technologies and products. While we are continually searching for acquisition opportunities, there can be no assurance that we will continue to be successful in identifying, acquiring and developing products and technology. If any potential acquisition opportunities are identified, there can be no assurance that we will consummate and successfully integrate any such acquisitions and there can be no assurance as to the timing or effect on our business of any such acquisitions. Our failure to develop technological improvements or to adapt our products to technological change may, over time, have a material adverse effect on our business.
Our success depends in part on our ability to develop product enhancements and new products that keep pace with continuing changes in technology and customer preferences. The majority of our products have been developed from acquired technology and products. We believe that our future growth lies, in part, in continuing to identify, acquire and then develop promising technologies and products. While we are continually searching for acquisition opportunities, there can be no assurance that we will continue to be successful in identifying, acquiring and developing products and technology. If any potential acquisition opportunities are identified, there can be no assurance that we will consummate and successfully integrate any such acquisitions and there can be no assurance as to the timing or effect on our business of any such acquisitions. Our failure to develop technological improvements or to adapt our products to technological change may, over time, have a material adverse effect on our business.
Acquisitions may be difficult to integrate, disrupt our business or divert the attention of our
management and may result in financial results that are different than expected.
As part of our overall strategy, we have acquired or invested in, and plan to continue to acquire or invest in, complementary companies, products, and technologies and may enter into joint ventures and strategic alliances with other companies. Risks commonly encountered in such transactions include: the difficulty of assimilating the operations and personnel of the combined companies; the risk that we may not be able to integrate the acquired technologies or products with our current products and technologies; the potential disruption of our ongoing business; the inability to retain key technical, sales and managerial personnel; the inability of management to maximize our financial and strategic position through the successful integration of acquired businesses; the risk that revenues from acquired companies, products and technologies do not meet our expectations; and decreases in reported earnings as a result of charges for in-process research and development and amortization of acquired intangible assets.
As part of our overall strategy, we have acquired or invested in, and plan to continue to acquire or invest in, complementary companies, products, and technologies and may enter into joint ventures and strategic alliances with other companies. Risks commonly encountered in such transactions include: the difficulty of assimilating the operations and personnel of the combined companies; the risk that we may not be able to integrate the acquired technologies or products with our current products and technologies; the potential disruption of our ongoing business; the inability to retain key technical, sales and managerial personnel; the inability of management to maximize our financial and strategic position through the successful integration of acquired businesses; the risk that revenues from acquired companies, products and technologies do not meet our expectations; and decreases in reported earnings as a result of charges for in-process research and development and amortization of acquired intangible assets.
For us to maximize the return on some of our investments in acquired companies, the products of
these entities must be integrated with our existing products. These integrations can be difficult
and unpredictable, especially given the complexity of software and that acquired technology is
typically developed independently and designed with no regard to integration. The difficulties are
compounded when the products involved are well-established because compatibility with the existing
base of installed products must be preserved. Successful integration also requires coordination of
different development and engineering teams. This too can be difficult and unpredictable because of
possible cultural conflicts and different opinions on technical decisions and product roadmaps.
There can be no assurance that we will be successful in our product integration efforts or that we
will realize the expected benefits.
With each of our acquisitions, we have initiated efforts to integrate the disparate cultures,
employees, systems and products of these companies. Retention of key employees is critical to
ensure the continued development, support, sales and marketing efforts pertaining to the acquired
products. We have implemented retention programs to keep many of the key technical and sales
employees of acquired companies. Nonetheless, we have lost some key employees and may lose others
in the future.
We are exposed to exchange rate risks on foreign currencies and to other international risks that
may adversely affect our business and results of operations.
Over one-third of our total revenues are derived from foreign operations and we expect that foreign operations will continue to generate a significant percentage of our total revenues. Products and services are generally priced in the currency of the country in which they are sold. Changes in the exchange rates of foreign currencies or exchange controls may adversely affect our results of operations. The international business is also subject to other risks, including the need to comply with foreign and U.S. laws and the greater difficulty of managing business overseas. In addition, our foreign operations are affected by general economic conditions in the international markets in which we do business. A worsening of economic conditions in these markets could cause customers to delay or
Over one-third of our total revenues are derived from foreign operations and we expect that foreign operations will continue to generate a significant percentage of our total revenues. Products and services are generally priced in the currency of the country in which they are sold. Changes in the exchange rates of foreign currencies or exchange controls may adversely affect our results of operations. The international business is also subject to other risks, including the need to comply with foreign and U.S. laws and the greater difficulty of managing business overseas. In addition, our foreign operations are affected by general economic conditions in the international markets in which we do business. A worsening of economic conditions in these markets could cause customers to delay or
22
Table of Contents
forego decisions to license new products or to reduce their requirements for professional and
application services.
Current laws may not adequately protect our proprietary rights.
We regard our software as proprietary and attempt to protect it with copyrights, trademarks, trade secret laws and/or restrictions on disclosure, copying and transferring title. Despite these precautions, it may be possible for unauthorized third parties to copy certain portions of our products or to obtain and use information that we regard as proprietary. We have many patents and many patent applications pending. However, existing patent and copyright laws afford only limited practical protection. In addition, the laws of some foreign countries do not protect our proprietary rights to the same extent as the laws of the United States. Any claims against those who infringe on our proprietary rights can be time consuming and expensive to prosecute, and there can be no assurance that we would be successful in protecting our rights despite significant expenditures.
We regard our software as proprietary and attempt to protect it with copyrights, trademarks, trade secret laws and/or restrictions on disclosure, copying and transferring title. Despite these precautions, it may be possible for unauthorized third parties to copy certain portions of our products or to obtain and use information that we regard as proprietary. We have many patents and many patent applications pending. However, existing patent and copyright laws afford only limited practical protection. In addition, the laws of some foreign countries do not protect our proprietary rights to the same extent as the laws of the United States. Any claims against those who infringe on our proprietary rights can be time consuming and expensive to prosecute, and there can be no assurance that we would be successful in protecting our rights despite significant expenditures.
The loss of certain key employees and technical personnel or our inability to hire additional
qualified personnel could have a material adverse effect on our business.
Our success depends in part upon the continued service of our key senior management and technical personnel. Such personnel are employed at-will and may leave Compuware at any time. Our success also depends on our continuing ability to attract and retain highly qualified technical, managerial and sales personnel. The market for professional services and software products personnel has historically been, and we expect that it will continue to be, intensely competitive. There can be no assurance that we will continue to be successful in attracting or retaining such personnel. The loss of certain key employees or our inability to attract and retain other qualified employees could have a material adverse effect on our business.
Our success depends in part upon the continued service of our key senior management and technical personnel. Such personnel are employed at-will and may leave Compuware at any time. Our success also depends on our continuing ability to attract and retain highly qualified technical, managerial and sales personnel. The market for professional services and software products personnel has historically been, and we expect that it will continue to be, intensely competitive. There can be no assurance that we will continue to be successful in attracting or retaining such personnel. The loss of certain key employees or our inability to attract and retain other qualified employees could have a material adverse effect on our business.
Unanticipated changes in our operating results or effective tax rates, or exposure to additional
income tax liabilities, could affect our profitability.
We are subject to income taxes in both the United States and numerous foreign jurisdictions. Significant judgment is required in determining our worldwide provision for income taxes. One of the components that need to be evaluated is the realization of our deferred tax assets. We must assess the likelihood that our deferred tax assets will be recovered from future taxable income and, to the extent we believe that recovery is not likely, we must establish a valuation allowance. Changes in estimates of projected future operating results or in assumptions regarding our ability to generate future taxable income could result in significant increases to our valuation allowance and tax expense that would reduce net income.
We are subject to income taxes in both the United States and numerous foreign jurisdictions. Significant judgment is required in determining our worldwide provision for income taxes. One of the components that need to be evaluated is the realization of our deferred tax assets. We must assess the likelihood that our deferred tax assets will be recovered from future taxable income and, to the extent we believe that recovery is not likely, we must establish a valuation allowance. Changes in estimates of projected future operating results or in assumptions regarding our ability to generate future taxable income could result in significant increases to our valuation allowance and tax expense that would reduce net income.
In addition, we recognize reserves for uncertain tax positions through tax expense for estimated
exposures related to our current tax positions. We evaluate the need for reserves for uncertain tax
positions on a quarterly basis and any change in the amount will be recorded in our results of
operations, as appropriate. It could take several years to resolve certain of these reserves for
uncertain tax positions.
We are also subject to routine corporate income tax audits in the jurisdictions in which we
operate. Our provision for income taxes includes amounts intended to satisfy income tax assessments
that are likely to result from the examination of our corporate tax returns that have been filed in
these jurisdictions. The amounts ultimately paid upon resolution of these examinations could be
materially different from the amounts included in the provision for income taxes and result in
increases to tax expense.
Our stock repurchase plan may be suspended or terminated at any time, which may result in a
decrease in our stock price.
We have repurchased shares of our common stock in the market during the past several years and currently repurchase shares under an arrangement pursuant to which management is permitted to determine the amount and timing of repurchases in its discretion subject to an overall limit. Our ability and willingness to repurchase shares is subject to, among other things, the availability of cash resources and credit at rates and upon terms we believe are prudent. Stock market conditions, the market value of our common stock and other factors may also make it imprudent for us from time to
We have repurchased shares of our common stock in the market during the past several years and currently repurchase shares under an arrangement pursuant to which management is permitted to determine the amount and timing of repurchases in its discretion subject to an overall limit. Our ability and willingness to repurchase shares is subject to, among other things, the availability of cash resources and credit at rates and upon terms we believe are prudent. Stock market conditions, the market value of our common stock and other factors may also make it imprudent for us from time to
23
Table of Contents
time to engage in repurchase activity. There can be no assurance that we will continue to
repurchase shares at historic levels or at all. If our repurchase program is curtailed, our stock
price may be negatively affected.
Acts of terrorism, acts of war and other unforeseen events may cause damage or disruption to us or
our customers, which could materially and adversely affect our business, financial condition and
operating results.
Natural disasters, acts of war, terrorist attacks and the escalation of military activity in response to such attacks or otherwise may have negative and significant effects, such as imposition of increased security measures, changes in applicable laws, market disruptions and job losses. Such events may have an adverse effect on the economy in general. Moreover, the potential for future terrorist attacks and the national and international responses to such threats could affect the business in ways that cannot be predicted. The effect of any of these events or threats could have a material adverse effect on our business, financial condition and results of operations.
Natural disasters, acts of war, terrorist attacks and the escalation of military activity in response to such attacks or otherwise may have negative and significant effects, such as imposition of increased security measures, changes in applicable laws, market disruptions and job losses. Such events may have an adverse effect on the economy in general. Moreover, the potential for future terrorist attacks and the national and international responses to such threats could affect the business in ways that cannot be predicted. The effect of any of these events or threats could have a material adverse effect on our business, financial condition and results of operations.
Our articles of incorporation, bylaws and rights agreement as well as certain provisions of
Michigan law may have an anti-takeover effect.
Provisions of our articles of incorporation and bylaws, Michigan law and the Rights Agreement, dated October 25, 2000, as amended, between Compuware Corporation and Equiserve Trust Company, N.A. (now known as Computershare Trust Company N.A.), as rights agent, could make it more difficult for a third party to acquire Compuware, even if doing so would be perceived to be beneficial to shareholders. The combination of these provisions inhibits a non-negotiated acquisition, merger or other business combination involving Compuware, which, in turn, could adversely affect the market price of our common stock.
Provisions of our articles of incorporation and bylaws, Michigan law and the Rights Agreement, dated October 25, 2000, as amended, between Compuware Corporation and Equiserve Trust Company, N.A. (now known as Computershare Trust Company N.A.), as rights agent, could make it more difficult for a third party to acquire Compuware, even if doing so would be perceived to be beneficial to shareholders. The combination of these provisions inhibits a non-negotiated acquisition, merger or other business combination involving Compuware, which, in turn, could adversely affect the market price of our common stock.
ITEM 1B. UNRESOLVED STAFF COMMENTS
None
ITEM 2. PROPERTIES
Our executive offices, primary research and development lab, principal marketing department,
primary professional and application services office, customer service and support teams are
located in our corporate headquarters building in Detroit, Michigan. We own the facility, which is
approximately 1.1 million square feet, including approximately 304,000 square feet designated for
lease to third parties for office, retail and related amenities and approximately 4,244 square feet
donated for use by local not-for-profit organizations. In addition, we lease approximately 217,000
square feet of land on which the facility resides.
We lease approximately 82 sales and professional services offices in 29 countries, including 5
remote product research and development facilities.
ITEM 3. LEGAL PROCEEDINGS
The Company is subject to various legal proceedings and claims that arise in the ordinary course of
business. The Company does not believe that the outcome of any of these legal matters will have a
material adverse effect on the Company’s consolidated financial position, results of operations and
cash flows. See Note 14 of the notes to consolidated financial statements, included in Item 8 of
this report, for additional information.
24
Table of Contents
PART II
| ITEM 5. | MARKET FOR THE REGISTRANT’S COMMON EQUITY, RELATED STOCKHOLDER MATTERS AND ISSUER PURCHASES OF EQUITY SECURITIES |
Our common stock is traded on The NASDAQ Global Select Market (“NASDAQ”) under the symbol CPWR. As
of May 14, 2010, there were 4,062 shareholders of record of our common stock. We have not paid any
cash dividends on our common stock since fiscal 1986 and have no current intention to pay
dividends. The following table sets forth the range of high and low sale prices for our common
stock for the periods indicated, all as reported by NASDAQ.
| Fiscal Year Ended March 31, 2010 | High | Low | ||||||
Fourth quarter |
$ | 8.80 | $ | 7.00 | ||||
Third quarter |
8.95 | 6.79 | ||||||
Second quarter |
7.82 | 6.30 | ||||||
First quarter |
8.18 | 6.49 | ||||||
| Fiscal Year Ended March 31, 2009 | High | Low | ||||||
Fourth quarter |
$ | 7.35 | $ | 5.18 | ||||
Third quarter |
9.69 | 5.08 | ||||||
Second quarter |
11.91 | 9.08 | ||||||
First quarter |
10.42 | 6.97 | ||||||
Common Share Repurchases
The following table sets forth, the repurchases of common stock for the quarter ended March 31,
2010:
| Approximate dollar | ||||||||||||||||
| value of shares | ||||||||||||||||
| Total number of | that may yet be | |||||||||||||||
| Average | shares purchased | purchased under | ||||||||||||||
| Total number of | price paid | as part of publicly | the plan or | |||||||||||||
| Period | shares purchased | per share | announced plans | program (1) | ||||||||||||
For the month ended January 31, 2010 |
— | $ | — | $ | 425,705,000 | |||||||||||
For the month ended February 28, 2010 |
1,869,900 | 7.27 | 1,869,900 | 412,113,000 | ||||||||||||
For the month ended March 31, 2010 |
1,004,059 | 8.16 | 1,004,059 | 403,920,000 | ||||||||||||
Total |
2,873,959 | 7.58 | 2,873,959 | |||||||||||||
| (1) | Our purchases of common stock may occur on the open market or in negotiated or block transactions based upon market and business conditions. Unless terminated earlier by resolution of our Board of Directors, the discretionary share repurchase plan will expire when we have repurchased all shares authorized for repurchase thereunder. The maximum amount of repurchase activity under the repurchase plan continues to be limited on a daily basis to 25% of the average trading volume of our common stock for the previous four week period. In addition, no purchases are made during our self-imposed trading black-out periods in which the Company and our insiders are prohibited from trading in our common shares. |
25
Table of Contents
Issuance Of Unregistered Shares
As disclosed in the Company’s annual meeting proxy statement, Peter Karmanos, Jr., the
Company’s Chief Executive Officer, purchases shares from the Company on the same terms and
subject to the same conditions and limitations as provided in the Company’s Employee Stock
Purchase Plan (“ESPP”) with respect to all other employees of the Company, although he does
not participate in the ESPP directly and is not entitled to the favorable tax treatment
afforded to participants in the ESPP due to his beneficial ownership of more than 5% of the
Company’s outstanding shares. The description of the ESPP included in Note 15 of the Notes
to Consolidated Financial Statements, included in Item 8 of this report, is incorporated
herein by reference. The Company has treated for administrative purposes the shares
purchased by Mr. Karmanos as purchases pursuant to the ESPP. However, we have determined
based on advice from counsel that since he is not allowed to participate in the ESPP, the
issuance of shares may be considered unregistered. On February 26, 2010, 3,602 shares were
issued to Mr. Karmanos for $7.07 per share under this arrangement. Mr. Karmanos continues to
hold all shares purchased under this arrangement. The sales of these securities to Mr.
Karmanos were exempt from the registration requirements of the Securities Act of 1933 in
reliance on Section 4(2) of the Securities Act as transactions by an issuer not involving a
public offering. There were no underwriters involved in connection with the sale of the
above securities.
26
Table of Contents
Comparison of Cumulative Five Year Total Return
The following line graph compares the yearly percentage change in the cumulative total shareholder
return on our common shares with the cumulative total return of each of the following indices: the
S&P 500 Index, the NASDAQ Market Index and the NASDAQ Computer and Data Processing Index for the
period from April 1, 2005 through March 31, 2010. The graph includes a comparison to the S&P 500
Index in accordance with SEC rules, as the Company’s common stock is part of such index. The graph
assumes the investment of $100 in our common shares, the S&P 500 Index and each of the two NASDAQ
indices on March 31, 2005 and the reinvestment of all dividends.
The comparisons in the graph are required by applicable SEC rules. You should be careful about
drawing any conclusions from the data contained in the graph, because past results do not
necessarily indicate future performance. The information contained in this graph shall not be
deemed to be “soliciting material” or “filed” with the SEC or subject to the liabilities of Section
18 of the Exchange Act, except to the extent that we specifically incorporate it by reference into
a document filed under the Securities Act or the Exchange Act.
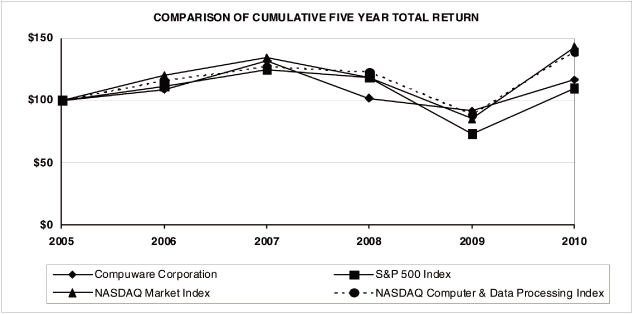
Total Return To Shareholders
(Includes reinvestment of dividends)
(Includes reinvestment of dividends)
| Base | Indexed Returns | |||||||||||||||||||||||
| Period | Years Ending | |||||||||||||||||||||||
| March 31, | March 31, | |||||||||||||||||||||||
| Company / Index | 2005 | 2006 | 2007 | 2008 | 2009 | 2010 | ||||||||||||||||||
COMPUWARE CORP |
$ | 100 | 108.75 | 131.81 | 101.94 | 91.53 | 116.67 | |||||||||||||||||
S&P 500 INDEX |
100 | 111.73 | 124.94 | 118.60 | 73.43 | 109.97 | ||||||||||||||||||
NASDAQ MARKET INDEX |
100 | 119.97 | 134.27 | 118.46 | 85.30 | 142.80 | ||||||||||||||||||
NASDAQ COMPUTER & DATA PROCESSING INDEX |
100 | 115.84 | 127.08 | 122.78 | 88.71 | 139.53 | ||||||||||||||||||
The additional information required in this section is contained in Item 12 – Security
Ownership of Certain Beneficial Owners and Management and Related Stockholder Matters of this
report and is incorporated herein by reference.
27
Table of Contents
ITEM 6. SELECTED FINANCIAL DATA
The selected statement of operations and balance sheet data presented below are derived from our
audited consolidated financial statements and should be read in conjunction with our audited
consolidated financial statements and notes thereto and Item 7 – Management’s Discussion and
Analysis of Financial Condition and Results of Operations included in this report.
| Year Ended March 31, | ||||||||||||||||||||
| 2010 | 2009 | 2008 | 2007 | 2006 | ||||||||||||||||
| (In thousands, except earnings per share data) | ||||||||||||||||||||
Statement of Operations Data: |
||||||||||||||||||||
Revenues: |
||||||||||||||||||||
Software license fees |
$ | 194,504 | $ | 219,634 | $ | 297,506 | $ | 283,412 | $ | 296,650 | ||||||||||
Maintenance and subscription fees |
456,343 | 479,480 | 476,374 | 457,594 | 433,596 | |||||||||||||||
Professional services fees |
241,332 | 391,341 | 455,731 | 471,996 | 475,115 | |||||||||||||||
Total revenues |
892,179 | 1,090,455 | 1,229,611 | 1,213,002 | 1,205,361 | |||||||||||||||
Operating expenses: |
||||||||||||||||||||
Cost of software license fees |
15,430 | 24,491 | 30,475 | 28,581 | 23,262 | |||||||||||||||
Cost of maintenance and subscription fees |
42,555 | 41,877 | 46,300 | 41,533 | 41,687 | |||||||||||||||
Cost of professional services |
216,861 | 368,030 | 413,921 | 420,729 | 417,485 | |||||||||||||||
Technology development and support |
91,245 | 86,453 | 101,132 | 114,071 | 96,858 | |||||||||||||||
Sales and marketing |
222,447 | 226,408 | 267,800 | 281,730 | 288,162 | |||||||||||||||
Administrative and general |
164,633 | 148,019 | 182,488 | 193,578 | 190,538 | |||||||||||||||
Restructuring costs (1) |
7,960 | 10,037 | 42,645 | |||||||||||||||||
Gain on divestiture of product lines |
(52,351 | ) | ||||||||||||||||||
Total operating expenses |
708,780 | 905,315 | 1,084,761 | 1,080,222 | 1,057,992 | |||||||||||||||
Income from operations |
183,399 | 185,140 | 144,850 | 132,780 | 147,369 | |||||||||||||||
Other income, net |
25,721 | 27,581 | 35,542 | 60,277 | 44,091 | |||||||||||||||
Income before income taxes |
209,120 | 212,721 | 180,392 | 193,057 | 191,460 | |||||||||||||||
Income tax provision |
68,314 | 73,074 | 45,998 | 34,965 | 48,500 | |||||||||||||||
Net income |
$ | 140,806 | $ | 139,647 | $ | 134,394 | $ | 158,092 | $ | 142,960 | ||||||||||
Basic earnings per share (2) |
$ | 0.61 | $ | 0.56 | $ | 0.47 | $ | 0.45 | $ | 0.37 | ||||||||||
Diluted earnings per share (2) |
0.60 | 0.55 | 0.47 | 0.45 | 0.37 | |||||||||||||||
Shares used in computing net income per share: |
||||||||||||||||||||
Basic earnings computation |
232,634 | 250,916 | 286,402 | 350,213 | 385,147 | |||||||||||||||
Diluted earnings computation |
234,565 | 252,402 | 287,628 | 350,967 | 387,569 | |||||||||||||||
Balance Sheet Data (at period end): |
||||||||||||||||||||
Working capital |
$ | 92,688 | $ | 297,237 | $ | 274,036 | $ | 391,823 | $ | 899,773 | ||||||||||
Total assets |
2,013,325 | 1,874,850 | 2,018,557 | 2,029,412 | 2,510,968 | |||||||||||||||
Long term debt |
— | — | — | — | — | |||||||||||||||
Total shareholders’ equity (3) |
913,813 | 880,648 | 927,031 | 1,132,148 | 1,579,499 | |||||||||||||||
| (1) | During fiscal 2010, 2009 and 2008, the Company undertook various restructuring activities to improve the effectiveness and efficiency of a number of the Company’s critical business processes, primarily within the products and professional services segments. These activities resulted in a restructuring charge of $8.0 million, $10.0 million and $42.6 million, respectively. See Note 7 of the notes to consolidated financial statements, included in Item 8 of this report, for more details regarding our restructuring plan. | |
| (2) | See Notes 1 and 11 of the notes to the consolidated financial statements, included in Item 8 of this report, for the basis of computing earnings per share. | |
| (3) | No dividends were paid or declared during the periods presented. |
28
Table of Contents
| ITEM 7. | MANAGEMENT’S DISCUSSION AND ANALYSIS OF FINANCIAL CONDITION AND RESULTS OF OPERATIONS |
FORWARD-LOOKING STATEMENTS
The following discussion contains certain forward-looking statements within the meaning of the
federal securities laws. When we use words such as “may”, “might”, “will”, “should”, “believe”,
“expect”, “anticipate”, “estimate”, “continue”, “predict”, “forecast”, “projected”, “intend” or
similar expressions, or make statements regarding our future plans, objectives or expectations, we
are making forward-looking statements. Numerous important factors, risks and uncertainties affect
our operating results, including, without limitation, those discussed in Item 1A. Risk Factors and
elsewhere in this report, could cause actual results to differ materially from the results implied
by these or any other forward-looking statements made by us, or on our behalf. There can be no
assurance that future results will meet expectations. While we believe that our forward-looking
statements are reasonable, you should not place undue reliance on any such forward-looking
statements, which speak only as of the date made. Except as required by applicable law, we do not
undertake any obligation to publicly release any revisions which may be made to any forward-looking
statements to reflect events or circumstances occurring after the date of this report.
OVERVIEW
In this section, we discuss our results of operations on a segment basis. We operate in four
business segments in the technology industry: products, web performance services, professional
services and application services. We evaluate segment performance based primarily on segment
contribution before corporate expenses. References to years are to fiscal years ended March 31.
This discussion and analysis should be read in conjunction with the audited consolidated financial
statements and notes included in Item 8 of this report.
We deliver value to businesses by providing software and web performance solutions; professional
services; and application services that improve the performance of information technology (“IT”)
organizations. Originally founded in 1973 as a professional services company, we began to offer
mainframe productivity tools for fault diagnosis, file and data management, and application
debugging in the late 1970’s and distributed and web-based platforms in the 1990’s and 2000’s.
The Company’s products and services are offered worldwide to the largest IT organizations across a
broad spectrum of technologies, including mainframe, distributed and Internet platforms and provide
the following capabilities:
| • | Our products and web performance services are designed to enhance the effectiveness of key disciplines throughout IT organizations including application development and delivery, service management and IT portfolio management and the availability and quality of web applications. | ||
| • | Our application services use business-to-business applications to integrate vital business information and processes between partners, customers and suppliers. | ||
| • | Our IT professional services include IT portfolio management services, application delivery management services, application outsourcing services and enterprise legacy modernization services. Our professional services segment also provides implementation, consulting and training services in tandem with the Company’s product offerings which are referred to as product related services. |
29
Table of Contents
Annual Update
The following occurred during fiscal 2010:
| • | Achieved an increase in product software contribution margin to 50.9% in fiscal 2010 from 45.8% in fiscal 2009 as a result of the $52.4 million gain on divestiture during fiscal 2010. | ||
| • | Experienced an increase in professional services segment contribution margin to 10.9% in fiscal 2010 from 7.1% in fiscal 2009. | ||
| • | Repurchased approximately 17.9 million shares of our common stock during fiscal 2010 at an average price of $7.41 per share. | ||
| • | Released 14 mainframe and 15 distributed product enhancements. |
We also continued to advance our Compuware 2.0 initiative in fiscal 2010 as follows:
| • | Acquired Gomez, a leading provider of web application performance services, for $295 million in cash (see Note 2 of the notes to consolidated financial statements, included in Item 8 of this report). | ||
| • | Sold our Quality and DevPartner product lines (“Product Divestiture”) to Micro Focus International PLC (“Micro Focus”) realizing a gain of $52.4 million to operating income (see Note 3 of the notes to consolidated financial statements, included in Item 8 of this report). | ||
| • | Executed our plan to have a smaller, more profitable professional services segment focused on engagements that allow us to achieve specified contribution margin targets. | ||
| • | Advanced our application services segment business strategy with a focus on the healthcare market while maintaining customer satisfaction in the automotive industry. |
30
Table of Contents
RESULTS OF OPERATIONS
The following table sets forth, for the periods indicated, certain operational data from the
consolidated statements of operations as a percentage of total revenues and the percentage change
in such items compared to the prior period:
| Percentage of | Period-to-Period | |||||||||||||||||||
| Total Revenues | Change | |||||||||||||||||||
| Fiscal Year Ended | 2009 | 2008 | ||||||||||||||||||
| March 31, | to | to | ||||||||||||||||||
| 2010 | 2009 | 2008 | 2010 | 2009 | ||||||||||||||||
REVENUE: |
||||||||||||||||||||
Software license fees |
21.8 | % | 20.1 | % | 24.2 | % | (11.4 | )% | (26.2 | )% | ||||||||||
Maintenance and subscription fees * |
51.2 | 44.0 | 38.7 | (4.8 | ) | 0.7 | ||||||||||||||
Professional services segment revenue ** |
22.5 | 32.7 | 34.1 | (43.6 | ) | (14.9 | ) | |||||||||||||
Application services segment revenue ** |
4.5 | 3.2 | 3.0 | 14.9 | (5.2 | ) | ||||||||||||||
Total revenues |
100.0 | 100.0 | 100.0 | (18.2 | ) | (11.3 | ) | |||||||||||||
OPERATING EXPENSES: |
||||||||||||||||||||
Cost of software license fees |
1.7 | 2.2 | 2.5 | (37.0 | ) | (19.6 | ) | |||||||||||||
Cost of maintenance and subscription fees * |
4.8 | 3.8 | 3.7 | 1.6 | (9.6 | ) | ||||||||||||||
Professional services segment expenses ** |
20.1 | 30.4 | 30.5 | (45.9 | ) | (11.6 | ) | |||||||||||||
Application services segment expenses ** |
4.3 | 3.4 | 3.2 | 2.4 | (5.8 | ) | ||||||||||||||
Technology development and support |
10.2 | 7.9 | 8.2 | 5.5 | (14.5 | ) | ||||||||||||||
Sales and marketing |
24.9 | 20.8 | 21.8 | (1.7 | ) | (15.5 | ) | |||||||||||||
Administrative and general |
18.4 | 13.6 | 14.8 | 11.2 | (18.9 | ) | ||||||||||||||
Restructuring costs |
0.9 | 0.9 | 3.5 | (20.7 | ) | (76.5 | ) | |||||||||||||
Gain on sale of assets |
(5.9 | ) | 0.0 | 0.0 | ||||||||||||||||
Total operating expenses |
79.4 | 83.0 | 88.2 | (21.7 | ) | (16.5 | ) | |||||||||||||
Income from operations |
20.6 | 17.0 | 11.8 | (0.9 | ) | 27.8 | ||||||||||||||
Other income, net |
2.9 | 2.5 | 2.9 | (6.7 | ) | (22.4 | ) | |||||||||||||
Income before income taxes |
23.5 | 19.5 | 14.7 | (1.7 | ) | 17.9 | ||||||||||||||
Income tax provision |
7.7 | 6.7 | 3.8 | (6.5 | ) | 58.9 | ||||||||||||||
Net income |
15.8 | % | 12.8 | % | 10.9 | % | 0.8 | 3.9 | ||||||||||||
| * | Web performance services segment revenue is referred to as subscription fees and combined with maintenance in the consolidated statements of operations, included in Item 8 of this report. | |
| ** | The professional services segment and the application services segment are combined and reported as professional services in the consolidated statements of operations, included in Item 8 of this report. |
31
Table of Contents
PRODUCT SOFTWARE
In November 2009, we acquired Gomez, a leading provider of web performance services that
organizations use to test and monitor the performance, availability and quality of their web
applications, while in development and after deployment. We report the web performance services
business as a separate segment referred to as the “web performance services segment”.
Gomez’s web performance services complement our enterprise application management products,
specifically Vantage, and allow us to offer IT organizations comprehensive solutions that
effectively monitor the performance of their enterprise and Internet application systems. Because
of this relationship, the products segment and web performance services segment are referred
together as “product software”.
The revenue for the web performance services segment is referred to as subscription fees and
reported with maintenance in the consolidated statement of operations. The research and development
costs and sales and marketing costs for our products segment and web performance services segment
are combined and reported as “Technology development and support” and “Sales and marketing”,
respectively, in the consolidated statements of operations. As a result, “Technology development
and support”, “Sales and marketing” and contribution margins for the products and web performance
services segments will be analyzed on a combined, product software basis within this section.
Financial information for the product software business was as follows (in thousands):
| Year Ended March 31, | ||||||||||||
| 2010 | 2009 | 2008 | ||||||||||
Revenue |
$ | 650,847 | $ | 699,114 | $ | 773,880 | ||||||
Expense |
319,326 | 379,229 | 445,707 | |||||||||
Product software contribution |
$ | 331,521 | $ | 319,885 | $ | 328,173 | ||||||
The product software business generated a contribution margin of 50.9%, as reported, or 42.9%
excluding the gain on divestiture of $52.4 million related to the Product Divestiture, during
fiscal 2010 compared to 45.8% and 42.4% during fiscal 2009 and fiscal 2008, respectively.
The decrease in the contribution margin excluding the gain on divestiture in fiscal 2010 as
compared to fiscal 2009 was primarily due to the decline in mainframe product revenue.
The improvement in the contribution margin in fiscal 2009 as compared to fiscal 2008 was due to
product expenses decreasing at a faster rate than product revenue. Expenses decreased primarily due
to the cost reduction initiatives implemented as part of the fiscal 2008 and fiscal 2009
restructuring programs that impacted the technology and sales divisions.
32
Table of Contents
Product Software Revenue
Revenue for the products and web performance services segments was as follows (in
thousands):
| Period-to-Period Change | ||||||||||||||||||||
| Year Ended March 31, | 2009 to | 2008 to | ||||||||||||||||||
| 2010 | 2009 | 2008 | 2010 | 2009 | ||||||||||||||||
Products segment |
||||||||||||||||||||
Software license fees |
||||||||||||||||||||
Mainframe |
$ | 108,216 | $ | 113,014 | $ | 151,278 | (4.2 | )% | (25.3 | )% | ||||||||||
Distributed excluding divested products |
77,564 | 80,422 | 109,498 | (3.6 | ) | (26.6 | ) | |||||||||||||
Total software license fees excluding
divested products |
185,780 | 193,436 | 260,776 | (4.0 | ) | (25.8 | ) | |||||||||||||
Software license fees — divested products * |
8,724 | 26,198 | 36,730 | (66.7 | ) | (28.7 | ) | |||||||||||||
Total software license fees |
194,504 | 219,634 | 297,506 | (11.4 | ) | (26.2 | ) | |||||||||||||
Maintenance fees |
||||||||||||||||||||
Mainframe |
327,264 | 337,387 | 335,409 | (3.0 | ) | 0.6 | ||||||||||||||
Distributed excluding divested products |
107,388 | 108,049 | 103,074 | (0.6 | ) | 4.8 | ||||||||||||||
Total maintenance fees excluding
divested products |
434,652 | 445,436 | 438,483 | (2.4 | ) | 1.6 | ||||||||||||||
Maintenance fees — divested products * |
4,839 | 34,044 | 37,891 | (85.8 | ) | (10.2 | ) | |||||||||||||
Total maintenance fees |
439,491 | 479,480 | 476,374 | (8.3 | ) | 0.7 | ||||||||||||||
Total products segment revenue |
||||||||||||||||||||
Mainframe |
435,480 | 450,401 | 486,687 | (3.3 | ) | (7.5 | ) | |||||||||||||
Distributed |
198,515 | 248,713 | 287,193 | (20.2 | ) | (13.4 | ) | |||||||||||||
Total products segment revenue |
$ | 633,995 | $ | 699,114 | $ | 773,880 | (9.3 | ) | (9.7 | ) | ||||||||||
Web performance services segment |
||||||||||||||||||||
Subscription fees |
$ | 16,852 | n/a | n/a | ||||||||||||||||
Total product software revenue |
$ | 650,847 | $ | 699,114 | $ | 773,880 | (6.9 | ) | (9.7 | ) | ||||||||||
| * | Divested products license and maintenance fees relate to our Quality and DevPartner product lines that were sold during fiscal 2010. See Note 3 of the notes to consolidated financial statements, included in Item 8 of this report, for more information on this divestiture. |
Product software revenue by geographic location is presented in the table below (in
thousands):
| Year Ended March 31, | ||||||||||||
| 2010 | 2009 | 2008 | ||||||||||
United States |
$ | 348,882 | $ | 361,354 | $ | 395,029 | ||||||
Europe and Africa |
209,697 | 233,938 | 258,467 | |||||||||
Other international operations |
92,268 | 103,822 | 120,384 | |||||||||
Total product software revenue |
$ | 650,847 | $ | 699,114 | $ | 773,880 | ||||||
Product software revenue, which consists of software license fees, maintenance fees and
subscription fees, comprised 73.0%, 64.1% and 62.9% of total revenue during fiscal 2010, 2009 and
2008, respectively.
33
Table of Contents
Software license fees
Software license fees (“license fees”) decreased $25.1 million or 11.4% during fiscal 2010, which
included a positive impact from foreign currency fluctuations of $3.1 million, and decreased $77.9
million or 26.2% during fiscal 2009, which included a negative impact from foreign currency
fluctuations of $10.6 million.
Excluding the $17.4 million impact from divested products, license fees decreased $7.7 million or
4.0% during fiscal 2010 as compared to fiscal 2009. Mainframe products accounted for $4.8 million
of the decrease and our distributed products accounted for $2.9 million of the decrease. Our
distributed product decline was primarily due to a $6.2 million decline in Uniface and Changepoint
license fees, offset by a $3.4 million increase in Vantage license fees. The license fee decline
occurred during our first quarter of fiscal 2010 as the global economic slowdown that began during
the second quarter of fiscal 2009 continued to affect the closure of license transactions for all
our product lines. The decline was partially offset by license fees growth during the remainder of
fiscal 2010 as economic conditions began to improve causing customers to increase technology
spending.
The decline in software license fees in fiscal 2009 as compared to fiscal 2008 was a result of the
global economic slowdown that began at the end of the second quarter of fiscal 2009 affecting the
closure of license transaction deals across all product lines with Vantage, Quality and mainframe
products having the greatest effect on the decline.
During fiscal 2010 and fiscal 2009, for software license transactions that are required to be
recognized ratably, we deferred $55.6 million and $80.0 million, respectively, of license revenue
relating to such transactions that closed during the period. We recognized as license fees $80.2
million and $84.7 million, respectively, of previously deferred license revenue relating to such
transactions that closed and had been deferred prior to the beginning of the period, including $7.2
million related to our divested products during the first quarter of fiscal 2010.
Maintenance fees
Maintenance fees decreased $40.0 million or 8.3% during fiscal 2010, which included a positive
impact from foreign currency fluctuations of $450,000, and increased $3.1 million or 0.7% during
fiscal 2009, which included a negative impact from foreign currency fluctuations of $8.0 million.
Excluding the $29.2 million impact from divested products, maintenance fees decreased $10.8 million
or 2.4% during fiscal 2010 as compared to fiscal 2009. The decrease was primarily the result of
reductions in our mainframe product lines. The global economic slowdown that began during the
second quarter of fiscal 2009 also impacted maintenance contracts for new mainframe arrangements
and the pricing of existing arrangements being renewed.
The increase in maintenance fees in fiscal 2009 as compared to fiscal 2008 was due to growth in our
mainframe products, primarily Strobe, of $2.0 million and Vantage of $1.1 million.
Subscription fees
In November 2009, through the acquisition of Gomez, we began to offer, on a subscription basis, web
performance services that are used to test and monitor web and mobile applications.
Revenue recognized from these services is referred to as subscription fees and totaled $16.9
million during fiscal 2010. See Note 2 of the notes to consolidated financial statements, included
in Item 8 of this report, for additional information regarding historical pro forma financial
results of Compuware and Gomez.
34
Table of Contents
Product Software Expenses
Products segment expenses include cost of software license fees, cost of maintenance and
subscription fees, technology development and support costs, sales and marketing expenses and the
gain on Product Divestiture. As part of the Product Divestiture, 273 personnel related to the sales, sales
support, development, maintenance and delivery of the Quality and DevPartner product lines were
transferred to Micro Focus as of June 1, 2009.
Cost of software license fees includes amortization of capitalized software, the cost of
duplicating and disseminating products to customers, including associated hardware costs, and the
cost of author royalties. Cost of software license fees decreased $9.1 million or 37.0% during
fiscal 2010 to $15.4 million from $24.5 million in fiscal 2009 and decreased $6.0 million or 19.6%
during fiscal 2009 from $30.5 million in fiscal 2008.
The decrease in expense for fiscal 2010 as compared to fiscal 2009 was primarily a result of lower
capitalized software amortization due to the following: (1) capitalized internal software costs
associated with the products involved in the Product Divestiture were classified as held for sale
at March 31, 2009, and subsequently sold, eliminating the need for future amortization; and (2)
certain purchased software costs acquired in prior year acquisitions became fully amortized by the
beginning of fiscal 2010.
The decrease in cost for fiscal 2009 as compared to fiscal 2008 was due to a $3.9 million
capitalized software impairment charge recorded during the first quarter of fiscal 2008 associated
with our restructuring initiatives. The remaining decline was primarily due to a decline in costs
associated with hardware sold with our Vantage product line.
As a percentage of software license fees, cost of software license fees was 7.9%, 11.2% and 10.2%
in fiscal 2010, 2009 and 2008, respectively. The decline in the percentage for fiscal 2010 as
compared to fiscal 2009 was primarily due to the decrease in capitalized software amortization as
identified above, partially offset by the decline in license fees in fiscal 2010. The increase in
the percentage for fiscal 2009 as compared to fiscal 2008 was primarily due to the decline in
license fees, partially offset by the decline in cost of license fees as previously described.
Cost of maintenance and subscription fees consists of the direct costs allocated to
maintenance and product support such as helpdesk and technical support; amortization of capitalized
software, depreciation and maintenance expense associated with our web performance services network
related computer equipment; data center costs; and payments to individuals for tests conducted from
their Internet-connected personal computers. Cost of maintenance and subscription fees increased
$700,000 or 1.6% during fiscal 2010 to $42.6 million from $41.9 million in fiscal 2009 and
decreased $4.4 million or 9.6% during fiscal 2009 from $46.3 million in fiscal 2008.
The increase in expense during fiscal 2010 as compared to fiscal 2009 was primarily due to $9.3
million costs associated with Gomez’s web performance services, partially offset by lower
compensation and employee benefit costs resulting from the transfer of employees to Micro Focus, as
discussed above, and headcount reductions resulting from our restructuring actions.
The decrease in expense for fiscal 2009 as compared to fiscal 2008 was primarily due to lower
compensation and benefit costs resulting from employee headcount reductions as part of the
restructuring actions taken during fiscal 2008 and fiscal 2009.
As a percentage of maintenance and subscription fees, cost of maintenance and subscription fees
were 9.3%, 8.7% and 9.7% in fiscal 2010, 2009 and 2008, respectively.
35
Table of Contents
Technology development and support includes, primarily, the costs of programming personnel
associated with development and support of our products and the Gomez web performance services
network less the amount of software development costs capitalized during the period. Also included
are personnel costs associated with developing and maintaining internal systems and
hardware/software costs required to support all technology initiatives.
Total technology development and support costs incurred internally and capitalized during fiscal
2010, 2009 and 2008 were as follows (in thousands):
| Year Ended March 31, | ||||||||||||
| 2010 | 2009 | 2008 | ||||||||||
Technology development and support costs incurred |
$ | 97,726 | $ | 98,829 | $ | 113,693 | ||||||
Capitalized internal software costs * |
(6,481 | ) | (12,376 | ) | (12,561 | ) | ||||||
Technology development and support costs expensed |
$ | 91,245 | $ | 86,453 | $ | 101,132 | ||||||
| * | See Note 1 of the notes to consolidated financial statements, included in Item 8 of this report, for our policy on capitalized internal software costs. |
Before capitalized internal software costs, total technology development and support expenditures
decreased $1.1 million or 1.1%, to $97.7 million during fiscal 2010 from $98.8 million in fiscal
2009 and deceased $14.9 million or 13.1% during fiscal 2009 from $113.7 million in fiscal 2008.
The decreases in costs for fiscal 2010 and fiscal 2009 as compared to the previous periods were
primarily due to lower compensation and employee benefit costs resulting from headcount reductions
that occurred from restructuring actions. The headcount reduction in fiscal 2010 was further
impacted by the transfer of employees to Micro Focus, as discussed above, partially offset by an
increase in headcount related to the Gomez acquisition.
As a percentage of product
software revenue, costs of technology development and support were 14.0%, 12.4% and 13.1% in fiscal
2010, 2009 and 2008 respectively. The percentage increase for fiscal 2010 as compared to fiscal
2009 was primarily due to the decline in product software revenue from the Product Divestiture,
partially offset by the declines in compensation and employee benefit costs associated with the
headcount reductions discussed below. The decline in the percentage from fiscal 2009 as compared to
fiscal 2008 was due to the decline in compensation and employee benefit costs, partially offset by
the decline in product software revenue.
Sales and marketing costs consist primarily of personnel related costs associated with
product sales, sales support and marketing for our product offerings. Sales and marketing costs
decreased $4.0 million or 1.7% during fiscal 2010 to $222.4 million from $226.4 million in fiscal
2009 and decreased $41.4 million or 15.5% during fiscal 2009 from $267.8 million in fiscal 2008.
The decrease in costs for fiscal 2010 as compared to fiscal 2009 was primarily due to lower
compensation, employee benefit and travel costs of $8.2 million resulting from reductions in
headcount related to our restructuring actions and the transfer of employees to Micro Focus. The
headcount reduction was partially offset by the addition of headcount related to the Gomez
acquisition. The cost savings associated with the headcount reduction were partially offset by an
increase in advertising costs primarily associated with our Compuware 2.0 marketing campaign.
The decrease in costs for fiscal 2009 as compared to fiscal 2008 was a result of lower compensation
and benefit costs of $21.7 million resulting primarily from employee headcount reductions as part
of the restructuring actions taken during fiscal 2008 and fiscal 2009 and decreases in bonus and
commission
costs of $25.4 million due to the decline in software license sales in fiscal 2009. These decreases
in costs were partially offset by an increase in advertising costs primarily associated with our
Compuware 2.0 marketing campaign.
As a percentage of product software revenue, sales and marketing costs were 34.2%, 32.4% and 34.6% in
fiscal 2010, 2009 and 2008, respectively.
36
Table of Contents
Gain on divestiture of product lines relates to the Product Divestiture that occurred
in May 2009 and resulted in a gain of $52.4 million that was recognized during the first quarter of
fiscal 2010. See Note 3 of the notes to consolidated financial statements, included in Item 8 of
this report, for additional information on the divestiture.
PROFESSIONAL SERVICES SEGMENT
Financial information for the professional services segment is as follows (in thousands):
| Year Ended March 31, * | ||||||||||||
| 2010 | 2009 | 2008 | ||||||||||
Revenue |
$ | 200,865 | $ | 356,111 | $ | 418,559 | ||||||
Expenses |
178,938 | 331,001 | 374,626 | |||||||||
Professional services segment contribution |
$ | 21,927 | $ | 25,110 | $ | 43,933 | ||||||
| * | The professional services segment and the application services segments are combined and reported as professional services on the consolidated statement of operations, included in Item 8 of this report. |
Professional services segment revenue by geographic location is presented in the table below
(in thousands):
| Year Ended March 31, | ||||||||||||
| 2010 | 2009 | 2008 | ||||||||||
United States |
$ | 164,765 | $ | 288,439 | $ | 342,519 | ||||||
Europe and Africa |
24,895 | 58,419 | 68,170 | |||||||||
Other international operations |
11,205 | 9,253 | 7,870 | |||||||||
Total professional services segment revenue |
$ | 200,865 | $ | 356,111 | $ | 418,559 | ||||||
During fiscal 2010, the professional services segment generated a contribution margin of
10.9%, compared to 7.1% and 10.5% during fiscal 2009 and fiscal 2008, respectively.
The increase in contribution margin during fiscal 2010 as compared to fiscal 2009 was due to our
initiatives to exit low-margin engagements and the restructuring actions taken to date as discussed
in the “Fiscal 2009 and Fiscal 2010 Restructuring” section.
The decrease in contribution margin for fiscal 2009 as compared to fiscal 2008 was due to higher
costs in fiscal 2009 associated with the investment in personnel for our Solutions Delivery Group,
which focuses on providing professional services associated with our product solutions, and to a
lesser extent, the completion and transitioning of certain higher-margin contracts during fiscal
2008 and fiscal 2009 (see the “Professional Services Segment Revenue” section for more details).
Fiscal 2009 and Fiscal 2010 Restructuring
During fiscal 2009 and fiscal 2010, management improved the professional services segments
contribution margins by initiating a plan to exit engagements that were considered low-margin and
implementing restructuring actions focused on reducing headcount and operating costs. See Note 7 of
the notes to consolidated financial statements, included in Item 8 of this report, for additional
details related to this restructuring initiative.
37
Table of Contents
Professional Services Segment Revenue
Revenue from professional services decreased $155.2 million or 43.6%, which included a positive
impact from foreign currency fluctuations of $184,000, during fiscal 2010 to $200.9 million from
$356.1 million in fiscal 2009 and decreased $62.4 million or 14.9%, which included a negative
impact from foreign currency fluctuations of $6.1 million, during fiscal 2009 from $418.5 million
in fiscal 2008.
The decrease in revenue during fiscal 2010 as compared to fiscal 2009 was primarily a result of the
actions taken during fiscal 2009 and fiscal 2010 to exit low-margin engagements, with a customer in
the automotive industry representing $52.0 million of the decline.
The decrease in revenue during fiscal 2009 as compared to fiscal 2008 was primarily due to an
agreement to transition the employment of 170 of our professional services staff to a customer
during the first quarter of fiscal 2009 resulting in a $17.0 million decline in revenues for the
segment. The remaining decline was a result of two government contracts expiring that were not
renewed that impacted revenue by $11.9 million, reductions in spending from a client within the
automotive industry that impacted revenue by $7.2 million, our election not to renew low margin
contracts in certain locations and the general slowdown in the economy that has resulted in
companies not renewing or delaying IT projects.
Professional Services Segment Expenses
Professional services segment expenses consist primarily of personnel-related costs of providing
services, including billable staff, subcontractors and sales personnel. Professional services
segment expense decreased $152.1 million or 45.9% during fiscal 2010 to $178.9 million from $331.0
million in fiscal 2009 and decreased $43.6 million or 11.6% during fiscal 2009 from $374.6 million
in fiscal 2008.
The decreases in costs for fiscal 2010 and fiscal 2009 as compared to the previous periods were
primarily attributable to lower compensation, employee benefit and travel costs due to reductions
in employee headcount and reductions in subcontractor costs resulting from our restructuring
programs implemented to align operating costs with the decline in revenue (see “Fiscal 2009 and
Fiscal 2010 Restructuring” within this section).
APPLICATION SERVICES SEGMENT
Our application services, which are marketed under the brand name “Covisint”, provide a
software-as-a-service platform that enables industries and business communities to securely
integrate vital information and processes across users, business partners, customers, vendors and
suppliers.
Financial information for the application services segment is as follows (in thousands):
| Year Ended March 31, * | ||||||||||||
| 2010 | 2009 | 2008 | ||||||||||
Revenue |
$ | 40,467 | $ | 35,230 | $ | 37,172 | ||||||
Expenses |
37,923 | 37,029 | 39,295 | |||||||||
Application services segment income contribution (loss) |
$ | 2,544 | $ | (1,799 | ) | $ | (2,123 | ) | ||||
| * | The professional services segment and the application services segments are combined and reported as professional services on the consolidated statement of operations, included in Item 8 of this report. |
38
Table of Contents
Application services segment revenue by geographic location is presented in the table below
(in thousands):
| Year Ended March 31, | ||||||||||||
| 2010 | 2009 | 2008 | ||||||||||
United States |
$ | 34,916 | $ | 29,580 | $ | 32,447 | ||||||
Europe and Africa |
3,000 | 3,264 | 2,833 | |||||||||
Other international operations |
2,551 | 2,386 | 1,892 | |||||||||
Total application services segment revenue |
$ | 40,467 | $ | 35,230 | $ | 37,172 | ||||||
During fiscal 2010, the application services segment generated a contribution margin of 6.3%
compared to a negative contribution margin of 5.1% and 5.7% during fiscal 2009 and fiscal 2008,
respectively.
The improvement in the contribution margin for fiscal 2010 was due to growth in revenue, primarily
from the healthcare industry, exceeding the growth in expenses which were relatively flat compared
to fiscal 2009 as discussed below.
Application Services Segment Revenue
Revenue from application services increased $5.3 million or 14.9% during fiscal 2010 to $40.5
million from $35.2 million in fiscal 2009 and decreased $2.0 million or 5.2% during fiscal 2009
from $37.2 million in fiscal 2008.
The increase in revenue during fiscal 2010 as compared to fiscal 2009 was primarily due to our
continued expansion into the healthcare industry and, to a lesser extent, increased spending within
the manufacturing industry. We anticipate demand in the healthcare industry will continue to grow
as hospitals, physicians and the United States government move towards establishing electronic
patient health and medical records which will require secure computerized databases and
environments for storing and sharing of information. Our healthcare portal and messaging solutions
are designed to meet this demand and will be a factor in our future growth of the application
services segment.
The decrease in revenue during fiscal 2009 as compared to fiscal 2008 was primarily due to the
decrease in spending by our automotive clients associated with the general economic problems within
the sector, offset by revenue growth within the healthcare industry.
Our application services segment generated 65% and 72%, respectively, of its revenue from the
automotive industry during fiscal 2010 and fiscal 2009.
Application Services Segment Expenses
Application services segment expenses consist primarily of personnel-related costs of providing
services, including technical staff, subcontractors and sales personnel. Application services
segment expenses increased $900,000 or 2.4% during fiscal 2010 to $37.9 million from $37.0 million
in fiscal 2009 and decreased $2.3 million or 5.8% during fiscal 2009 from $39.3 million in fiscal
2008.
The increase in expenses for fiscal 2010 as compared to fiscal 2009 was primarily due to a $3.7
million increase in compensation and employee benefits as the segment continues to increase
employee staffing levels to support the growth in revenue, partially offset by an increase in
incremental cost deferrals associated with customer implementations for which corresponding revenue
and expenses will be recognized in the future.
The decrease in expenses during fiscal 2009 as compared to fiscal 2008 was primarily due to a
decline in bonus and commission costs associated with the decline in revenue.
39
Table of Contents
CORPORATE AND OTHER EXPENSES
Administrative and general expenses consist primarily of costs associated with the
corporate executive, finance, human resources, administrative, legal, communications and investor
relations departments. In addition, administrative and general expenses include all
facility-related costs, such as rent, building depreciation, maintenance and utilities, associated
with all our worldwide offices. Administrative and general expenses increased $16.6 million or
11.2% during fiscal 2010 to $164.6 million from $148.0 million in fiscal 2009 and decreased $34.5
million or 18.9% during fiscal 2009 from $182.5 million in fiscal 2008.
The increase in expenses for fiscal 2010 as compared to fiscal 2009 was primarily due to the
following: (1) increase in annual bonuses of $10.3 million; (2) increase in expense of $8.6 million
as foreign currency and hedging transactions resulted in a net loss of $2.2 million during fiscal
2010 compared to a net gain of $6.4 million in fiscal 2009; and (3) fiscal 2009 reflected a gain of
$5.6 million that was recorded during the first quarter associated with a transaction that
transitioned the employment of 170 of our professional services staff to a customer.
The increase in expenses for fiscal 2010 was partially offset by reductions in compensation,
employee benefits, travel and facility costs of $9.3 million primarily due to the headcount
reductions and facility closures that took place as part of recent restructuring actions.
The decrease in cost for fiscal 2009 as compared to fiscal 2008 was primarily due to the following:
(1) decrease in expense of $11.4 million as foreign currency and hedging transactions resulted in a
net gain of $6.4 million during fiscal 2009 compared to a net loss of $5.0 million in fiscal 2008;
(2) lower bonus expense of $9.7 million as annual bonus targets were not met in fiscal 2009; (3) a
gain of $5.6 million was recorded during the first quarter of fiscal 2009 associated with a
transaction that transitioned the employment of 170 of our professional services staff to a
customer (see Note 3 of the notes to consolidated financial statements, included in Item 8 of this
report and “Professional Services Segment Revenue” within this section for more details) and (4)
lower facility costs of $7.1 million primarily due to the facility closures that took place as part
of the fiscal 2008 and fiscal 2009 restructuring programs.
Other income, net (“other income”) consists primarily of interest income realized from
investments, interest earned on certain license fee transactions that are financed, the portion of
the IBM settlement commitment not utilized through sale of products (“IBM settlement gain”) and
income generated from our investments in partially owned companies. Other income decreased $1.9
million or 6.7% during fiscal 2010 to $25.7 million from $27.6 million in fiscal 2009 and decreased
$7.9 million or 22.4% during fiscal 2009 from $35.5 million in fiscal 2008.
The decrease in income from fiscal 2010 as compared to fiscal 2009 was primarily attributable to a
$5.0 million decline in investment interest income resulting from lower interest rates during
fiscal 2010, partially offset by a $2.8 million increase in the IBM settlement gain. The IBM
settlement agreement expired on March 31, 2010 (see Note 14 of the notes to consolidated financial
statements, included in Item 8 of this report, for additional information).
The decrease in income from fiscal 2009 as compared to fiscal 2008 primarily resulted from a
reduction in interest income of $9.1 million due to a declining average cash equivalent and
investment balance during fiscal 2009 as we continued using available cash to repurchase our common
stock. The decrease was partially offset by an increase of $1.8 million associated with the IBM
settlement.
Income taxes are accounted for using the asset and liability approach. Deferred income
taxes are provided for the differences between the tax bases of assets or liabilities and their
reported amounts in the financial statements and net operating loss and credit carryforwards. The
income tax provision was $68.3 million, $73.1 million and $46.0 million, respectively, in fiscal
2010, 2009 and 2008 representing an effective tax rate of 33%, 34% and 25%, respectively.
40
Table of Contents
The decrease in the effective tax rate for fiscal 2010 as compared to fiscal 2009 was primarily due
to the release of valuation allowances related to Brownfield Redevelopment tax credit carryforward
deferred tax assets that resulted in a tax benefit of $4.1 million.
The increase in the effective tax rate for fiscal 2009 compared to fiscal 2008 resulted from an
income tax benefit of $15 million recorded during fiscal 2008. This benefit related primarily to
the recognition of a deferred tax asset for Brownfield Redevelopment credits available to offset
Michigan Business Tax (“MBT”) liabilities through fiscal 2022.
For additional information regarding the difference between our effective tax rate and the
statutory rate for fiscal 2010, 2009 and 2008, see Note 12 of the notes to consolidated financial
statements, included in Item 8 of this report.
RESTRUCTURING CHARGE
Fiscal 2009 and Fiscal 2010 Restructuring Actions
During fiscal 2009 and fiscal 2010, the Company incurred restructuring charges of $10.0 million and
$8.0 million, respectively, associated with the following initiatives: (1) aligning the
professional services segment headcount and operating expenses after initiating a plan to exit
low-margin engagements and (2) increasing the operating efficiency of our products segment and
administrative and general business processes with the goal of reducing operating expenses.
During the second half of fiscal 2009, the professional services segment’s business model was
realigned resulting in the Company exiting engagements considered low-margin or unprofitable. This
change required the Company to undertake restructuring actions to reduce headcount and operating
expenses resulting in restructuring charges of $6.3 million and $4.2 million, respectively, during
fiscal 2009 and fiscal 2010. Employee termination costs were $5.4 million and $4.0 million,
respectively, due to the Company eliminating 748 professional services personnel and management
positions.
The second initiative, to increase the operating efficiency of the Company’s products segment and
administrative and general business processes, resulted in the Company incurring restructuring
charges of $3.7 million and $3.8 million, respectively, during fiscal 2009 and fiscal 2010.
Employee termination costs accounted for $3.0 million and $3.6 million, respectively, of the
charges due to the elimination of 194 positions within our products segment related to technology
and sales and marketing personnel and 86 corporate administrative and general positions.
As part of these initiatives, full or partial closing of seven offices occurred during fiscal 2009,
resulting in lease abandonment charges of $1.3 million. The remaining facilities charges for fiscal
2009 and fiscal 2010 primarily related to changes in sublease income assumptions associated with
leased facilities that were abandoned in previous restructuring initiatives.
At this time, we do not have any initiatives that will require us to incur restructuring charges;
however unanticipated future conditions or events may require us to reassess the need for further restructuring initiatives.
Fiscal 2008 Restructuring Actions
During fiscal 2008, the Company undertook various restructuring initiatives to improve the
effectiveness and efficiency of certain critical business processes within the products segment
resulting in a restructuring charge of $42.6 million. These initiatives included the realignment
and centralization of certain product development activities leading to the full or partial closing
of certain development labs and termination of approximately 325 employees, primarily programming
personnel. The Company also terminated approximately 200 employees from various other functions of
the organization, primarily within sales and marketing.
41
Table of Contents
See Note 7 of the notes to consolidated financial statements, included in Item 8 of this report,
for additional details related to the restructuring charges and changes in the restructuring
accrual for fiscal 2008, 2009 and 2010.
MANAGEMENT’S DISCUSSION OF CRITICAL ACCOUNTING POLICIES AND ESTIMATES
Note 1 of the notes to consolidated financial statements, included in Item 8 of this report,
contains a summary of our significant accounting policies.
Our consolidated financial statements are prepared in accordance with accounting principles
generally accepted in the United States (“U.S. GAAP”). The preparation of these financial
statements requires us to make estimates and judgments that affect the reported amounts of assets
and liabilities and disclosure of contingent assets and liabilities at the date of the financial
statements and the reported amounts of revenues and expenses during the reporting period.
Assumptions and estimates were based on facts and circumstances existing at March 31, 2010.
However, future events rarely develop exactly as forecast, and the best estimates routinely require
adjustment. The accounting policies discussed below are considered by management to be the most
important to an understanding of our financial statements, because their application places the
most significant demands on management’s judgment and estimates about the effect of matters that
are inherently uncertain.
Revenue Recognition – We generate revenue from licensing software products and providing
maintenance services, web performance services, application services, and professional services
including product implementation and consulting services.
We provide software deliverables that include licensed software product, maintenance and
professional services related to our software. We also provide non-software deliverables such as
professional services unrelated to our software and software-as-a-service (“SaaS”) offerings where
we grant the customer a right to use the software but they do not have the right or capability to
take possession of the software. SaaS offerings include web performance services and application
services. In accordance with ASC 605 “Revenue Recognition”, we split arrangements that include
software and non-software deliverables using either vendor specific objective evidence (“VSOE”) if
available, third-party evidence if VSOE is not available, or estimated selling price if neither
VSOE nor third-party evidence is available.
Product Revenue Recognition – In order for a transaction to be eligible for revenue recognition,
the following criteria must be met: persuasive evidence of an arrangement exists, delivery has
occurred, the fee is fixed or determinable, and collectibility is reasonably assured. We evaluate
collectibility based on past customer history, external credit ratings and payment terms within
various customer agreements.
Perpetual license fee revenue is recognized using the residual method, under which the fair value,
based on VSOE of all undelivered elements of the agreement (e.g., maintenance and professional
services) is deferred. VSOE is based on rates charged for maintenance and professional services
when sold separately. Based on market conditions, we periodically change pricing methodologies for
license, maintenance and professional services. Changes in rates charged for stand alone
maintenance and professional services could have an impact on how bundled revenue agreements are
characterized as license, maintenance or professional services and therefore, on the timing of
revenue recognition in the future. Pricing modifications made during the years covered by this
report have not had a significant impact on the timing or characterization of revenue recognized.
For revenue arrangements where there is a lack of VSOE of fair value for any undelivered elements,
license fee revenue is deferred and recognized upon delivery of those elements or when VSOE of fair
value can be established. When maintenance or services are the only undelivered elements, the
license fee revenue is recognized on a ratable basis over the longer of the maintenance term or
over the period in which the services are expected to be performed. Such transactions include term
and unlimited capacity licenses as we do not sell maintenance licenses separately and therefore
cannot establish VSOE for these undelivered elements in these arrangements. These arrangements do not
qualify for separate recognition of the software license fees, maintenance fees and as applicable,
42
Table of Contents
professional services fees under ASC 605. However, to comply with SEC Regulation S-X, Rule 5-03(b),
which requires product, services and other categories of revenue to be displayed separately on the
income statement, we separate the license fee, maintenance fee and professional services fee
revenue based on its determination of fair value. We apply our VSOE of fair value for maintenance
related to perpetual license transactions and stand alone services arrangements as a reasonable and
consistent approximation of fair value to separate license fee, maintenance fee and professional
services fee revenue for income statement classification purposes.
Generally, revenues from license and maintenance transactions that include installment payment
terms are recognized in the same manner as those requiring current payment. This is because we have
an established business practice of offering installment payment terms to customers and have a
history of successfully enforcing original payment terms without making concessions. However,
because a significant portion of our license fee revenue is earned in connection with installment
sales, changes in future economic conditions or technological developments could adversely affect
our ability to immediately record license fees for these types of transactions and/or limit our
ability to collect these receivables.
To recognize revenue for these multi-year transactions the contract price is allocated between
maintenance revenue and license revenue using the residual method. License revenue associated with
perpetual license agreements is recognized when the customer commits unconditionally to the
transaction, the software products and quantities are fixed, the software has been delivered to the
customer and collection is reasonably assured. License revenue associated with term transactions is
deferred and recognized over the term of the agreement. When the license portion is paid over a
number of years, the license portion of the payment stream is discounted to its net present value.
Interest income is recognized over the payment term. The maintenance revenue associated with all
sales is deferred and is recognized over the applicable maintenance period.
Web Performance Services Fees - Our subscription fees relate to arrangements that permit our
customers to access and utilize our web performance services. The subscription arrangements do not
provide customers the right to take possession of the software at any time, nor do the arrangements
contain rights of return. Subscription fees are deferred upon contract execution and are recognized
ratably over the term of the subscription.
Professional and Application Services Fees – Professional services fees are generally based on
hourly or daily rates; therefore, revenues from professional services are recognized in the period
the services are performed, provided that collection of the related receivable is deemed probable.
For development services rendered under a fixed-price contract, revenue is recognized using the
percentage of completion method and if determined that costs will exceed revenue, the expected loss
is recorded at the time the loss becomes apparent.
Our application services fees are combined with professional services fees in our consolidated
statement of operations and consist of fees for our on-demand software and other services. The
arrangements do not provide customers the right to take possession of the software at any time, nor
do the arrangements contain rights of return. We recognize revenue when all of the following
criteria are met: persuasive evidence of an arrangement exists, delivery has occurred or services
have been rendered, the fee is fixed or determinable and collectibility is reasonably assured.
Certain engagements related to our application services business involve a project to setup the
customer’s structure and provide on-going support for the project. Revenue associated with these
projects is recognized over the service period as the customer derives value from the services,
consistent with the proportional performance method.
Unforeseen events that result in additional time or costs being required to complete our
fixed-price or customer’s structure setup projects could affect the timing of revenue recognition
for the balance of the
project as well as services margins going forward, and could have a negative effect on our results
of operations.
43
Table of Contents
Capitalized Software – We follow the guidance of ASC 985-20 “Costs of Software to be Sold, Leased,
or Marketed” when capitalizing development costs associated with our software products and ASC
350-40 “Internal Use Software” when capitalizing development costs associated with our web
performance services and application services networks. The cost of purchased and internally
developed software technology is capitalized and stated at the lower of unamortized cost or
expected net realizable value. We compute annual amortization using the straight-line method over
the remaining estimated economic life of the software technology that is generally three to five
years. Software is subject to rapid technological obsolescence and future revenue estimates
supporting the capitalized software cost can be negatively affected based upon competitive
products, services and pricing. Such adverse developments could reduce the estimated net realizable
value of our capitalized software and could result in impairment or a shorter estimated life. Such
events would require us to take a charge in the period in which the event occurs or to increase the
amortization expense in future periods and would have a negative effect on our results of
operations. At a minimum, we review for impairments each balance sheet date.
Impairment of Goodwill and Other Intangible Assets – We are required to assess the impairment of
goodwill and other intangible assets annually, or more frequently if events or changes in
circumstances indicate that the carrying value may exceed the fair value.
The performance test involves a two-step process. Step 1 of the impairment test involves comparing
the fair values of the applicable reporting units with their aggregate carrying values, including
goodwill. We measure the fair value of goodwill and other intangible assets using an estimate of
the related discounted cash flow and market comparable valuations, where appropriate. The
discounted cash flow approach uses significant assumptions, including projected future cash flows,
the discount rate reflecting the risk inherent in future cash flows, and a terminal growth rate. If
the carrying amount of a reporting unit exceeds the reporting unit’s fair value, the Company
performs Step 2 of the goodwill impairment test to determine the amount of impairment loss by
comparing the implied fair value of the respective reporting unit’s goodwill with the carrying
amount of that goodwill. Under such evaluation, if the carrying amount of the reporting unit’s
goodwill exceeds the implied fair value of the goodwill, the impairment loss is recognized as an
operating expense in an amount equal to that excess. Changes in any of these estimates and
assumptions, and unknown future events or circumstances (e.g., economic conditions or technological
developments), could have a significant impact on whether or not an impairment charge is recognized
and the magnitude of any such charge.
Deferred Tax Assets Valuation Allowance and Tax Liabilities - Income tax expense, deferred tax
assets and liabilities and reserves for uncertain tax positions reflect management’s best
assessment of estimated future taxes to be paid. We are subject to income taxes in both the U.S.
and numerous foreign jurisdictions. Significant judgments and estimates are required in
determining the consolidated income tax expense.
Deferred income taxes arise from temporary differences between the tax and financial statement
recognition of revenue and expense. In evaluating our ability to recover our deferred tax assets we
consider all available positive and negative evidence, including scheduled reversals of deferred
tax liabilities, projected future taxable income, tax planning strategies and recent financial
operations. In projecting future taxable income, we develop assumptions including the amount of
future state, federal and foreign pretax operating income, the reversal of temporary differences,
and the implementation of feasible and prudent tax planning strategies. These assumptions require
significant judgment about the forecasts of future taxable income and are consistent with the plans
and estimates we are using to manage the underlying businesses.
For additional information regarding these matters see Note 12 of the notes to consolidated
financial statements, included in Item 8 of this report. Changes in estimates of projected future
operating results or in assumptions regarding our ability to generate future taxable income during
the periods in which
temporary differences are deductible could result in significant changes to these accruals and,
therefore, to our net income.
44
Table of Contents
The calculation of our tax liabilities involves dealing with uncertainties in the application of
complex tax laws and regulations in a multitude of jurisdictions across our global operations.
We recognize tax benefits from an uncertain tax position when it is more likely than not that the
position will be sustained upon examination, including resolutions of any related appeals or
litigation processes, based on the technical merits.
We recognize tax liabilities in accordance with ASC 740 “Income Taxes” and we adjust these
liabilities when our judgment changes as a result of the evaluation of new information not
previously available. Due to the complexity of some of these uncertainties, the ultimate resolution
may result in a payment that is materially different from our current estimate of the tax
liabilities. These differences will be reflected as increases or decreases to income tax expense in
the period in which they are determined.
Stock-Based Compensation - We measure compensation expense for stock awards in accordance with ASC
718-10 “Share-Based Payment.” Stock award compensation costs net of an estimated forfeiture rate of
10% are recognized on a straight-line basis over the requisite service period of the award, which
is generally the vesting term of five years.
The fair value of stock options was estimated at the grant date using a Black-Scholes option
pricing model with the following assumptions for fiscal 2010: risk-free interest rate – 2.85%,
volatility factor – 43.94% and expected option life – 6.3 years (dividend yield is not a factor as
we have never issued cash dividends and do not anticipate issuing cash dividends in the future).
The weighted average grant date fair value of option shares granted in fiscal 2010 was $3.54 per
option share.
If we increased the assumptions for the risk-free interest rate and the volatility factor by
50 percent, the fair value of stock options granted in fiscal 2010 would increase 36 percent. If
the Company decreased its assumptions for the risk-free interest rate and the volatility factor by
50 percent, the fair value of stock options granted in fiscal 2010 would decrease 45 percent.
Other – Other accounting policies, although not generally subject to the same level of estimation
as those discussed above, are nonetheless important to an understanding of the financial
statements. Many assets, liabilities, revenue and expenses require some degree of estimation or
judgment in determining the appropriate accounting.
45
Table of Contents
Liquidity and Capital Resources
As of March 31, 2010, 2009 and 2008, cash and cash equivalents and investments totaled
approximately $149.9 million, $278.1 million and $286.4 million, respectively.
Fiscal 2010 compared to Fiscal 2009
Net cash provided by operating activities
Net cash provided by operating activities during fiscal 2010 was $226.3 million, a decrease of $5.7
million from fiscal 2009. The cause of the decrease was primarily due to a reduction in customer
collections of $131 million resulting from the decline in revenue, primarily professional services,
and an increase in income taxes paid during fiscal 2010 compared to fiscal 2009 of $34 million. The
decrease was partially offset by reductions in disbursements for employee payroll and benefits of
$158 million primarily due to the cost savings achieved from our restructuring initiatives.
The consolidated statements of cash flows included in item 8 of this report computes net cash from
operating activities using the indirect cash flow method. Therefore non-cash adjustments and net
changes in assets and liabilities (net of the effects of acquisitions, divestiture and currency fluctuations)
are adjusted from net income to derive net cash from operating activities.
Changes in accounts receivable and deferred revenue have typically had the largest impact on the
reconciliation of net income to compute cash flows from operating activities as we allow for
deferred payment terms on multi-year products contracts. The increase in the net change of accounts
receivable of $46.6 million was primarily due to the impact of the decrease in professional
services fees throughout fiscal 2010 on the accounts receivable balance. The increase in the net
change of deferred revenue of $13.4 million from fiscal 2010 as compared to fiscal 2009 was
primarily attributable to the increase in deferred revenue associated with our web performance
services since the Gomez acquisition.
The other significant changes in our reconciliation of net income to derive net cash from operating
activities during fiscal 2010 as compared to fiscal 2009 were as follows: (1) the adjustment to net
income of $52.4 million resulting from the gain on divestiture of our Quality and DevPartner
product lines (the proceeds from the sale were recorded to investing activities) and (2) the change
in accounts payable and accrued expense balances increasing cash flow from operating activities by
$28.6 million primarily due to the changes in our bonus and commission accruals which increased
from March 31, 2009 to March 31, 2010.
As of March 31, 2010, we had $2.8 million accrued for restructuring actions (see Note 7 of the
notes to consolidated financial statements, included in Item 8 of this report). At this time, there are no initiatives that will require us to
incur restructuring charges;
however unanticipated future conditions of events may require the
Company to reassess the need for further restructuring initiatives.
We believe our existing cash resources and cash flow from operations will be sufficient to meet
operating cash needs for the foreseeable future.
46
Table of Contents
Net cash used in investing activities
Net cash used in investing activities during fiscal 2010 was $238.8 million, an increase of $276.0
million from fiscal 2009.
The increase in cash used was primarily due to the acquisition of Gomez in November 2009 for $284.4
million in cash (net of cash acquired). The purchase was funded from our existing cash resources
and borrowings of $15 million under the credit facility, which was subsequently repaid during
fiscal 2010. Investing activities were further impacted by a decline in the amount of investments
liquidated as $70.2 million of proceeds were received during fiscal 2009 from the liquidation of
investments. There have been no proceeds received from investment liquidations during 2010.
The increase in cash used in investing activities was partially offset by net proceeds of $65
million received from the sale of our Quality and DevPartner product lines during fiscal 2010.
During fiscal 2010 and fiscal 2009, capital expenditures for property and equipment and capitalized
research and software development totaled $19.4 million and $33.0 million, respectively, and were
funded with cash flows from operations. The decline in capital expenditures for fiscal 2010 as
compared to fiscal 2009 was primarily due to a lower investment in equipment of $8.3 million and a
decline in capitalized research and software development costs primarily associated with
enhancements to our software products of $5.3 million.
We will continue to evaluate business acquisition opportunities that fit our strategic
plans.
Net cash used in financing activities
Net cash used in financing activities during fiscal 2010 was $125.3 million, a decrease of $66.6
million from fiscal 2009.
The decrease in cash used in financing activities was primarily due to a $73.1 million reduction in
the amount of common stock repurchased as $132.9 million was repurchased during fiscal 2010
compared to $206.0 million repurchased in fiscal 2009.
The decrease in cash used in financing activities was partially offset by a reduction in cash
received from employee exercises of stock options during fiscal 2010 compared to fiscal 2009.
Since May 2003, the Board of Directors has authorized the Company to repurchase a total of $1.7
billion of our common stock under a Discretionary Stock Repurchase Plan. Purchases of common stock
under the Repurchase Plan may occur on the open market, or through negotiated or block transactions
based upon market and business conditions, subject to applicable legal limitations.
During fiscal 2010, we repurchased approximately 17.9 million shares of our common stock at an
average price of $7.41 per share for a total cost of $132.9 million. As of March 31, 2010,
approximately $403.9 million remains authorized for future purchases under the Discretionary Plan.
We intend to continue repurchasing shares under the Repurchase Plan, funded primarily through our
operating cash flow and, if needed, funds from our credit facility. Our long-term goal is to reduce
our outstanding common share count to approximately 200 million shares. We reserve the right to
change the timing and volume of our repurchases at any time without notice. The maximum amount of
repurchase activity under the Repurchase Plan, excluding block purchases and negotiated
transactions, continues to be limited on a daily basis to 25% of the average daily trading volume
of our common stock during the previous four week period. In addition, no purchases are made during
our self-imposed trading black-out periods in which the Company and our insiders are prohibited
from trading in our common shares. Our standard quarterly black-out period commences 10 business
days prior to the end of each quarter and terminates one full market day following the public
release of our operating results for the period.
47
Table of Contents
The Company has a credit facility with Comerica Bank and other lenders to provide leverage for the
Company if needed. The credit facility provides for a revolving line of credit in the amount of
$150 million and expires on November 1, 2012. The credit facility also permits us to increase the
facility by an additional $150 million, subject to receiving further commitments from lenders and
certain other conditions. The credit facility also limits borrowing outside of the facility to $250
million.
We had no borrowings under the credit facility as of March 31, 2010. See Note 9 of the notes to the
consolidated financial statements, included in Item 8 of this report, for further discussion of the
credit facility.
Fiscal 2009 compared to Fiscal 2008
Net cash provided by operating activities
Net cash provided by operating activities during fiscal 2009 was $232.0 million, a decrease of $2.7
million from fiscal 2008. The decrease was due to the following: (1) reduction in customer
collections of $118 million resulting from the decline in revenue, primarily professional services
and license fees, and to a lesser extent timing of collections on trade receivables; (2) increase
in income taxes paid during fiscal 2009 compared to fiscal 2008 of $20 million; (3) cash paid for
hedge contract settlements during fiscal 2009 of $13 million; and (4) a decrease in interest income
of $11 million primarily due to the lower cash and investment balance in fiscal 2009 as compared to
fiscal 2008. These decreases were partially offset by the following: (1) reductions in
disbursements for employee payroll and benefits of $126 million primarily resulting from the cost
savings achieved through our fiscal 2008 and fiscal 2009 restructuring initiatives; (2) a reduction
in vendor payments of $28 million related to cost-cutting initiatives implemented throughout the
year to control our operating costs; and (3) a reduction of $5 million due to a litigation
settlement in the first quarter of fiscal 2008.
The increase in the net change of accounts receivable of $81.9 million and the decrease in the net
change of deferred revenue of $60.9 million from fiscal 2009 as compared to fiscal 2008 are
primarily due to a decrease in the dollar value of multi-year products transactions.
The other significant change in our reconciliation of net income to derive net cash from operating
activities during fiscal 2009 as compared to fiscal 2008 relates to the change in accounts payable
and accrued expenses causing cash flows from operating activities to decrease by $28.8 million.
This change was primarily due to a larger restructuring initiative in fiscal 2008 as compared to
fiscal 2009 and higher commission and bonus expenses in fiscal 2008 as compared to fiscal 2009,
causing the associated accruals to be higher at March 31, 2008 as compared to March 31, 2009.
As of March 31, 2009, $3.6 million was accrued related to restructuring actions (see Note 7 of the
notes to consolidated financial statements, included in Item 8 of this report).
Net cash provided by investing activities:
Net cash provided by investing activities during fiscal 2009 was $37.2 million, a decrease of $40.0
million from fiscal 2008. The decrease was primarily due to a $36.5 million decline in the amount
of investments liquidated in fiscal 2009 as compared to fiscal 2008. The cash generated from the
sale of our investments in both periods was primarily used to fund the stock repurchase initiative.
During fiscal 2009 and fiscal 2008, capital expenditures for property and equipment and capitalized
research and software development totaled $33.0 million and $24.9 million, respectively, and were
funded with cash flow from operations.
There were no business acquisitions in fiscal 2009 and $4.7 million of business acquisitions in
fiscal 2008.
48
Table of Contents
Net cash used in financing activities:
Net cash used in financing activities during fiscal 2009 was $191.8 million, a decrease of $177.9
million from fiscal 2008.
The decrease of $234.9 million in cash used to repurchase common stock was offset by the $57.0
million decline in net proceeds received from the exercise of employee stock options and employee
contributions to the employee stock purchase plan.
During fiscal 2009, we repurchased approximately 21.6 million shares of our common stock at an
average price of $9.54 per share for a total cost of $206 million.
The Company did not borrow from its credit facility during fiscal 2009 or 2008.
Recently Issued Accounting Pronouncements
See Note 1 of the notes to the consolidated financial statements, included in Item 8 of this report
for recently issued accounting pronouncements that could affect the Company.
Contractual Obligations
The following table summarizes our payments under contractual obligations and our other commercial
commitments as of March 31, 2010 (in thousands):
| Payment Due by Period as of March 31, | ||||||||||||||||||||||||||||
| 2016 and | ||||||||||||||||||||||||||||
| Total | 2011 | 2012 | 2013 | 2014 | 2015 | Thereafter | ||||||||||||||||||||||
Contractual obligations: |
||||||||||||||||||||||||||||
Operating leases |
$ | 264,843 | $ | 22,025 | $ | 13,066 | $ | 10,070 | $ | 8,277 | $ | 6,852 | $ | 204,553 | ||||||||||||||
Other |
16,183 | 6,433 | 6,250 | 2,550 | 450 | 250 | 250 | |||||||||||||||||||||
Total |
$ | 281,026 | $ | 28,458 | $ | 19,316 | $ | 12,620 | $ | 8,727 | $ | 7,102 | $ | 204,803 | ||||||||||||||
“Other” includes commitments under various advertising and charitable contribution agreements
totaling $15.4 million and $800,000, respectively, at March 31, 2010. There are no long term debt
obligations, capital lease obligations or purchase obligations.
We anticipate settlement of $17.0 million with certain taxing authorities of which $85,000 is
expected to be settled in the upcoming twelve months (as discussed in Note 12 of the notes to
consolidated financial statements, included in Item 8 of this report). We are not able to
reasonably estimate in which future periods the remaining amount of $16.9 million will ultimately
be settled. These settlements are not included in the Contractual Obligations table above.
Off-Balance Sheet Arrangements
We currently do not have any off balance sheet or non-consolidated special purpose entity
arrangements as defined by the applicable SEC rules.
49
Table of Contents
ITEM 7A. QUANTITATIVE AND QUALITATIVE DISCLOSURE ABOUT MARKET RISK
We are exposed primarily to market risks associated with movements in interest rates and foreign
currency exchange rates. We believe that we take the necessary steps to manage the potential
impact of interest rate and foreign exchange exposures on our financial position and operating
performance. We do not use derivative financial instruments or forward foreign exchange contracts
for investment, speculative or trading purposes. Immediate changes in interest rates and foreign
currency rates discussed in the following paragraphs are hypothetical rate scenarios used to
calibrate risk and do not currently represent management’s view of future market developments. A
discussion of our accounting policies for derivative instruments is included in Note 1 of the notes
to consolidated financial statements, included in Item 8 of this report.
Interest Rate Risk
Exposure to market risk for changes in interest rates relates primarily to our cash investments and
installment receivables. Derivative financial instruments are not a part of our investment
strategy. Cash investments are placed with high quality issuers to preserve invested funds by
limiting default and market risk.
Our investment portfolio consists of cash investments that have a cost basis and fair value
totaling $149.9 million as of March 31, 2010. The average interest rate and average tax equivalent
interest rate were 0.28% as of March 31, 2010. These investments will mature within the next three
months.
We offer financing arrangements with installment payment terms in connection with our multi-year
software sales. Installment accounts are generally receivable over a two to five year period. As of
March 31, 2010, non-current accounts receivable amounted to $222.3 million, of which approximately
$148.6 million, $50.7 million, $17.7 million, $4.9 million and $351,000 are due in fiscal 2012
through fiscal 2016, respectively. The fair value of non-current accounts receivable is estimated
by discounting the future cash flows using the current rate at which the Company would finance a
similar transaction. At March 31, 2010, the fair value of such receivables is approximately $222.8
million. Each 100 basis point increase in interest rates would have an associated $200,000 negative
impact on the fair value of non-current accounts receivable based on the balance of such
receivables at March 31, 2010. Each 100 basis point decrease in interest rates would have an
associated $1.0 million positive impact on the fair value of non-current accounts receivable based
on the balance of such receivables at March 31, 2010. A change in interest rates will have no
impact on cash flows or net income associated with non-current accounts receivable.
Foreign Currency Risk
Approximately 39% of our revenue was derived from foreign sources in fiscal 2010. This exposes us
to exchange rate risks on foreign currencies related to the fair value of foreign assets and
liabilities, net income and cash flows.
We have entered into forward foreign exchange contracts primarily to hedge amounts due to or from
select subsidiaries denominated in foreign currencies (mainly in Europe and Asia-Pacific) against
fluctuations in exchange rates. Our accounting policies for these contracts are based on our
designation of the contracts as hedging transactions. The criteria we use for designating a
contract as a hedge include the contract’s effectiveness in risk reduction and one-to-one matching
of derivative instruments to underlying transactions. Gains and losses on forward foreign exchange
contracts are recognized in income, offsetting foreign exchange gains or losses on the foreign
balances being hedged. If the underlying hedged transaction is terminated earlier than initially
anticipated, the offsetting gain or loss on the related forward foreign exchange contract would be
recognized in income in the same period.
50
Table of Contents
We operate in certain countries in Latin America and Asia-Pacific where there are limited forward
currency exchange markets. We also have non-U.S. subsidiaries with financial instruments that are
not denominated in their reporting currency. At March 31, 2010, we performed a sensitivity analysis
to assess the potential loss of a 10% positive or negative change in foreign currency exchange
rates would have on our income from operations. Based upon the analysis performed, such a change
would not materially affect our consolidated financial position, results of operations or cash
flows.
The table below provides information about our foreign exchange forward contracts at March 31,
2010. The table presents the value of the contracts in U.S. dollars at the contract maturity date
and the fair value of the contracts at March 31, 2010 (dollars in thousands):
| Contract | Maturity | Forward | Fair | |||||||||||||
| date in | date in | Contract | Position in | Value at | ||||||||||||
| 2010 | 2010 | Rate | U.S. Dollars | March 31, 2010 | ||||||||||||
Forward Sales |
||||||||||||||||
Sweden |
March 31 | April 1 | 7.2303 | $ | 830 | $ | 831 | |||||||||
Forward Purchases |
||||||||||||||||
Hong Kong Dollar |
March 31 | April 1 | 7.6150 | $ | 1,482 | $ | 1,481 | |||||||||
Pounds Sterling |
March 31 | April 1 | 0.6578 | 1,140 | 1,138 | |||||||||||
Singapore Dollar |
March 31 | April 1 | 1.4019 | 1,498 | 1,501 | |||||||||||
| $ | 4,120 | $ | 4,120 | |||||||||||||
51
Table of Contents
ITEM 8. FINANCIAL STATEMENTS AND SUPPLEMENTARY DATA
REPORT OF INDEPENDENT REGISTERED PUBLIC ACCOUNTING FIRM
To the Board of Directors and Shareholders of Compuware Corporation
Detroit, Michigan
Detroit, Michigan
We have audited the accompanying consolidated balance sheets of Compuware Corporation and
subsidiaries (the “Company”) as of March 31, 2010 and 2009, and the related consolidated statements
of operations, shareholders’ equity, and cash flows for each of the three years in the period ended
March 31, 2010. These financial statements are the responsibility of the Company’s management.
Our responsibility is to express an opinion on these financial statements based on our audits.
We conducted our audits in accordance with the standards of the Public Company Accounting Oversight
Board (United States). Those standards require that we plan and perform the audit to obtain
reasonable assurance about whether the financial statements are free of material misstatement. An
audit includes examining, on a test basis, evidence supporting the amounts and disclosures in the
financial statements. An audit also includes assessing the accounting principles used and
significant estimates made by management, as well as evaluating the overall financial statement
presentation. We believe that our audits provide a reasonable basis for our opinion.
In our opinion, such consolidated financial statements present fairly, in all material respects,
the financial position of Compuware Corporation and subsidiaries as of March 31, 2010 and 2009, and
the results of their operations and their cash flows for each of the three years in the period
ended March 31, 2010, in conformity with accounting principles generally accepted in the United
States of America.
We have also audited, in accordance with the standards of the Public Company Accounting Oversight
Board (United States), the Company’s internal control over financial reporting as of March 31,
2010, based on the criteria established in Internal Control—Integrated Framework issued by the
Committee of Sponsoring Organizations of the Treadway Commission and our report dated May 27, 2010
expressed an unqualified opinion on the Company’s internal control over financial reporting.
/s/ DELOITTE & TOUCHE LLP
Detroit, Michigan
May 27, 2010
May 27, 2010
52
Table of Contents
COMPUWARE CORPORATION AND SUBSIDIARIES
CONSOLIDATED BALANCE SHEETS
AS OF MARCH 31, 2010 AND 2009
(In Thousands, Except Share Data)
AS OF MARCH 31, 2010 AND 2009
(In Thousands, Except Share Data)
| Notes | 2010 | 2009 | ||||||||
ASSETS |
||||||||||
CURRENT ASSETS: |
||||||||||
Cash and cash equivalents |
$ | 149,897 | $ | 278,112 | ||||||
Accounts receivable, net |
456,504 | 472,011 | ||||||||
Deferred tax asset, net |
12 | 46,286 | 37,359 | |||||||
Income taxes refundable |
6,160 | 2,578 | ||||||||
Prepaid expenses and other current assets |
46,434 | 41,350 | ||||||||
Assets held for sale |
3 | 27,354 | ||||||||
Total current assets |
705,281 | 858,764 | ||||||||
PROPERTY AND EQUIPMENT, LESS ACCUMULATED
DEPRECIATION AND AMORTIZATION |
2,4 | 341,696 | 353,182 | |||||||
CAPITALIZED SOFTWARE, LESS ACCUMULATED
AMORTIZATION |
2,8 | 41,952 | 35,763 | |||||||
OTHER: |
||||||||||
Accounts receivable |
222,344 | 224,681 | ||||||||
Goodwill |
2,8 | 591,870 | 339,134 | |||||||
Deferred tax asset, net |
12 | 38,969 | 30,851 | |||||||
Other assets |
5,8 | 71,213 | 32,475 | |||||||
Total other assets |
924,396 | 627,141 | ||||||||
TOTAL ASSETS |
$ | 2,013,325 | $ | 1,874,850 | ||||||
LIABILITIES AND SHAREHOLDERS’ EQUITY |
||||||||||
CURRENT LIABILITIES: |
||||||||||
Accounts payable |
$ | 15,713 | $ | 13,796 | ||||||
Accrued expenses |
7 | 68,497 | 70,260 | |||||||
Accrued bonuses and commissions |
42,235 | 16,945 | ||||||||
Income taxes payable |
16,314 | 24,646 | ||||||||
Deferred revenue |
469,834 | 409,410 | ||||||||
Liabilities held for sale |
3 | 26,470 | ||||||||
Total current liabilities |
612,593 | 561,527 | ||||||||
DEFERRED REVENUE |
398,515 | 378,094 | ||||||||
ACCRUED EXPENSES |
7 | 33,193 | 30,111 | |||||||
DEFERRED TAX LIABILITY, NET |
12 | 55,211 | 24,470 | |||||||
Total liabilities |
1,099,512 | 994,202 | ||||||||
COMMITMENTS AND CONTINGENCIES |
14 | |||||||||
SHAREHOLDERS’ EQUITY: |
||||||||||
Preferred stock, no par value — authorized
5,000,000 shares |
10 | |||||||||
Common stock, $.01 par value — authorized
1,600,000,000 shares; issued and outstanding
224,982,171 and 241,798,493 shares in 2010
and 2009, respectively |
10,15 | 2,250 | 2,418 | |||||||
Additional paid-in capital |
606,484 | 628,955 | ||||||||
Retained earnings |
305,441 | 249,897 | ||||||||
Accumulated other comprehensive loss |
(362 | ) | (622 | ) | ||||||
Total shareholders’ equity |
913,813 | 880,648 | ||||||||
TOTAL LIABILITIES AND SHAREHOLDERS’ EQUITY |
$ | 2,013,325 | $ | 1,874,850 | ||||||
See notes to consolidated financial statements.
53
Table of Contents
COMPUWARE CORPORATION AND SUBSIDIARIES
CONSOLIDATED STATEMENTS OF OPERATIONS
YEARS ENDED MARCH 31, 2010, 2009 and 2008
(In Thousands, Except Per Share Data)
YEARS ENDED MARCH 31, 2010, 2009 and 2008
(In Thousands, Except Per Share Data)
| Notes | 2010 | 2009 | 2008 | |||||||||||
REVENUES: |
||||||||||||||
Software license fees |
$ | 194,504 | $ | 219,634 | $ | 297,506 | ||||||||
Maintenance and subscription fees |
456,343 | 479,480 | 476,374 | |||||||||||
Professional services fees |
241,332 | 391,341 | 455,731 | |||||||||||
Total revenues |
892,179 | 1,090,455 | 1,229,611 | |||||||||||
OPERATING EXPENSES: |
||||||||||||||
Cost of software license fees |
15,430 | 24,491 | 30,475 | |||||||||||
Cost of maintenance and subscription fees |
42,555 | 41,877 | 46,300 | |||||||||||
Cost of professional services |
216,861 | 368,030 | 413,921 | |||||||||||
Technology development and support |
91,245 | 86,453 | 101,132 | |||||||||||
Sales and marketing |
222,447 | 226,408 | 267,800 | |||||||||||
Administrative and general |
164,633 | 148,019 | 182,488 | |||||||||||
Restructuring costs |
7 | 7,960 | 10,037 | 42,645 | ||||||||||
Gain on divestiture of product lines |
(52,351 | ) | ||||||||||||
Total operating expenses |
708,780 | 905,315 | 1,084,761 | |||||||||||
INCOME FROM OPERATIONS |
183,399 | 185,140 | 144,850 | |||||||||||
OTHER INCOME (EXPENSE) |
||||||||||||||
Interest income |
4,970 | 10,776 | 19,910 | |||||||||||
Settlement |
14 | 20,734 | 17,943 | 16,160 | ||||||||||
Other |
5 | 17 | (1,138 | ) | (528 | ) | ||||||||
Other income, net |
25,721 | 27,581 | 35,542 | |||||||||||
INCOME BEFORE INCOME TAXES |
209,120 | 212,721 | 180,392 | |||||||||||
INCOME TAX PROVISION |
12 | 68,314 | 73,074 | 45,998 | ||||||||||
NET INCOME |
$ | 140,806 | $ | 139,647 | $ | 134,394 | ||||||||
Basic earnings per share |
11 | $ | 0.61 | $ | 0.56 | $ | 0.47 | |||||||
Diluted earnings per share |
11 | $ | 0.60 | $ | 0.55 | $ | 0.47 | |||||||
See notes to consolidated financial statements.
54
Table of Contents
COMPUWARE CORPORATION AND SUBSIDIARIES
CONSOLIDATED STATEMENTS OF SHAREHOLDERS’ EQUITY AND COMPREHENSIVE INCOME
YEARS ENDED MARCH 31, 2010, 2009 and 2008
(In Thousands, Except Share Data)
YEARS ENDED MARCH 31, 2010, 2009 and 2008
(In Thousands, Except Share Data)
| Accumulated | ||||||||||||||||||||||||||||
| Additional | Other | Total | ||||||||||||||||||||||||||
| Common Stock | Paid-In | Retained | Comprehensive | Shareholders’ | Comprehensive | |||||||||||||||||||||||
| Shares | Amount | Capital | Earnings | Income/(Loss) | Equity | Income | ||||||||||||||||||||||
BALANCE AT APRIL 1, 2007 |
303,031,787 | $ | 3,030 | $ | 673,660 | $ | 444,159 | $ | 11,299 | $ | 1,132,148 | |||||||||||||||||
Net income |
134,394 | 134,394 | $ | 134,394 | ||||||||||||||||||||||||
Foreign currency translation, net of tax |
7,818 | 7,818 | 7,818 | |||||||||||||||||||||||||
Comprehensive income |
$ | 142,212 | ||||||||||||||||||||||||||
Issuance of common stock and related tax benefit |
476,765 | 5 | 4,044 | 4,049 | ||||||||||||||||||||||||
Repurchase of common stock |
(48,961,919 | ) | (490 | ) | (117,910 | ) | (315,430 | ) | (433,830 | ) | ||||||||||||||||||
Acquisition tax benefits |
5,090 | 5,090 | ||||||||||||||||||||||||||
Exercise of employee stock options
and related tax benefit (Note 15) |
7,091,850 | 71 | 67,107 | 67,178 | ||||||||||||||||||||||||
Stock option compensation |
11,553 | 11,553 | ||||||||||||||||||||||||||
Adjustment to initially adopt FIN 48 (Note 12) |
(1,369 | ) | (1,369 | ) | ||||||||||||||||||||||||
BALANCE AT MARCH 31, 2008 |
261,638,483 | 2,616 | 643,544 | 261,754 | 19,117 | 927,031 | ||||||||||||||||||||||
Net income |
139,647 | 139,647 | $ | 139,647 | ||||||||||||||||||||||||
Foreign currency translation, net of tax |
(19,739 | ) | (19,739 | ) | (19,739 | ) | ||||||||||||||||||||||
Comprehensive income |
$ | 119,908 | ||||||||||||||||||||||||||
Issuance of common stock and related tax benefit |
404,567 | 4 | 3,092 | 3,096 | ||||||||||||||||||||||||
Repurchase of common stock |
(21,586,560 | ) | (216 | ) | (54,322 | ) | (151,504 | ) | (206,042 | ) | ||||||||||||||||||
Acquisition tax benefits |
5,059 | 5,059 | ||||||||||||||||||||||||||
Exercise of employee stock options
and related tax benefit (Note 15) |
1,342,003 | 14 | 11,114 | 11,128 | ||||||||||||||||||||||||
Stock awards compensation |
15,637 | 15,637 | ||||||||||||||||||||||||||
Director phantom stock conversion (Note 14) |
4,831 | 4,831 | ||||||||||||||||||||||||||
BALANCE AT MARCH 31, 2009 |
241,798,493 | 2,418 | 628,955 | 249,897 | (622 | ) | 880,648 | |||||||||||||||||||||
Net income |
140,806 | 140,806 | $ | 140,806 | ||||||||||||||||||||||||
Foreign currency translation, net of tax |
260 | 260 | 260 | |||||||||||||||||||||||||
Comprehensive income |
$ | 141,066 | ||||||||||||||||||||||||||
Issuance of common stock and related tax benefit |
316,218 | 3 | 2,235 | 2,238 | ||||||||||||||||||||||||
Repurchase of common stock |
(17,944,859 | ) | (179 | ) | (47,500 | ) | (85,262 | ) | (132,941 | ) | ||||||||||||||||||
Acquisition tax benefits |
880 | 880 | ||||||||||||||||||||||||||
Exercise of employee stock options
and related tax benefit (Note 15) |
812,319 | 8 | 4,470 | 4,478 | ||||||||||||||||||||||||
Stock awards compensation |
17,444 | 17,444 | ||||||||||||||||||||||||||
BALANCE AT MARCH 31, 2010 |
224,982,171 | $ | 2,250 | $ | 606,484 | $ | 305,441 | $ | (362 | ) | $ | 913,813 | ||||||||||||||||
See notes to consolidated financial statements.
55
Table of Contents
COMPUWARE CORPORATION AND SUBSIDIARIES
CONSOLIDATED STATEMENTS OF CASH FLOWS
YEARS ENDED MARCH 31, 2010, 2009 and 2008
(In Thousands)
YEARS ENDED MARCH 31, 2010, 2009 and 2008
(In Thousands)
| 2010 | 2009 | 2008 | ||||||||||
CASH FLOWS PROVIDED BY OPERATING ACTIVITIES: |
||||||||||||
Net income |
$ | 140,806 | $ | 139,647 | $ | 134,394 | ||||||
Adjustments to reconcile net income to cash provided by
operations: |
||||||||||||
Gain on divestiture of product lines |
(52,351 | ) | ||||||||||
Depreciation and amortization |
44,997 | 53,129 | 55,167 | |||||||||
Asset impairments |
1,567 | 662 | 6,854 | |||||||||
Acquisition tax benefits |
880 | 5,059 | 5,090 | |||||||||
Stock award compensation |
17,444 | 15,637 | 11,553 | |||||||||
Deferred income taxes |
12,141 | 4,986 | (2,022 | ) | ||||||||
Other |
362 | 413 | 1,474 | |||||||||
Net change in assets and liabilities, net of effects from
acquisitions, divestiture and currency fluctuations: |
||||||||||||
Accounts receivable |
64,487 | 17,853 | (64,019 | ) | ||||||||
Prepaid expenses and other current assets |
(4,470 | ) | 3,555 | (7,120 | ) | |||||||
Other assets |
(2,666 | ) | (3,641 | ) | 640 | |||||||
Accounts payable and accrued expenses |
(1,040 | ) | (29,623 | ) | (837 | ) | ||||||
Deferred revenue |
17,455 | 4,015 | 64,875 | |||||||||
Income taxes |
(13,300 | ) | 20,316 | 28,641 | ||||||||
Net cash provided by operating activities |
226,312 | 232,008 | 234,690 | |||||||||
CASH FLOWS PROVIDED BY (USED IN) INVESTING ACTIVITIES: |
||||||||||||
Purchase of: |
||||||||||||
Businesses, net of cash acquired |
(284,393 | ) | (4,649 | ) | ||||||||
Property and equipment |
(9,576 | ) | (17,943 | ) | (10,498 | ) | ||||||
Capitalized software |
(9,778 | ) | (15,072 | ) | (14,359 | ) | ||||||
Net proceeds from divestiture of product lines |
64,992 | |||||||||||
Investment proceeds |
70,212 | 106,717 | ||||||||||
Net cash provided by (used in) investing activities |
(238,755 | ) | 37,197 | 77,211 | ||||||||
CASH FLOWS USED IN FINANCING ACTIVITIES: |
||||||||||||
Proceeds from borrowings on credit facility |
51,000 | |||||||||||
Payment on credit facility |
(51,000 | ) | ||||||||||
Net proceeds from exercise of stock options including excess tax
benefits |
5,475 | 11,237 | 67,178 | |||||||||
Employee contribution to common stock purchase plans |
2,215 | 2,986 | 4,066 | |||||||||
Repurchase of common stock |
(132,941 | ) | (206,042 | ) | (440,988 | ) | ||||||
Net cash used in financing activities |
(125,251 | ) | (191,819 | ) | (369,744 | ) | ||||||
EFFECT OF EXCHANGE RATE CHANGES ON CASH |
9,479 | (15,217 | ) | 13,105 | ||||||||
NET INCREASE (DECREASE) IN CASH AND CASH EQUIVALENTS |
(128,215 | ) | 62,169 | (44,738 | ) | |||||||
CASH AND CASH EQUIVALENTS AT BEGINNING OF YEAR |
278,112 | 215,943 | 260,681 | |||||||||
CASH AND CASH EQUIVALENTS AT END OF YEAR |
$ | 149,897 | $ | 278,112 | $ | 215,943 | ||||||
See notes to consolidated financial statements.
56
Table of Contents
COMPUWARE CORPORATION AND SUBSIDIARIES
NOTES TO CONSOLIDATED FINANCIAL STATEMENTS
YEARS ENDED MARCH 31, 2010, 2009 and 2008
YEARS ENDED MARCH 31, 2010, 2009 and 2008
1. SUMMARY OF SIGNIFICANT ACCOUNTING POLICIES
Business
Compuware Corporation (the “Company”, “Compuware”, “we”, “our” and “us”) develops, markets and
supports systems software products designed to improve the performance of information technology
(“IT”) organizations. The Company’s software products consist of four major families: Mainframe,
Vantage, Changepoint and Uniface; all of which are primarily intended for use by IT organizations
and IT service providers. In addition, the Company offers a broad range of professional services,
application services and, through the acquisition of Gomez, Inc. in November 2009, web application
performance management services (“web performance services”).
The Company’s professional services provide clients with IT portfolio management services,
application delivery management services, application outsourcing services and enterprise legacy
modernization services. Our professional services group also offers implementation, consulting and
training services in tandem with the Company’s product offerings which are referred to as product
related services.
The Company’s application services, which are marketed under the brand name “Covisint”, use
business-to-business applications to integrate vital business information and processes between
partners, customers and suppliers.
The Company’s web performance services are used by enterprises to test and monitor the performance,
availability and quality of their web applications, while in development and after deployment.
Application services and web performance services are delivered through software-as-a-service
platforms referred to as the application services network and the web performance services network.
These networks are independent from each other and deliver their services to customers entirely
through on-demand, hosted technology in which a single instance of the software serves all
customers.
Our products and services are offered worldwide across a broad spectrum of technologies, including
mainframe, distributed and Internet platforms.
Basis of Presentation
The consolidated financial statements include the accounts of Compuware and its wholly owned
subsidiaries after elimination of all intercompany balances and transactions. The financial
statements have been prepared in conformity with accounting principles generally accepted in the
United States of America (“U.S. GAAP”), which require management to make estimates and assumptions
that affect the reported amounts of assets, liabilities, shareholders’ equity and the disclosure of
contingencies at March 31, 2010 and 2009 and the results of operations for the years ended March
31, 2010, 2009 and 2008. While management has based their assumptions and estimates on the facts
and circumstances existing at March 31, 2010, final amounts may differ from estimates.
57
Table of Contents
Revenue Recognition
The Company derives its revenue from licensing software products, providing maintenance and support
for those products and rendering professional, application and web performance services. The
Company recognizes revenue in accordance with the Financial Accounting Standards Board (“FASB”)
Accounting Standards Codification (“ASC”) 605 “Revenue Recognition” and Securities and Exchange
Commission Staff Accounting Bulletin (“SAB”) No. 104. Accordingly, in order to be eligible for
revenue recognition, the following criteria must be met: persuasive evidence of an arrangement
exists, delivery has occurred or services have been rendered, the fee is fixed or determinable and
collectibility is reasonably assured.
In the quarter ended December 31, 2009, the Company early adopted Accounting Standards Update
(“ASU”) No. 2009-13 “Multiple-Deliverable Revenue Arrangements” and retrospectively applied the
guidance as of April 1, 2009 which did not result in adjustments to previously presented periods.
ASU No. 2009-13 provides amendments to the criteria in ASC 605 for separating considerations in
multiple-deliverable arrangements and establishes a hierarchy for determining the selling price of
a deliverable. The selling price used for each deliverable will be based on vendor specific
objective evidence (“VSOE”) if available, third party evidence if VSOE is not available, or
estimated selling price if neither VSOE nor third party evidence is available.
The impact of ASU 2009-13 has not been significant for the year ended March 31, 2010. As the
Company sells more multiple-deliverable arrangements that combine software products and web
performance services in the future, the provisions of this statement will allow for separate
accounting of the software license and web performance services fees.
Software license fees
The Company’s software license agreements provide its customers with a right to use its software
perpetually (perpetual licenses) or during a defined term (term licenses).
Perpetual license fee revenue is recognized using the residual method, under which the fair value,
based on VSOE, of all undelivered elements of the agreement (i.e., maintenance and product related
services) is deferred. VSOE is based on rates charged for maintenance and professional services
when sold separately. The remaining portion of the fee is recognized as license fee revenue upon
delivery of the products, provided that no significant obligations remain and collection of the
related receivable is reasonably assured.
For revenue arrangements where there is a lack of VSOE of fair value for any undelivered elements,
license fee revenue is deferred and recognized upon delivery of those elements or when VSOE of fair
value can be established. When maintenance or product related services are the only undelivered
elements, the license fee revenue is recognized on a ratable basis over the longer of the
maintenance term or the period in which the product related services are expected to be performed.
Such transactions include term licenses as the Company does not sell maintenance for term licenses
separately and therefore cannot establish VSOE for the undelivered elements in these arrangements.
These arrangements do not qualify for separate recognition of the software license fees,
maintenance fees and as applicable, product related services fees under ASC 605 “Revenue
Recognition”. However, to comply with SEC Regulation S-X, Rule 5-03(b), which requires product,
services and other categories of revenue to be displayed separately on the income statement, the
Company separates the license fee, maintenance fee and product related services fee (which is
included in professional services fees) based on its determination of fair value. The Company
applies its VSOE of fair value for maintenance related to perpetual license transactions and stand
alone product related services arrangements as a reasonable and consistent approximation of fair
value to separate license fee, maintenance fee and product related services fee revenue for income
statement classification purposes.
58
Table of Contents
The Company offers flexibility to customers purchasing licenses for its products and related
maintenance. Terms of these transactions range from standard perpetual license sales that include
one year of maintenance to large multi-year (generally two to five years), multi-product contracts.
The Company allows deferred payment terms on contracts, with installments collectible over the term
of the contract. Based on the Company’s successful collection history for deferred payments,
license fees (net of any finance fees) are generally recognized as revenue as discussed above. In
certain transactions where it cannot be concluded that the fee is fixed or determinable due to the
nature of the deferred payment terms, the Company recognizes revenue as payments become due.
Financing fees are recognized as interest income over the term of the receivable and amounted to
$2.0 million, $2.8 million and $3.4 million for fiscal 2010, 2009 and 2008, respectively.
At March 31, 2010, current accounts receivable includes installments on multi-year contracts
totaling $264.2 million due in fiscal 2011. Non-current accounts receivable at March 31, 2010
amounted to $222.3 million, of which approximately $148.6 million, $50.7 million, $17.7 million,
$4.9 million and $351,000 are due in fiscal 2012 through fiscal 2016, respectively.
Maintenance and subscription fees
The Company’s maintenance agreements provide for technical support and advice, including problem
resolution services and assistance in product installation, error corrections and any product
enhancements released during the maintenance period. The first year of maintenance is included with
all license agreements. Maintenance fees are recognized ratably over the term of the maintenance
arrangements, which generally range from one to five years.
The Company’s subscription fees relate to arrangements that permit our customers to access and
utilize our web performance services. The subscription arrangements do not provide customers the
right to take possession of the software at any time, nor do the arrangements contain rights of
return. Also, it is not feasible for the customer to run the software on its own hardware.
Subscription fees are deferred upon contract execution and are recognized ratably over the term of
the subscription.
Professional services fees
The Company provides the following professional services solutions: (1) IT portfolio management
services, (2) application delivery management services, (3) application outsourcing services and
(4) enterprise legacy modernization services. The Company also offers implementation, consulting
and training services in tandem with the Company’s product solutions offerings referred to as
product related services.
In addition, revenue associated with the Company’s application services segment is recorded as
professional services fees and primarily consists of fees for customers accessing its application
services network and other services.
Professional services fees are generally based on hourly or daily rates. Revenues from professional
services are recognized in the period the services are performed provided that collection of the
related receivable is reasonably assured. For development services rendered under fixed-price
contracts, revenues are recognized using the percentage of completion method and if determined that
costs will exceed revenue, the expected loss is recorded at the time the loss becomes apparent.
Certain professional services contracts include a project and on-going operations for the project.
Revenue associated with these contracts is recognized over the expected service period as the
customer derives value from the services, consistent with the proportional performance method.
59
Table of Contents
Deferred revenue
Deferred revenue consists primarily of billed and unbilled maintenance fees related to the future
service period of maintenance agreements in effect at the reporting date. Deferred license,
subscription and professional service fees are also included in deferred revenue for those
arrangements that are being recognized on a ratable basis. Sales commission costs associated with
deferred revenue are also deferred and recorded as current or non-current other assets, as
applicable, in the consolidated balance sheets. Long term deferred revenue at March 31, 2010
amounted to $398.5 million, of which approximately $223.8 million, $116.5 million, $39.5 million,
$16.2 million and $2.5 million are expected to be recognized during fiscal 2012 through fiscal
2016, respectively.
Collection and remittance of taxes
The Company records the collection of taxes from customers and the remittance of these taxes to
governmental authorities on a net basis in its consolidated statements of operations.
Cash and Cash Equivalents
The Company considers all investments with an original maturity of three months or less to be cash
equivalents.
Concentration of Credit Risk
The Company’s financial instruments that are potentially subjected to concentrations of credit risk
consist primarily of cash and trade receivables. The Company has cash investment policies which,
among other things, limit investments to investment-grade securities. The Company performs ongoing
credit evaluations of its customers, and the risk with respect to trade receivables is further
mitigated by the diversity, both by geography and by industry, of the customer base.
The Company maintains an allowance for doubtful accounts for estimated losses resulting from the
inability of customers to make required payments. The Company considers historical loss experience,
current economic trends, the aging of outstanding accounts receivable and information available
related to specific customers when estimating the allowance for doubtful accounts. The allowance is
reviewed and adjusted based on the Company’s best estimates.
Changes in the allowance for doubtful account balance for the years ended March 31, 2010, 2009 and
2008 were as follows (in thousands):
Balance at April 1, 2007 |
$ | 8,930 | ||
Increase in allowance charged against income |
1,412 | |||
Accounts charged against the allowance (1) |
(3,913 | ) | ||
Balance at March 31, 2008 |
6,429 | |||
Increase in allowance charged against income |
2,747 | |||
Accounts charged against the allowance (1) |
(1,750 | ) | ||
Balance at March 31, 2009 |
7,426 | |||
Increase in allowance primarily from acquisition |
1,034 | |||
Accounts charged against the allowance (1) |
(2,462 | ) | ||
Balance at March 31, 2010 |
$ | 5,998 | ||
| (1) | Write-offs related primarily to accounts deemed uncollectible and maintenance and subscription cancellations. |
60
Table of Contents
Property and Equipment
The Company states property and equipment at the lower of cost or fair value for impaired assets.
Depreciation is recorded using the straight-line method over the estimated useful lives of the
related assets, which are generally estimated to be 40 years for buildings and three to ten years
for furniture and fixtures, computer equipment and software. Leasehold improvements are amortized
over the term of the lease, or the estimated life of the improvement, whichever is less.
Capitalized Software
The Company’s capitalized software includes the costs of internally developed software technology
and software technology purchased through acquisitions and is stated at the lower of unamortized
cost or net realizable value.
The Company follows the guidance of ASC 985-20 “Costs of Software to be Sold, Leased, or Marketed”
when capitalizing development costs associated with our software products. As such, capitalization
of internally developed software products to be sold begins when technological feasibility of the
product is established.
The Company follows the guidance set forth in ASC 350-40 “Internal Use Software” when capitalizing
development costs associated with our web performance services and application services networks.
The amortization of capitalized software technology is computed on a project-by-project basis. The
annual amortization is the greater of the amount computed using (a) the ratio of current gross
revenues compared with the total of current and anticipated future revenues for the software
technology or (b) the straight-line method over the remaining estimated economic life of the
software technology, including the period being reported on. Amortization begins when the software
technology is available for general release to customers. The amortization period for capitalized
software is generally three to five years.
Capitalized software is reviewed for impairment each balance sheet date or when events and
circumstances indicate an impairment. Asset impairment charges are recorded when estimated future
undiscounted cash flows are not sufficient to recover the carrying value of the capitalized
software. The impairment charge is the amount by which the present value of future cash flows is
less than the carrying value of these assets.
Goodwill and Other Intangible Assets
Goodwill and intangible assets with indefinite lives are tested for impairment at least once a year
or more frequently if management believes indicators of impairment exist. With respect to goodwill,
carrying values are compared with fair values, and when the carrying value exceeds the fair value,
the carrying value of the impaired goodwill is reduced to fair value. The impairment test involves
a two-step process with Step 1 comparing the fair values of the applicable reporting units with
their aggregate carrying values, including goodwill. If the carrying amount of a reporting unit
exceeds the reporting unit’s fair value, the Company performs Step 2 of the goodwill impairment
test to determine the amount of impairment loss by comparing the implied fair value of the
respective reporting unit’s goodwill with the carrying amount of that goodwill.
61
Table of Contents
Fair Value of Assets and Liabilities
The carrying value of cash equivalents, current accounts receivable and accounts payable
approximate their fair value due to the short-term maturities of these instruments. At March 31,
2010, the fair value of non-current receivables was approximately $222.8 million compared to the
carrying amount of $222.3 million. At March 31, 2009, the fair value of non-current receivables was
approximately $224.4 million compared to the carrying amount of $224.7 million. Fair value is
estimated by discounting the future cash flows using the current rate at which the Company would
finance a similar transaction.
The Company reports its money market funds and foreign exchange derivatives at fair value on a
recurring basis using the following levels of inputs to determine fair value: Level 1 — quoted
prices in active markets for identical assets or liabilities; Level 2 — inputs other than Level 1
that are observable, either directly or indirectly, such as quoted prices for similar assets or
liabilities; quoted prices in markets that are not active; or other inputs that are observable or
can be corroborated by observable market data for substantially the full term of the assets or
liabilities; and Level 3 — unobservable inputs that are supported by little or no market activity
and that are significant to the fair value of the assets or liabilities.
The following table presents the Company’s assets and liabilities that are measured at fair value
on a recurring basis at March 31, 2010 and 2009 (in thousands):
| As of March 31, 2010 | ||||||||||||
| Quoted Prices in | Significant | |||||||||||
| Active Markets for | Other Observable | |||||||||||
| Estimated | Identical Assets | Inputs | ||||||||||
| Fair Value | (Level 1) | (Level 2) | ||||||||||
Assets: |
||||||||||||
Cash equivalents — money market funds |
$ | 68,691 | $ | 68,691 | ||||||||
Foreign exchange derivatives |
$ | 1 | $ | 1 | ||||||||
| As of March 31, 2009 | ||||||||||||
| Quoted Prices in | Significant | |||||||||||
| Active Markets for | Other Observable | |||||||||||
| Estimated | Identical Assets | Inputs | ||||||||||
| Fair Value | (Level 1) | (Level 2) | ||||||||||
Assets: |
||||||||||||
Cash equivalents — money market funds |
$ | 201,952 | $ | 201,952 | ||||||||
Liabilities: |
||||||||||||
Foreign exchange derivatives |
$ | 30 | $ | 30 | ||||||||
For information related to an asset measured at fair value on a non-recurring basis for the
year ended March 31, 2010 see “Intangible impairment evaluation” within Note 8 of the consolidated
financial statements.
62
Table of Contents
Income Taxes
The Company accounts for income taxes under the asset and liability method, which requires the
recognition of deferred tax assets and liabilities for the expected future tax consequences of
events that have been included in the financial statements. Under this method, deferred tax assets
and liabilities are determined based on the differences between the financial statements and tax
bases of assets and liabilities and net operating loss and credit carryforwards using enacted tax
rates in effect for the year in which the differences are expected to reverse. The effect of a
change in tax rates on deferred tax assets and liabilities is recognized in the period that
includes the enactment date.
The Company records net deferred tax assets to the extent it believes these assets will more likely
than not be realized. These deferred tax assets are subject to periodic assessments as to
recoverability and if it is determined that it is more likely than not that the benefits will not
be realized, valuation allowances are recorded which would increase the provision for income taxes.
In making such determination, the Company considers all available positive and negative evidence,
including future reversals of existing taxable temporary differences, projected future taxable
income, tax planning strategies and recent financial operations.
Interest and penalties related to uncertain tax positions are included in the income tax provision.
Foreign Currency Translation
The Company’s foreign subsidiaries use their respective local currency as their functional
currency. Accordingly, assets and liabilities in the consolidated balance sheets have been
translated at the rate of exchange at the respective balance sheet dates, and revenues and expenses
have been translated at average exchange rates prevailing during the period the transactions
occurred. Translation adjustments have been excluded from the results of operations and are
reported as accumulated other comprehensive income (loss) within our consolidated statements of
shareholders’ equity and comprehensive income.
Foreign Currency Transactions and Derivatives
The Company is exposed to foreign exchange rate risks related to transactions that are denominated
in non-local currency (“anticipated transactions”) and current inter-company balances due to and
from the Company’s foreign subsidiaries (“inter-company balances”).
The Company enters into derivative contracts to sell or buy currencies with the intent of
mitigating foreign exchange rate risks related to inter-company balances. The Company does not use
foreign exchange contracts to hedge anticipated transactions.
During fiscal 2010 and fiscal 2009, the Company did not designate its foreign exchange derivatives
as hedges under ASC 815 “Derivatives and Hedging”. Accordingly, all foreign exchange derivatives
are recognized on the consolidated balance sheets at fair value (see Fair Value of Assets and
Liabilities within Note 1 of the consolidated financial statements).
The foreign currency net gains or (losses) associated with our anticipated transactions and
inter-company balances for the years ended March 31, 2010, 2009 and 2008 were $(1.8) million, $19.3
million and $(10.1) million, respectively, and were offset by hedging transaction net gains or
(losses) from foreign exchange derivative contracts of $(411,000), $(13.0) million and $5.1 million,
respectively. These amounts were recorded to “Administrative and general” in the consolidated
statements of operations.
At March 31, 2010, the Company had derivative contracts maturing through April 2010 to sell
$830,000 and purchase $4.1 million in foreign currencies and had derivative contracts maturing
through April 2009 to sell $5.1 million and purchase $5.6 million in foreign currencies at March
31, 2009.
63
Table of Contents
Stock-Based Compensation
The Company accounts for stock based compensation pursuant to ASC 718-10 “Share-Based Payment.”
Stock award compensation expense is recognized, net of an estimated forfeiture rate, on a
straight-line basis over the requisite service period of the award, which is the vesting term.
The Company calculates the fair value of stock option awards using the Black-Scholes option pricing
model, which incorporates various assumptions including volatility, expected term, risk-free
interest rates and dividend yields. The expected volatility assumption is based on historical
volatility of the Company’s common stock over the most recent period commensurate with the expected
life of the stock option granted. The Company uses historical volatility because management
believes such volatility is representative of prospective trends. The risk-free interest rate
assumption is based upon observed interest rates appropriate for the expected life of the stock
option awarded. The expected life of the stock option is based on either historical exercise data
if available or the simplified method as described in SAB Topic 14, “Share-Based Payment”. Dividend
yields have not been a factor in determining fair value of stock options granted as the Company has
never issued cash dividends and does not anticipate issuing cash dividends in the future.
The following is the average fair value per share estimated on the date of grant and the
assumptions used for each option granted during fiscal 2010, 2009 and 2008:
| Year Ended March 31, | ||||||||||||
| 2010 | 2009 | 2008 | ||||||||||
Expected volatility |
43.94 | % | 54.17 | % | 59.34 | % | ||||||
Risk-free interest rate |
2.85 | % | 3.23 | % | 4.15 | % | ||||||
Expected lives at date of grant (in years) |
6.3 | 6.3 | 6.8 | |||||||||
Weighted average fair value of the options granted |
$ | 3.54 | $ | 4.27 | $ | 6.07 | ||||||
The Company measures the grant date fair value of restricted stock units using the Company’s
closing common stock price on the trading date immediately preceding the grant date.
See Note 15 to the consolidated financial statements for a further discussion of stock-based
compensation including the impact on net income during the reported periods.
Earnings Per Share (“EPS”)
Basic EPS is computed by dividing earnings available to common shareholders by the weighted-average
number of common shares outstanding for the period. Diluted EPS assumes the issuance of common
stock for all potentially dilutive equivalent shares outstanding following the guidance of ASC
718-10 “Share Based Payment.”
Recently Issued Accounting Pronouncements
In December 2009, the FASB ASU No. 2009-17, “Consolidations (Topic 810): Improvements to Financial
Reporting by Enterprises Involved with Variable Interest Entities.” ASU No. 2009-17 amends the
guidance for consolidation of VIEs primarily related to the determination of the primary
beneficiary of the VIE. This ASU became effective for us on April 1, 2010 and will not have a
material impact on our consolidated financial statements.
In October 2009, the FASB issued ASU No. 2009-13, “Multiple-Deliverable Revenue Arrangements,”
which amends Accounting Standards Codification (“ASC”) Topic 605, “Revenue Recognition.” ASU
2009-13 amends the ASC to eliminate the residual method of allocation for multiple-deliverable
revenue arrangements, and requires that arrangement consideration be allocated at the inception of
an
64
Table of Contents
arrangement to all deliverables using the relative selling price method. The ASU also establishes a
selling price hierarchy for determining the selling price of a deliverable, which includes: (1)
vendor-specific objective evidence if available; (2) third-party evidence if vendor-specific
objective evidence is not available; and (3) estimated selling price if neither vendor-specific nor
third-party evidence is available. Additionally, ASU 2009-13 expands the disclosure requirements
related to a vendor’s multiple-deliverable revenue arrangements. The Company early adopted ASU
2009-13 during the quarter ended December 31, 2009 and retrospectively applied the guidance as of
April 1, 2009 which did not result in adjustments to previously presented periods.
In June 2009, the FASB issued ASU No. 2009-1 “Topic 105 — Generally Accepted Accounting
Principles” (formerly Statement of Financial Accounting Standards No. 168 “FASB Accounting
Standards Codification and the Hierarchy of Generally Accepted Accounting Principles — a
replacement of FASB Statement No. 162”). This Standard identified the FASB Accounting Standards
Codification (“Codification”) as the source of authoritative U.S. GAAP recognized by the FASB to be
applied by nongovernmental entities. Effective July 1, 2009, the Codification supersedes all
then-existing non-SEC accounting and reporting standards. All other non-grandfathered non-SEC
accounting literature not included in the Codification has become non-authoritative. The
Codification is effective for financial statements issued for interim and annual periods ending
after September 15, 2009. The adoption of this statement only resulted in a revision to references
to U.S. GAAP.
In May 2009, the FASB issued ASC No 855 — “Subsequent Events” (formerly SFAS No. 165 “Subsequent
Events”) which was amended in February 2010. This ASC establishes general standards of accounting
for and disclosure of events that occur after the balance sheet date but before financial
statements are issued or are available to be issued. In particular, this Statement sets forth: (1)
the period after the balance sheet date during which management of a reporting entity should
evaluate events or transactions that may occur for potential recognition or disclosure in the
financial statements; (2) the circumstances under which an entity should recognize events or
transactions occurring after the balance sheet date in its financial statements; and (3) the
disclosures that an entity should make about events or transactions that occur after the balance
sheet date. This statement applied for interim and annual periods ended after June 15, 2009.
In April 2008, the FASB issued guidance that amended the factors considered in developing renewal
or extension assumptions used to determine the useful life of a recognized intangible asset. This
standard requires a consistent approach between the useful life of a recognized intangible asset
and the period of expected cash flows used to measure the fair value of an asset. The standard also
requires enhanced disclosures when an intangible asset’s expected future cash flows are affected by
an entity’s intent and/or ability to renew or extend the arrangement. This standard became
effective during fiscal 2010 and did not have a material impact on our consolidated financial
statements.
65
Table of Contents
2. ACQUISITIONS
Acquisitions are accounted for using the purchase method in accordance with ASC 805, “Business
Combinations” and, accordingly, the assets and liabilities acquired are recorded at fair value as
of the acquisition date.
Gomez, Inc. acquisition
On November 6, 2009, the Company acquired all of the outstanding capital stock of Gomez, Inc.
(“Gomez”), through a merger of Gomez with a wholly owned subsidiary of the Company, for $295
million in cash, plus approximately $1.6 million of direct acquisition costs recorded to
“Administrative and general” in the consolidated statements of operations. Gomez is a provider of
web application performance management services, which companies use to test and monitor the
performance, availability and quality of their web applications and is reported as a separate
business segment referred to as “web performance services”.
Assets acquired and liabilities assumed are recorded in the consolidated balance sheet at their
fair values as of November 6, 2009. An allocation of the purchase price at the date of acquisition
is as follows (in thousands):
Cash |
$ | 10,543 | ||
Accounts receivable |
19,132 | |||
Other current assets |
7,712 | |||
Property, plant and equipment |
4,565 | |||
Long-term accounts receivable |
9,101 | |||
Goodwill |
251,176 | |||
Intangible assets |
50,800 | |||
Other assets |
218 | |||
Total assets acquired |
353,247 | |||
Deferred revenue — current |
24,370 | |||
Other current liabilities |
9,726 | |||
Deferred revenue — non-current |
9,275 | |||
Deferred tax liabilities |
12,636 | |||
Other non-current liabilities |
2,304 | |||
Total liabilities acquired |
58,311 | |||
Purchase price |
$ | 294,936 | ||
The Company recorded $251.2 million of goodwill related to the Gomez acquisition. The Company
believes this acquisition will improve our results of operations as Gomez’s web performance
services complement our enterprise application management products, specifically Vantage, and allow
us to offer IT organizations comprehensive solutions that effectively monitor the performance of
their enterprise and Internet application systems and provide opportunities to cross-sell Gomez and
Vantage solutions. As a result, the Company assigned $218.5 million of goodwill to the web
performance services segment and the remaining $32.7 million to the products segment.
The significant factors that contributed to the Company recording goodwill associated with this
acquisition was the following: (1) retention of research and development personnel with the skills
to develop future web application experience management technology; (2) retention of personnel to
provide support services related to the technology acquired; (3) a sales force capable of selling
current and future acquired services; and (4) the opportunity to sell the Company’s enterprise
application
66
Table of Contents
management products to Gomez’s existing customers. The goodwill resulting from the transaction is
not deductible for tax purposes.
A summary of the identifiable intangible assets acquired, useful life and amortization method is as
follows (in thousands):
| Purchase | Useful | |||||||
| Price | Life | Amortization | ||||||
| Allocation | (in Years) | Method | ||||||
Developed technology |
$ | 11,600 | 4 | Straight Line | ||||
Customer relationships |
34,800 | 10 | Straight Line | |||||
Patents |
2,400 | 2 | Straight Line | |||||
Trademarks |
2,000 | 3 | Straight Line | |||||
Total intangible assets acquired |
$ | 50,800 | ||||||
The following unaudited pro forma financial information presents the combined results of
operations of Compuware and Gomez as if the acquisition had occurred as of the beginning of each of
the fiscal periods presented and includes relevant pro forma adjustments, including amortization
charges for the acquired intangible assets. The pro forma financial information is presented for
informational purposes and is not indicative of the results of operations that would have been
achieved if the acquisition and related borrowings had taken place at the beginning of each of the
fiscal periods presented (in thousands):
| Year Ended March 31, | ||||||||
| 2010 | 2009 | |||||||
Pro forma revenue |
$ | 924,835 | $ | 1,140,689 | ||||
Pro forma net income |
140,346 | 139,988 | ||||||
For financial results related to our web performance services segment since the date of
acquisition see Note 13 to the consolidated financial statements.
The purchase price was funded with the Company’s existing cash resources and borrowings of $15
million under its credit facility, which was repaid during fiscal 2010.
Hilgraeve, Inc. acquisition
In February 2008, the Company acquired certain assets and liabilities of Hilgraeve, Inc.
(“Hilgraeve”), a privately held company, for approximately $4.6 million in cash. Hilgraeve
developed an on-demand collaboration platform for lab and prescription data sharing that allows
physician practices to rapidly connect to the Covisint application services network and securely
share key patient information, reducing the cost and improving the quality of healthcare. The
purchase price exceeded the fair value of the acquired assets and liabilities assumed by $3.3
million, which was recorded to goodwill. Intangible assets subject to amortization totaled $1.5
million, of which $1.1 million and $260,000, respectively, related to purchased software and
customer relationships, each with a useful life of five years. The remaining intangible asset, a
non-compete agreement, had a useful life of two years.
67
Table of Contents
3. DIVESTITURES
Quality and DevPartner divestiture
In May 2009, the Company sold its Quality and DevPartner distributed product lines to Micro Focus
International PLC (“Micro Focus”) for $80 million, less certain adjustments relating to cash
collected or invoiced for future maintenance and professional services obligations assumed by Micro
Focus as discussed below.
The sale included the following assets: (1) all rights to the proprietary software products and
other technologies associated with the Quality and DevPartner distributed product lines (other than
File-AID/CS), including trade names, trade secrets, copyrights, patents, related client
relationships and contracts, software and documentation; (2) the right to offer employment to
approximately 290 personnel related to the sales, sales support, development, maintenance and
delivery of the Quality and DevPartner product lines; and (3) personal property associated with the
job requirements of the Company’s personnel that were hired by Micro Focus and other assets
primarily used in connection with the products sold.
Effective upon the closing date of the sale, Micro Focus assumed the obligation to perform future
maintenance and professional services related to the Quality and DevPartner product lines.
The Company recorded a gain on divestiture of $52.4 million to operating expenses during the first
quarter of fiscal 2010 (in thousands):
Sales price |
$ | 80,000 | ||
Credit issued to Micro Focus (1) |
(15,008 | ) | ||
Net proceeds from divestiture of product lines |
64,992 | |||
Assets and liabilities: |
||||
Capitalized software |
(17,589 | ) | ||
Goodwill (2) |
(9,733 | ) | ||
Accounts receivable (1) |
(9,098 | ) | ||
Deferred revenue (1) |
25,458 | |||
Other |
(1,679 | ) | ||
Gain on divestiture of product lines |
$ | 52,351 | ||
| (1) | As of the transaction date, deferred revenue associated with Quality and DevPartner products was $25.5 million related to future maintenance and professional services that became the obligation of Micro Focus. The Company issued a $15.0 million credit (net of an administrative fee) to Micro Focus for the previously collected or invoiced portion of deferred revenue at the date of close. The remaining $9.1 million in unbilled accounts receivable will be either collected by the Company and remitted to Micro Focus, net of an administrative fee, or assigned to Micro Focus. A liability for this $9.1 million was recorded to accounts payable upon the closing date of the sale. As of March 31, 2010, the uncollected accounts receivable and related payable balance was $1.7 million. | |
| (2) | The goodwill adjustment of $9.7 million represents the fair value of the Quality and DevPartner product lines in relation to the fair value of the products segment. |
68
Table of Contents
As a result of entering into a letter of intent in March 2009, the following assets and liabilities
associated with the Quality and DevPartner product lines were reflected as held for sale as of
March 31, 2009 (in thousands):
Assets: |
||||
Prepaid expenses and other current assets |
$ | 215 | ||
Property and equipment, less accumulated depreciation and amortization |
345 | |||
Capitalized software, less accumulated amortization |
17,061 | |||
Goodwill |
9,733 | |||
Total assets held for sale |
$ | 27,354 | ||
Liabilities: |
||||
Current deferred revenue |
$ | 20,008 | ||
Non-current deferred revenue |
6,462 | |||
Total liabilities held for sale |
$ | 26,470 | ||
The Quality and DevPartner product lines represent a portion of the products segment. Because
the Company’s products segment does not account for operating expenses on a product-by-product
basis, operating expenses cannot be directly associated with specific product lines. Therefore, the
Quality and DevPartner product lines were not reported as a discontinued operation in the
Consolidated Financial Statements.
Employee transition agreement
In the first quarter of fiscal 2009, the Company transitioned the employment of 170 of its
professional services staff to a customer which resulted in the Company recording a $5.6 million
gain against “Administrative and general” in the consolidated statements of operations.
69
Table of Contents
4. PROPERTY AND EQUIPMENT
Property and equipment, summarized by major classification, was as follows (in thousands):
| March 31, | ||||||||
| 2010 | 2009 | |||||||
Buildings and improvements |
$ | 372,276 | $ | 371,841 | ||||
Leasehold improvements |
20,477 | 18,452 | ||||||
Furniture and fixtures |
76,507 | 77,229 | ||||||
Computer equipment and software |
68,987 | 67,914 | ||||||
| 538,247 | 535,436 | |||||||
Less accumulated depreciation and
amortization |
196,551 | 182,254 | ||||||
Net property and equipment |
$ | 341,696 | $ | 353,182 | ||||
During fiscal 2008, the Company incurred a property and equipment impairment charge of $3.0
million resulting from the consolidation of certain development facilities associated with the
fiscal 2008 restructuring plan. The impairment charge was included in “Restructuring costs” in the
consolidated statements of operations (see Note 7 to the consolidated financial statements for
additional information).
Depreciation and amortization of property and equipment totaled $26.5 million, $27.0 million and
$29.0 million for the years ended March 31, 2010, 2009 and 2008, respectively.
5. INVESTMENTS IN PARTIALLY OWNED COMPANIES
The Company continues to hold a 33.3% interest in CareTech Solutions, Inc. (“CareTech”), which
provides information technology outsourcing for healthcare organizations including data, voice,
applications and data center operations. This investment is accounted for under the equity method.
At March 31, 2010 and 2009, the Company’s carrying value of its investments in and advances to
CareTech was $12.2 million and $13.2 million, respectively. Included in the net investment at March
31, 2010 and 2009, was a note receivable with a basis of $4.1 million and $6.3 million,
respectively, and accounts receivable due from CareTech of $5.4 million and $4.8 million,
respectively. The note is payable in quarterly installments through January 2012 and bears interest
at 5.25%.
The Company reviewed CareTech’s financial condition at March 31, 2010 and 2009 and concluded that
no impairment charge or valuation allowance related to its investment in CareTech was warranted.
For the years ended March 31, 2010, 2009 and 2008, the Company recognized income of $618,000,
$468,000 and $417,000, respectively, from its investment in CareTech.
Professional services revenue for the years ended March 31, 2010, 2009 and 2008 included $23.8
million, $26.0 million and $25.6 million, respectively, from services provided for CareTech
customers on a subcontractor basis.
On March 30, 2007, the Company sold its 49% interest in ForeSee Results, Inc. (“ForeSee”) which was
incorporated in October 2001 to provide online customer satisfaction management. As part of the
transaction, the notes due the Company were modified to increase the interest rate to 10.25% and to
extend the payment terms of the notes. The remaining outstanding balance of $5.6 million at March
31, 2010 will become due (with interest) on March 30, 2012. The notes are subordinate in payment rights
to certain third party financing obtained by ForeSee in connection with the transaction.
70
Table of Contents
6. RELATED PARTY TRANSACTIONS
The Company sells and purchases products and services to and from companies associated with certain
officers or directors of the Company including the following:
Peter Karmanos, Jr., Chairman of the Board, is a shareholder of Compuware Sports Corporation
(“CSC”). CSC operates an amateur hockey program in Southeastern Michigan. On September 8, 1992, the
Company entered into a Promotion Agreement with CSC to promote the Company’s business. The
promotion agreement automatically renews each year, unless terminated with 60 days prior notice by
either party. Advertising costs related to this agreement were approximately $974,000 for the year
ended March 31, 2010 and $840,000 for each of the years ended March 31, 2009 and 2008. These costs
are included in “Sales and marketing” in the consolidated statements of operations.
Peter Karmanos, Jr. has a significant ownership interest in entities that own and/or manage various
sports arenas. The Company entered into an advertising agreement with one arena to promote the
Company’s business, including the right to name the arena “Compuware Arena”. The Company also rents
suites and places advertising at the arenas. Total costs related to these agreements were
approximately $707,000, $590,000 and $420,000 for the years ended March 31, 2010, 2009 and 2008,
respectively. These costs are included in “Sales and marketing” in the consolidated statements of
operations.
71
Table of Contents
7. RESTRUCTURING CHARGES
The following table summarizes the restructuring activity during fiscal 2010, 2009 and 2008 (in
thousands):
| Employee | Facilities Costs | Total | ||||||||||||||
| Termination | (Primarily Lease | Restructuring | ||||||||||||||
| Benefits | Abandonments) | Other | Activity | |||||||||||||
Accrual at March 31, 2007 |
$ | — | $ | 2,419 | $ | — | $ | 2,419 | ||||||||
Restructuring charge |
33,295 | 8,199 | 1,151 | 42,645 | ||||||||||||
Payments |
(25,881 | ) | (2,921 | ) | (1,066 | ) | (29,868 | ) | ||||||||
Non-cash charges |
(4,759 | ) | (2,981 | ) | (7,740 | ) | ||||||||||
Accrual at March 31, 2008 |
2,655 | 4,716 | 85 | 7,456 | ||||||||||||
Restructuring charge |
8,352 | 1,482 | 203 | 10,037 | ||||||||||||
Payments |
(8,757 | ) | (3,927 | ) | (275 | ) | (12,959 | ) | ||||||||
Non-cash charges |
(976 | ) | (976 | ) | ||||||||||||
Accrual at March 31, 2009 |
1,274 | 2,271 | 13 | 3,558 | ||||||||||||
Restructuring charge |
7,598 | 164 | 198 | 7,960 | ||||||||||||
Payments |
(6,085 | ) | (1,457 | ) | (189 | ) | (7,731 | ) | ||||||||
Non-cash charges |
(977 | ) | (977 | ) | ||||||||||||
Accrual at March 31, 2010 |
$ | 1,810 | $ | 978 | $ | 22 | $ | 2,810 | ||||||||
Fiscal 2009 and fiscal 2010 restructuring actions
During fiscal 2009 and fiscal 2010, the Company incurred restructuring charges of $10.0 million and
$8.0 million, respectively, associated with the following initiatives: (1) aligning the
professional services segment headcount and operating expenses after initiating a plan to exit
low-margin engagements and (2) increasing the operating efficiency of our products segment and
administrative and general business processes with the goal of reducing operating expenses.
During the second half of fiscal 2009, the professional services segment’s business model was
realigned resulting in the Company exiting engagements considered low-margin or unprofitable. This
change required the Company to undertake restructuring actions to reduce headcount and operating
expenses resulting in restructuring charges of $6.3 million and $4.2 million, respectively, during
fiscal 2009 and fiscal 2010. Employee termination costs were $5.4 million and $4.0 million,
respectively, due to the Company eliminating 748 professional services personnel and management
positions.
The second initiative, to increase the operating efficiency of the Company’s products segment and
administrative and general business processes, resulted in the Company incurring restructuring
charges of $3.7 million and $3.8 million, respectively, during fiscal 2009 and fiscal 2010.
Employee termination costs accounted for $3.0 million and $3.6 million, respectively, of the
charges due to the elimination of 194 positions within our products segment related to technology
and sales and marketing personnel and 86 corporate administrative and general positions.
As part of these initiatives, full or partial closing of seven offices occurred during fiscal 2009,
resulting in lease abandonment charges of $1.3 million. The remaining facilities charges for fiscal
2009 and fiscal 2010 primarily related to changes in sublease income assumptions associated with
leased facilities that were abandoned in previous restructuring initiatives.
72
Table of Contents
At this time, there are no initiatives that will require the Company to incur restructuring
charges; however unanticipated future conditions or events may require the Company to reassess
the need for further restructuring initiatives.
Fiscal 2008 restructuring actions
During fiscal 2008, the Company undertook various restructuring initiatives to improve the
effectiveness and efficiency of certain critical business processes within the products segment
resulting in a restructuring charge of $42.6 million. These initiatives included the realignment
and centralization of certain product development activities leading to the full or partial closing
of certain development labs and termination of approximately 325 employees, primarily programming
personnel. The Company also terminated approximately 200 employees from various other functions of
the organization, primarily within sales and marketing.
Restructuring accrual
As of March 31, 2010, $2.2 million of the restructuring accrual was recorded in current “accrued
expenses” with the remaining balance of $632,000 recorded in long-term “accrued expenses” in the
consolidated balance sheets.
The accruals for employee termination benefits at March 31, 2010 primarily represent the amounts to
be paid to employees that have been terminated as a result of initiatives described above.
The accruals for facilities costs at March 31, 2010 represent the remaining fair value of lease
obligations for exited and demised locations, as determined at the cease-use dates of those
facilities, net of estimated sublease income that could be reasonably obtained in the future, and
will be paid out over the remaining lease terms, the last of which ends in fiscal 2014. Projected
sublease income is based on management’s estimates, which are subject to change.
73
Table of Contents
8. GOODWILL AND INTANGIBLE ASSETS
The components of the Company’s intangible assets were as follows (in thousands):
| March 31, 2010 | ||||||||||||
| Gross Carrying | Accumulated | Net Carrying | ||||||||||
| Amount | Amortization | Amount | ||||||||||
Unamortized intangible assets: |
||||||||||||
Trademarks |
$ | 4,429 | $ | 4,429 | ||||||||
Amortizable intangible assets: |
||||||||||||
Capitalized software |
$ | 312,509 | $ | (270,557 | ) | $ | 41,952 | |||||
Customer relationship agreements |
46,772 | (12,051 | ) | 34,721 | ||||||||
Other |
10,896 | (7,243 | ) | 3,653 | ||||||||
Total amortized intangible assets |
$ | 370,177 | $ | (289,851 | ) | $ | 80,326 | |||||
| March 31, 2009 | ||||||||||||
| Gross Carrying | Accumulated | Net Carrying | ||||||||||
| Amount | Amortization | Amount | ||||||||||
Unamortized intangible assets: |
||||||||||||
Trademarks |
$ | 5,784 | $ | 5,784 | ||||||||
Amortizable intangible assets: |
||||||||||||
Capitalized software |
$ | 317,569 | $ | (281,806 | ) | $ | 35,763 | |||||
Customer relationship agreements |
13,218 | (10,751 | ) | 2,467 | ||||||||
Non-compete agreements |
2,561 | (2,516 | ) | 45 | ||||||||
Other |
6,849 | (6,684 | ) | 165 | ||||||||
Total amortized intangible assets |
$ | 340,197 | $ | (301,757 | ) | $ | 38,440 | |||||
Unamortized Trademarks
The Company’s unamortized trademarks were acquired as part of the Covisint and Changepoint
acquisitions in fiscal 2004 and fiscal 2005. These trademarks are deemed to have an indefinite life
and therefore are not being amortized. The decline in trademarks from March 31, 2009 to March 31,
2010 was due to an impairment charge related to a Changepoint tradename. See “Intangible impairment
evaluation” section within this footnote for additional information.
Capitalized Software
The Company’s capitalized software includes the costs of internally developed software technology
(“capitalized internal software cost”) and software technology purchased through acquisitions
(“purchased software”). Net purchased software included in capitalized software at March 31, 2010
and 2009 was $13.2 million and $5.2 million, respectively, with the increase attributable to the
acquisition of Gomez in November 2009.
Research and development (“R&D”) costs include primarily the cost of programming personnel and
amounted to $65.8 million, $64.3 million and $76.2 million, respectively, during fiscal 2010, 2009
and 2008 of which $9.8 million, $15.1 million and $14.4 million, respectively, was capitalized for
internally developed
74
Table of Contents
software technology. R&D costs related to our software products and web
performance services network are reported as “Technology development and support” in the
consolidated statements
of operations and for our application services network, the costs are reported as “Cost of
professional services”.
During fiscal 2008, the Company recorded a capitalized internal software cost impairment charge of
$3.9 million associated with certain of its DevPartner and OptimalJ products due to declining
demand for this technology. This charge related to our products segment and was recorded to “Cost
of software license fees” in the consolidated statements of operations.
Customer relationship agreements
The Company’s customer relationship agreements were acquired as part of recent acquisitions with
the increase in the balance for fiscal 2010 due to the acquisition of Gomez in November 2009. The
customer relationship agreements are being amortized over periods up to ten years.
Other amortized intangible assets
Other amortized intangible assets include amortizable trademarks and patents associated with recent
acquisitions and are being amortized over periods up to three years. The increase in the balance
from March 31, 2009 to March 31, 2010 was due to trademarks and patents acquired as part of the
Gomez acquisition in November 2009.
Amortization of intangible assets
Amortization expense of intangible assets for the years ended March 31, 2010, 2009 and 2008 was
$18.5 million, $26.1 million and $26.1 million, respectively, of which $11.0 million, $15.9 million
and $15.4 million, respectively, relates to capitalized internal software cost amortization and was
primarily reported as “Cost of software license fees” in the consolidated statements of operations.
Estimated future amortization expense, based on identified intangible assets at March 31, 2010, is
expected to be as follows (in thousands):
| Year Ended March 31, | ||||||||||||||||||||||||
| 2011 | 2012 | 2013 | 2014 | 2015 | Thereafter | |||||||||||||||||||
Capitalized software |
$ | 14,701 | $ | 12,046 | $ | 8,697 | $ | 5,360 | $ | 1,128 | $ | 20 | ||||||||||||
Customer relationships |
4,343 | 3,884 | 3,527 | 3,480 | 3,480 | 16,007 | ||||||||||||||||||
Non-compete agreements |
1,867 | 1,386 | 400 | |||||||||||||||||||||
Total |
$ | 20,911 | $ | 17,316 | $ | 12,624 | $ | 8,840 | $ | 4,608 | $ | 16,027 | ||||||||||||
75
Table of Contents
Goodwill
Changes in the carrying amounts of goodwill for the years ended March 31, 2010 and 2009 were as
follows (in thousands):
| Web | ||||||||||||||||||||
| Performance | Professional | Application | ||||||||||||||||||
| Products | Services | Services | Services | Total | ||||||||||||||||
Balance at March 31, 2008, net |
$ | 202,502 | $ | — | $ | 142,294 | $ | 11,471 | $ | 356,267 | ||||||||||
Assets held for sale reclassification (1) |
(9,733 | ) | (9,733 | ) | ||||||||||||||||
Adjustments to previously recorded purchase price (2) |
(373 | ) | 61 | (312 | ) | |||||||||||||||
Effect of foreign currency translation |
(5,230 | ) | (1,858 | ) | (7,088 | ) | ||||||||||||||
Balance at March 31, 2009, net |
187,166 | — | 140,436 | 11,532 | 339,134 | |||||||||||||||
Acquisitions (3) |
32,653 | 218,523 | 251,176 | |||||||||||||||||
Effect of foreign currency translation |
570 | 990 | 1,560 | |||||||||||||||||
Balance at March 31, 2010, net |
$ | 220,389 | $ | 218,523 | $ | 141,426 | $ | 11,532 | $ | 591,870 | ||||||||||
| (1) | The assets held for sale reclassification from goodwill relates to the divestiture of the Company’s Quality and DevPartner product lines and is based on the fair value of these product lines in relation to the fair value of the products segment. See Note 3 to the consolidated financial statements for additional information regarding this divestiture. | |
| (2) | The adjustment to goodwill in fiscal 2009 primarily relates to pre-acquisition tax contingency adjustments. | |
| (3) | The Company acquired Gomez in November 2009. See Note 2 to the consolidated financial statements for additional information regarding this acquisition. |
Intangible impairment evaluation
The Company evaluated its goodwill and other intangible assets for all reporting segments as of
March 31, 2010 and 2009. There was no impairment except for the intangible asset associated with
the Changepoint trademark.
As of March 31, 2010, the Changepoint trademark was determined to be impaired resulting in a $1.6
million write-down to reflect the asset at fair value of $4.1 million. The impairment was recorded
to “Administrative and general” in the consolidated statements of operations. The Company used the
“relief from royalty” income approach in determining the fair value of the trademark which
estimates the portion of a company’s earnings attributable to a trademark based upon the royalty
rate the company would have paid for the use of the trademark if it did not own it. This
measurement is considered a level 3 input under the fair value hierarchy (see “Fair Value of Assets
and Liabilities” within Note 1 for fair value hierarchy descriptions).
When performing the goodwill impairment evaluation, the Company determined the fair value of each
reporting unit using a discounted cash flow analysis supported by market multiples of revenue. The
evaluation resulted in a fair value that exceeded each segments’ carrying value as of March 31,
2010 and 2009.
76
Table of Contents
9. DEBT
The Company had no long term debt at March 31, 2010 and 2009.
The Company has an unsecured revolving credit agreement (the “credit facility”) with Comerica Bank
and other lenders. The credit facility provides for a revolving line of credit in the amount of
$150 million and expires on November 1, 2012. The credit facility also permits the Company to
increase the revolving line of credit by up to an additional $150 million subject to receiving
further commitments from lenders and certain other conditions.
The credit facility contains various covenant requirements, including limitations on liens;
indebtedness; mergers, consolidations and acquisitions; asset sales; dividends; investments, loans
and advances from the Company; transactions with affiliates; and limits additional borrowing
outside of the facility to $250 million. The credit facility is also subject to maximum total debt
to EBITDA and minimum fixed charge coverage financial covenants. The Company was in compliance with
the covenants under the credit facility at March 31, 2010.
Any borrowings under the credit facility bear interest at the prime rate or the Eurodollar rate
plus the applicable margin (based on the level of maximum total debt to EBITDA ratio), at the
Company’s option. The Company pays a quarterly facility fee on the credit facility based on the
applicable margin grid.
The Company incurs interest expense primarily related to the accrual for certain abandoned leases.
Cash paid for interest totaled approximately $1.2 million, $1.6 million and $1.1 million during
fiscal 2010, 2009 and 2008, respectively.
77
Table of Contents
10. CAPITAL STOCK
Preferred Stock Purchase Rights
The Company entered into a Rights Agreement with Equiserve Trust Company, N.A., now known as
Computershare Trust Company N.A., as Rights Agent, in October 2000 (as subsequently amended, the
“rights plan”). The rights plan was adopted to discourage abusive, undervalued and other
undesirable attempts to acquire control of the Company by making acquisitions of control that are
not approved by the Company’s Board of Directors economically undesirable for the acquirer.
Pursuant to the rights plan, each share of the Company’s common stock has attached to it one right,
which initially represents the right to purchase one two-thousandth of a share of Series A Junior
Participating Preferred Stock (a right) for $40. The rights are not exercisable until (1) the first
public announcement that a person or group has acquired, or obtained the right to acquire, except
under limited circumstances, beneficial ownership of 20% or more of the outstanding common stock;
or (2) the close of business on the tenth business day (or such later date as the Company’s Board
of Directors may determine) after the commencement of a tender or exchange offer the consummation
of which would result in a person or group becoming the beneficial owner of 20% or more of the
outstanding common stock. If a person or group becomes a beneficial owner of 20% or more of the
outstanding common stock, each right converts into a right to purchase multiple shares of common
stock of the Company, or in certain circumstances securities of the acquirer, at a 50% discount
from the then current market value. In connection with the rights plan, the Company has designated
800,000 shares of its 5,000,000 shares of authorized but unissued Preferred Stock as “Series A
Junior Participating Preferred Stock.” The rights are redeemable for a specified period at a price
of $0.001 per right and expire on May 9, 2012, unless extended or earlier redeemed by the Board of
Directors.
Stock Repurchase Plans
The Company’s Board of Directors approved the repurchase of the Company’s common stock under three
plans, the “Discretionary Plan”, the 2006 10b5-1 Plan which was terminated in August 2007 and the
2009 10b5-1 Plan which was terminated on September 29, 2008.
The Discretionary Plan authorizes management to regularly evaluate market conditions for an
opportunity to repurchase common stock at its discretion within the parameters established by the
Board. The authorizations and repurchases under this plan were as follows (in thousands):
| Balance Remaining | ||||||||||||||||||||
| Common Shares | for Future | |||||||||||||||||||
| Date | Amount | Acquired During Fiscal | Purchases at | |||||||||||||||||
| Authorized | Authorized | 2008 | 2009 | 2010 | March 31, 2010 | |||||||||||||||
December 2006 |
$ | 200,000 | 11,673 | |||||||||||||||||
August 2007 |
$ | 200,000 | 23,285 | |||||||||||||||||
February 2008 |
$ | 750,000 | 2,687 | 20,287 | 17,945 | $ | 403,920 | |||||||||||||
The 2006 and 2009 10b5-1 Plans (“10b5-1 Plans”) provided for the repurchase of up to 50 million and
14 million shares, respectively, of the Company’s common stock based upon predetermined price,
volume and timing conditions set forth in the plans in accordance with Rule 10b5-1(c) of the
Securities Exchange Act of 1934. During fiscal 2010, the Company did not purchase any common shares
under the 10b5-1 Plans. During fiscal 2009 and fiscal 2008, the Company repurchased 1.3 million and
11.3 million common shares, respectively, for an aggregate committed amount of $13.5 million and
$109.7 million, respectively, under the 10b5-1 Plans ($7.2 million of the fiscal 2007 committed amount was
paid in fiscal 2008).
78
Table of Contents
11. EARNINGS PER COMMON SHARE
Earnings per common share (“EPS”) data were computed as follows (in thousands, except for per share
data):
| Year Ended March 31, | ||||||||||||
| 2010 | 2009 | 2008 | ||||||||||
Basic earnings per share: |
||||||||||||
Numerator: Net income
|
$ | 140,806 | $ | 139,647 | $ | 134,394 | ||||||
Denominator: |
||||||||||||
Weighted-average common shares outstanding
|
232,634 | 250,916 | 286,402 | |||||||||
Basic earnings per share
|
$ | 0.61 | $ | 0.56 | $ | 0.47 | ||||||
Diluted earnings per share: |
||||||||||||
Numerator: Net income
|
$ | 140,806 | $ | 139,647 | $ | 134,394 | ||||||
Denominator: |
||||||||||||
Weighted-average common shares outstanding
|
232,634 | 250,916 | 286,402 | |||||||||
Dilutive effect of stock awards
|
1,931 | 1,486 | 1,226 | |||||||||
Total shares
|
234,565 | 252,402 | 287,628 | |||||||||
Diluted earnings per share
|
$ | 0.60 | $ | 0.55 | $ | 0.47 | ||||||
During the years ended March 31, 2010, 2009 and 2008, stock awards to purchase approximately 26.2
million, 19.3 million and 25.4 million shares, respectively, were excluded from the diluted EPS
calculation because they were anti-dilutive.
79
Table of Contents
12. INCOME TAXES
Income before income taxes and the income tax provision include the following (in thousands):
| Year Ended March 31, | ||||||||||||
| 2010 | 2009 | 2008 | ||||||||||
Income before income taxes: |
||||||||||||
U.S. |
$ | 192,030 | $ | 195,943 | $ | 154,349 | ||||||
Foreign |
17,090 | 16,778 | 26,043 | |||||||||
Total income before income taxes |
$ | 209,120 | $ | 212,721 | $ | 180,392 | ||||||
Income tax provision |
||||||||||||
Current: |
||||||||||||
U.S. Federal |
$ | 54,217 | $ | 47,917 | $ | 33,330 | ||||||
Foreign |
11,521 | 5,937 | 19,118 | |||||||||
U.S. State |
2,957 | 2,299 | 2,829 | |||||||||
Total current tax provision |
68,695 | 56,153 | 55,277 | |||||||||
Deferred: |
||||||||||||
U.S. Federal |
7,278 | 7,213 | 19,005 | |||||||||
Foreign |
(2,234 | ) | 1,568 | (3,548 | ) | |||||||
U.S. State |
(5,425 | ) | 8,140 | (24,736 | ) | |||||||
Total deferred tax provision (benefit) |
(381 | ) | 16,921 | (9,279 | ) | |||||||
Total income tax provision |
$ | 68,314 | $ | 73,074 | $ | 45,998 | ||||||
The Company’s income tax expense differed from the amount computed on pre-tax income at the U.S.
federal income tax rate of 35% for the following reasons (in thousands):
| Year Ended March 31, | ||||||||||||
| 2010 | 2009 | 2008 | ||||||||||
Federal income tax at statutory rates |
$ | 73,192 | $ | 74,452 | $ | 63,137 | ||||||
Increase (decrease) in taxes: |
||||||||||||
State income taxes, net |
2,747 | 1,273 | 1,718 | |||||||||
Settlement of prior year tax matters |
(1,024 | ) | ||||||||||
Taxes relating to foreign operations |
1,361 | (3,446 | ) | 891 | ||||||||
Tax credits (1) |
(1,662 | ) | (3,995 | ) | (21,507 | ) | ||||||
Foreign reorganization (2) |
(32,319 | ) | ||||||||||
Valuation allowance (3) |
28,360 | 6,049 | 2,859 | |||||||||
Other, net (4) |
(3,365 | ) | (235 | ) | (1,100 | ) | ||||||
Provision for income taxes |
$ | 68,314 | $ | 73,074 | $ | 45,998 | ||||||
| (1) | On July 12, 2007, the State of Michigan enacted the Michigan Business Tax (“MBT”) as a replacement for the Single Business Tax (“SBT”), which expired at December 31, 2007. The MBT took effect on January 1, 2008 and is comprised of two components: an income tax and a modified gross receipts tax. The two components of the MBT are considered income taxes subject to the accounting provisions of ASC 740 “Income Taxes”. | |
| As a result of the MBT enactment, the Company recorded an income tax benefit of approximately $15.0 million during fiscal 2008. This benefit related primarily to the recognition of a deferred tax asset for Brownfield Redevelopment credits that are available to offset MBT liabilities through fiscal 2022. The Brownfield Redevelopment credits were previously available to reduce the Company’s |
80
Table of Contents
| SBT liabilities. Prior to the MBT enactment, these credits were not recorded as a deferred tax asset since the Company did not account for the SBT as an income tax. | ||
| (2) | A deferred tax benefit of $32.3 million was recorded in fiscal 2010 due to capital loss carryforwards generated from a foreign tax reorganization that occurred during fiscal 2010. These capital loss carryforwards can only be offset by capital gains within the foreign jurisdiction, which the Company believes is less than more likely than not to occur. Therefore, the Company recorded a valuation allowance equal to the deferred tax benefit. | |
| (3) | During fiscal 2010, the Company recorded a $32.3 million valuation allowance against the capital gains carryforward deferred tax asset that was created from the tax reorganization as noted above; partially offset by the release of valuation allowances related to Brownfield Redevelopment tax credit carryforward deferred tax assets (“Brownfield tax credit carryforward asset”) in the amount of $4.1 million. Due to certain events and circumstances that occurred during these periods, including the acquisition of Gomez, the Company adjusted the carrying value of the Brownfield tax credit carryforward asset to its more likely than not realizable value. | |
| During fiscal 2009, the Company recorded a $6.0 million valuation allowance against its Brownfield tax credit carryforward asset. On January 9, 2009, the State of Michigan amended the MBT with an effective date of January 1, 2008. The amendment impacts future taxable income under MBT, therefore the Company evaluated its ability to realize the Brownfield tax credit carryforward assets before their expiration dates and adjusted the carrying value of the asset to its more likely than not realizable value. | ||
| During fiscal 2008, the Company assessed the ability to utilize its tax credits prior to expiration and recorded a valuation allowance of $2.9 million to reduce the carrying value of the deferred tax asset associated with these tax credit carryforwards to the more likely than not realizable value. | ||
| (4) | During the fourth quarter of fiscal 2010, the Company identified a carryforward component of an income tax receivable that existed at March 31, 2009 resulting in a $3.0 million benefit which was corrected during the fourth quarter of fiscal 2010. The Company has considered both the qualitative and quantitative effects of this error on the financial statements for the fiscal year ended March 31, 2009, as well as the qualitative and quantitative effects of including the error correction in the fourth quarter of fiscal 2010 and fiscal year ended March 31, 2010 and has concluded that the effects on the financial statements are not material. |
81
Table of Contents
Temporary differences and carryforwards that give rise to a significant portion of deferred tax
assets and liabilities were as follows (in thousands):
| March 31, | ||||||||
| 2010 | 2009 | |||||||
Deferred tax assets: |
||||||||
Deferred revenue |
$ | 35,030 | $ | 31,232 | ||||
Amortization of intangible assets |
19,584 | 25,497 | ||||||
Accrued expenses |
29,540 | 25,206 | ||||||
Net operating loss carryforwards |
19,870 | 10,544 | ||||||
Other tax carryforwards |
51,445 | 24,198 | ||||||
Other |
14,028 | 14,738 | ||||||
| 169,497 | 131,415 | |||||||
Less valuation allowance |
40,793 | 8,908 | ||||||
Net deferred tax assets |
128,704 | 122,507 | ||||||
Current portion |
48,060 | 39,099 | ||||||
Long term portion |
$ | 80,644 | $ | 83,408 | ||||
Deferred tax liabilities: |
||||||||
Amortization of intangible assets |
$ | 53,643 | $ | 32,732 | ||||
Capitalized research and
development costs |
12,811 | 17,217 | ||||||
Depreciation |
28,056 | 27,803 | ||||||
Other |
4,150 | 1,015 | ||||||
Total deferred tax liabilities |
98,660 | 78,767 | ||||||
Current portion |
1,774 | 1,740 | ||||||
Long term portion |
$ | 96,886 | $ | 77,027 | ||||
At March 31, 2010, the Company had net operating loss, capital loss and tax credit carryforwards
for income tax purposes of $71.3 million that expire in the tax years as follows (in thousands):
| March 31, | ||||||||
| 2010 | Expiration | |||||||
U.S. federal net operating losses |
$ | 8,563 | 2012 - 2030 | |||||
Non-U.S. net operating losses |
11,231 | Indefinite | ||||||
Non-U.S. net operating losses |
76 | 2016 - 2018 | ||||||
Non-U.S. capital loss carryforwards |
32,319 | Indefinite | ||||||
Non-U.S. tax credit carryforwards |
12 | 2011 - 2019 | ||||||
U.S. state & local tax credit carryforwards |
729 | Indefinite | ||||||
U.S. state & local tax credit carryforwards |
18,385 | 2011 - 2022 | ||||||
| $ | 71,315 | |||||||
The Company follows ASC 740 “Income Taxes” which includes the provisions of FASB Interpretation No.
48, “Accounting for Uncertainty in Income Taxes — an Interpretation of FASB Statement No. 109”
(“FIN 48”) that became effective April 1, 2007. This Interpretation prescribes a recognition
threshold and a measurement attribute for the financial statement recognition and measurement of
tax positions taken or expected to be taken in a tax return. As a result of the implementation of
FIN 48, the Company recorded a $1.4 million increase in the liability for unrecognized tax
benefits, which was accounted for as a cumulative-effect adjustment to retained earnings, during
fiscal 2008.
82
Table of Contents
The amount of gross unrecognized tax benefits was $22.1 million, $16.1 million and $15.0
million, respectively, as of March 31, 2010, 2009 and 2008 of which, $17.3 million, $12.4 million
and $11.8 million, respectively, net of federal benefit, would favorably affect the Company’s
effective tax rate if recognized in future periods.
At March 31, 2009 and 2008, the Company recorded $523,000 of the liability for uncertain tax
positions against deferred tax assets relating to the same jurisdiction. There was no
reclassification of liability for uncertain tax positions recorded as of March 31, 2010. The amount
recorded as current accrued expenses was $85,000, $87,000 and $5.3 million as of March 31, 2010,
2009 and 2008, respectively; and the amount recorded as non-current accrued expenses was $16.9
million, $10.7 million and $6.7 million, respectively.
The following is a tabular reconciliation of the total amounts of unrecognized tax benefits for the
years ended March 31, 2010, 2009 and 2008 (in thousands):
| March 31, | ||||||||||||
| 2010 | 2009 | 2008 | ||||||||||
Unrecognized tax benefit at April 1, 2009 |
$ | 16,184 | $ | 14,956 | $ | 12,757 | ||||||
Gross increases to tax positions for prior periods |
2,717 | 3,230 | 337 | |||||||||
Gross increases to tax positions for prior periods
related to acquired entities during fiscal 2010 |
1,260 | |||||||||||
Gross decreases to tax positions for prior periods |
(2,805 | ) | (2,267 | ) | (203 | ) | ||||||
Gross increases to tax positions for current
period |
5,258 | 3,789 | 2,389 | |||||||||
Foreign tax rate differential for prior period |
(7 | ) | (2 | ) | ||||||||
Settlements |
(3,060 | ) | (39 | ) | ||||||||
Lapse of statute of limitations |
(550 | ) | (462 | ) | (285 | ) | ||||||
Unrecognized tax benefit at March 31, 2010 |
$ | 22,057 | $ | 16,184 | $ | 14,956 | ||||||
In accordance with the Company’s accounting policy, interest and penalties related to uncertain tax
positions are included in the income tax provision. At March 31, 2010, the Company had an $8.9
million interest payable recorded for the payment of interest and a $7.1 million interest
receivable for the receipt of interest. At March 31, 2009, the Company had a $9.3 million interest
payable recorded for the payment of interest and a $7.8 million interest receivable for the receipt
of interest, which included a $6.4 million balance sheet reclassification that increased the
interest receivable and the interest payable. At March 31, 2008, the Company had a $2.9 million
interest payable recorded for the payment of interest and a $1.2 million interest receivable for
the receipt of interest. The Company recognized $248,000 and $313,000, respectively, of net
interest expense during fiscal 2010 and fiscal 2009 and recognized an income tax benefit of $1.1
million during fiscal 2008 for net interest and penalties.
The Company has open tax years, from tax periods 1999 and forward, with various taxing
jurisdictions, including the U.S., Brazil and Canada. These open years contain
matters that could be subject to differing interpretations of applicable tax laws and regulations
due to the amount, timing or inclusion of revenue and expenses or the sustainability of income tax
credits for a given audit cycle. During fiscal 2011, it is reasonably possible that the Company
will settle income tax examinations but the Company does not expect these settlements to have a
material impact on its results of operations.
Cash paid for income taxes was $66.1 million, $31.7 million and $12.1 million during fiscal 2010,
2009 and 2008, respectively.
83
Table of Contents
13. SEGMENT INFORMATION
Compuware has four business segments in the software industry: products, web performance services,
professional services and application services. The Company’s products and services are offered
worldwide to the largest IT organizations across a broad spectrum of technologies, including
mainframe, distributed and Internet platforms and provide the following capabilities:
| • | Our products and web performance services are designed to enhance the effectiveness of key disciplines throughout IT organizations including application development and delivery, service management and IT portfolio management and the availability and quality of web applications. |
| • | Our application services use business-to-business applications to integrate vital business information and processes between partners, customers and suppliers. |
| • | Our IT professional services include IT portfolio management services, application delivery management services, application outsourcing services and enterprise legacy modernization services. Our professional services segment also provides implementation, consulting and training services in tandem with the Company’s product offerings which are referred to as product related services. |
The Company evaluates the performance of its segments based primarily on operating profit before
administrative and general expenses and other charges. The allocation of income taxes is not
evaluated at the segment level. Financial information for the Company’s business segments was as
follows (in thousands):
| Year Ended March 31, | ||||||||||||
| 2010 | 2009 | 2008 | ||||||||||
Revenues: |
||||||||||||
Products: |
||||||||||||
Mainframe |
$ | 435,480 | $ | 450,401 | $ | 486,687 | ||||||
Distributed |
198,515 | 248,713 | 287,193 | |||||||||
Total product segment revenue |
633,995 | 699,114 | 773,880 | |||||||||
Web performance services segment |
16,852 | |||||||||||
Professional services segment |
200,865 | 356,111 | 418,559 | |||||||||
Application services segment |
40,467 | 35,230 | 37,172 | |||||||||
Total revenues |
$ | 892,179 | $ | 1,090,455 | $ | 1,229,611 | ||||||
Income (loss) from operations: |
||||||||||||
Product segment (1) |
$ | 334,549 | $ | 319,885 | $ | 328,173 | ||||||
Web performance services segment |
(3,028 | ) | ||||||||||
Professional services segment |
21,927 | 25,110 | 43,933 | |||||||||
Application services segment |
2,544 | (1,799 | ) | (2,123 | ) | |||||||
Subtotal |
355,992 | 343,196 | 369,983 | |||||||||
Administrative and general |
(164,633 | ) | (148,019 | ) | (182,488 | ) | ||||||
Restructuring costs |
(7,960 | ) | (10,037 | ) | (42,645 | ) | ||||||
Income from operations |
183,399 | 185,140 | 144,850 | |||||||||
Other income, net |
25,721 | 27,581 | 35,542 | |||||||||
Income before income taxes |
$ | 209,120 | $ | 212,721 | $ | 180,392 | ||||||
| (1) | For the year ended March 31, 2010, income from the products segment includes a $52.4 million gain on divestiture of the Quality and DevPartner product lines (see Note 2 to the consolidated financial statements for additional information). |
84
Table of Contents
No single customer accounted for greater than 10% of total revenue during the years ended March 31,
2010, 2009 or 2008, or greater than 10% of accounts receivable at March 31, 2010 or 2009.
The Company does not evaluate assets and capital expenditures on a segment basis, and accordingly
such information is not provided.
Financial information regarding geographic operations is presented in the table below (in
thousands):
| Year Ended March 31, | ||||||||||||
| 2010 | 2009 | 2008 | ||||||||||
Revenues: |
||||||||||||
United States |
$ | 548,562 | $ | 679,373 | $ | 769,995 | ||||||
Europe and Africa |
237,593 | 295,621 | 329,470 | |||||||||
Other international operations |
106,024 | 115,461 | 130,146 | |||||||||
Total revenues |
$ | 892,179 | $ | 1,090,455 | $ | 1,229,611 | ||||||
| March 31, | ||||||||
| 2010 | 2009 | |||||||
Long-lived assets: |
||||||||
United States |
$ | 936,288 | $ | 622,578 | ||||
Europe and Africa |
31,928 | 29,802 | ||||||
Other international operations |
7,302 | 78,103 | ||||||
Total long-lived assets |
$ | 975,518 | $ | 730,483 | ||||
Long-lived assets are comprised of property, plant and equipment, goodwill and capitalized
software. Long-lived assets associated with the Quality and DevPartner product lines were
reclassified to “Assets held for sale” as of March 31, 2009 and are not included in the above
table.
85
Table of Contents
14. COMMITMENTS AND CONTINGENCIES
Contractual obligations
The Company’s contractual obligations primarily relate to various operating lease agreements for
office space, equipment and land for various periods that extend through as late as fiscal 2100.
Total rent payments under these agreements were approximately $26.0 million, $30.9 million and
$37.6 million, respectively, for fiscal 2010, 2009 and 2008. Certain of these lease agreements
contain provisions for renewal options and escalation clauses.
The Company also has commitments under various advertising and charitable contribution agreements
totaling $15.4 million and $800,000, respectively, at March 31, 2010. Total expense related to
these agreements was approximately $7.6 million, $3.7 million and $3.4 million, respectively, for
fiscal 2010, 2009 and 2008. The following is a schedule of future minimum commitments (in
thousands):
| Payment Due by Period as of March 31, | ||||||||||||||||||||||||||||
| 2016 and | ||||||||||||||||||||||||||||
| Total | 2011 | 2012 | 2013 | 2014 | 2015 | Thereafter | ||||||||||||||||||||||
Contractual obligations: |
||||||||||||||||||||||||||||
Operating leases |
$ | 264,843 | $ | 22,025 | $ | 13,066 | $ | 10,070 | $ | 8,277 | $ | 6,852 | $ | 204,553 | ||||||||||||||
Other |
16,183 | 6,433 | 6,250 | 2,550 | 450 | 250 | 250 | |||||||||||||||||||||
Total |
$ | 281,026 | $ | 28,458 | $ | 19,316 | $ | 12,620 | $ | 8,727 | $ | 7,102 | $ | 204,803 | ||||||||||||||
The Company also leases space within the Company’s headquarters facility to business tenants.
Total lease income relating to these spaces totaled $870,000, $1.1 million and $775,000,
respectively, for fiscal 2010, 2009 and 2008 which is recorded to “Administrative and general” in
the consolidated statements of operations.
The following is a schedule of future minimum lease rental commitments (in thousands):
| Payment Due by Period as of March 31, | ||||||||||||||||||||||||||||
| 2016 and | ||||||||||||||||||||||||||||
| Total | 2011 | 2012 | 2013 | 2014 | 2015 | Thereafter | ||||||||||||||||||||||
Lease rental commitments |
$ | 28,039 | $ | 2,164 | $ | 4,765 | $ | 4,949 | $ | 5,155 | $ | 5,300 | $ | 5,706 | ||||||||||||||
The increase in lease rental commitments relates to the Company agreeing to lease
approximately 249,000 square feet of its Detroit, Michigan headquarters building to a local
business under a five year lease agreement beginning during the fourth quarter of fiscal 2010.
Settlement
In March 2005, the Company settled all of its outstanding litigation with International Business
Machines Corporation (“IBM”). Under the settlement agreement and subsequent clarifications, IBM and
the Company entered into a business arrangement whereby IBM was committed to purchase software
licenses and maintenance from the Company totaling $140 million over five years ending in fiscal
2010 ($20 million in fiscal 2006, $30 million in each of the following four years).
During fiscal 2010, 2009 and 2008, IBM utilized $9.3 million, $12.1 million and $13.8 million,
respectively, of their license and maintenance commitment, resulting in an unused commitment
balance of $20.7 million, $17.9 million and $16.2 million, respectively, for fiscal 2010, 2009 and
2008. The unused commitment amounts are reported as “Settlement” in the consolidated statements of
operations and recognized as income in the fourth quarter of each respective fiscal year. The
settlement agreement with IBM expired March 31, 2010.
86
Table of Contents
Legal Matters
From time to time, in addition to the matter identified above, the Company is subject to legal
proceedings, claims, investigations and proceedings in the ordinary course of business. In
accordance with U.S. GAAP, the Company makes a provision for a liability when it is probable that a
liability has been incurred and the amount of the loss can be reasonably estimated. These
provisions are reviewed at least quarterly and adjusted to reflect the impacts of negotiations,
settlements, rulings, advice of legal counsel, and other information and events pertaining to a
particular case. Litigation is inherently unpredictable. However, the Company believes it has valid
defenses with respect to the legal matters pending against the Company. It is possible,
nevertheless, that our consolidated financial position, cash flows or results of operations could
be materially affected by the resolution of one or more of such contingencies.
15. BENEFIT PLANS
Employee Stock Ownership Plan
In July 1986, the Company established an Employee Stock Ownership Plan (“ESOP”) and Trust. Under
the terms of the ESOP, the Company may elect to make annual contributions to the Plan for the
benefit of substantially all U.S. employees. The contribution may be in the form of cash or Company
common stock. The Board of Directors authorizes contributions between a maximum of 25% of eligible
annual compensation and a minimum sufficient to cover current obligations of the Plan. There have
been no contributions to the ESOP plan in the past three fiscal years. This is a non-leveraged ESOP
plan.
Employee Stock Purchase Plan
During fiscal 2002, the shareholders approved international and domestic employee common stock
purchase plans under which the Company was authorized to issue up to 15 million shares of common
stock to eligible employees. Under the terms of the plan, employees can elect to have up to 10% of
their compensation withheld to purchase Company common stock at the close of the offering period.
The value of the common stock purchased in any calendar year cannot exceed $25,000 per employee.
The purchase price is 95% of the closing market sales price on the market date immediately
preceding the last day of the offering period. Effective December 1, 2007, the Company discontinued
the plan for employees outside the U.S. and Canada. During fiscal 2010, 2009 and 2008, the Company
sold approximately 316,000, 405,000 and 477,000 shares, respectively, to eligible employees under
the plan.
Director Phantom Stock Plan
Effective April 1, 2002, the Board of Directors approved the 2002 Directors Phantom Stock Plan (the
“Phantom Plan”) for non-employee directors to provide increased incentive to make contributions to
the long term growth of the Company, to align the interests of directors with the interests of
shareholders, and to facilitate attracting and retaining directors of exceptional ability. The
Phantom Plan provided for issuance of rights to receive the value of a share of the Company’s
common stock in cash upon vesting which occurs upon the retirement of the director from the Board.
Phantom shares were granted automatically at the beginning of each fiscal year and at the
discretion of the Board.
In May 2005, the Board of Directors authorized non-employee directors to defer receipt of all or a
portion of their director’s fees via a deferred compensation plan. As an alternative to a cash
deferral, the plan allows non-employee directors to defer their cash compensation into deferred
compensation stock units, which are based upon the price of Compuware’s common stock.
Effective January 1, 2009, the Board of Directors approved the issuance of restricted share units
from the Company’s Long Term Incentive Plan to replace the phantom shares and the deferred
compensation stock units outstanding as of December 31, 2008, eliminating the need for liability
accounting treatment associated with the Phantom Plan and deferred compensation plan. The Company
recorded income of
87
Table of Contents
$304,000 and $114,000, respectively, in fiscal 2009 and 2008 related to the
phantom share program which was recorded to “Administrative and general” in the consolidated
statements of operations.
Employee Equity Incentive Plans
The Company’s Board of Directors adopted the 2007 Long Term Incentive Plan (the “LTIP”) in June
2007 that was approved by the Company’s shareholders in August 2007. The Company has reserved an
aggregate of 28.0 million common shares to be awarded under the LTIP. The Compensation Committee
may grant stock options, stock appreciation rights, restricted stock, restricted stock units,
performance-based cash or stock awards and annual cash incentive awards under the LTIP.
Prior to the LTIP, the Company had seven stock option plans (“Plans”) dating back to 1991. All but
one of the plans, the 2001 Broad Based Stock Option Plan (“BBSO”), were approved by the Company’s
shareholders. The BBSO was approved by the Board of Directors in March 2001, but was not submitted
to the shareholders for approval, as shareholder approval was not required at the time. As a result
of the LTIP adoption, these Plans have been terminated as to future grants.
Stock Options Activity
A summary of option activity under the Company’s stock-based compensation plans as of March 31,
2010, and changes during the year then ended is presented below (shares and intrinsic value in
thousands):
| Twelve Months Ended | ||||||||||||||||
| March 31, 2010 | ||||||||||||||||
| Weighted | ||||||||||||||||
| Weighted | Average | |||||||||||||||
| Average | Remaining | Aggregate | ||||||||||||||
| Number of | Exercise | Contractual | Intrinsic | |||||||||||||
| Options | Price | Term in Years | Value | |||||||||||||
Options outstanding as of April 1, 2009 |
34,245 | $ | 9.59 | |||||||||||||
Granted |
1,510 | 7.54 | ||||||||||||||
Exercised |
(812 | ) | 6.80 | $ | 799 | |||||||||||
Forfeited |
(323 | ) | 8.78 | |||||||||||||
Cancelled/expired |
(5,492 | ) | 15.96 | |||||||||||||
Options outstanding as of March 31, 2010 |
29,128 | $ | 8.37 | 4.39 | $ | 16,504 | ||||||||||
Options vested and expected to vest, net of
estimated forfeitures, as of March 31, 2010 |
27,856 | $ | 8.39 | 4.21 | $ | 15,522 | ||||||||||
Options exercisable as of March 31, 2010 |
18,999 | $ | 8.59 | 2.45 | $ | 9,029 | ||||||||||
The Company has historically granted options that vested 50% on the anniversary date of the
third year and 25% on the fourth and fifth year. Options granted during fiscal 2009 and fiscal 2010
primarily had the following two vesting schedules: (1) vested 30% on the anniversary date of the
first and second year and 40% on the third year or (2) vested 20% on each annual anniversary date
over five years.
All options were granted at fair market value and expire ten years from the date of grant.
The average fair value of option shares vested during fiscal 2010, 2009 and 2008 were $4.33, $3.90
and $5.11 per share, respectively, and the total intrinsic value of options exercised were
$799,000, $3.9 million and $16.7 million, respectively.
88
Table of Contents
Restricted Stock Units and Performance-Based Stock Awards Activity
A summary of non-vested restricted stock units and performance-based stock awards
(collectively “Non-vested RSU”) activity under the Company’s LTIP as of March 31, 2010, and
changes during the year then ended is presented below (shares and intrinsic value in
thousands):
| Twelve Months Ended | ||||||||
| March 31, 2010 | ||||||||
| Weighted | ||||||||
| Average | ||||||||
| Grant-Date | ||||||||
| Shares | Fair Value | |||||||
Non-vested RSU outstanding at April 1, 2009 |
950 | $ | 6.58 | |||||
Granted |
2,177 | 7.28 | ||||||
Vested |
— | — | ||||||
Forfeited |
— | — | ||||||
Non-vested RSU outstanding at March 31, 2010 |
3,127 | $ | 7.07 | |||||
During fiscal 2010, the Company issued 1.4 million performance-based stock awards (“PSAs”) under
the Company’s LTIP to various employees associated with our Covisint business. See “Covisint
Corporation 2009 Long-Term Incentive Plan” section within this footnote for more details.
The Company also issued 603,000 restricted stock units to certain employees as part of the fiscal
2010 executive bonus program that vest 25% on each annual anniversary date over four years and
issued 209,000 restricted stock units to the Board of Directors for their annual compensation award
that will 100% vest in August 2010.
The units are settled by the issuance of one common share for each unit upon vesting and vesting
accelerates upon death, disability or a change in control.
Covisint Corporation 2009 Long-Term Incentive Plan
In August 2009, Covisint Corporation (“Covisint”), a subsidiary of the Company, established a 2009
Long-Term Incentive Plan (“2009 Covisint LTIP”) allowing the Board of Directors of Covisint the
ability to grant stock options, stock appreciation rights, restricted stock, restricted stock
units, performance-based cash or restricted stock unit awards and annual cash incentive awards to
employees and directors of Covisint. The 2009 Covisint LTIP reserves 150,000 common shares of
Covisint for issuances under this plan.
Since the 2009 Covisint LTIP’s inception, Covisint has granted 109,000 stock options that expire on
August 25, 2019. These options will vest only if, prior to August 26, 2015, Covisint completes an
initial public offering (“IPO”) or if there is a change of control of Covisint.
The Company granted 1.4 million PSAs from the Company’s 2007 LTIP. These PSAs will vest if Covisint
does not complete an IPO or a change of control transaction by August 25, 2015 and the
Covisint business meets a pre-defined revenue target for four consecutive calendar quarters ending
prior to August 26, 2015.
As of March 31, 2010, the Company has not recorded compensation expense for the Covisint stock
options or the PSAs and these awards are not included in the Company’s diluted shares outstanding.
Compensation expense will be accounted for in the period it becomes probable that the underlying
conditions of the Covisint stock options or PSAs will be met and will be included in the diluted
shares outstanding balance in the period the underlying performance conditions are met.
89
Table of Contents
Stock Awards Compensation
For the years ended March 31, 2010, 2009 and 2008, stock awards compensation expense was allocated
as follows (dollars in thousands):
| Year Ended March 31, | ||||||||||||
| 2010 | 2009 | 2008 | ||||||||||
Stock awards compensation classified as: |
||||||||||||
Cost of software license fees |
$ | — | $ | 1 | $ | 1 | ||||||
Cost of maintenance fees |
402 | 846 | 303 | |||||||||
Cost of professional services |
1,035 | 2,380 | 1,320 | |||||||||
Technology development and support |
1,104 | 1,746 | 663 | |||||||||
Sales and marketing |
6,054 | 4,890 | 2,203 | |||||||||
Administrative and general |
7,872 | 4,798 | 1,705 | |||||||||
Restructuring Costs |
977 | 976 | 5,358 | |||||||||
Total stock awards compensation expense
before income taxes |
17,444 | 15,637 | 11,553 | |||||||||
As of March 31, 2010, total unrecognized compensation cost of $22.7 million, net of estimated
forfeitures, related to nonvested equity awards is expected to be recognized over a
weighted-average period of approximately 2.58 years.
90
Table of Contents
16. QUARTERLY FINANCIAL INFORMATION (UNAUDITED)
Quarterly financial information for the years ended March 31, 2010 and 2009 was as follows (in
thousands, except for per share data):
| Fiscal 2010 | ||||||||||||||||||||
| First | Second | Third | Fourth | |||||||||||||||||
| Quarter | Quarter | Quarter | Quarter | Year | ||||||||||||||||
Revenues |
$ | 214,388 | $ | 217,929 | $ | 229,864 | $ | 229,998 | $ | 892,179 | ||||||||||
Gross profit |
142,582 | 153,917 | 161,446 | 159,388 | 617,333 | |||||||||||||||
Operating income (1) |
77,683 | 41,433 | 36,130 | 28,153 | 183,399 | |||||||||||||||
Pre-tax income |
79,103 | 42,766 | 37,206 | 50,045 | 209,120 | |||||||||||||||
Net income |
51,047 | 27,986 | 24,412 | 37,361 | 140,806 | |||||||||||||||
Basic earnings per share |
0.21 | 0.12 | 0.11 | 0.17 | 0.61 | |||||||||||||||
Diluted earnings per share |
0.21 | 0.12 | 0.11 | 0.16 | 0.60 | |||||||||||||||
| Fiscal 2009 | ||||||||||||||||||||
| First | Second | Third | Fourth | |||||||||||||||||
| Quarter | Quarter | Quarter | Quarter | Year | ||||||||||||||||
Revenues |
$ | 298,588 | $ | 269,845 | $ | 268,667 | $ | 253,355 | $ | 1,090,455 | ||||||||||
Gross profit |
176,682 | 153,287 | 166,175 | 159,913 | 656,057 | |||||||||||||||
Operating income |
50,959 | 27,291 | 49,209 | 57,681 | 185,140 | |||||||||||||||
Pre-tax income |
54,180 | 30,337 | 51,500 | 76,704 | 212,721 | |||||||||||||||
Net income |
34,732 | 21,582 | 34,952 | 48,381 | 139,647 | |||||||||||||||
Basic earnings per share |
0.13 | 0.08 | 0.14 | 0.20 | 0.56 | |||||||||||||||
Diluted earnings per share |
0.13 | 0.08 | 0.14 | 0.20 | 0.55 | |||||||||||||||
| (1) | During the first quarter of fiscal 2010, the Company divested the Quality and DevPartner product lines resulting in a gain on divestiture of $52.4 million which was reported within operating expenses in the consolidated statements of operations. |
91
Table of Contents
ITEM 9. CHANGES IN AND DISAGREEMENTS WITH ACCOUNTANTS ON ACCOUNTING AND
FINANCIAL DISCLOSURE
None.
ITEM 9A. CONTROLS AND PROCEDURES
Evaluation of Disclosure Controls and Procedures
The Company maintains disclosure controls and procedures that are designed to ensure information
required to be disclosed in the Company’s reports that it files or submits under the Securities
Exchange Act of 1934 is recorded, processed, summarized, and reported within the time periods
specified in the SEC’s rules and forms, and that such information is accumulated and communicated
to the Company’s management, including its Chief Executive Officer and Chief Financial Officer, as
appropriate, to allow timely decisions regarding required financial disclosure. In designing and
evaluating the disclosure controls and procedures, management recognized that a control system, no
matter how well designed and operated, can provide only reasonable, not absolute, assurance that
the objectives of the control system are met. Because of the inherent limitations in all control
systems, no evaluation of controls can provide absolute assurance that all control issues and
instances of fraud, if any, with a company have been detected.
As of the end of the period covered by this report, the Company carried out an evaluation, under
the supervision and with the participation of the Company’s management, including its Chief
Executive Officer and Chief Financial Officer, of the effectiveness of the design and operation of
the Company’s disclosure controls and procedures pursuant to Rule 13a-15 of the Securities Exchange
Act of 1934 (the “Exchange Act”). Based upon that evaluation, the Company’s Chief Executive Officer
and Chief Financial Officer concluded that the Company’s disclosure controls and procedures are
effective, at the reasonable assurance level, to cause information required to be disclosed by the
Company in the reports that it files or submits under the Exchange Act to be recorded, processed,
summarized and reported within the time periods specified in the Commission’s rules and forms and
that such information is accumulated and communicated to the Company’s management, including its
Chief Executive Officer and Chief Financial Officer, to allow timely decisions regarding required
financial disclosure.
Management’s Report on Internal Control over Financial Reporting
The Company’s management is responsible for establishing and maintaining adequate internal control
over financial reporting as defined in Rules 13a-15(f) and 15d-15(f) under the Exchange Act.
Internal control over financial reporting is defined under applicable Securities and Exchange
Commission rules as a process designed under the supervision of the Company’s Chief Executive
Officer and Chief Financial Officer and effected by the Company’s Board of Directors, management
and other personnel to provide reasonable assurance regarding the reliability of financial
reporting and the preparation of the Company’s financial statements for external purposes in
accordance with U.S. generally accepted accounting principles. Internal control over financial
reporting includes those policies and procedures that:
| • | pertain to the maintenance of records that, in reasonable detail, accurately and fairly reflect the transactions and dispositions of the assets of the Company; |
| • | provide reasonable assurance that transactions are recorded as necessary to permit preparation of financial statements in accordance with U. S. generally accepted accounting principles, and that receipts and expenditures of the Company are being made only in accordance with authorizations of management and directors of the Company; and |
92
Table of Contents
| • | provide reasonable assurance regarding prevention or timely detection of unauthorized acquisition, use or disposition of the Company’s assets that could have a material effect on the financial statements. |
Because of its inherent limitations, internal control over financial reporting may not prevent or
detect misstatements. In addition, projections of any evaluation of effectiveness to future
periods are subject to the risk that controls may become ineffective because of changes in
conditions and that the degree of compliance with the policies or procedures may deteriorate.
As of March 31, 2010, management, with the participation of the Company’s Chief Executive Officer
and Chief Financial Officer, assessed the effectiveness of the Company’s internal control over
financial reporting based on the criteria for effective internal control over financial reporting
established in “Internal Control — Integrated Framework,” issued by the Committee of Sponsoring
Organizations (“COSO”) of the Treadway Commission. Based on the assessment, management determined
that the Company’s internal control over financial reporting was effective, as of March 31, 2010,
to provide reasonable assurance regarding the reliability of financial reporting and the
preparation of the Company’s financial statements for external purposes in accordance with U.S.
generally accepted accounting principles.
Deloitte & Touche LLP, the independent registered public accounting firm that audited the
consolidated financial statements of the Company included in this Annual Report on Form 10-K, has
issued an attestation report on the Company’s internal control over financial reporting as of March
31, 2010. The report, which expresses an unqualified opinion on the effectiveness of the Company’s
internal control over financial reporting as of March 31, 2010, is included in this Item under the
heading “Report of Independent Registered Public Accounting Firm.”
Changes in Internal Control Over Financial Reporting
No changes in the Company’s internal control over financial reporting occurred during the quarter
ended March 31, 2010 that have materially affected, or are reasonably likely to materially affect,
the Company’s internal control over financial reporting.
Report of Independent Registered Public Accounting Firm
To the Board of Directors and Shareholders of Compuware Corporation
Detroit, Michigan
Detroit, Michigan
We have audited the internal control over financial reporting of Compuware Corporation and
subsidiaries (the “Company”) as of March 31, 2010, based on criteria established in Internal
Control — Integrated Framework issued by the Committee of Sponsoring Organizations of the Treadway
Commission. The Company’s management is responsible for maintaining effective internal control over
financial reporting and for its assessment of the effectiveness of internal control over financial
reporting, included in the accompanying Management’s Report on Internal Control over Financial
Reporting. Our responsibility is to express an opinion on the Company’s internal control over
financial reporting based on our audit.
We conducted our audit in accordance with the standards of the Public Company Accounting Oversight
Board (United States). Those standards require that we plan and perform the audit to obtain
reasonable assurance about whether effective internal control over financial reporting was
maintained in all material respects. Our audit included obtaining an understanding of internal
control over financial reporting, assessing the risk that a material weakness exists, testing and
evaluating the design and operating effectiveness of internal control based on the assessed risk,
and performing such other procedures as we considered necessary in the circumstances. We believe
that our audit provides a reasonable basis for our opinion.
93
Table of Contents
A company’s internal control over financial reporting is a process designed by, or under the
supervision of, the company’s principal executive and principal financial officers, or persons
performing similar functions, and effected by the company’s board of directors, management, and
other personnel to provide reasonable assurance regarding the reliability of financial reporting
and the preparation of
financial statements for external purposes in accordance with generally accepted accounting
principles. A company’s internal control over financial reporting includes those policies and
procedures that (1) pertain to the maintenance of records that, in reasonable detail, accurately
and fairly reflect the transactions and dispositions of the assets of the company; (2) provide
reasonable assurance that transactions are recorded as necessary to permit preparation of financial
statements in accordance with generally accepted accounting principles, and that receipts and
expenditures of the company are being made only in accordance with authorizations of management and
directors of the company; and (3) provide reasonable assurance regarding prevention or timely
detection of unauthorized acquisition, use, or disposition of the company’s assets that could have
a material effect on the financial statements.
Because of the inherent limitations of internal control over financial reporting, including the
possibility of collusion or improper management override of controls, material misstatements due to
error or fraud may not be prevented or detected on a timely basis. Also, projections of any
evaluation of the effectiveness of the internal control over financial reporting to future periods
are subject to the risk that the controls may become inadequate because of changes in conditions,
or that the degree of compliance with the policies or procedures may deteriorate.
In our opinion, the Company maintained, in all material respects, effective internal control over
financial reporting as of March 31, 2010, based on the criteria established in Internal Control —
Integrated Framework issued by the Committee of Sponsoring Organizations of the Treadway
Commission.
We have also audited, in accordance with the standards of the Public Company Accounting Oversight
Board (United States), the consolidated financial statements as of and for the year ended March 31,
2010 of the Company and our report dated May 27, 2010 expressed an unqualified opinion on those
financial statements.
/s/ DELOITTE & TOUCHE LLP
Detroit, Michigan
May 27, 2010
May 27, 2010
ITEM 9B. OTHER INFORMATION
None
94
Table of Contents
PART III
ITEM 10. DIRECTORS, EXECUTIVE OFFICERS AND CORPORATE GOVERNANCE
The information required by this Item is contained in the Proxy Statement under the captions
“Corporate Governance” (excluding the Report of the Audit Committee), “Election of Directors” and
“Other Matters – Section 16(a) Beneficial Ownership Reporting Compliance” and is incorporated
herein by reference.
ITEM 11. EXECUTIVE COMPENSATION
The information required by this Item is contained in the Proxy Statement under the caption
“Compensation of Executive Officers” and “Corporate Governance – Compensation of Directors” and is
incorporated herein by reference.
ITEM 12. SECURITY OWNERSHIP OF CERTAIN BENEFICIAL OWNERS AND MANAGEMENT AND
RELATED STOCKHOLDER MATTERS
The information required by this Item is contained in the Proxy Statement under the caption
“Security Ownership of Management and Major Shareholders” and is incorporated herein by reference.
The Company’s Board of Directors adopted the 2007 Long Term Incentive Plan (“LTIP”) in June 2007
and the Company’s shareholders approved the LTIP in August 2007. The Compensation Committee may
grant stock options, stock appreciation rights, restricted stock, restricted stock units,
performance-based cash or stock awards and annual cash incentive awards under the LTIP. Prior to
the LTIP, the Company had seven stock option plans (“Prior Plans”) dating back to 1991. All but one
of the Prior Plans, the 2001 Broad Based Stock Option Plan (“BBSO”), were approved by the Company’s
shareholders. The BBSO was approved by the Board of Directors in March 2001, but was not submitted
to the shareholders for approval, as shareholder approval was not required at the time. Under the
terms of the BBSO, the Company was authorized to grant nonqualified stock options with a maximum
term of ten years to any employee or director of the Company at an exercise price and with vesting
and other terms determined by the Compensation Committee of the Company’s Board. Options granted
under the BBSO either vested every six months over a four year period or 50% of the option became
vested on the third year anniversary of the date of grant, and 25% of the option vested on each of
the fourth year and fifth year anniversaries of the date of grant. All options were granted at fair
market value and expired ten years from the date of grant.
As a result of the LTIP adoption, the Prior Plans have been terminated as to future grants.
The Company also has an Employee Stock Ownership Plan (“ESOP”) and an Employee Stock Purchase Plan
(“ESPP”). The information about our equity compensation plans in Note 15 of the notes to
consolidated financial statements, included in Item 8 of this report, is incorporated herein by
reference.
95
Table of Contents
The following table sets forth certain information with respect to our equity compensation plans at
March 31, 2010 (shares in thousands):
| Number of securities | ||||||||||||
| Number of securities | remaining available | |||||||||||
| to be issued | Weighted-average | for future issuance | ||||||||||
| upon exercise of | exercise price of | under equity | ||||||||||
| outstanding options | outstanding options | compensation plans | ||||||||||
Equity compensation plans
approved by security holders |
16,254 | $ | 8.00 | 13,857 | ||||||||
Equity compensation plans not
approved by security holders |
12,874 | $ | 8.85 | |||||||||
ITEM 13. CERTAIN RELATIONSHIPS AND RELATED TRANSACTIONS, AND DIRECTOR INDEPENDENCE
The information required by this Item is contained in the Proxy Statement under the caption “Other
Matters – Related Party Transactions,” “Corporate Governance – Board of Directors – Director
Independence” and Compensation of Executive Officers – Compensation Committee Interlocks and
Insider Participation” and is incorporated herein by reference.
ITEM 14. PRINCIPAL ACCOUNTANT FEES AND SERVICES
The information required by this Item is contained in the Proxy Statement under the caption
“Ratification of Appointment of the Independent Registered Public Accounting Firm” and is
incorporated herein by reference.
96
Table of Contents
PART IV
| ITEM 15. EXHIBITS AND FINANCIAL STATEMENT SCHEDULES |
(a) Documents filed as part of this report.
1. Consolidated Financial Statements
The following consolidated financial statements of the Company and its subsidiaries are
filed herewith:
2. Financial Statement Schedules
All financial statement schedules are omitted as the required information is not
applicable or the information is presented in the consolidated financial statements or
related notes.
3. EXHIBITS
The exhibits filed in response to Item 601 of Regulation S-K are listed in the
Exhibit Index attached to this report. The Exhibit Index is incorporated herein by
reference.
97
Table of Contents
SIGNATURES
Pursuant to the requirements of Sections 13 or 15(d) of the Securities Exchange Act of 1934,
the Registrant has duly caused this Annual Report on Form 10-K to be signed on its behalf by the
undersigned, thereunto duly authorized, in the City of Detroit, State of Michigan on May 27, 2010.
| COMPUWARE CORPORATION |
||||
| By: | /S/ PETER KARMANOS, JR. | |||
| Peter Karmanos, Jr. | ||||
| Chairman of the Board, Chief Executive Officer (Principal Executive Officer) |
||||
Pursuant to the requirements of the Securities Exchange Act of 1934, this report has been signed by
the following persons on behalf of the Registrant and in the capacities and on the dates indicated:
| Signature | Title | Date | ||
/S/ PETER KARMANOS, JR.
|
Chairman of the Board, Chief Executive Officer | May 27, 2010 | ||
Peter Karmanos, Jr.
|
And Director (Principal Executive Officer) | |||
/S/ LAURA L. FOURNIER
|
Executive Vice President, Chief Financial Officer | May 27, 2010 | ||
Laura L. Fournier
|
and Treasurer (Principal Financial Officer) | |||
/S/ ROBERT C. PAUL
|
Director, President and Chief Operating Officer | May 27, 2010 | ||
Robert C. Paul |
||||
/S/ DENNIS W. ARCHER
|
Director | May 27, 2010 | ||
Dennis W. Archer |
||||
/S/ GURMINDER S. BEDI
|
Director | May 27, 2010 | ||
Gurminder S. Bedi |
||||
/S/ WILLIAM O. GRABE
|
Director | May 27, 2010 | ||
William O. Grabe |
||||
/S/ WILLIAM R. HALLING
|
Director | May 27, 2010 | ||
William R. Halling |
||||
/S/ FAYE A. NELSON
|
Director | May 27, 2010 | ||
Faye A. Nelson |
||||
/S/ GLENDA D. PRICE
|
Director | May 27, 2010 | ||
Glenda D. Price |
||||
/S/ W. JAMES PROWSE
|
Director | May 27, 2010 | ||
W. James Prowse |
||||
/S/ G. SCOTT ROMNEY
|
Director | May 27, 2010 | ||
G. Scott Romney |
||||
/S/ RALPH J. SZYGENDA
|
Director | May 27, 2010 | ||
Ralph J. Szygenda |
98
Table of Contents
EXHIBITS
The following exhibits are filed herewith or incorporated by reference to the filing indicated
with which it was previously filed. Each management contract or compensatory plan or arrangement
filed as an exhibit to this report is identified below with an asterisk before the exhibit number.
The Company’s SEC file number is 000-20900.
| Exhibit | ||
| Number | Description of Document | |
2.6
|
Agreement and Plan of Merger dated May 6, 2005 by and among Compuware Corporation, Compuware Acquisition Corp., Adlex, Inc., and with respect to Article VIII, Tad Witkowicz, as Shareholder Representative (Company’s Form 8-K filed on May 9, 2005) | |
2.7
|
Stock Purchase Agreement by and among Compuware Corporation, Proxima Technology Group, Inc., and each of the shareholders of Proxima Technology Group, Inc. dated as of January 2, 2007 (Company’s Form 8-K filed on January 8, 2007) | |
2.8
|
Asset Purchase Agreement between Compuware Corporation and Micro Focus Holdings Limited, dated as of May 5, 2009 (Company’s Form 8-K filed on May 11, 2009) | |
2.9
|
Agreement and Plan of Merger by and among Compuware Corporation, Compuware Acquisition Corp., Gomez, Inc. and the Securityholder Committee named therein, dated as of October 6, 2009 (Company’s Form 8-K filed on October 8, 2009) | |
3.1
|
Restated Articles of Incorporation of Compuware Corporation, as amended, as of October 25, 2000 (Company’s Form 10-K for fiscal 2001 ) | |
3.2
|
Amendment to Bylaws of Compuware Corporation, as of November 6, 2008 (Company’s Form 8-K filed on November 25, 2008) | |
4.0
|
Rights Agreement dated as of October 25, 2000 between Compuware Corporation and Equiserve Trust Company, N.A., as Rights Agent (Company’s Registration Statement on Form 8-A filed October 26, 2000) | |
4.6
|
Amendment To Rights Agreement, dated as of October 29, 2001 (Company’s first Form 8-K filed on May 11, 2006) | |
4.7
|
Amendment No. 2 To Rights Agreement, dated as of May 9, 2006 (Company’s first Form 8-K filed on May 11, 2006) | |
4.8
|
Amended and Restated Credit Agreement dated May 2, 2003 as of July 27, 2006 (Company’s Form 10-Q for the quarterly period ended June 30, 2006) | |
4.9
|
Amendment No. 1, dated as of July 26, 2007, to the Amended and Restated Credit Agreement dated May 2, 2003 as of July 27, 2006 (Company’s Form 10-Q for the quarterly period ended on June 30, 2007) | |
4.10
|
Compuware Corporation Revolving Credit Agreement dated as of November 1, 2007 (Company’s Form 10-Q for the quarterly period ended on September 30, 2007) | |
4.11
|
Amendment No. 3 to Rights Agreement, dated as of February 2, 2009 (Company’s Form 8-K filed on February 3, 2009) | |
10.24
|
Promotion Agreement, dated September 8, 1992, between Compuware Sports Corporation and the Company (Company’s Registration Statement on Form S-1, as amended (Registration No. 33-53652)) | |
*10.37
|
Fiscal 1998 Stock Option Plan (Company’s Registration Statement on Form S-8 (Registration Statement No. 333-37873)) | |
*10.51
|
Fiscal 1996 Stock Option Plan (Company’s Form 10-K for fiscal 2000) | |
10.52
|
Advertising Agreement, dated December 1, 1996, between Arena Management Company and the Company (Company’s Form 10-K for fiscal 2000) | |
*10.83
|
Fiscal 1999 Stock Option Plan (Company’s Form 10-Q for the quarterly period ended December 31, 2000) | |
*10.85
|
2001 Broad Based Stock Option Plan (Company’s Registration Statement on Form S-8 (Registration Statement No. 333-57984)) | |
*10.88
|
First Amendment to 1996 Stock Option Plan (Company’s Quarterly Report on Form 10-Q for the quarterly period ended June 30, 1997) | |
*10.90
|
Phantom Stock Plan (Company’s Form 10-K for fiscal 2003) |
Table of Contents
| Exhibit | ||
| Number | Description of Document | |
*10.91
|
Nonqualified Stock Option Agreement for Executive Officers (Company’s Form 10-Q for the quarterly period ended September 30, 2004) | |
*10.92
|
Nonqualified Stock Option Agreement for Outside Directors (Company’s Form 10-Q for the quarterly period ended September 30, 2004) | |
*10.93
|
Phantom Share Award Agreement (Company’s Form 10-Q for the quarterly period ended September 30, 2004) | |
*10.95
|
Settlement Agreement dated March 21, 2005 by and among Compuware Corporation and International Business Machines Corporation (Company’s Form 8-K filed on March 21, 2005) | |
*10.96
|
First Amendment to the Compuware Corporation 2002 Directors Phantom Stock Plan (Company’s Form 8-K/A filed on May 17, 2005) | |
*10.97
|
Amendment Number 1 to Settlement Agreement dated November 29, 2005 by and among Compuware Corporation and International Business Machines Corporation (Company’s Form 8-K filed on November 29, 2005) | |
*10.98
|
2005 Non-Employee Directors’ Deferred Compensation Plan (Company’s second Form 8-K filed on May 11, 2006) | |
*10.99
|
Executive Incentive Plan – Corporate (Company’s Form 8-K filed on June 6, 2006) | |
*10.100
|
Parallel Nonqualified Stock Purchase Plan Arrangement (Company’s Form 10-K for fiscal 2006) | |
*10.101
|
Fifth Amendment to the Compuware Corporation ESOP/401(k) Plan (Company’s Form 10-Q for the quarterly period ended June 30, 2006) | |
*10.102
|
Post-Retirement Consulting Agreement, dated March 1, 2007, between Compuware Corporation and Peter Karmanos, Jr. (Company’s Form 8-K filed on March 2, 2007) | |
*10.105
|
2007 Long Term Incentive Plan (Appendix A to Company’s definitive proxy statement for 2007 annual shareholders meeting filed on July 24, 2007) | |
*10.106
|
Form of Stock Option Agreement (5-Year Version) (Company’s Form 8-K filed on April 25, 2008) | |
*10.107
|
Form of Stock Option Agreement (3-Year Version) (Company’s Form 8-K filed on April 25, 2008) | |
*10.109
|
Form of Compuware Executive Incentive Plan – Corporate as of April 30, 2008 (Company’s Form 10-Q for the quarterly period ended on June 30, 2008) | |
*10.110
|
Employee Restricted Stock Unit Award Agreement (Company’s Form 10-Q for the quarterly period ended on September 30, 2008) | |
*10.111
|
Amendment to the Consulting/Employment Letter with Peter Karmanos, Jr. (Company’s Form 10-Q for the quarterly period ended on December 31, 2008) | |
*10.112
|
W. James Prowse Consulting Agreement dated as of November 17, 2008 (Company’s Form 10-Q for the quarterly period ended on December 31, 2008) | |
*10.113
|
Amendment No. 1 to the 2007 Long Term Incentive Plan (Company’s Form 10-Q for the quarterly period ended on December 31, 2008) | |
*10.114
|
Amendment No. 2 to the 2002 Directors Phantom Stock Plan (Company’s Form 10-Q for the quarterly period ended on December 31, 2008) | |
*10.115
|
Amended and Restated 2005 Non-Employee Directors’ Compensation Plan (Company’s Form 10-Q for the quarterly period ended on December 31, 2008) | |
*10.116
|
Form of 2002 Directors Phantom Stock Plan Forfeiture And Replacement Agreement (Company’s Form 10-Q for the quarterly period ended on December 31, 2008) | |
*10.117
|
Form of Amended And Restated 2005 Non-Employee Directors Deferred Compensation Plan Forfeiture And Replacement Agreement (Company’s Form 10-Q for the quarterly period ended on December 31, 2008) | |
*10.118
|
Form of Director Restricted Stock Unit Grant Agreement (Replacing Directors’ Phantom Stock Units) (Company’s Form 10-Q for the quarterly period ended on December 31, 2008) | |
*10.119
|
Form of Director Restricted Stock Unit Grant Agreement (Replacing Deferred Compensation Units) (Company’s Form 10-Q for the quarterly period ended on December 31, 2008) | |
*10.120
|
Form of Director Annual Restricted Stock Unit Award Agreement (Company’s Form 10-Q for the quarterly period ended on December 31, 2008) | |
*10.121
|
Form of Director Restricted Stock Unit Agreement for Deferred Compensation (Company’s Form 10-Q for the quarterly period ended on December 31, 2008) | |
*10.122
|
Executive Incentive Plan – Corporate, as of June 10, 2009 (Company’s Form 8-K filed on June 12, 2009) | |
Table of Contents
| Exhibit | ||
| Number | Description of Document | |
*10.123
|
Form of Restricted Stock Unit Award Agreement, as of June 10, 2009 (Company’s Form 8-K filed on June 12, 2009) | |
*10.124
|
Form of Performance Unit Award Agreement for Peter Karmanos and Laura Fournier (Revenue Condition) dated December 7, 2009 (Company’s Form 10-Q for the quarterly period ended on December 31, 2009) | |
*10.125
|
Performance Unit Award Agreement for Peter Karmanos (Revenue Condition, subject to Section 162(m)) dated December 7, 2009 (Company’s Form 10-Q for the quarterly period ended on December 31, 2009) | |
*10.126
|
Form of Performance Unit Award Agreement for Peter Karmanos and Laura Fournier (IPO Condition) dated December 7, 2009 (Company’s Form 10-Q for the quarterly period ended on December 31, 2009) | |
*10.127
|
Performance Unit Award Agreement for Robert Paul dated December 7, 2009 (Company’s Form 10-Q for the quarterly period ended on December 31, 2009) | |
*10.128
|
2009 Covisint Corporation Long Term Incentive Plan (Company’s Form 10-Q for the quarterly period ended on December 31, 2009) | |
*10.129
|
Form of Covisint Option Agreement (Company’s Form 10-Q for the quarterly period ended on December 31, 2009) | |
21.1
|
Subsidiaries of the Registrant | |
23.1
|
Consent of Independent Registered Public Accounting Firm | |
31.1
|
Certification of Chief Executive Officer, Pursuant to Section 302 of the Sarbanes-Oxley Act of 2002 | |
31.2
|
Certification of Chief Financial Officer, Pursuant to Section 302 of the Sarbanes-Oxley Act of 2002 | |
32
|
Certification Pursuant to 18 U.S.C. Section 1350, as adopted Pursuant to Section 906 of the Sarbanes-Oxley Act of 2002 |