Attached files
| file | filename |
|---|---|
| 10-K - 10-K MARCH 31, 2010 - Seneca Foods Corp | a10k033110.htm |
| EX-10.3 - FIRST AMENDMENT TO REVOLVER - Seneca Foods Corp | ex103033110.htm |
| EX-10.4 - SECOND AMENDMENT TO REVOLVER - Seneca Foods Corp | ex104033110.htm |
| EX-32 - CERTIFICATION SECTION 1350 - Seneca Foods Corp | ex3210k033110.htm |
| EX-21 - LIST OF SUBSIDIARIES - Seneca Foods Corp | ex2110k033110.htm |
| EX-23 - BDO CONSENT - Seneca Foods Corp | ex2310k033110.htm |
| EX-24 - POWERS OF ATTORNEY - Seneca Foods Corp | ex2410k033110.htm |
| EX-31.1 - CERTIFICATION CEO - Seneca Foods Corp | ex31110k033110.htm |
| EX-31.2 - CERTIFICATION CFO - Seneca Foods Corp | ex31210k033110.htm |
| EX-10.5 - THIRD AMENDMENT TO REVOLVER - Seneca Foods Corp | ex105033110.htm |
Five Year Selected Financial Data
Summary of Operations and Financial Condition
(In thousands of dollars, except per share data and ratios)
|
Years ended March 31,
|
2010
|
2009
|
2008
|
2007(a)
|
2006
|
|||||||||||||||
|
Net sales
|
$ | 1,280,110 | $ | 1,280,684 | $ | 1,080,724 | $ | 1,024,853 | $ | 883,823 | ||||||||||
|
Operating income before interest (b)
|
$ | 84,998 | $ | 48,188 | $ | 32,853 | $ | 65,878 | $ | 51,242 | ||||||||||
|
Interest expense, net
|
9,638 | 14,103 | 18,143 | 20,936 | 15,784 | |||||||||||||||
|
Net earnings (b)
|
48,411 | 18,765 | 8,019 | 32,067 | 21,993 | |||||||||||||||
|
Basic earnings per common share (b)
|
$ | 3.98 | $ | 1.54 | $ | 0.66 | $ | 2.65 | $ | 1.97 | ||||||||||
|
Diluted earnings per common share (b)
|
3.96 | 1.53 | 0.65 | 2.63 | 1.96 | |||||||||||||||
|
Working capital
|
$ | 404,610 | $ | 332,082 | $ | 370,102 | $ | 334,455 | $ | 229,510 | ||||||||||
|
Inventories
|
446,464 | 392,955 | 395,686 | 380,487 | 318,770 | |||||||||||||||
|
Goodwill
|
— | — | — | — | — | |||||||||||||||
|
Net property, plant, and equipment
|
178,113 | 179,245 | 183,051 | 172,235 | 148,501 | |||||||||||||||
|
Total assets
|
719,333 | 675,605 | 672,020 | 626,715 | 535,144 | |||||||||||||||
|
Long-term debt and capital lease obligations, less current portion
|
207,924 | 191,853 | 250,039 | 210,395 | 142,586 | |||||||||||||||
|
Stockholders’ equity
|
335,010 | 282,425 | 279,430 | 273,571 | 217,779 | |||||||||||||||
|
Additions to property, plant, and equipment
|
$ | 20,783 | $ | 23,198 | $ | 32,853 | $ | 21,627 | $ | 11,906 | ||||||||||
|
Net earnings/average equity
|
15.7 | % | 6.7 | % | 2.9 | % | 13.1 | % | 10.6 | % | ||||||||||
|
Earnings before taxes/sales
|
5.9 | % | 2.7 | % | 1.4 | % | 4.4 | % | 4.0 | % | ||||||||||
|
Net earnings/sales
|
3.8 | % | 1.5 | % | 0.7 | % | 3.1 | % | 2.5 | % | ||||||||||
|
Long-term debt/equity (c)
|
62.1 | % | 67.9 | % | 89.5 | % | 76.9 | % | 65.5 | % | ||||||||||
|
Total debt/equity ratio
|
1.2:1
|
1.4:1
|
1.4:1
|
1.3:1
|
1.5:1
|
|||||||||||||||
|
Current ratio
|
4.0:1
|
3.1:1
|
4.2:1
|
3.9:1
|
2.5:1
|
|||||||||||||||
|
Total stockholders’ equity per equivalent share (d)
|
$ | 27.43 | $ | 23.13 | $ | 22.86 | $ | 22.39 | $ | 19.46 | ||||||||||
|
Stockholders’ equity per common share
|
28.37 | 28.10 | 27.66 | 26.93 | 23.89 | |||||||||||||||
|
Class A Global Market System closing price range
|
33.49-21.44 | 23.95-15.51 | 30.40-19.25 | 30.84-19.67 | 21.00-15.51 | |||||||||||||||
|
Class B Global Market System closing price range
|
33.17-20.86 | 24.00-16.61 | 30.96-20.50 | 32.25-20.00 | 20.77-16.00 | |||||||||||||||
|
Common cash dividends declared per share
|
— | — | — | — | — | |||||||||||||||
|
Price earnings ratio
|
7.4 | 13.5 | 32.0 | 10.3 | 10.1 | |||||||||||||||
|
(a)
|
The fiscal 2007 financial results include eight months of operating activity related to the Signature Fruit acquisition.
|
|
|
(b)
|
The effect of using the LIFO inventory valuation method in fiscal 2010 was to reduce operating earnings by $11.2 million and net earnings by $7.3 million or $0.61 per share ($0.60 diluted). The effect of using the LIFO inventory valuation method in fiscal 2009 was to reduce operating earnings by $58.3 million and net earnings by $37.9 million or $3.12 per share ($3.09 diluted). The effect of using the LIFO inventory valuation method in 2008 was to reduce operating earnings by $28.2 million and net earnings by $18.3 million or $1.50 per share ($1.49 diluted).
|
|
|
(c)
|
The long-term debt to equity percentage for fiscal 2010, 2009, 2008 and 2007 includes the Revolving Credit Facility as discussed in Note 3, Long-Term Debt. For fiscal 2006, the Revolving Credit Facility was included in current liabilities. If calculated on a comparable basis to fiscal 2010, 2009, 2008 and 2007, the 2006 percentage would be 91.7%.
|
|
|
(d)
|
Equivalent common shares are either common shares or, for convertible preferred shares, the number of common shares that the preferred shares are convertible into. See Note 6 of the Notes to Consolidated Financial Statements for conversion details.
|
1
Management’s Discussion and Analysis of Financial Condition and Results of Operations
OVERVIEW
Our Business
Seneca Foods believes it is one of the world’s leading producers and distributors of canned vegetables. Canned vegetables are sold nationwide in all channels serving retail markets and to certain export markets, the food service industry, and other food processors including General Mills Operation, LLC (GMOL) under an Alliance Agreement. During 2010, canned vegetables represented 71% of the Company’s sales. The Company maintains a number one share in the private label, food service and export canned vegetable markets and a number three position in the branded canned vegetable market. In addition, the Company is the supplier of frozen vegetable products, principally to GMOL and the food service industry, and fruit and snack chip products, principally serving retail markets and other food processors.
On September 28, 2009, the Company, GMOL and General Mills, Inc. entered into a Second Amended and Restated Alliance Agreement (the “Alliance Agreement”) pursuant to which certain provisions were modified to (i) amend numerous definitions to reflect current practices and various changes in the administrative and working capital costs included in the calculation of fees payable to the Company under the Alliance Agreement (resulting in a net increase of such components of the calculation); (ii) provide that the tolling fee per standard case paid to the Company shall be modified each year using an index to account for inflation factors, but in no event less than a base tolling fee; (iii) clarify risk allocation for losses related to damage claims not covered by insurance; (iv) require release of GMOL’s lien on certain core plants used by the Company to perform the Services upon the Company’s final note payment to GMOL on September 30, 2009; (v) provide that the remaining depreciation and lease costs related to certain closed plants reduce the final note payment on September 30, 2009; and (vi) reduce the termination fee and extend the length of the advance notice time period required to terminate the Alliance Agreement without cause.
On July 21, 2009, certain shareholders of the Company closed on the sale of 3,756,332 shares of Class A Common Stock (including the shares sold pursuant to the underwriters’ overallotment option) pursuant to an Underwriting Agreement among the Company, the selling shareholders, Merrill Lynch Pierce Fenner & Smith Inc. and Piper Jaffray & Co. The Company received none of the proceeds of the offering. During the second quarter of 2010, 2,607,156 shares, or $31,104,000, of Convertible Participating Preferred Stock and 556,088 shares, or $139,000, of Class B Common Stock (at par), were converted to Class A Common Stock in connection with this secondary stock offering.
During 2007, the Company acquired Signature Fruit Company, LLC (“Signature”), located in Modesto, California, which is a large producer of canned fruits. With this acquisition, the Company has become a leading producer and distributor of canned fruits. Canned fruit products are sold nationwide in a variety of markets. In 2010, canned fruits represented 16% of the Company’s sales. The Company believes it maintains a number one position in the food service and export markets, a number two position in the private label market, and a number three position in the branded canned fruit market.
The Company’s business strategies are designed to grow the Company’s market share and enhance the Company’s sales and margins and include: 1) expand the Company’s leadership in the processed fruit and vegetable industry; 2) provide low cost, high quality processed fruits and vegetables to consumers through the elimination of costs from the Company’s supply chain and investment in state-of-the-art production and logistical technology; 3) focus on growth opportunities to capitalize on higher expected returns; and 4) pursue strategic acquisitions that leverage the Company’s core competencies.
All references to years are fiscal years unless otherwise indicated.
Restructuring
During 2010, there were no material adjustments to Plant Restructuring.
During the third quarter of 2009, the Company announced a Voluntary Workforce Reduction Program at its plant in Modesto, California that resulted in a restructuring charge for severance costs of $904,000. This program, which resulted in a more efficient operation, was completed in January 2009.
In March 2008, the Company contributed its Coleman, Wisconsin plant to a not-for-profit corporation specializing in real estate and recorded a non-cash impairment charge of $445,000. This plant had been idled in 2005.
In 2006, the Company announced the phase out of the Salem labeling operation which resulted in a restructuring charge of $1,754,000 consisting of a provision for future lease payments of $1,306,000, a cash severance charge of $369,000, and a non-cash impairment charge of $79,000. In 2007, the Company recorded an additional restructuring charge of $657,000 consisting of a provision for future lease payments of $420,000, a cash severance charge of $151,000, a cash union pension charge of $69,000 and a non-cash impairment charge of $17,000. The lease on the Salem warehouse expired in February 2008. During 2008, the non-cash impairment charge was increased by $52,000 related to this Salem warehouse. The other costs relate to outstanding lease payments which will be paid over the remaining lives of the corresponding lease terms, which are up to five years.
Divestitures and Other Charges
During 2010 and 2008, there were no material divestures or other charges.
During 2009, the Company took a non-cash charge of $714,000 related to some excess equipment at our Yakima, Washington processing plant which is included in Other Operating Expense
2
Management’s Discussion and Analysis of Financial Condition and Results of Operations
(Income) in the Consolidated Statements of Net Earnings.
Liquidity and Capital Resources
The Company’s primary cash requirements are to make payments on the Company’s debt, finance seasonal working capital needs and to make capital expenditures. Internally generated funds and amounts under the revolving credit facility are the Company’s primary sources of liquidity, although the Company believes it has the ability to raise additional capital by issuing additional stock, if it desires.
Revolving Credit Facility
On August 18, 2006, in connection with the Signature acquisition, the Company entered into a $250.0 million five-year floating rate secured revolving credit facility (the “Revolver”) with several lenders, under which $99.3 million was initially borrowed to pay off the prior revolver balance. As of March 31, 2010, the outstanding balance on the Revolver was $111.1 million and letters of credit supported by the Revolver totaled $7.7 million, leaving $131.2 million available. In order to maintain availability of funds under the facility, the Company pays a commitment fee on the unused portion of the Revolver. The Revolver is secured by the Company’s accounts receivable and inventory and contains financial covenants and borrowing base requirements. The Revolver is used to fund capital expenditures, acquisitions, the Company’s seasonal working capital needs, which are affected by the growing cycles of the vegetables and fruits the Company processes, and to pay debt principal and interest obligations. The vast majority of fruit and vegetable inventories are produced during the harvesting and packing months of June through November and are then sold over the following year. Payment terms for raw fruit and vegetables are generally three months but can vary from a few days to seven months. Accordingly, the Company’s need to draw on the Revolver may fluctuate significantly throughout the year. The maturity date of the Revolver is August 18, 2011.
The Company believes that cash flows from operations and availability under its Revolver will provide adequate funds for the Company’s working capital needs, planned capital expenditures and debt service obligations for at least the next 12 months.
Seasonality
The Company’s revenues typically are higher in the second and third fiscal quarters. This is due, in part, because the Company sells, on a bill and hold basis, Green Giant canned and frozen vegetables to GMOL at the end of each pack cycle, which typically occurs during these quarters. GMOL buys the product from the Company at cost plus an equivalent case tolling fee. See the Critical Accounting Policies section for further details. The Company’s non-Green Giant sales also exhibit seasonality with the third fiscal quarter generating the highest sales due to increased retail sales during the holiday season.
The seasonality of the Company’s business is illustrated by the following table:
|
First
|
Second
|
Third
|
Fourth
|
|||||||||||||
|
(In thousands)
|
||||||||||||||||
|
Year ended March 31, 2010:
|
||||||||||||||||
|
Net sales
|
$
|
230,528
|
$
|
323,205
|
$
|
447,027
|
$
|
279,350
|
||||||||
|
Gross margin
|
35,937
|
38,498
|
48,396
|
27,456
|
||||||||||||
|
Net earnings
|
11,086
|
12,425
|
18,606
|
6,294
|
||||||||||||
|
Inventories
|
415,755
|
728,120
|
544,694
|
446,464
|
||||||||||||
|
Revolver outstanding
|
68,614
|
140,384
|
195,300
|
111,062
|
||||||||||||
|
Year ended March 31, 2009:
|
||||||||||||||||
|
Net sales
|
$
|
216,713
|
$
|
315,418
|
$
|
463,322
|
$
|
285,231
|
||||||||
|
Gross margin
|
15,862
|
28,804
|
49,010
|
25,871
|
||||||||||||
|
Net (loss) earnings
|
(2,077
|
)
|
4,365
|
13,836
|
2,641
|
|||||||||||
|
Inventories
|
373,657
|
648,474
|
488,283
|
392,955
|
||||||||||||
|
Revolver outstanding
|
63,245
|
130,000
|
167,996
|
87,384
|
||||||||||||
Long-Term Debt
The Company has a $52.9 million secured note payable to John Hancock Life Insurance Company, with an 8.03% interest rate, that is payable in installments through 2014, In addition, the Company has two mortgages, totaling $26.3 million, and several industrial revenue bonds, totaling $23.5 million. The Company early-retired debt totaling $1.7 million in May 2009 related to utility company financed energy savings projects. A secured subordinated promissory note to GMOL matured in 2010 and the $32.1 million balance was paid, when due, on September 30, 2009, using funds from the Revolver. Footnote 3, Long-Term Debt, contains details regarding the Company’s long-term debt. As discussed in that Footnote, the Company classifies its Revolver balance as long-term debt. The Company did not issue any significant long-term debt in 2010 or 2009 other than drawings under the Revolver.
As of March 31, 2010, scheduled maturities of long-term debt in each of the five succeeding fiscal years and thereafter are presented below. The March 31, 2010 Revolver balance of $111.1 million is presented as being due in fiscal 2012, based upon the Revolver’s August 18, 2011 maturity date.
|
2011
|
$
|
6,356
|
||
|
2012
|
117,858
|
|||
|
2013
|
12,396
|
|||
|
2014
|
40,304
|
|||
|
2015
|
2,320
|
|||
|
Thereafter
|
35,046
|
|||
|
Total
|
$
|
214,280
|
||
Restrictive Covenants
The Company’s debt agreements, including the Revolver, contain covenants that restrict the Company’s ability to incur additional indebtedness, pay dividends on and redeem the Company’s capital stock, make other restricted payments, including investments, sell the Company’s assets, incur liens, transfer all or substantially all
3
Management’s Discussion and Analysis of Financial Condition and Results of Operations
of the Company’s assets and enter into consolidations or mergers. The Company’s debt agreements also require it to meet certain financial covenants, including EBITDA (Earnings Before Interest, Taxes, Depreciation and Amortization), minimum fixed charge coverage, minimum interest coverage and maximum total debt ratios. The Revolver also contains borrowing base requirements related to accounts receivable and inventory. These financial requirements and ratios generally become more restrictive over time and are subject to allowances for seasonal fluctuations. The most restrictive financial covenant in the debt agreements is the adjusted debt to total capitalization ratio. In connection with the Company’s decision to adopt the last-in, first-out (“LIFO”) method of inventory accounting, effective December 30, 2007, the Company executed amendments to its debt agreements, which enable the Company to compute its financial covenants as if the Company were on the first-in, first-out (“FIFO”) method of inventory accounting. The Company was in compliance with all such financial covenants as of March 31, 2010.
Capital Expenditures
Capital expenditures in 2010 totaled $20.8 million and included $2.0 million for a coater oven for a can line in Baraboo, Wisconsin, $2.0 million towards the partial completion of a warehouse project in Princeville, Illinois, $1.2 million for a bean expansion project in Ripon, Wisconsin, equipment replacements and other improvements, and cost saving projects. Capital expenditures in 2009 totaled $23.2 million and included a $1.8 million frozen warehouse expansion in Rochester, Minnesota, a $1.5 million fruit cup project in Modesto, California, equipment replacements and other improvements, and cost saving projects. Capital expenditures in 2008 totaled $32.9 million and included $8.6 million in construction and equipment costs related to a heat processing system in Clyman, Wisconsin, $4.7 million of construction costs related to a warehouse project in Gillett, Wisconsin, $3.2 million for software and hardware costs related to implementing a SAP Enterprise Resource Planning System, together with equipment replacements and other improvements, and cost saving projects.
Accounts Receivable
In 2010, accounts receivable decreased by $3.3 million or 4.4% versus 2009, due to lower USDA sales in the current year than the prior year, which have longer collection terms. In 2009, accounts receivable increased by $14.7 million primarily reflecting the effect of increased per unit selling prices and increased sales volume, together resulting in an 18.5% sales increase over 2008.
Inventories
In 2010, inventories increased by $53.5 million primarily reflecting a $68.4 million increase in finished goods due to the large 2010 pack and decreased unit sales volume, partially offset by the effect of lower work in process quantities. The LIFO reserve balance was $97.7 million versus $86.5 million last year.
In 2009, inventories decreased by $2.7 million primarily reflecting the effect of lower finished goods, partially offset by the effect of higher steel raw material quantities and higher work in process quantities. The LIFO reserve balance was $86.5 million versus $28.2 million in the prior year.
Effective December 30, 2007 (4th quarter), the Company decided to change its inventory valuation method from the lower of cost; determined under the FIFO method; or market, to the lower of cost; determined under the LIFO method; or market. The Company believes that the use of the LIFO method better matches current costs with current revenues. For this type of accounting change, there is no cumulative effect adjustment as of the beginning of the year.
Critical Accounting Policies
During the year ended March 31, 2010, the Company sold for cash, on a bill and hold basis, $213.3 million of Green Giant finished goods inventory to GMOL. As of March 31, 2010, $134.3 million of this product remained unshipped. At the time of the sale of the Green Giant vegetables to GMOL, title of the specified inventory transferred to GMOL. The Company believes it has met the criteria required by the accounting standards for bill and hold treatment.
Trade promotions are an important component of the sales and marketing of the Company’s branded products and are critical to the support of the business. Trade promotion costs, which are recorded as a reduction of net sales, include amounts paid to encourage retailers to offer temporary price reductions for the sale of the Company’s products to consumers, amounts paid to obtain favorable display positions in retail stores, and amounts paid to retailers for shelf space in retail stores. Accruals for trade promotions are recorded primarily at the time of sale of product to the retailer based on expected levels of performance. Settlement of these liabilities typically occurs in subsequent periods primarily through an authorized process for deductions taken by a retailer from amounts otherwise due to the Company. As a result, the ultimate cost of a trade promotion program is dependent on the relative success of the events and the actions and level of deductions taken by retailers for amounts they consider due to them. Final determination of the permissible deductions may take extended periods of time.
The Company assesses its long-lived assets for impairment whenever there is an indicator of impairment. Property, plant, and equipment are depreciated over their assigned lives. The assigned lives and the projected cash flows used to test impairment are subjective. If actual lives are shorter than anticipated or if future cash flows are less than anticipated, a future impairment charge or a loss on disposal of the assets could be incurred. Impairment losses are evaluated if the estimated undiscounted value of the cash flows is less than the carrying value. If such is the case, a loss is recognized when the carrying value of an asset exceeds its fair value.
4
Management’s Discussion and Analysis of Financial Condition and Results of Operations
Obligations and Commitments
As of March 31, 2010, the Company was obligated to make cash payments in connection with the Company’s debt and operating leases. The effect of these obligations and commitments on the Company’s liquidity and cash flows in future periods are listed below. All of these arrangements require cash payments over varying periods of time. Certain of these arrangements are cancelable on short notice and others require additional payments as part of any early termination.
|
Contractual Obligations
|
||||||||||||||||||||
|
March 31, 2010
|
||||||||||||||||||||
|
2016
|
||||||||||||||||||||
|
2011
|
2012-13
|
2014-15
|
and beyond
|
Total
|
||||||||||||||||
|
(In thousands)
|
||||||||||||||||||||
|
Long-term debt
|
$
|
6,356
|
$
|
130,254
|
$
|
42,624
|
$
|
35,046
|
$
|
214,280
|
||||||||||
|
Interest
|
8,227
|
12,014
|
5,065
|
8,785
|
34,091
|
|||||||||||||||
|
Operating lease obligations
|
28,277
|
44,486
|
26,953
|
24,888
|
124,604
|
|||||||||||||||
|
Purchase commitments
|
198,174
|
—
|
—
|
—
|
198,174
|
|||||||||||||||
|
Total
|
$
|
241,034
|
$
|
186,754
|
$
|
74,642
|
$
|
68,719
|
$
|
571,149
|
||||||||||
In addition, the Company’s defined benefit plan has an unfunded pension liability of $15.2 million which is subject to certain actuarial assumptions. The pension liability decreased by $19.0 million during 2010 reflecting the current unfunded liability based on the projected benefit obligation and actual fair value of plan assets as of March 31, 2010, net of a $21.0 million contribution to the Plan during 2010. This decrease was recognized via an increase to accumulated other comprehensive income of $4.0 million after the income tax benefit of $2.6 million. Plan assets increased from $49.9 million as of March 31, 2009 to $94.4 million as of March 31, 2010 due to the recovery from extremely difficult market conditions during the previous year and the Company’s contribution during the year.
During 2010, the Company entered into new operating leases of approximately $36.4 million, based on the if-purchased value, including $20.1 million of agricultural and processing equipment and $13.5 million of can manufacturing equipment.
Due to uncertainties related to FASB Accounting Standards Codification (“ASC”) 740, Income Taxes, the Company is not able to reasonably estimate the cash settlements required in future periods.
Purchase commitments represent estimated payments to growers for crops that will be grown during the calendar 2010 season.
The Company has no material off-balance sheet debt or other unrecorded obligations other than the items noted above.
Standby Letters of Credit
The Company has standby letters of credit for certain insurance-related requirements. The majority of the Company’s standby letters of credit are automatically renewed annually, unless the issuer gives cancellation notice in advance. On March 31, 2010, the Company had $7.7 million in outstanding standby letters of credit. These standby letters of credit are supported by the Company’s Revolver and reduce borrowings available under the Revolver.
Cash Flows
In 2010, the Company’s cash and cash equivalents increased by $1.6 million, which is due to the net impact of $38.1 million provided by operating activities, $20.6 million used in investing activities, and $15.9 million used in financing activities.
Operating Activities
Cash from operating activities decreased to $38.1 million provided by operations in 2010 from $47.3 million provided by operations in 2009. The decrease is primarily attributable to increased inventory in 2010 versus 2009 partially offset by increased net earnings exclusive of LIFO. The 2010 LIFO charge of $11.2 million provided a tax cash benefit of $3.9 million.
Cash provided by operating activities increased to $47.3 million provided by operating activities in 2009 from $6.2 million used in operating activities in 2008. The increase is primarily a function of higher operating earnings in 2009, lower inventory buildup in 2009 versus 2008 and lower income tax payments in 2009 than 2008. The 2009 LIFO charge of $58.3 million provided a tax cash benefit of $20.4 million.
The cash requirements of the business fluctuate significantly throughout the year to coincide with the seasonal growing cycles of vegetables and fruits. The majority of the inventories are produced during the packing months, from June through November, and are then sold over the following year. Cash flow from operating activities is one of the Company’s main sources of liquidity.
Investing Activities
Cash used in investing activities was $20.6 million for 2010, principally reflecting capital expenditures. Capital expenditures aggregated $20.8 million in 2010 versus $23.2 million in 2009. The decrease was primarily attributable to fewer large projects in 2010 and an increase in leased projects. There were three major projects in 2010; 1) a $2.0 million coater oven for a can line in Baraboo, Wisconsin; 2) $2.0 million towards the partial completion of a warehouse project in Princeville, Illinois and 3) a $1.2 million bean expansion project in Ripon, Wisconsin.
Cash used in investing activities was $22.6 million for 2009,
5
Management’s Discussion and Analysis of Financial Condition and Results of Operations
principally reflecting capital expenditures. Capital expenditures aggregated $23.2 million in 2009 versus $32.9 million in 2008. The decrease was primarily attributable to fewer large projects in 2009 and an increase in leased projects. There were two major projects in 2009; 1) a $1.8 million frozen warehouse expansion in Rochester, Minnesota and 2) a $1.5 million fruit cup project in Modesto, California.
Financing Activities
Cash used by financing activities was $15.9 million in 2010. During 2010, the Company repaid more borrowings than it used to fund the GMOL subordinated promissory note repayment of $32.1 million.
Cash used by financing activities was $29.2 million in 2009 principally consisting of the repayment of Revolver borrowings.
RESULTS OF OPERATIONS
|
Classes of similar
|
||||||||||||
|
products/services:
|
2010
|
2009
|
2008
|
|||||||||
|
(In thousands)
|
||||||||||||
|
Net Sales:
|
||||||||||||
|
GMOL*
|
$
|
239,622
|
$
|
231,712
|
$
|
201,676
|
||||||
|
Canned vegetables
|
750,751
|
732,146
|
616,636
|
|||||||||
|
Frozen vegetables*
|
48,320
|
44,967
|
39,880
|
|||||||||
|
Fruit
|
200,391
|
233,897
|
193,768
|
|||||||||
|
Snack
|
21,287
|
15,498
|
14,996
|
|||||||||
|
Other
|
19,739
|
22,464
|
13,768
|
|||||||||
|
Total
|
$
|
1,280,110
|
$
|
1,280,684
|
$
|
1,080,724
|
||||||
|
*
|
GMOL includes frozen vegetable sales exclusively for GMOL.
|
Fiscal 2010 versus Fiscal 2009
Net sales for 2010 decreased $0.6 million, from $1,280.7 million to $1,280.1 million. The decrease primarily reflects a $33.5 million decrease in fruit sales, partially offset by a $18.6 million increase in canned vegetable sales and a $7.9 million increase in GMOL sales. The reduction in sales is predominately due to decreased sales to the U.S. Department of Agriculture. The decrease in sales is attributable to a sales volume reduction of $36.2 million partially offset by increased selling prices/improved sales mix of $35.6 million. The sales volume reduction is primarily due to $22.8 million decrease in canned fruit sales and a $17.6 million decrease in canned vegetable sales.
Cost of product sold as a percentage of sales decreased from 90.6% in 2009 to 88.3% in 2010 primarily as a result of higher selling prices and a $47.1 million LIFO charge decrease in 2010 versus 2009.
Selling, general and administrative expense decreased from 5.5% of sales in 2009 to 5.1% of sales in 2010 due to lower brokerage rates on certain sales.
Plant restructuring costs, which are described in detail in the Restructuring section of Management’s Discussion and Analysis of Financial Condition and Results of Operations, decreased from $0.9 million in 2009 to zero in 2010.
Interest expense, net, decreased from $14.1 million in 2009 to $9.6 million in 2010 primarily reflecting lower average borrowing rates on long-term and short-term variable rate debt and lower overall debt balances in the current year than the prior year.
Other operating expense, net, of $0.2 million in 2010 primarily reflects a net loss on the sale of some unused fixed assets. Other operating expense, net, of $0.6 million in 2009 primarily reflects the effect of a non-cash loss of $0.7 million on the disposal of property, plant and equipment partially offset by a gain of $0.1 million on the disposal of property, plant and equipment.
As a result of the aforementioned factors, pre-tax earnings increased from $34.1 million in 2009 to $75.4 million in 2010. The effective tax rate was 35.8% in 2010 and 44.9% in 2009. The decrease in the 2010 effective tax rate is primarily due to an addition to uncertain tax positions in 2009, a charge related to research and development credit in 2009 and the settlement of an IRS audit during 2009.
Fiscal 2009 versus Fiscal 2008
Net sales for 2009 increased $200.0 million, or 18.5%, from $1,080.7 million to $1,280.7 million. The increase primarily reflects a $115.5 million increase in canned vegetable sales, a $40.1 million increase in fruit sales, and an increase in GMOL sales of $30.0 million. Selling prices/improved sales mix represented $160.3 million of the increase while sales volume accounted for $39.7 million. The increase in selling prices/improved sales mix was primarily due to $108.2 million in canned vegetable sales, $25.6 million in fruit products sales, and $19.7 million in Green Giant Alliance sales.
Cost of product sold as a percentage of sales decreased from 91.3% in 2008 to 90.6% in 2009, as higher selling prices more than offset increased costs, including a $30.1 million LIFO charge increase in 2009 versus prior year.
Selling, general and administrative expense decreased from 5.7% of sales in 2008 to 5.5% of sales in 2009 due to the fixed nature of certain expenses and the sales increase.
Plant restructuring costs increased from $0.5 million in 2008 to $0.9 million in 2009 and are described in detail in the Restructuring section of Management’s Discussion and Analysis of Financial Condition and Results of Operations.
Interest expense, net, decreased from $18.1 million in 2008 to $14.1 million in 2009 primarily reflecting lower average borrowing rates on long-term and short-term variable rate debt.
6
Management’s Discussion and Analysis of Financial Condition and Results of Operations
Other operating expense, net, of $0.6 million in 2009 primarily reflects the effect of a non-cash loss of $0.7 million on the disposal of property, plant and equipment partially offset by a gain of $0.1 million on the disposal of property, plant and equipment. Other operating income, net, of $0.2 million in 2008 primarily reflects a net gain on the sale of some unused fixed assets.
As a result of the aforementioned factors, pre-tax earnings increased from $14.7 million in 2008 to $34.1 million in 2009. The effective tax rate was 44.9% in 2009 and 45.5% in 2008. The decrease in the 2009 effective tax rate is primarily due to a lower addition to uncertain tax positions in 2009, partially offset by a charge related to research and development credit in 2009 and the settlement of an IRS audit during 2009.
Recently Issued Accounting Standards
In June 2009, the Financial Accounting Standards Board (“FASB”) issued Accounting Standards Update (“ASU”) No. 2009-01, Topic 105 — Generally Accepted Accounting Principles — FASB Accounting Standards Codification and the Hierarchy of Generally Accepted Accounting Principles, (formerly Statement No. 168, “The FASB Accounting Standards Codification and the Hierarchy of Generally Accepted Accounting Principles — a replacement of FASB Statement No. 162”). ASU No. 2009-01 establishes the FASB Accounting Standards Codification (“Codification” or “ASC”) as the source of authoritative accounting principles recognized by the FASB to be applied by nongovernmental entities in the preparation of financial statements in conformity with generally accepted accounting principles in the United States (“U.S. GAAP”). All guidance contained in the Codification carries an equal level of authority. The Codification does not change current U.S. GAAP, but is intended to simplify user access to all authoritative U.S. GAAP by providing all the authoritative literature related to a particular topic in one place. All existing accounting standard documents are superseded and all other accounting literature not included in the Codification is considered nonauthoritative. The Codification became effective for interim or annual reporting periods ending after September 15, 2009. The Company has made the appropriate changes to U.S. GAAP references in its financial statements.
In September 2006, the FASB issued a new standard now codified in ASC 820, “Fair Value Measurements and Disclosures,” (formerly Statement No. 157, “Fair Value Measurements”), which defines fair value, establishes a framework for measuring fair value and expands disclosures about fair value measurements. This standard applies to other accounting pronouncements that require or permit fair value measurements, the FASB having previously concluded in those accounting pronouncements that fair value is the relevant measurement attribute. The standard does not require any new fair value measurements and was originally effective beginning January 1, 2008, but was subsequently deferred until January 1, 2009 for nonfinancial assets and nonfinancial liabilities except those items recognized or disclosed at fair value on an annual or more frequently recurring basis. The Company applied the fair value measurement and disclosure provisions of the new standard to nonfinancial assets and nonfinancial liabilities effective January 1, 2009. The application of such was not material to the Company’s consolidated financial position and results of operations.
In December 2007, the FASB issued a new standard now codified as ASC 805 (formerly Statement No. 141(R), “Business Combinations”). The standard was designed to further enhance the accounting and financial reporting related to business combinations. The standard establishes principles and requirements for how the acquirer in a business combination (i) recognizes and measures in its financial statements the identifiable assets acquired, the liabilities assumed, and any noncontrolling interest in the acquiree, (ii) recognizes and measures the goodwill acquired in the business combination or a gain from a bargain purchase, and (iii) determines what information to disclose to enable users of the financial statements to evaluate the nature and financial effects of the business combination. The standard applies prospectively to business combinations for which the acquisition date is on or after the beginning of the first annual reporting period beginning on or after December 15, 2008. Therefore, the effects of the Company’s adoption of the standard will depend upon the extent and magnitude of acquisitions after March 2009.
The FASB issued a new standard now codified as ASC 715 (formerly Statement No. 132(R)-1 issued on December 30, 2008, which amends Statement No. 132(R) “Employers’ Disclosures about Pensions and Other Postretirement Benefits”), to expand disclosures in an employer’s financial statements about plan assets. Among other things, the standard requires employers to disclose information regarding the fair value measurements of plan assets that are similar to the disclosures required by ASC 820 (e.g., information regarding the fair value disclosure hierarchy and rollforward of assets measured using Level 3 inputs). The disclosures about plan assets required by the standard are required for years ending on or after December 15, 2009. This standard did not materially impact the Company’s consolidated financial position and results of operations.
In June 2008, the FASB issued a new standard now codified as ASC 815 (formerly known as Emerging Issues Tax Force (EITF) 07-5, “Determining Whether an Instrument (or Embedded Feature) Is Indexed to an Entity’s Own Stock”). This standard provides guidance in assessing whether an equity-linked financial instrument (or embedded feature) is indexed to an entity’s own stock for purposes of determining whether the appropriate accounting treatment falls under the scope of the standard (formerly known as Statement No. 133, “Accounting For Derivative Instruments and Hedging Activities,” and/or EITF 00-19, “Accounting For Derivative Financial Instruments Indexed to, and Potentially Settled in, a Company’s Own Stock”). This standard became effective as of the beginning of 2010. This standard did not have an impact on the Company’s consolidated financial position and results of operations.
7
Management’s Discussion and Analysis of Financial Condition and Results of Operations
In June 2008, the FASB issued a new standard now codified as ASC 260 (formerly known as FSP EITF 03-6-1, “Determining Whether Instruments Granted in Share-Based Payment Transactions are Participating Securities”). This standard provides that unvested share-based payment awards that contain nonforfeitable rights to dividends or dividend equivalents, whether paid or unpaid, are participating securities and are required to be included in the computation of earnings per share pursuant to the two-class method described in ASC 260 (formerly known as Statement No. 128, “Earnings Per Share”). The Company’s unvested restricted shares under the Company’s equity compensation plan are considered participating securities. This standard was effective for financial statements issued for fiscal years beginning after December 15, 2008, and interim periods within those years. All prior period earnings per share data presented are required to be adjusted retrospectively to conform to the provisions of this FSP. Adoption of this standard had no material impact on earnings per share for years 2010 or 2009.
In June 2009, the FASB issued a new standard now codified as ASC 860 (formerly known as Statement No. 166, “Accounting for Transfers of Financial Assets”). The standard amends the derecognition guidance in Statement No. 140, “Accounting for Transfers and Servicing of Financial Assets and Extinguishments of Liabilities”. The standard is effective for fiscal years beginning after November 15, 2009. The Company does not expect the standard to have a material impact on its consolidated financial position and results of operations.
In June 2009, the FASB issued a new standard now codified as ASC 855 (formerly known as Statement No. 167, “Amendments to FASB Interpretation No. 46(R)”). The standard amends the consolidation guidance applicable to variable interest entities and affects the overall consolidation analysis under the prior standard. The standard is effective for fiscal years beginning after November 15, 2009. The Company does not expect the amended standard to have a material impact on its consolidated financial position and results of operations.
8
Management’s Discussion and Analysis of Financial Condition and Results of Operations
QUANTITATIVE AND QUALITATIVE DISCLOSURES ABOUT MARKET RISK
Interest Rate Risk
The Company maintained $7.4 million in cash equivalents as of March 31, 2010. As a result of its regular borrowing activities, the Company’s operating results are exposed to fluctuations in interest rates, which it manages primarily through its regular financing activities. The Company uses a revolving credit facility with variable interest rates to finance capital expenditures, acquisitions, seasonal working capital requirements and to pay debt principal and interest obligations. In addition, long-term debt includes secured notes payable. Long-term debt bears interest at fixed and variable rates. With $149.0 million in average variable-rate debt during fiscal 2010, a 1% change in interest rates would have had a $1.5 million effect on interest expense. The following table provides information about the Company’s financial instruments that are sensitive to changes in interest rates. The table presents principal cash flows and related weighted average interest rates by expected maturity date. Weighted average interest rates on long-term variable-rate debt are based on rates as of March 31, 2010.
Commodity Risk
The materials that the Company uses, such as vegetables, fruits, steel, ingredients, and packaging materials, as well as the electricity and natural gas used in the Company’s business, are commodities that may experience price volatility caused by external factors including market fluctuations, availability, weather, currency fluctuations, and changes in governmental regulations and agricultural programs. These events may result in reduced supplies of these materials, higher supply costs, or interruptions in the Company’s production schedules. If prices of these raw materials increase and the Company is not able to effectively pass such price increases along to its customers, operating income will decrease. With $198.0 million in produce costs expected during 2011, a 1% change would have a $2.0 million effect on inventory costs. A 1% change in steel unit costs would equate to a $1.1 million cost impact.
The Company does not currently hedge or otherwise use derivative instruments to manage interest rate or commodity risks.
Interest Rate Sensitivity of Long-Term Debt and Short-Term Investments
March 31, 2010 (In thousands)
|
Total/
|
Estimated
|
|||||||||||||||||||||||||||||||
|
PAYMENTS BY YEAR
|
Weighted
|
Fair
|
||||||||||||||||||||||||||||||
|
2011
|
2012
|
2013
|
2014
|
2015
|
Thereafter
|
Average
|
Value
|
|||||||||||||||||||||||||
|
Fixed-rate L/T debt:
|
||||||||||||||||||||||||||||||||
|
Principal cash flows
|
$
|
6,356
|
$
|
6,796
|
$
|
7,336
|
$
|
40,304
|
$
|
2,320
|
$
|
17,476
|
$
|
80,588
|
$
|
78,343
|
||||||||||||||||
|
Average interest rate
|
7.65
|
%
|
7.65
|
%
|
7.64
|
%
|
7.47
|
%
|
6.96
|
%
|
7.08
|
%
|
7.36
|
%
|
—
|
|||||||||||||||||
|
Variable-rate L/T debt:
|
||||||||||||||||||||||||||||||||
|
Principal cash flows
|
$
|
—
|
$
|
111,062
|
$
|
5,060
|
$
|
—
|
$
|
—
|
$
|
17,570
|
$
|
133,692
|
$
|
133,692
|
||||||||||||||||
|
Average interest rate
|
—
|
%
|
1.24
|
%
|
3.21
|
%
|
—
|
%
|
—
|
%
|
3.21
|
%
|
1.57
|
%
|
—
|
|||||||||||||||||
|
Average Revolver debt:
|
||||||||||||||||||||||||||||||||
|
Principal cash flows
|
$
|
126,381
|
$
|
126,381
|
||||||||||||||||||||||||||||
|
Average interest rate
|
1.29
|
%
|
—
|
|||||||||||||||||||||||||||||
|
Short-term investments:
|
||||||||||||||||||||||||||||||||
|
Average balance
|
$
|
774
|
$
|
774
|
||||||||||||||||||||||||||||
|
Average interest rate
|
0.28
|
%
|
—
|
|||||||||||||||||||||||||||||
9
Consolidated Statements of Net Earnings
Seneca Foods Corporation and Subsidiaries
(In thousands of dollars, except per share amounts)
|
Years ended March 31,
|
2010
|
2009
|
2008
|
|||||||||
|
Net sales
|
$
|
1,280,110
|
$
|
1,280,684
|
$
|
1,080,724
|
||||||
|
Costs and expenses:
|
||||||||||||
|
Cost of products sold
|
1,129,823
|
1,161,137
|
986,458
|
|||||||||
|
Selling, general, and administrative expense
|
65,133
|
69,836
|
61,147
|
|||||||||
|
Other operating (income) expense, net
|
156
|
624
|
(231
|
)
|
||||||||
|
Plant restructuring
|
—
|
899
|
497
|
|||||||||
|
Total costs and expenses
|
1,195,112
|
1,232,496
|
1,047,871
|
|||||||||
|
Operating income
|
84,998
|
48,188
|
32,853
|
|||||||||
|
Interest expense, net of interest income of $2, $14, and $79, respectively
|
9,638
|
14,103
|
18,143
|
|||||||||
|
Earnings before income taxes
|
75,360
|
34,085
|
14,710
|
|||||||||
|
Income taxes
|
26,949
|
15,320
|
6,691
|
|||||||||
|
Net earnings
|
$
|
48,411
|
$
|
18,765
|
$
|
8,019
|
||||||
|
Basic earnings per common share
|
$
|
3.98
|
$
|
1.54
|
$
|
0.66
|
||||||
|
Diluted earnings per common share
|
$
|
3.96
|
$
|
1.53
|
$
|
0.65
|
||||||
See notes to consolidated financial statements.
10
Consolidated Balance Sheets
Seneca Foods Corporation and Subsidiaries
(In thousands)
|
March 31,
|
2010
|
2009
|
||||||
|
Assets
|
||||||||
|
Current Assets:
|
||||||||
|
Cash and cash equivalents
|
$
|
7,421
|
$
|
5,849
|
||||
|
Accounts receivable, less allowance for doubtful accounts of $354 and $426, respectively
|
73,460
|
76,713
|
||||||
|
Inventories:
|
||||||||
|
Finished products
|
338,891
|
270,481
|
||||||
|
In process
|
8,176
|
24,280
|
||||||
|
Raw materials and supplies
|
99,397
|
98,194
|
||||||
|
446,464
|
392,955
|
|||||||
|
Deferred income taxes
|
10,032
|
6,449
|
||||||
|
Other current assets
|
2,850
|
5,966
|
||||||
|
Total Current Assets
|
540,227
|
487,932
|
||||||
|
Deferred income tax asset, net
|
—
|
6,692
|
||||||
|
Other assets
|
993
|
1,736
|
||||||
|
Property, Plant, and Equipment:
|
||||||||
|
Land
|
16,317
|
16,284
|
||||||
|
Buildings and improvements
|
148,441
|
143,360
|
||||||
|
Equipment
|
312,149
|
302,099
|
||||||
|
476,907
|
461,743
|
|||||||
|
Less accumulated depreciation and amortization
|
298,794
|
282,498
|
||||||
|
Net Property, Plant, and Equipment
|
178,113
|
179,245
|
||||||
|
Total Assets
|
$
|
719,333
|
$
|
675,605
|
||||
|
Liabilities and Stockholders’ Equity
|
||||||||
|
Current Liabilities:
|
||||||||
|
Accounts payable
|
$
|
67,674
|
$
|
60,019
|
||||
|
Accrued vacation
|
10,059
|
9,502
|
||||||
|
Accrued payroll
|
12,798
|
9,771
|
||||||
|
Other accrued expenses
|
32,608
|
36,030
|
||||||
|
Current portion of long-term debt
|
6,356
|
38,949
|
||||||
|
Income taxes
|
6,122
|
1,579
|
||||||
|
Total Current Liabilities
|
135,617
|
155,850
|
||||||
|
Long-term debt, less current portion
|
207,924
|
191,853
|
||||||
|
Other liabilities
|
37,697
|
45,477
|
||||||
|
Deferred income taxes
|
3,085
|
—
|
||||||
|
Total Liabilities
|
384,323
|
393,180
|
||||||
|
Commitments and contingencies (Note 12)
|
||||||||
|
Stockholders’ Equity:
|
||||||||
|
Preferred stock
|
31,325
|
69,403
|
||||||
|
Common stock
|
3,861
|
3,080
|
||||||
|
Total Capital Stock
|
35,186
|
72,483
|
||||||
|
Additional paid-in capital
|
65,910
|
28,546
|
||||||
|
Treasury stock, at cost
|
(257
|
)
|
(257
|
)
|
||||
|
Accumulated other comprehensive loss
|
(15,030
|
)
|
(19,160
|
)
|
||||
|
Retained earnings
|
249,201
|
200,813
|
||||||
|
Total Stockholders’ Equity
|
335,010
|
282,425
|
||||||
|
Total Liabilities and Stockholders’ Equity
|
$
|
719,333
|
$
|
675,605
|
||||
See notes to consolidated financial statements.
11
Consolidated Statements of Cash Flows
Seneca Foods Corporation and Subsidiaries
(In thousands)
|
Years ended March 31,
|
2010
|
2009
|
2008
|
|||||||||
|
Cash flows from operating activities:
|
||||||||||||
|
Net earnings
|
$
|
48,411
|
$
|
18,765
|
$
|
8,019
|
||||||
|
Adjustments to reconcile net earnings to net cash provided by (used in) operations:
|
||||||||||||
|
Depreciation and amortization
|
22,415
|
22,026
|
22,669
|
|||||||||
|
Deferred income tax expense (benefit)
|
4,247
|
4,680
|
(74
|
)
|
||||||||
|
Loss (gain) on the sale of assets
|
153
|
676
|
(231
|
)
|
||||||||
|
Impairment provision and other non-cash expenses
|
—
|
—
|
445
|
|||||||||
|
Changes in operating assets and liabilities:
|
||||||||||||
|
Accounts receivable
|
3,253
|
(14,701
|
)
|
(6,512
|
)
|
|||||||
|
Inventories
|
(53,509
|
)
|
2,731
|
(15,199
|
)
|
|||||||
|
Other current assets
|
3,116
|
884
|
(1,779
|
)
|
||||||||
|
Accounts payable, accrued expenses, and other liabilities
|
5,593
|
2,346
|
(4,006
|
)
|
||||||||
|
Income taxes
|
4,433
|
9,872
|
(9,564
|
)
|
||||||||
|
Net cash provided by (used in) operations
|
38,112
|
47,279
|
(6,232
|
)
|
||||||||
|
Cash flows from investing activities:
|
||||||||||||
|
Additions to property, plant, and equipment
|
(20,783
|
)
|
(23,198
|
)
|
(32,853
|
)
|
||||||
|
Proceeds from the sale of assets
|
168
|
611
|
508
|
|||||||||
|
Net cash used in investing activities
|
(20,615
|
)
|
(22,587
|
)
|
(32,345
|
)
|
||||||
|
Cash flows from financing activities:
|
||||||||||||
|
Proceeds from issuance of long-term debt
|
415,727
|
442,315
|
388,725
|
|||||||||
|
Payments of long-term debt
|
(432,249
|
)
|
(471,712
|
)
|
(348,954
|
)
|
||||||
|
Change in other assets
|
620
|
512
|
599
|
|||||||||
|
Purchase treasury stock
|
—
|
(257
|
)
|
—
|
||||||||
|
Preferred dividends paid
|
(23
|
)
|
(23
|
)
|
(23
|
)
|
||||||
|
Net cash (used in) provided by financing activities
|
(15,925
|
)
|
(29,165
|
)
|
40,347
|
|||||||
|
Net increase (decrease) in cash and cash equivalents
|
1,572
|
(4,473
|
)
|
1,770
|
||||||||
|
Cash and cash equivalents, beginning of year
|
5,849
|
10,322
|
8,552
|
|||||||||
|
Cash and cash equivalents, end of year
|
$
|
7,421
|
$
|
5,849
|
$
|
10,322
|
||||||
|
Supplemental disclosures of cash flow information:
|
||||||||||||
|
Cash paid (refunded) during the year for:
|
||||||||||||
|
Interest
|
$
|
8,989
|
$
|
13,894
|
$
|
18,437
|
||||||
|
Income taxes
|
18,813
|
(613
|
)
|
14,346
|
||||||||
See notes to consolidated financial statements.
12
Consolidated Statements of Stockholders’ Equity
Seneca Foods Corporation and Subsidiaries
(In thousands, except share amounts)
|
Accumulated
|
||||||||||||||||||||||||||||
|
Additional
|
Other
|
|||||||||||||||||||||||||||
|
Preferred
|
Common
|
Paid-In
|
Treasury
|
Comprehensive
|
Retained
|
Comprehensive
|
||||||||||||||||||||||
|
Stock
|
Stock
|
Capital
|
Stock
|
Loss
|
Earnings
|
Income
|
||||||||||||||||||||||
|
Balance March 31, 2007
|
$
|
69,619
|
$
|
3,075
|
$
|
28,277
|
$
|
—
|
$
|
(1,253
|
)
|
$
|
173,853
|
|||||||||||||||
|
Net earnings
|
—
|
—
|
—
|
—
|
—
|
8,019
|
$
|
8,019
|
||||||||||||||||||||
|
Cash dividends paid on preferred stock
|
—
|
—
|
—
|
—
|
—
|
(23
|
)
|
—
|
||||||||||||||||||||
|
Equity incentive program
|
—
|
—
|
16
|
—
|
—
|
—
|
—
|
|||||||||||||||||||||
|
Adoption of FIN 48
|
—
|
—
|
—
|
—
|
—
|
222
|
—
|
|||||||||||||||||||||
|
Preferred stock conversion
|
(171
|
)
|
4
|
167
|
—
|
—
|
—
|
—
|
||||||||||||||||||||
|
Change in pension and post retirement benefits adjustment (net of tax $1,518)
|
—
|
—
|
—
|
—
|
(2,375
|
)
|
—
|
(2,375
|
)
|
|||||||||||||||||||
|
Balance March 31, 2008
|
69,448
|
3,079
|
28,460
|
—
|
(3,628
|
)
|
182,071
|
$
|
5,644
|
|||||||||||||||||||
|
Net earnings
|
—
|
—
|
—
|
—
|
—
|
18,765
|
$
|
18,765
|
||||||||||||||||||||
|
Cash dividends paid on preferred stock
|
—
|
—
|
—
|
—
|
—
|
(23
|
)
|
—
|
||||||||||||||||||||
|
Equity incentive program
|
—
|
—
|
42
|
—
|
—
|
—
|
—
|
|||||||||||||||||||||
|
Preferred stock conversion
|
(45
|
)
|
1
|
44
|
—
|
—
|
—
|
—
|
||||||||||||||||||||
|
Purchase treasury stock
|
—
|
—
|
—
|
(257
|
)
|
—
|
—
|
—
|
||||||||||||||||||||
|
Change in pension and post retirement benefits adjustment (net of tax $9,930)
|
—
|
—
|
—
|
—
|
(15,532
|
)
|
—
|
(15,532
|
)
|
|||||||||||||||||||
|
Balance March 31, 2009
|
69,403
|
3,080
|
28,546
|
(257
|
)
|
(19,160
|
)
|
200,813
|
$
|
3,233
|
||||||||||||||||||
|
Net earnings
|
—
|
—
|
—
|
—
|
—
|
48,411
|
$
|
48,411
|
||||||||||||||||||||
|
Cash dividends paid on preferred stock
|
—
|
—
|
—
|
—
|
—
|
(23
|
)
|
—
|
||||||||||||||||||||
|
Equity incentive program
|
—
|
—
|
67
|
—
|
—
|
—
|
—
|
|||||||||||||||||||||
|
Preferred stock conversion
|
(38,078
|
)
|
781
|
37,297
|
—
|
—
|
—
|
—
|
||||||||||||||||||||
|
Change in pension and post retirement benefits adjustment (net of tax $2,640)
|
—
|
—
|
—
|
—
|
4,130
|
—
|
4,130
|
|||||||||||||||||||||
|
Balance March 31, 2010
|
$
|
31,325
|
$
|
3,861
|
$
|
65,910
|
$
|
(257
|
)
|
$
|
(15,030
|
)
|
$
|
249,201
|
$
|
52,541
|
||||||||||||
|
Preferred Stock
|
Common Stock
|
|||||||||||||||||||||||||||
|
6%
|
10%
|
|||||||||||||||||||||||||||
|
Cumulative Par
|
Cumulative Par
|
2003 Series
|
2006 Series
|
|||||||||||||||||||||||||
|
Value $.25
|
Value $.025
|
Participating
|
Participating
|
Participating
|
Class A
|
Class B
|
||||||||||||||||||||||
|
Callable at Par
|
Convertible
|
Convertible Par
|
Convertible Par
|
Convertible Par
|
Common Stock
|
Common Stock
|
||||||||||||||||||||||
|
Voting
|
Voting
|
Value $.025
|
Value $.025
|
Value $.025
|
Par Value $.25
|
Par Value $.25
|
||||||||||||||||||||||
|
Shares authorized and designated:
|
||||||||||||||||||||||||||||
|
March 31, 2010
|
200,000
|
1,400,000
|
102,047
|
313,304
|
1,025,220
|
20,000,000
|
10,000,000
|
|||||||||||||||||||||
|
Shares issued and outstanding:
|
||||||||||||||||||||||||||||
|
March 31, 2008
|
200,000
|
807,240
|
2,983,694
|
554,690
|
1,025,220
|
4,830,268
|
2,760,905
|
|||||||||||||||||||||
|
March 31, 2009
|
200,000
|
807,240
|
2,982,094
|
552,976
|
1,025,220
|
4,820,080
|
2,760,903
|
|||||||||||||||||||||
|
March 31, 2010
|
200,000
|
807,240
|
102,047
|
313,304
|
1,025,220
|
8,528,745
|
2,176,836
|
|||||||||||||||||||||
|
Stock amount
|
$
|
50
|
$
|
202
|
$
|
1,217
|
$
|
4,856
|
$
|
25,000
|
$
|
2,136
|
$
|
1,725
|
||||||||||||||
See notes to consolidated financial statements.
13
Notes to Consolidated Financial Statements
Seneca Foods Corporation and Subsidiaries
1. Summary of Significant Accounting Policies
Nature of Operations — Seneca Foods Corporation and subsidiaries (the “Company”) conducts its business almost entirely in food processing, operating 22 plants and 29 warehouses in seven states. The Company markets branded and private label processed foods to retailers and institutional food distributors.
Principles of Consolidation — The consolidated financial statements include the accounts for the parent company and all of its wholly-owned subsidiaries after elimination of intercompany transactions, profits, and balances.
Revenue Recognition — Sales and related cost of product sold are recognized when legal title passes to the purchaser, which is primarily upon shipment of products. When customers, under the terms of specific orders, request that the Company invoice goods and hold the goods (“Bill and Hold”) for future shipment, the Company recognizes revenue when legal title to the finished goods inventory passes to the purchaser. Generally, the Company receives cash from the purchaser when legal title passes. During the years ended 2010 and 2009, the Company sold for cash, on a bill and hold basis, $213.3 million and $196.3 million, respectively, of Green Giant finished goods inventory to General Mills Operations, LLC (“GMOL”). At the time of the sale of the Green Giant vegetables to GMOL, title of the specified inventory transferred to GMOL. The Company believes it has met the criteria required by the accounting standards for Bill and Hold treatment. As of March 31, 2010, $134.3 million of 2010 product remained unshipped.
Trade promotions are an important component of the sales and marketing of the Company’s branded products, and are critical to the support of the business. Trade promotion costs, which are recorded as a reduction of net sales, include amounts paid to encourage retailers to offer temporary price reductions for the sale of our products to consumers, amounts paid to obtain favorable display positions in retailers’ stores, and amounts paid to retailers for shelf space in retail stores. Accruals for trade promotions are recorded primarily at the time of sale of product to the retailer based on expected levels of performance. Settlement of these liabilities typically occurs in subsequent periods primarily through an authorized process for deductions taken by a retailer from amounts otherwise due to the Company. As a result, the ultimate cost of a trade promotion program is dependent on the relative success of the events and the actions and level of deductions taken by retailers for amounts they consider due to them. Final determination of the permissible deductions may take extended periods of time.
Concentration of Credit Risk — Financial instruments that potentially subject the Company to credit risk consist of trade receivables and interest-bearing investments. Wholesale and retail food distributors comprise a significant portion of the trade receivables; collateral is generally not required. A relatively limited number of customers account for a large percentage of the Company’s total sales. GMOL sales represented 19%, 18% and 19% of net sales in 2010, 2009 and 2008, respectively. The top ten customers represented approximately 52%, 53% and 52%, of net sales for 2010, 2009 and 2008, respectively. The Company closely monitors the credit risk associated with its customers. The Company places substantially all of its interest-bearing investments with financial institutions and monitors credit exposure. Cash and short-term investments in certain accounts exceed the federal insured limit; however, the Company has not experienced any losses in such accounts.
Cash and Cash Equivalents — The Company considers all highly liquid instruments purchased with an original maturity of three months or less as short-term investments.
Fair Value of Financial Instruments The fair values of cash and cash equivalents, accounts receivable, short-term debt and accounts payable approximate cost because of the immediate or short-term maturity of these financial instruments.
Deferred Financing Costs — Deferred financing costs incurred in obtaining debt are amortized on a straight-line basis over the term of the debt, which is not materially different than using the effective interest rate method.
Inventories — Effective in fiscal 2008 substantially all inventories are stated at the lower of cost; determined under the last-in, first-out (“LIFO”) method; or market. Prior to fiscal 2008, the Company used the first-in, first-out (“FIFO”) inventory valuation method.
Income Taxes — The provision for income taxes includes federal and state income taxes currently payable and those deferred because of temporary differences between the financial statement and tax basis of assets and liabilities and tax credit carryforwards.
The Company evaluates the realizability of its deferred income tax assets by assessing its valuation allowance and by adjusting the amount of such allowance, if necessary. The factors used to assess the likelihood of realization are the Company’s forecast of future taxable income, the projected reversal of temporary differences and available tax planning strategies that could be implemented to realize the net deferred income tax assets.
As disclosed in Note 5, Income Taxes, the Company adopted the provisions of ASC 740 Income Taxes (formerly Statement of Financial Accounting Standards (SFAS) Interpretation No. 48 “Accounting for Uncertain Income Taxes — an Interpretation of SFAS Statement No. 109”), on April 1, 2007. The Company has elected to retain its existing accounting policy with respect to the treatment of interest and penalties attributable to income taxes and continues to reflect any change for such, to the extent it arises, as a component of its income tax provision or benefit.
Shipping and Handling Costs — The Company includes all shipping and handling costs billed to customers in net sales and the corresponding costs in cost of products sold.
14
Notes to Consolidated Financial Statements
Advertising Costs — Advertising costs are expensed as incurred.
Doubtful Accounts — A provision for doubtful accounts is recorded based upon an assessment of credit risk within the accounts receivable portfolio, experience of delinquencies (accounts over 15 days past due) and charge-offs (accounts removed from accounts receivable for expectation of non-payment), and current market conditions. Management believes these provisions are adequate based upon the relevant information presently available. However, it is possible that the Company’s loss experience may change in the future.
Earnings per Common Share — The Company has three series of convertible preferred stock, which are deemed to be participating securities that are entitled to participate in any dividend on Class A common stock as if the preferred stock had been converted into common stock immediately prior to the record date for such dividend. Basic earnings per share for common stock is calculated using the “two-class” method by dividing the earnings allocated to common stockholders by the weighted average of common shares outstanding during the period.
Diluted earnings per share is calculated by dividing earnings allocated to common stockholders by the sum of the weighted average common shares outstanding plus the dilutive effect of convertible preferred stock using the “if-converted” method, which treats the contingently-issuable shares of convertible preferred stock as common stock.
|
Years ended March 31,
|
2010
|
2009
|
2008
|
|||||||||
|
(In thousands, except per share amounts)
|
||||||||||||
|
Basic
|
||||||||||||
|
Net earnings
|
$
|
48,411
|
$
|
18,765
|
$
|
8,019
|
||||||
|
Deduct preferred stock dividends
|
23
|
23
|
23
|
|||||||||
|
Undistributed earnings
|
48,388
|
18,742
|
7,996
|
|||||||||
|
Earnings allocated to participating preferred
|
8,996
|
7,038
|
3,006
|
|||||||||
|
Earnings allocated to common shareholders
|
$
|
39,392
|
$
|
11,704
|
$
|
4,990
|
||||||
|
Weighted average common shares outstanding
|
9,887
|
7,587
|
7,585
|
|||||||||
|
Basic earnings per common share
|
$
|
3.98
|
$
|
1.54
|
$
|
0.66
|
||||||
|
Diluted
|
||||||||||||
|
Earnings allocated to common shareholders
|
$
|
39,392
|
$
|
11,704
|
$
|
4,990
|
||||||
|
Add dividends on convertible preferred stock
|
20
|
20
|
20
|
|||||||||
|
Earnings applicable to common stock on a diluted basis
|
$
|
39,412
|
$
|
11,724
|
$
|
5,010
|
||||||
|
Weighted average common shares outstanding-basic
|
9,887
|
7,587
|
7,585
|
|||||||||
|
Additional shares issued related to equity compensation plan
|
3
|
—
|
—
|
|||||||||
|
Additional shares to be issued under full conversion of preferred stock
|
67
|
67
|
67
|
|||||||||
|
Total shares for diluted
|
9,957
|
7,654
|
7,652
|
|||||||||
|
Diluted earnings per share
|
$
|
3.96
|
$
|
1.53
|
$
|
0.65
|
||||||
Depreciation and Valuation — Property, plant, and equipment are stated at cost. Interest incurred during the construction of major projects is capitalized. In 2008, $972,000 of interest associated with such projects was capitalized. Interest associated with construction projects in 2010 and 2009 was capitalized, but was considered immaterial. For financial reporting, the Company provides for depreciation on the straight-line method at rates based upon the estimated useful lives of the various assets. Depreciation was $21,594,000, $21,286,000, and $21,865,000 in 2010, 2009, and 2008, respectively. The estimated useful lives are as follows: buildings — 30 years; machinery and equipment — 10-15 years; computer software - 3-5 years; vehicles — 3-7 years; and land improvements - 10-20 years. The Company assesses its long-lived assets for impairment whenever there is an indicator of impairment. Impairment losses are evaluated if the estimated undiscounted value of the cash flows are less than carrying value. A loss is recognized when the carrying value of an asset exceeds its fair value. There were no significant impairment losses included in Plant Restructuring in 2010, 2009 or 2008.
Use of Estimates in the Preparation of Financial Statements — The preparation of financial statements in conformity with accounting principals generally accepted in the United States requires management to make estimates and assumptions that affect the reported amount of assets and liabilities and the disclosure of contingent assets and liabilities at the date of the financial statements, as well as the related revenues and expenses during the reporting period. Actual amounts could differ from those estimated.
Recently Issued Accounting Standards — In June 2009, the Financial Accounting Standards Board (“FASB”) issued Accounting Standards Update (“ASU”) No. 2009-01, Topic 105 — Generally Accepted Accounting Principles — FASB Accounting Standards Codification and the Hierarchy of Generally Accepted Accounting Principles, (formerly Statement No. 168, “The FASB Accounting Standards Codification and the Hierarchy of Generally Accepted Accounting Principles — a replacement of FASB Statement No. 162”). ASU No. 2009-01 establishes the FASB Accounting Standards Codification (“Codification” or “ASC”) as the source of authoritative accounting principles recognized by the FASB to be applied by nongovernmental entities in the preparation of financial statements in conformity with generally accepted accounting principles in the United States (“U.S. GAAP”). All guidance contained in the Codification carries an equal level of authority. The Codification does not change current U.S. GAAP, but is intended to simplify user access to all authoritative U.S. GAAP by providing all the authoritative literature related to a particular topic in one place. All existing accounting standard documents are superseded and all other accounting literature not included in the Codification is considered nonauthoritative. The Codification became effective for interim or annual reporting periods ending after September 15, 2009. The Company has made the appropriate changes to U.S. GAAP references in its financial statements.
15
Notes to Consolidated Financial Statements
In September 2006, the FASB issued a new standard now codified in ASC 820, “Fair Value Measurements and Disclosures,” (formerly Statement No. 157, “Fair Value Measurements”), which defines fair value, establishes a framework for measuring fair value and expands disclosures about fair value measurements. This standard applies to other accounting pronouncements that require or permit fair value measurements, the FASB having previously concluded in those accounting pronouncements that fair value is the relevant measurement attribute. The standard does not require any new fair value measurements and was originally effective beginning January 1, 2008, but was subsequently deferred until January 1, 2009 for nonfinancial assets and nonfinancial liabilities except those items recognized or disclosed at fair value on an annual or more frequently recurring basis. The Company applied the fair value measurement and disclosure provisions of the new standard to nonfinancial assets and nonfinancial liabilities effective January 1, 2009. The application of such was not material to the Company’s consolidated financial position and results of operations.
In December 2007, the FASB issued a new standard now codified as ASC 805 (formerly Statement No. 141(R), “Business Combinations”). The standard was designed to further enhance the accounting and financial reporting related to business combinations. The standard establishes principles and requirements for how the acquirer in a business combination (i) recognizes and measures in its financial statements the identifiable assets acquired, the liabilities assumed, and any noncontrolling interest in the acquiree, (ii) recognizes and measures the goodwill acquired in the business combination or a gain from a bargain purchase, and (iii) determines what information to disclose to enable users of the financial statements to evaluate the nature and financial effects of the business combination. The standard applies prospectively to business combinations for which the acquisition date is on or after the beginning of the first annual reporting period beginning on or after December 15, 2008. Therefore, the effects of the Company’s adoption of the standard will depend upon the extent and magnitude of acquisitions after March 2009.
The FASB issued a new standard now codified as ASC 715 (formerly Statement No. 132(R)-1 issued on December 30, 2008, which amends Statement No. 132(R) “Employers’ Disclosures about Pensions and Other Postretirement Benefits”), to expand disclosures in an employer’s financial statements about plan assets. Among other things, the standard requires employers to disclose information regarding the fair value measurements of plan assets that are similar to the disclosures required by ASC 820 (e.g., information regarding the fair value disclosure hierarchy and rollforward of assets measured using Level 3 inputs). The disclosures about plan assets required by the standard are required for fiscal years ending on or after December 15, 2009. This standard did not have an impact on the Company’s consolidated financial position and results of operations.
In June 2008, the FASB issued a new standard now codified as ASC 815 (formerly known as Emerging Issues Tax Force (EITF) 07- 5, “Determining Whether an Instrument (or Embedded Feature) Is Indexed to an Entity’s Own Stock”). This standard provides guidance in assessing whether an equity-linked financial instrument (or embedded feature) is indexed to an entity’s own stock for purposes of determining whether the appropriate accounting treatment falls under the scope of the standard (formerly known as Statement No. 133, “Accounting For Derivative Instruments and Hedging Activities,” and/or EITF 00-19, “Accounting For Derivative Financial Instruments Indexed to, and Potentially Settled in, a Company’s Own Stock”). This standard became effective as of the beginning of 2010. This standard did not have an impact on the Company’s consolidated financial position and results of operations.
In June 2008, the FASB issued a new standard now codified as ASC 260 (formerly known as FSP EITF 03-6-1, “Determining Whether Instruments Granted in Share-Based Payment Transactions are Participating Securities”). This standard provides that unvested share-based payment awards that contain nonforfeitable rights to dividends or dividend equivalents, whether paid or unpaid, are participating securities and are required to be included in the computation of earnings per share pursuant to the two-class method described in ASC 260 (formerly known as Statement No. 128, “Earnings Per Share”). The Company’s unvested restricted shares under the Company’s equity compensation plan are considered participating securities. This standard was effective for financial statements issued for fiscal years beginning after December 15, 2008, and interim periods within those years. All prior period earnings per share data presented are required to be adjusted retrospectively to conform to the provisions of this FSP. Adoption of this standard had no material impact on earnings per share for 2010 or 2009.
In June 2009, the FASB issued a new standard now codified as ASC 860 (formerly known as Statement No. 166, “Accounting for Transfers of Financial Assets”). The standard amends the derecognition guidance in Statement No. 140, “Accounting for Transfers and Servicing of Financial Assets and Extinguishments of Liabilities”. The standard is effective for years beginning after November 15, 2009. The Company does not expect the standard to have a material impact on its consolidated financial position and results of operations.
In June 2009, the FASB issued a new standard now codified as ASC 855 (formerly known as Statement No. 167, “Amendments to FASB Interpretation No. 46(R)”). The standard amends the consolidation guidance applicable to variable interest entities and affects the overall consolidation analysis under the prior standard. The standard is effective for fiscal years beginning after November 15, 2009. The Company does not expect the amended standard to have a material impact on its consolidated financial position and results of operations.
Reclassifications — Certain previously reported amounts have been reclassified to conform to the current period classification.
16
Notes to Consolidated Financial Statements
2. Line of Credit
The Company primarily funds its capital expenditures, acquisitions and working capital requirements through bank borrowings. On August 18, 2006, in connection with the acquisition of Signature, the Company entered into a $250,000,000 five-year floating rate secured revolving credit facility (the “Revolver”) with various banks. The maturity date for the revolver is August 18, 2011. As of March 31, 2010, the outstanding balance of the Revolver was $111,062,000, with a weighted average interest rate of 1.24%, and is included in long-term debt on the Consolidated Balance Sheet. The Revolver is secured by accounts receivable and inventories with a carrying value of $519,924,000. There were $87,384,000 in bank borrowings under the Revolver at March 31, 2009. The Company had $7,728,000 and $9,942,000 of outstanding standby letters of credit as of March 31, 2010 and 2009, respectively, that reduce borrowing availability under the Revolver. See Note 3, Long-Term Debt, for additional comments related to the Revolver.
3. Long-Term Debt
|
2010
|
2009
|
|||||||
|
(In thousands)
|
||||||||
|
Revolving credit facility, 1.24% and 1.52%, due through 2012
|
$
|
111,062
|
$
|
87,384
|
||||
|
Secured note payable to insurance company, 8.03%, due through 2014
|
52,893
|
57,080
|
||||||
|
Secured Industrial Revenue Development Bonds, 3.21%, and 3.95%, due through 2029
|
22,630
|
22,630
|
||||||
|
Secured promissory note, 6.98%, due through 2022
|
20,518
|
21,608
|
||||||
|
Secured promissory note, 6.35%, due through 2020
|
5,822
|
6,265
|
||||||
|
Secured Industrial Revenue Development Bond, 8.10%, due through 2017
|
881
|
978
|
||||||
|
Secured subordinated promissory note, 8.00%, due in 2010
|
—
|
32,118
|
||||||
|
Secured notes payable to utility company, 1.50%-3.00%, due through 2014
|
—
|
1,722
|
||||||
|
Secured Industrial Revenue Development Bond, 5.69%, due in 2010
|
—
|
451
|
||||||
|
Other
|
474
|
566
|
||||||
|
214,280
|
230,802
|
|||||||
|
Less current portion
|
6,356
|
38,949
|
||||||
|
$
|
207,924
|
$
|
191,853
|
|||||
The Company includes its Revolver as a long-term liability due to its August 2011 maturity date and the fact that it meets the criteria required by the accounting standards for this classification. As of March 31, 2010, the outstanding balance on the Revolver was $111.1 million and letters of credit supported by the Revolver totaled $7.7 million, leaving $131.2 million available. The Company early-retired debt totaling $1.7 million in May 2009 related to utility company financed energy savings projects. A secured subordinated promissory note to GMOL, with a balance of $32.1 million, matured and was paid off, when due, on September 30, 2009 using funds from the Revolver.
The Company’s debt agreements, including the Revolver, contain covenants that restrict the Company’s ability to incur additional indebtedness, pay dividends on and redeem the Company’s capital stock, make other restricted payments, including investments, sell the Company’s assets, incur liens, transfer all or substantially all of the Company’s assets and enter into consolidations or mergers. The Company’s debt agreements also require the Company to meet certain financial covenants, including EBITDA (Earnings Before Interest, Taxes, Depreciation and Amortization), minimum fixed charge coverage, minimum interest coverage and maximum total debt ratios. The Revolver also contains borrowing base requirements related to accounts receivable and inventory. These financial requirements and ratios generally become more restrictive over time and are subject to allowances for seasonal fluctuations. The most restrictive financial covenant in the debt agreements is the adjusted debt to total capitalization ratio. In connection with the Company’s decision to adopt the LIFO method of inventory accounting, effective December 30, 2007, the Company executed amendments to its debt agreements, which enable the Company to compute its financial covenants as if the Company were on the FIFO method of inventory accounting. The Company was in compliance with all such financial covenants as of March 31, 2010.
As of March 31, 2010, the most restrictive credit agreement limitation on the Company’s payment of dividends and other distributions, such as purchases of shares, to holders of Class A or Class B Common Stock is an annual total limitation of $500,000, less aggregate annual dividend payments totaling $23,000, which the Company presently pays on two outstanding classes of preferred stock.
The Company has five outstanding Industrial Revenue Development Bonds (“IRBs”), including four IRBs totaling $22,630,000 that are secured by direct pay letters of credit, and one IRB for $881,000 payable to GE Commercial Finance. The interest rates shown for these IRBs in the table above reflect the costs of the direct pay letters of credit and amortization of other related costs of those IRBs. The carrying value of assets pledged for secured debt, including the Revolver, is $654,118,000.
Debt repayment requirements for the next five fiscal years ended March 31, are:
|
(In thousands)
|
||||
|
2011
|
$
|
6,356
|
||
|
2012
|
117,858
|
|||
|
2013
|
12,396
|
|||
|
2014
|
40,304
|
|||
|
2015
|
2,320
|
|||
|
Thereafter
|
35,046
|
|||
|
Total
|
$
|
214,280
|
||
17
Notes to Consolidated Financial Statements
4. Leases
The Company had no capital leases as of March 31, 2010 and 2009. The Company has operating leases expiring at various dates through 2021. Operating leases generally provide for early purchase options one year prior to expiration.
The following is a schedule, by year, of minimum operating lease payments due as of March 31, 2010 (in thousands):
|
Years ending March 31:
|
||||
|
2011
|
$
|
28,277
|
||
|
2012
|
25,151
|
|||
|
2013
|
19,335
|
|||
|
2014
|
14,865
|
|||
|
2015
|
12,088
|
|||
|
2016-2021
|
24,888
|
|||
|
Total minimum payment required
|
$
|
124,604
|
||
Lease expense in fiscal 2010, 2009, and 2008 was $32,551,000, $32,088,000, and $29,757,000, respectively.
5. Income Taxes
The Company files a consolidated income tax return. The provision for income taxes is as follows:
|
2010
|
2009
|
2008
|
||||||||||
|
(In thousands)
|
||||||||||||
|
Current:
|
||||||||||||
|
Federal
|
$
|
19,049
|
$
|
8,867
|
$
|
6,444
|
||||||
|
State
|
3,653
|
1,773
|
321
|
|||||||||
|
22,702
|
10,640
|
6,765
|
||||||||||
|
Deferred:
|
||||||||||||
|
Federal
|
3,873
|
5,378
|
(602
|
)
|
||||||||
|
State
|
374
|
(698
|
)
|
528
|
||||||||
|
4,247
|
4,680
|
(74
|
)
|
|||||||||
|
Total income taxes
|
$
|
26,949
|
$
|
15,320
|
$
|
6,691
|
||||||
A reconciliation of the expected U.S. statutory rate to the effective rate follows:
|
2010
|
2009
|
2008
|
||||||||||
|
Computed (expected tax rate)
|
35.0
|
%
|
35.0
|
%
|
35.0
|
%
|
||||||
|
State income taxes (net of federal tax benefit)
|
2.9
|
2.9
|
3.1
|
|||||||||
|
State tax credits
|
(0.1
|
)
|
—
|
1.8
|
||||||||
|
Research and development credit charge (benefit)
|
—
|
3.9
|
(2.7
|
)
|
||||||||
|
Manufacturer’s deduction
|
(2.1
|
)
|
(1.7
|
)
|
(3.0
|
)
|
||||||
|
Addition to (reversal of) uncertain tax positions
|
(0.8
|
)
|
2.8
|
9.3
|
||||||||
|
IRS audit adjustment
|
—
|
1.8
|
—
|
|||||||||
|
Other permanent differences not deductible
|
0.2
|
0.5
|
0.2
|
|||||||||
|
Other
|
0.7
|
(0.3
|
)
|
1.8
|
||||||||
|
Effective income tax rate
|
35.8
|
%
|
44.9
|
%
|
45.5
|
%
|
||||||
The effective tax rate was 35.8% in 2010 and 44.9% in 2009. The decrease in the 2010 effective tax rate is primarily due to an addition to uncertain tax positions in 2009, a charge related to research and development credit in 2009 and the settlement of an IRS audit during 2009.
In 2008, the expiration of Wisconsin tax credits resulted in a net increase to the effective income tax rate. Also in 2008, the increase in effective income tax rate resulting from uncertain tax positions and related permanent differences and interest.
The following is a summary of the significant components of the Company’s deferred income tax assets and liabilities as of March 31, 2010 and 2009:
|
2010
|
2009
|
|||||||
|
(In thousands)
|
||||||||
|
Deferred income tax assets:
|
||||||||
|
Future tax credits
|
$
|
3,519
|
$
|
5,265
|
||||
|
Inventory valuation
|
1,056
|
646
|
||||||
|
Employee benefits
|
3,108
|
3,075
|
||||||
|
Insurance
|
5,673
|
3,758
|
||||||
|
Other comprehensive loss
|
9,733
|
12,262
|
||||||
|
Interest
|
583
|
—
|
||||||
|
Deferred gain on sale/leaseback
|
138
|
166
|
||||||
|
Other
|
338
|
993
|
||||||
|
Severance
|
—
|
12
|
||||||
|
24,148
|
26,177
|
|||||||
|
Deferred income tax liabilities:
|
||||||||
|
Property basis and depreciation difference
|
12,016
|
8,613
|
||||||
|
Pension
|
3,448
|
860
|
||||||
|
15,464
|
9,473
|
|||||||
|
Valuation allowance — non-current
|
1,737
|
3,563
|
||||||
|
Net deferred income tax asset
|
$
|
6,947
|
$
|
13,141
|
||||
Net current deferred income tax assets of $10,032,000 and $6,449,000 as of March 31, 2010 and 2009, respectively, are recognized in the Consolidated Balance Sheets. Also recognized are net non-current deferred income tax liabilities of $3,085,000 as of March 31, 2010 and net non-current deferred income tax assets of $6,692,000 as of March 31, 2009.
The Company adopted the provisions of ASC 740 Income Taxes (formerly SFAS Interpretation No. 48 “Accounting for Uncertain Income Taxes — an Interpretation of SFAS Statement No. 109”), on April 1, 2007. ASC 740 clarifies the accounting for uncertainty in income taxes by prescribing a minimum recognition threshold for a tax position taken or expected to be taken in a tax return that is required to be met before being recognized in the financial statements. ASC 740 also provides guidance on derecognition, measurement, classification, interest and penalties, accounting in interim periods, disclosure and transition. The $222,000 cumulative effect of adopting ASC 740 was recorded as an increase to Retained Earnings. The total amount of unrecognized tax benefits as of the date of adoption was $3,725,000. The change in the ASC 740 liability
18
Notes to Consolidated Financial Statements
for the years ended March 31, 2010 and 2009 consists of the following:
|
2010
|
2009
|
|||||||
|
(In thousands)
|
||||||||
|
Beginning Balance
|
$
|
5,297
|
$
|
4,221
|
||||
|
Tax positions related to current year:
|
||||||||
|
Additions
|
86
|
506
|
||||||
|
Tax positions related to prior years:
|
||||||||
|
Additions
|
372
|
2,907
|
||||||
|
Reductions
|
(12
|
)
|
(654
|
)
|
||||
|
Settlements
|
(206
|
)
|
(1,242
|
)
|
||||
|
Lapses in statues of limitations
|
—
|
(441
|
)
|
|||||
|
Balance as of March 31,
|
$
|
5,537
|
$
|
5,297
|
||||
Included in the balances at March 31, 2010 and 2009 are $4,145,000 and $4,041,000, respectively, of tax positions that are highly certain but for which there is uncertainty about the timing. Because of the impact of deferred tax accounting, other than interest and penalties, the disallowance of these positions would not impact the annual effective tax rate but would accelerate the payment of cash to the tax authority to an earlier period.
The Company recognizes interest and penalties accrued on unrecognized tax benefits as well as interest received from favorable settlements within income tax expense. During the years ended March 31, 2010 and 2009, the Company recognized an approximate $995,000 increase and $246,000 decrease, respectively, in interest and penalties. As of March 31, 2010 and 2009, the Company had approximately $1,531,000 and $536,000, respectively, of interest and penalties accrued associated with unrecognized tax benefits.
The Company files income tax returns in the U.S. federal jurisdiction and various states.
During the year ended March 31, 2008, the Company was being audited by the IRS for tax years 2004 and 2005 as well as by one state taxing authority for the 2004, 2005 and 2006 tax years. The Company reached a partial settlement with the state taxing authority during the year ended March 31, 2008. The Company reached a settlement with the IRS for the 2004 and 2005 tax years during the year ended March 31, 2009. As a result, the Company was able to record the tax benefits of those settlements as reductions to the ASC 740 liability amounting to $1,242,000 and $222,000 for the years ended March 31, 2009 and 2008, respectively. The Company is currently being audited by the IRS for the 2006, 2007, and 2008 tax years.
Although management believes that an adequate provision has been made for such audit issues, there is the possibility that the ultimate resolution of such issues could have an adverse effect on the earnings of the Company. Conversely, if these issues are resolved favorably in the future, the related provisions would be reduced, thus having a positive impact on earnings. It is anticipated that audit settlements will be reached during 2011 with the state taxing authority that could have an impact on earnings. Due to the uncertainty of amounts and in accordance with its accounting policies, the Company has not recorded any potential impact of these settlements.
The Company has State tax credit carryforwards amounting to $1,737,000 (New York, net of Federal impact), $679,000 (California, net of Federal impact) and $1,103,000 (Wisconsin, net of Federal impact), which are available to reduce future taxes payable in each respective state through 2023 (Wisconsin), 2024 (New York) and no expiration (California). The Company has performed the required assessment regarding the realization of deferred tax assets in accordance with ASC 740. At March 31, 2010, the Company has recorded a valuation allowance amounting to $1,737,000, which relates primarily to tax credit carryforwards which management has concluded it is more likely than not these will not be realized in the ordinary course of operations. Although realization is not assured, management has concluded that it is more likely than not that the deferred tax assets for which a valuation allowance was determined to be unnecessary will be realized in the ordinary course of operations. The amount of net deferred tax assets considered realizable, however, could be reduced if actual future income or income taxes rates are lower than estimated or if there are differences in the timing or amount of future reversals of existing taxable or deductible temporary differences.
6. Stockholders’ Equity
Preferred Stock — The Company has authorized three classes of preferred stock consisting of 200,000 shares of Six Percent (6%) Voting Cumulative Preferred Stock, par value $0.25 (“6% Preferred”); 30,000 shares of Preferred Stock Without Par Value to be issued in series by the Board of Directors, none of which are currently designated or outstanding; and 8,200,000 shares of Preferred Stock with $.025 par value, Class A, to be issued in series by the Board of Directors (“Class A Preferred”). The Board of Directors has designated five series of Class A Preferred including 10% Cumulative Convertible Voting Preferred Stock—Series A (“Series A Preferred”); 10% Cumulative Convertible Voting Preferred Stock—Series B (“Series B Preferred”); Convertible Participating Preferred Stock; Convertible Participating Preferred Stock, Series 2003; and Convertible Participating Preferred Stock, Series 2006.
The Convertible Participating Preferred Stock, Convertible Participating Preferred Stock, Series 2003 and Convertible Participating Preferred Stock, Series 2006 are convertible at the holders’ option on a one-for-one basis into shares of Class A Common Stock, subject to antidilution adjustments. These series of preferred stock have the right to receive dividends and distributions at a rate equal to the amount of any dividends and
19
Notes to Consolidated Financial Statements
distributions declared or made on the Class A Common Stock. No dividends were declared or paid on this preferred stock in fiscal 2010, 2009 or 2008. In addition, these series of preferred stock have certain distribution rights upon liquidation. Upon conversion, shares of these series of preferred stock become authorized but unissued shares of Class A Preferred and may be reissued as part of another series of Class A Preferred. As of March 31, 2010, the Company has an aggregate of 5,359,429 shares of non-designated Class A Preferred authorized for issuance.
The Convertible Participating Preferred Stock has a liquidation preference of $12 per share and has 102,047 shares outstanding as of March 31, 2010 after conversion of 2,880,047 shares into Class A Common Stock during fiscal 2010. The Convertible Participating Preferred Stock, Series 2003 was issued as partial consideration of the purchase price in the CPF acquisition. The 967,742 shares issued in that 2003 acquisition were valued at $16.60 per share which represented the then market value of the Class A Common Stock into which the preferred shares were immediately convertible. This series has a liquidation preference of $15.50 per share and has 313,304 shares outstanding as of March 31, 2010 after conversion of 239,672 shares into Class A Common Stock during fiscal 2010. The Convertible Participating Preferred Stock, Series 2006 was issued as partial consideration of the purchase price in the Signature acquisition. The 1,025,220 shares issued in that acquisition were valued at $24.385 per share which represented the then market value of the Class A Common Stock into which the preferred shares were immediately convertible. This series has a liquidation preference of $24.385 per share and has 1,025,220 shares outstanding as of March 31, 2010.
On July 21, 2009, certain shareholders of the Company closed on the sale of 3,756,332 shares of Class A Common Stock (including the shares sold pursuant to the underwriters’ overallotment option) pursuant to an Underwriting Agreement among the Company, the selling shareholders, Merrill Lynch Pierce Fenner & Smith Inc. and Piper Jaffray & Co. The Company received none of the proceeds of the offering. During the second quarter of fiscal 2010, 2,607,156 shares, or $31,104,000, of Convertible Participating Preferred Stock and 556,088 shares, or $139,000, of Class B Common Stock (at par), were converted to Class A Common Stock in connection with this secondary stock offering.
There are 407,240 shares of Series A Preferred outstanding as of March 31, 2010 which are convertible into one share of Class A Common Stock and one share of Class B Common stock for every 20 shares of Series A Preferred. There are 400,000 shares of Series B Preferred outstanding as of March 31, 2010 which are convertible into one share of Class A Common Stock and one share of Class B Common Stock for every 30 shares of Series B preferred. There are 200,000 shares of 6% Preferred outstanding as of March 31, 2010 which are callable at their par value at any time at the option of the Company. The Company paid dividends of $20,181 on the Series A and Series B Preferred and $3,000 on the 6% Preferred during each of fiscal 2010, 2009 and 2008.
Common Stock — The Class A Common Stock and the Class B Common Stock have substantially identical rights with respect to any dividends or distributions of cash or property declared on shares of common stock, and rank equally as to the right to receive proceeds on liquidation or dissolution of the Company after payment of the Company’s indebtedness and liquidation right to the holders of preferred shares. However, holders of Class B Common Stock retain a full vote per share, whereas the holders of Class A Common Stock have voting rights of 1/20th of one vote per share on all matters as to which shareholders of the Company are entitled to vote.
Unissued shares of common stock reserved for conversion privileges of designated non-participating preferred stock were 33,695 of both Class A and Class B as of March 31, 2010 and 2009. Additionally, there were 1,440,571 and 4,560,290 shares of Class A reserved for conversion of the Participating Preferred Stock as of March 31, 2010 and 2009, respectively.
On August 10, 2007, the 2007 Equity Incentive Plan (the “2007 Equity Plan”) was approved by shareholders at the Company’s annual meeting. The 2007 Equity Plan has a 10-year term and authorized the issuance of up to 100,000 shares of either Class A Common Stock and Class B Common Stock or a combination of the two classes of stock. A total of 3,834 shares were awarded in 2008, 4,879 shares were awarded in 2009, and 3,744 shares were awarded in 2010. As of March 31, 2010, there are 87,543 shares available for distribution as part of future awards under the 2007 Equity Plan.
Treasury Stock — During fiscal 2009 the Company repurchased $257,000 or 13,500 shares of its Class A Common Stock. These shares are not considered outstanding.
7. Retirement Plans
The Company has a noncontributory defined benefit pension plan (the “Plan”) covering all employees who meet certain age-entry requirements and work a stated minimum number of hours per year. Annual contributions are made to the Plan sufficient to satisfy legal funding requirements.
The following tables provide a reconciliation of the changes in the Plan’s benefit obligation and fair value of plan assets over the two-year period ended March 31, 2010 and a statement of the funded status as of March 31, 2010 and 2009:
20
Notes to Consolidated Financial Statements
|
2010
|
2009
|
|||||||
|
(In thousands)
|
||||||||
|
Change in Benefit Obligation
|
||||||||
|
Benefit obligation at beginning of year
|
$
|
84,088
|
$
|
86,940
|
||||
|
Service cost
|
3,813
|
3,585
|
||||||
|
Interest cost
|
6,174
|
5,667
|
||||||
|
Actuarial loss (gain)
|
19,524
|
(8,351
|
)
|
|||||
|
Benefit payments and expenses
|
(3,996
|
)
|
(3,753
|
)
|
||||
|
Benefit obligation at end of year
|
$
|
109,603
|
$
|
84,088
|
||||
|
Change in Plan Assets
|
||||||||
|
Fair value of plan assets at beginning of year
|
$
|
49,864
|
$
|
71,479
|
||||
|
Actual gain (loss) on plan assets
|
27,559
|
(27,862
|
)
|
|||||
|
Employer contributions
|
21,000
|
10,000
|
||||||
|
Benefit payments and expenses
|
(3,996
|
)
|
(3,753
|
)
|
||||
|
Fair value of plan assets at end of year
|
$
|
94,427
|
$
|
49,864
|
||||
|
Funded status
|
$
|
(15,176
|
)
|
$
|
(34,224
|
)
|
||
The funded status decreased by $19.0 million during 2010 reflecting the current unfunded liability based on the projected benefit obligation and actual fair value of plan assets as of March 31, 2010, net of a $21.0 million contribution to the Plan during 2010. This decrease was recognized via an increase to accumulated other comprehensive income of $4.0 million after the income tax benefit of $2.6 million. Plan assets increased from $49.9 million as of March 31, 2009 to $94.4 million as of March 31, 2010 due to a recovery from extremely difficult market conditions during the prior year and the Company’s contribution during the year. The unfunded liability is reflected in other liabilities in the Consolidated Balance Sheets.
|
2010
|
2009
|
|||||||
|
(In thousands)
|
||||||||
|
Amounts Included in Accumulated Other Comprehensive Pre-Tax Loss
|
||||||||
|
Transition asset
|
$
|
504
|
$
|
780
|
||||
|
Net loss
|
(24,941
|
)
|
(31,805
|
)
|
||||
|
Accumulated other comprehensive pre-tax loss
|
$
|
(24,437
|
)
|
$
|
(31,025
|
)
|
||
The following table provides the components of net periodic benefit cost for the Plan for fiscal years 2010, 2009, and 2008:
|
2010
|
2009
|
2008
|
||||||||||
| (In thousands) | ||||||||||||
|
Service cost
|
$
|
3,813
|
$
|
3,585
|
$
|
3,950
|
||||||
|
Interest cost
|
6,174
|
5,667
|
5,268
|
|||||||||
|
Expected return on plan assets
|
(3,801
|
)
|
(5,802
|
)
|
(6,162
|
)
|
||||||
|
Amortization of net loss
|
2,630
|
—
|
—
|
|||||||||
|
Amortization of transition asset
|
(276
|
)
|
(276
|
)
|
(276
|
)
|
||||||
|
Net periodic benefit cost
|
$
|
8,540
|
$
|
3,174
|
$
|
2,780
|
||||||
The Plan’s accumulated benefit obligation was $95,416,000 at March 31, 2010, and $74,763,000 at March 31, 2009.
Prior service costs are amortized on a straight-line basis over the average remaining service period of active participants. Gains and losses in excess of 10% of the greater of the benefit obligation and the market-related value of assets are amortized over the average remaining service period of active participants.
The assumptions used to measure the Company’s benefit obligation and pension expense are shown in the following table:
|
2010
|
2009
|
|||||||
|
Discount rate — benefit obligation
|
6.10
|
%
|
7.35
|
%
|
||||
|
Discount rate — pension expense
|
7.35
|
%
|
6.60
|
%
|
||||
|
Expected return on plan assets
|
8.00
|
%
|
8.00
|
%
|
||||
|
Rate of compensation increase
|
4.00
|
%
|
4.00
|
%
|
||||
|
Target
|
Percentage of Plan
|
|||||||||||
|
Allocation
|
Assets at March 31,
|
|||||||||||
|
2011
|
2010
|
2009
|
||||||||||
|
Plan Assets
|
||||||||||||
|
Equity securities
|
99
|
%
|
99
|
%
|
99
|
%
|
||||||
|
Debt securities
|
—
|
—
|
—
|
|||||||||
|
Real estate
|
—
|
—
|
—
|
|||||||||
|
Cash
|
1
|
1
|
1
|
|||||||||
|
Total
|
100
|
%
|
100
|
%
|
100
|
%
|
||||||
All securities, which are valued at fair market value, are considered to be level 1, due to their public active market.
Expected Return on Plan Assets
The expected long-term rate of return on Plan assets is 8.00%. The Company expects 8.00% to fall within the 40-to-50 percentile range of returns on investment portfolios with asset diversification similar to that of the Plan’s target asset allocation.
Investment Policy and Strategy
The Company maintains an investment policy designed to achieve a long-term rate of return, including investment income through dividends and equity appreciation, sufficient to meet the actuarial requirements of the Plan. The Company seeks to accomplish its return objectives by prudently investing in a diversified portfolio of public company equities with broad industry representation seeking to provide long-term growth consistent with the performance of relevant market indices, as well as maintain an adequate level of liquidity for pension distributions as they fall due. The strategy of being fully invested in equities has historically provided greater rates of return over extended periods of time. The Company’s gain on plan assets during 2010 was 46.8% as compared to the S&P 500 unaudited gain of 46.6%. Plan assets include Company common stock with a fair market value of $8,784,000 as of March 31, 2010 and $5,973,000 as of March 31, 2009.
Cash Flows
Expected contributions for fiscal year ending March 31, 2011 (in thousands):
|
Expected Employer Contributions
|
$
|
—
|
||
|
Expected Employee Contributions
|
—
|
21
Notes to Consolidated Financial Statements
Estimated future benefit payments reflecting expected future service for the fiscal years ending March 31 (in thousands):
|
2011
|
$
|
4,321
|
||
|
2012
|
4,656
|
|||
|
2013
|
4,886
|
|||
|
2014
|
5,230
|
|||
|
2015
|
5,635
|
|||
|
2016-2020
|
35,032
|
The Company also has Employees’ Savings 401(k) Plans covering all employees who meet certain age-entry requirements and work a stated minimum number of hours per year. Participants may make contributions up to the legal limit. The Company’s matching contributions are discretionary. Costs charged to operations for the Company’s matching contributions amounted to $1,706,000, $1,576,000, and $1,747,000, in fiscal 2010, 2009, and 2008, respectively.
8. Fair Value of Financial Instruments
The carrying amount and estimated fair values of the Company’s debt are summarized as follows:
|
2010
|
2009
|
|||||||||||||||
|
Carrying
|
Estimated
|
Carrying
|
Estimated
|
|||||||||||||
|
Amount
|
Fair Value
|
Amount
|
Fair Value
|
|||||||||||||
|
(In thousands)
|
||||||||||||||||
|
Long-term debt, including current portion
|
$
|
214,280
|
$
|
212,035
|
$
|
230,802
|
$
|
228,492
|
||||||||
The estimated fair value for long-term debt is determined by the quoted market prices for similar debt (comparable to the Company’s financial strength) or current rates offered to the Company for debt with the same maturities.
9. Inventories
Effective December 30, 2007 (beginning of 4th quarter of Fiscal Year 2008), the Company decided to change its inventory valuation method from the lower of cost; determined under the FIFO method; or market, to the lower of cost; determined under the LIFO method; or market. In the high inflation environment that the Company was experiencing, the Company believed that the LIFO inventory method was preferable over the FIFO method because it better compares the cost of current production to current revenue. Selling prices are established to reflect current market activity, which recognizes the increasing costs. Under FIFO, revenue and costs are not aligned. Under LIFO, the current cost of sales is matched to the current revenue. The Company determined that retrospective application of LIFO for periods prior to fiscal 2008 was impracticable because the period-specific information necessary to analyze inventories, including inventories acquired as part of the fiscal 2007 Signature acquisition, were not readily available and could not be precisely determined at the appropriate level of detail, including the commodity, size and item code information necessary to perform the detailed calculations required to retrospectively compute the internal LIFO indices applicable to fiscal 2007 and prior years. The effect of this change was to reduce net earnings by $7,307,000, $37,917,000 and $18,307,000 in 2010, 2009, and 2008, respectively, below that which would have been reported using the Company’s previous inventory method. The reduction in earnings per share was $0.61 ($0.60 diluted), $3.12 ($3.09 diluted), and $1.50 per share ($1.49 diluted) in 2010, 2009, and 2008, respectively. The inventories by category and the impact of implementing the LIFO method are shown in the following table:
|
2010
|
2009
|
2008
|
||||||||||
|
(In thousands)
|
||||||||||||
|
Finished products
|
$
|
407,403
|
$
|
325,549
|
$
|
294,708
|
||||||
|
In process
|
14,813
|
29,864
|
19,757
|
|||||||||
|
Raw materials and supplies
|
121,988
|
124,040
|
109,386
|
|||||||||
|
544,204
|
479,453
|
423,851
|
||||||||||
|
Less excess of FIFO cost over LIFO cost
|
97,740
|
86,498
|
28,165
|
|||||||||
|
Total inventories
|
$
|
446,464
|
$
|
392,955
|
$
|
395,686
|
||||||
10. Other Operating Income and Expense
Other operating expense in 2010 of $156,000 is from the loss on disposal of certain fixed assets.
Other operating expense in 2009 consisted of a gain of $150,000 from the sale of an aircraft and a loss of $774,000 on other items including the disposal of certain fixed assets.
Other operating income in 2008 consisted of a gain from energy credits of $423,000, a gain of $299,000 from the sale of certain fixed assets and a loss of $491,000 from the disposal of certain fixed assets.
22
Notes to Consolidated Financial Statements
11. Segment Information
The Company manages its business on the basis of two reportable segments — the primary segment is the processing and sale of fruits and vegetables and secondarily, the processing and sale of snack products. The Company markets its product almost entirely in the United States. Export sales represent 7.9%, 8.2%, and 9.7% of total sales in 2010, 2009, and 2008, respectively. The Company has an Alliance Agreement with GMOL whereby the Company processes canned and frozen vegetables for GMOL under the Green Giant brand name. On September 28, 2009, the Company, GMOL and General Mills, Inc. entered into a Second Amended and Restated Alliance Agreement (the “Alliance Agreement”) pursuant to which certain provisions were modified to (i) amend numerous definitions to reflect current practices and various changes in the administrative and working capital costs included in the calculation of fees payable to the Company under the Alliance Agreement (resulting in a net increase of such components of the calculation); (ii) provide that the tolling fee per standard case paid to the Company shall be modified each year using an index to account for inflation factors, but in no event less than a base tolling fee; (iii) clarify risk allocation for losses related to damage claims not covered by insurance; (iv) require release of GMOL’s lien on certain core plants used by the Company to perform the Services upon the Company’s final note payment to GMOL on September 30, 2009; (v) provide that the remaining depreciation and lease costs related to certain closed plants reduce the final note payment on September 30, 2009; and (vi) reduce the termination fee and extend the length of the advance notice time period required to terminate the Alliance Agreement without cause. GMOL continues to be responsible for all of the sales, marketing, and customer service functions for the Green Giant products. In 2010, 2009, and 2008, the sale of Green Giant vegetables accounted for 19%, 18%, and 19% of net sales, respectively. “Other” in the table below represents activity related to can sales, trucking, seed sales, and flight operations. The following information is presented in accordance with ASC 280, “Disclosure about Segments of an Enterprise and Related Information”:
|
Fruit and
|
||||||||||||||||
|
Vegetable
|
Snack
|
Other
|
Total
|
|||||||||||||
|
(In thousands)
|
||||||||||||||||
|
2010:
|
||||||||||||||||
|
Net sales
|
$
|
1,239,084
|
$
|
21,287
|
$
|
19,739
|
$
|
1,280,110
|
||||||||
|
Operating income (loss)
|
85,106
|
327
|
(435
|
)
|
84,998
|
|||||||||||
|
Identifiable assets
|
711,058
|
6,293
|
1,982
|
719,333
|
||||||||||||
|
Capital expenditures
|
20,714
|
69
|
—
|
20,783
|
||||||||||||
|
Depreciation and amortization
|
21,436
|
484
|
495
|
22,415
|
||||||||||||
|
2009:
|
||||||||||||||||
|
Net sales
|
$
|
1,242,722
|
$
|
15,498
|
$
|
22,464
|
$
|
1,280,684
|
||||||||
|
Operating income (loss)
|
51,184
|
(1,856
|
)
|
(1,140
|
)
|
48,188
|
||||||||||
|
Identifiable assets
|
667,211
|
6,009
|
2,385
|
675,605
|
||||||||||||
|
Capital expenditures
|
22,929
|
211
|
58
|
23,198
|
||||||||||||
|
Depreciation and amortization
|
20,805
|
645
|
576
|
22,026
|
||||||||||||
|
2008:
|
||||||||||||||||
|
Net sales
|
$
|
1,051,960
|
$
|
14,996
|
$
|
13,768
|
$
|
1,080,724
|
||||||||
|
Operating income (loss)
|
34,841
|
(1,474
|
)
|
(514
|
)
|
32,853
|
||||||||||
|
Identifiable assets
|
662,260
|
6,633
|
3,127
|
672,020
|
||||||||||||
|
Capital expenditures
|
29,166
|
2,002
|
1,685
|
32,853
|
||||||||||||
|
Depreciation and amortization
|
21,547
|
527
|
595
|
22,669
|
||||||||||||
The fruit and vegetable segment, consisting of GMOL, canned vegetables, fruit and frozen vegetables, represented 99%, 99% and 99% of assets and 101%, 107% and 116% of pre-tax earnings in 2010, 2009, and 2008, respectively.
|
Classes of similar
|
||||||||||||
|
products/services:
|
2010
|
2009
|
2008
|
|||||||||
|
(In thousands)
|
||||||||||||
|
Net Sales:
|
||||||||||||
|
GMOL*
|
$
|
239,622
|
$
|
231,712
|
$
|
201,676
|
||||||
|
Canned vegetables
|
750,751
|
732,146
|
616,636
|
|||||||||
|
Frozen vegetables*
|
48,320
|
44,967
|
39,880
|
|||||||||
|
Fruit
|
200,391
|
233,897
|
193,768
|
|||||||||
|
Snack
|
21,287
|
15,498
|
14,996
|
|||||||||
|
Other
|
19,739
|
22,464
|
13,768
|
|||||||||
|
Total
|
$
|
1,280,110
|
$
|
1,280,684
|
$
|
1,080,724
|
||||||
|
*
|
GMOL includes frozen vegetable sales exclusively for GMOL.
|
12. Legal Proceedings and Other Contingencies
In the ordinary course of its business, the Company is made a party to certain legal proceedings seeking monetary damages, including proceedings involving product liability claims, workers’ compensation and other employee claims, tort and other general liability claims, for which it carries insurance, as well as patent infringement and related litigation. The Company is in a highly regulated industry and is also periodically involved in government actions for regulatory violations and other matters surrounding the manufacturing of its products, including, but not limited to, environmental, employee, and product safety issues. While it is not feasible to predict or determine the ultimate outcome of these matters, the Company does not believe that an adverse decision in any of these legal proceedings would have a material adverse impact on its financial position, results of operations, or cash flows.
23
Notes to Consolidated Financial Statements
The Company is one of a number of business and local government entities which contributed waste materials to a landfill in Yates County in upstate New York, which was operated by a party unrelated to the Company primarily in the 1970’s through the early 1980’s. The Company’s wastes at the landfill were primarily food and juice products. The landfill contained some hazardous materials and was remediated by the State of New York. In 2004, the New York Attorney General advised the Company and other known non-governmental waste contributors that New York has sustained a total remediation cost of $4.9 million and sought recovery of half that cost from the non-governmental waste contributors. The Company was one of four identified contributors who cooperatively investigated the history of the landfill so as to identify other responsible parties. This claim was settled during 2009 and did not have a material impact on the Company’s financial position or results of operations.
On August 2, 2007, the Company received two civil citations from CalOSHA (the California state agency responsible for enforcing occupational safety and health regulations), relating to the accidental death of a warehouse employee at the Company’s Modesto facility on February 5, 2007. The Company is appealing the citations to the California Occupational Safety and Health Appeals Board, and the hearing is scheduled in early June 2010. While it is not feasible to predict or determine the ultimate outcome of the CalOSHA matter, the Company does not believe that an adverse decision in any of these legal proceedings would have a material adverse impact on its financial position, results of operations, or cash flows.
On February 8, 2008, a subsidiary of the Company was named as a defendant in a criminal action in Stanislaus County, California, relating to the above accident at the Modesto facility. The complaint alleged a felony violation of sec. 6425(a) of the California Labor Code by a subsidiary of the Company. The criminal charges were dropped and a civil settlement was reached during fiscal year 2009 without a material adverse impact on the Company’s financial position, results of operations, or cash flows.
13. Plant Restructuring
During 2010, there were no material adjustments to Plant Restructuring.
During the third fiscal quarter of 2009, the Company announced a Voluntary Workforce Reduction Program at its plant in Modesto, California which resulted in a restructuring charge for severance costs of $904,000. This program, which resulted in a more efficient operation, was completed in January 2009. This charge is included under Plant Restructuring in the Consolidated Statements of Net Earnings.
In March 2008, the Company contributed its Coleman, Wisconsin plant to a not-for-profit corporation specializing in real estate and recorded a non-cash impairment charge of $445,000. This plant had been idled in fiscal 2005.
In 2006, the Company announced the phase out of the Salem labeling operation which resulted in a restructuring charge of $1,754,000 consisting of a provision for future lease payments of $1,306,000, a cash severance charge of $369,000, and a non-cash impairment charge of $79,000. In 2007, the Company recorded an additional restructuring charge of $657,000 consisting of a provision for future lease payments of $420,000, a cash severance charge of $151,000, a cash union pension charge of $69,000 and a non-cash impairment charge of $17,000. The lease on the Salem warehouse expired in February 2008. During 2008, the non-cash impairment charge was increased by $52,000 related to this Salem warehouse. The other costs relate to outstanding lease payments which will be paid over the remaining lives of the corresponding lease terms, which are up to five years.
The following table summarizes the restructuring and related asset impairment charges recorded and the accruals established during 2008, 2009 and 2010:
|
Long-Lived
|
||||||||||||||||
|
Asset
|
Other
|
|||||||||||||||
|
Severance
|
Charges
|
Costs
|
Total
|
|||||||||||||
|
(In thousands)
|
||||||||||||||||
|
Total expected restructuring charge
|
$
|
2,152
|
$
|
5,749
|
$
|
3,926
|
$
|
11,827
|
||||||||
|
Balance March 31, 2007
|
$
|
84
|
$
|
267
|
$
|
2,329
|
$
|
2,680
|
||||||||
|
Third-quarter charge to expense
|
—
|
—
|
104
|
104
|
||||||||||||
|
Cash payments/write offs
|
(84
|
)
|
(462
|
)
|
(1,095
|
)
|
(1,641
|
)
|
||||||||
|
Fourth-quarter charge (credit) to expense
|
—
|
445
|
(52
|
)
|
393
|
|||||||||||
|
Balance March 31, 2008
|
$
|
—
|
$
|
250
|
$
|
1,286
|
$
|
1,536
|
||||||||
|
Third-quarter charge (credit) to expense
|
904
|
—
|
(3
|
)
|
901
|
|||||||||||
|
Cash payments/write offs
|
(904
|
)
|
—
|
(246
|
)
|
(1,150
|
)
|
|||||||||
|
Fourth-quarter credit to expense
|
—
|
—
|
(2
|
)
|
(2
|
)
|
||||||||||
|
Balance March 31, 2009
|
$
|
—
|
$
|
250
|
$
|
1,035
|
$
|
1,285
|
||||||||
|
Third-quarter charge to expense
|
—
|
—
|
19
|
19
|
||||||||||||
|
Cash payments/write offs
|
—
|
—
|
(258
|
)
|
(258
|
)
|
||||||||||
|
Fourth-quarter credit to expense
|
—
|
—
|
(2
|
)
|
(2
|
)
|
||||||||||
|
Balance March 31, 2010
|
$
|
—
|
$
|
250
|
$
|
794
|
$
|
1,044
|
||||||||
|
Total costs incurred to date
|
$
|
2,152
|
$
|
5,499
|
$
|
3,132
|
$
|
10,783
|
||||||||
24
Report of Independent Registered Public Accounting Firm
Board of Directors and Stockholders
Seneca Foods Corporation
Marion, New York
We have audited the accompanying consolidated balance sheets of Seneca Foods Corporation as of March 31, 2010 and 2009 and the related consolidated statements of net earnings, stockholders’ equity, and cash flows for each of the three years in the period ended March 31, 2010. These financial statements are the responsibility of the Company’s management. Our responsibility is to express an opinion on these financial statements based on our audits.
We conducted our audits in accordance with the standards of the Public Company Accounting Oversight Board (United States). Those standards require that we plan and perform the audit to obtain reasonable assurance about whether the financial statements are free of material misstatement. An audit includes examining, on a test basis, evidence supporting the amounts and disclosures in the financial statements, assessing the accounting principles used and significant estimates made by management, as well as evaluating the overall financial statement presentation. We believe that our audits provide a reasonable basis for our opinion.
In our opinion, the consolidated financial statements referred to above present fairly, in all material respects, the financial position of Seneca Foods Corporation at March 31, 2010 and 2009, and the results of its operations and its cash flows for each of the three years in the period ended March 31, 2010 in conformity with accounting principles generally accepted in the United States of America.
As discussed in Note 5 to the consolidated financial statements, the Company adopted the provisions of Accounting Standards Codification 740, Income Taxes (formerly Statement of Financial Accounting Standards (SFAS) Interpretation No. 48 “Accounting for Uncertain Income Taxes — an Interpretation of SFAS Statement No. 109”), on April 1, 2007.
As discussed in Note 9 to the consolidated financial statements, effective December 30, 2007 the Company changed its inventory valuation method from the lower of cost; determined under the first-in, first-out (FIFO) method; or market, to the lower of cost; determined under the last-in, first-out (LIFO) method; or market.
We also have audited, in accordance with the standards of the Public Company Accounting Oversight Board (United States), Seneca Foods Corporation’s internal control over financial reporting as of March 31, 2010, based on criteria established in Internal Control — Integrated Framework issued by the Committee of Sponsoring Organizations of the Treadway Commission (COSO) and our report dated May 26, 2010 expressed an unqualified opinion thereon.
/s/BDO Seidman, LLP
Milwaukee, Wisconsin
May 26, 2010
25
Report of Independent Registered Public Accounting Firm on
Internal Control Over Financial Reporting
Board of Directors and Stockholders
Seneca Foods Corporation
Marion, New York
We have audited Seneca Foods Corporation’s internal control over financial reporting as of March 31, 2010, based on criteria established in Internal Control-Integrated Framework issued by the Committee of Sponsoring Organizations of the Treadway Commission (the COSO criteria). The Company’s management is responsible for maintaining effective internal control over financial reporting and for its assessment of the effectiveness of internal control over financial reporting, included in the Form 10-K, Management’s Annual Report on Internal Control Over Financial Reporting. Our responsibility is to express an opinion on the Company’s internal control over financial reporting based on our audit.
We conducted our audit in accordance with the standards of the Public Company Accounting Oversight Board (United States). Those standards require that we plan and perform the audit to obtain reasonable assurance about whether effective internal control over financial reporting was maintained in all material respects. Our audit included obtaining an understanding of internal control over financial reporting, assessing the risk that a material weakness exists, and testing and evaluating the design and operating effectiveness of internal control based on the assessed risk. Our audit also included performing such other procedures as we considered necessary in the circumstances. We believe that our audit provides a reasonable basis for our opinion.
A company’s internal control over financial reporting is a process designed to provide reasonable assurance regarding the reliability of financial reporting and the preparation of financial statements for external purposes in accordance with generally accepted accounting principles. A company’s internal control over financial reporting includes those policies and procedures that (1) pertain to the maintenance of records that, in reasonable detail, accurately and fairly reflect the transactions and dispositions of the assets of the company; (2) provide reasonable assurance that transactions are recorded as necessary to permit preparation of financial statements in accordance with generally accepted accounting principles, and that receipts and expenditures of the company are being made only in accordance with authorizations of management and directors of the company; and (3) provide reasonable assurance regarding prevention or timely detection of unauthorized acquisition, use, or disposition of the company’s assets that could have a material effect on the financial statements.
Because of its inherent limitations, internal control over financial reporting may not prevent or detect misstatements. Also, projections of any evaluation of effectiveness to future periods are subject to the risk that controls may become inadequate because of changes in conditions, or that the degree of compliance with the policies or procedures may deteriorate.
In our opinion, the Company maintained, in all material respects, effective internal control over financial reporting as of March 31, 2010, based on the COSO criteria.
We have also audited, in accordance with the standards of the Public Company Accounting Standards Board (United States), the consolidated balance sheets of Seneca Foods Corporation as of March 31, 2010 and 2009, and the related consolidated statements of net earnings, stockholders’ equity and cash flows for each of the three years in the period ended March 31, 2010 and our report dated May 26, 2010 expressed an unqualified opinion thereon.
/s/BDO Seidman, LLP
Milwaukee, Wisconsin
May 26, 2010
26
Shareholder Information and Quarterly Results
The Company’s common stock is traded on The NASDAQ Global Stock Market. The 8.5 million Class A outstanding shares and 2.2 million Class B outstanding shares are owned by 250 and 232 shareholders of record, respectively. The high and low prices of the Company’s common stock during each quarter of the past two years are shown below:
|
Class A:
|
2010
|
2009
|
||||||||||||||
|
Quarter
|
High
|
Low
|
High
|
Low
|
||||||||||||
|
First
|
$
|
31.97
|
$
|
21.44
|
$
|
21.82
|
$
|
18.71
|
||||||||
|
Second
|
33.49
|
22.14
|
21.39
|
19.23
|
||||||||||||
|
Third
|
28.90
|
21.95
|
19.76
|
15.51
|
||||||||||||
|
Fourth
|
30.10
|
22.90
|
23.95
|
18.76
|
||||||||||||
|
Class B:
|
2010
|
2009
|
||||||||||||||
|
Quarter
|
High
|
Low
|
High
|
Low
|
||||||||||||
|
First
|
$
|
32.46
|
$
|
20.86
|
$
|
22.50
|
$
|
19.61
|
||||||||
|
Second
|
33.17
|
21.79
|
22.50
|
19.00
|
||||||||||||
|
Third
|
28.69
|
21.40
|
23.99
|
16.61
|
||||||||||||
|
Fourth
|
30.15
|
22.82
|
24.00
|
19.75
|
||||||||||||
Common Stock Performance Graph
The graph below shows the cumulative, five year total return for the Company’s Common Stock compared with the NASDAQ Market Index (which includes the Company) and a peer group of companies (described below).
Performance data assumes that $100.00 was invested on March 31, 2005, in the Company’s Class A Common Stock, the NASDAQ Market, and the peer groups. The data assumes the reinvestment of all cash dividends and the cash value of other distributions. Stock price performance shown in the graph is not necessarily indicative of future stock price performance. The companies in the former peer group are H.J. Heinz Company, Del Monte Foods Company, Hanover Foods Corporation, and Hain Celestial Group, Inc. The new peer group removes Heinz and adds Ralcorp Holdings, Inc. and Treehouse Foods, Inc.
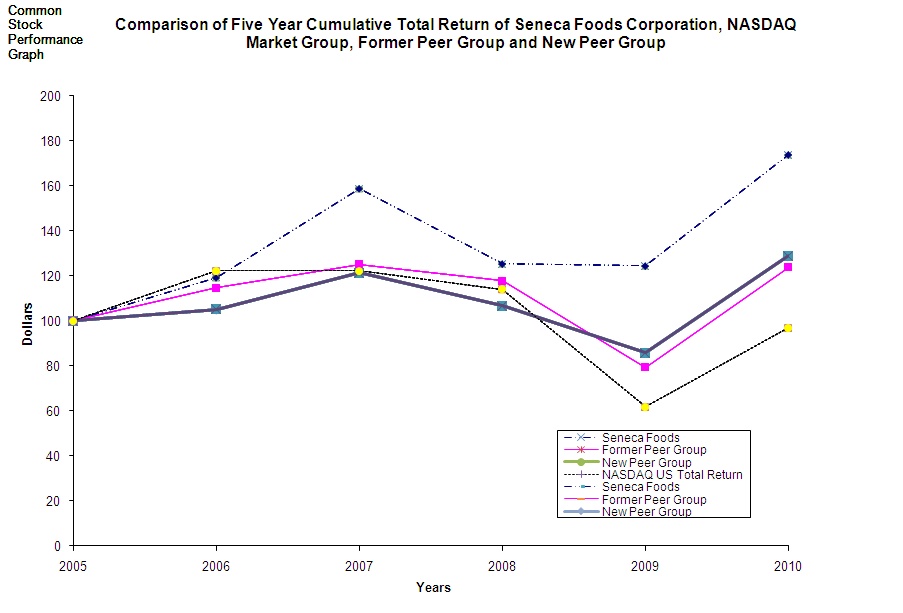
As of March 31, 2010, the most restrictive credit agreement limitation on the Company’s payment of dividends and other distributions, such as purchases of shares, to holders of Class A or Class B Common Stock is an annual total limitation of $500,000, reduced by aggregate annual dividend payments totaling $23,000, which the Company presently pays on two outstanding classes of preferred stock. Payment of dividends to common stockholders is made at the discretion of the Company’s Board of Directors and depends, among other factors, on earnings; capital requirements; and the operating and financial condition of the Company. The Company has not declared or paid a common dividend in many years.
The following is a summary of the unaudited interim results of operations by quarter:
|
First
|
Second
|
Third
|
Fourth
|
|||||||||||||
|
(In thousands, except per share data)
|
||||||||||||||||
|
Year ended March 31, 2010:
|
||||||||||||||||
|
Net sales
|
$
|
230,528
|
$
|
323,205
|
$
|
447,027
|
$
|
279,350
|
||||||||
|
Gross margin
|
35,937
|
38,498
|
48,396
|
27,456
|
||||||||||||
|
Net earnings
|
11,086
|
12,425
|
18,606
|
6,294
|
||||||||||||
|
Basic earnings per common share
|
0.91
|
1.02
|
1.53
|
0.52
|
||||||||||||
|
Diluted earnings per common share
|
0.91
|
1.02
|
1.52
|
0.51
|
||||||||||||
|
Year ended March 31, 2009:
|
||||||||||||||||
|
Net sales
|
$
|
216,713
|
$
|
315,418
|
$
|
463,322
|
$
|
285,231
|
||||||||
|
Gross margin
|
15,862
|
28,804
|
49,010
|
25,871
|
||||||||||||
|
Net (loss) earnings
|
(2,077
|
)
|
4,365
|
13,836
|
2,641
|
|||||||||||
|
Basic (loss) earnings per common share
|
(0.17
|
)
|
0.36
|
1.14
|
0.22
|
|||||||||||
|
Diluted (loss) earnings per common share
|
(0.17
|
)
|
0.36
|
1.13
|
0.22
|
|||||||||||
Earnings for the fourth quarter have historically reflected adjustments of previously estimated raw material cost and production levels. Due to the dependence on the fruit and vegetable yields of the Company’s food processing segment, interim costing must be estimated.
27
Corporate Information
Forward Looking Statements
Except for the historical information contained herein, the matters discussed in this annual report are forward-looking statements as defined in the Private Securities Litigation Reform Act (PSLRA) of 1995. The Company wishes to take advantage of the “safe harbor” provisions of the PSLRA by cautioning that numerous important factors, which involve risks and uncertainties, including but not limited to economic, competitive, governmental, and technological factors affecting the Company’s operations, markets, products, services and prices, and other factors discussed in the Company’s filings with the Securities and Exchange Commission, in the future, could affect the Company’s actual results and could cause its actual consolidated results to differ materially from those expressed in any forward-looking statement made by, or on behalf of, the Company.
Shareholder Information
For investor information, including comprehensive earnings releases: http://www.senecafoods.com/companyprofile/investor.shtml
Annual Meeting
The 2010 Annual Meeting of Shareholders will be held on Thursday, August 5, 2010, beginning at 1:00 P.M. (EDT) at the Company’s offices at 3736 South Main Street, Marion, New York. A formal notice of the meeting, together with a proxy statement and proxy form, will be mailed to shareholders of record as of June 25, 2010.
How To Reach Us
Seneca Foods Corporation
3736 South Main Street
Marion, New York 14505
(315) 926-8100
www.senecafoods.com
senecafoods@senecafoods.com
Additional Information
Annual Report and Other Investor Information
A copy of the Company’s Annual Report on Form 10-K for the fiscal year ended March 31, 2010, as filed with the Securities and Exchange Commission, will be provided by the Company to any shareholder who so requests in writing to:
Roland E. Breunig
Seneca Foods Corporation
418 East Conde Street
Janesville, Wisconsin 53546
(608) 757-6000
This annual report is also available online at www.senecafoods.com
Foundation/Contribution Requests
Seneca Foods Foundation
Cynthia L. Fohrd
3736 South Main Street
Marion, New York 14505
(315) 926-8100
foundation@senecafoods.com
Independent Registered Public Accounting Firm
BDO Seidman, LLP
Milwaukee, Wisconsin
General Counsel
Jaeckle Fleischmann & Mugel, LLP
Buffalo, New York
Transfer Agent and Registrar
Computershare
250 Royal Street
Canton, Massachusetts 02940
(800) 622-6757 (US, Canada, Puerto Rico)
(781) 575-4735 (Non-US)
www.computershare.com/investor
Corporate Governance
http://www.senecafoods.com/companyprofile/governance.shtml
Code of Business Ethics
http://www.senecafoods.com/companyprofile/ethics.pdf
Hotline (800) 213-9185
28