Attached files
| file | filename |
|---|---|
| 8-K - FORM 8-K - General Motors Co | d8k.htm |
| EX-99.1 - NEW RELEASE DATED, MAY 17, 2010 AND FINANCIAL STATEMENTS - General Motors Co | dex991.htm |
 General Motors Company
Q1 2010 Results
May 17, 2010
Exhibit 99.2
***************
***************
***************
***************
***************
***************
***************
***************
***************
***************
***************
***************
***************
***************
***************
***************
***************
***************
***************
***************
***************
************* |
 Forward Looking Statements
In this press release and in related comments by our management,
our use
of the words “expect,”
“anticipate,”
“possible,”
“potential,”
“target,”
“believe,”
“commit,”
“intend,”
“continue,”
“may,”
“would,”
“could,”
“should,”
“project,”
“projected,”
“positioned”
or similar expressions is intended to identify forward-
looking statements that represent our current judgment about possible future
events. We believe these judgments are reasonable, but these statements
are not guarantees of any events or financial results, and our actual
results may differ materially due to a variety of important factors. Among
other items, such factors might include: our ability to realize
production efficiencies and to achieve reductions in costs as a result of
our restructuring initiatives and labor modifications; our ability to
maintain quality control over our vehicles and avoid material vehicle
recalls; our ability to maintain adequate liquidity and financing sources
and an appropriate level of debt, including as required to fund our
planning significant investment in new technology; our ability to realize
successful vehicle applications of new technology; and our ability to
comply with the continuing requirements related to U.S. and other
government support.
GM's most recent annual report on Form 10-K and quarterly report on Form
10-Q provides information about these and other factors, which we may
revise or supplement in future reports to the SEC.
1 |
 Jul
10 – Sep 30
2009
Q4
2009
Q1
2010
GAAP
Net Revenue ($B)
25.1
32.3
31.5
Operating Income ($B)
(1.0)
(3.9)
1.2
Net Income Attr. Common
Stockholders ($B)
(0.9)
(3.5)
0.9
EPS –
Diluted ($/Share)
(2.20)
(8.53)
1.66
Non-
GAAP
EBIT -
Adj. ($B)
(0.6)
(1.0)
1.7
Free Cash Flow ($B)
2.0
(2.9)
1.0
Summary of Q1 2010 Results
2 |
 Q1
Operating Income Walk to EBIT- Adj.
3
($ B)
Q1
2010
Operating Income
1.2
Equity Income
0.4
Non-Controlling Interests
(0.1)
Non-Operating Income
0.3
Earnings Before Interest & Taxes (EBIT)
1.8
Less Adjustments
0.1
EBIT-
Adj.
1.7 |
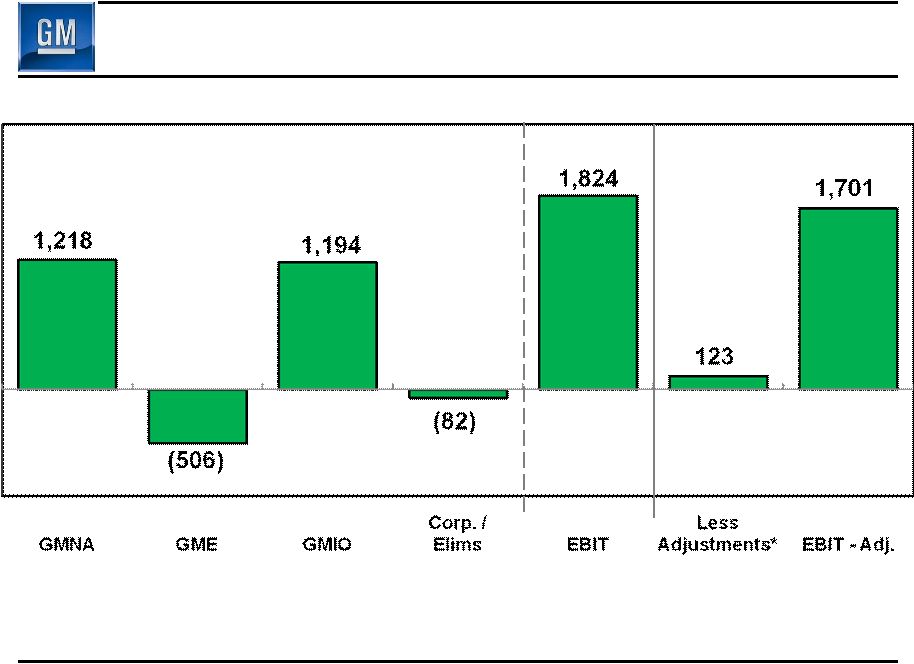 Q1
2010 EBIT & EBIT - Adj.
4
($M)
* Included in Earnings Before Interest and Taxes (EBIT)
Gain on
Saab Sale |
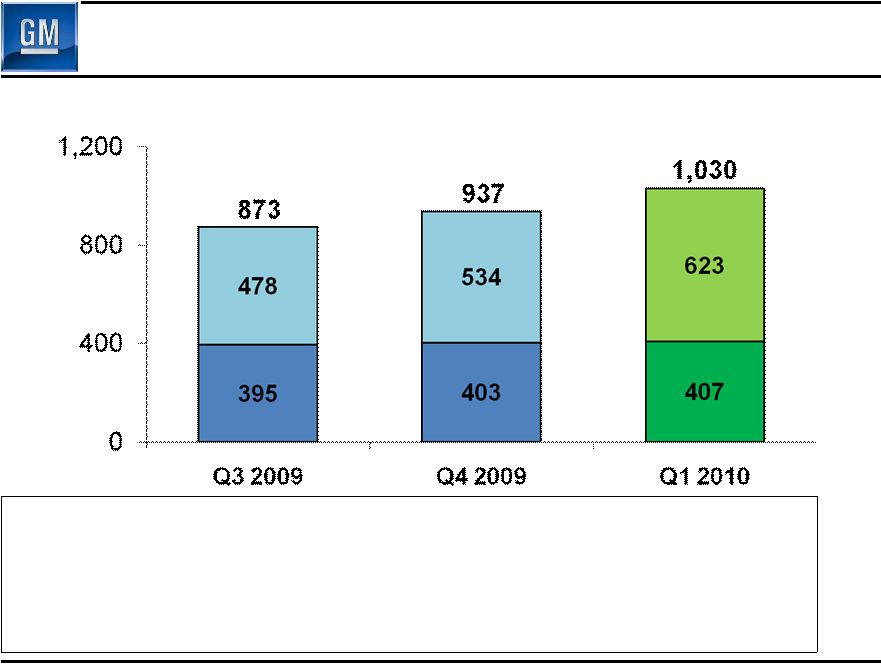
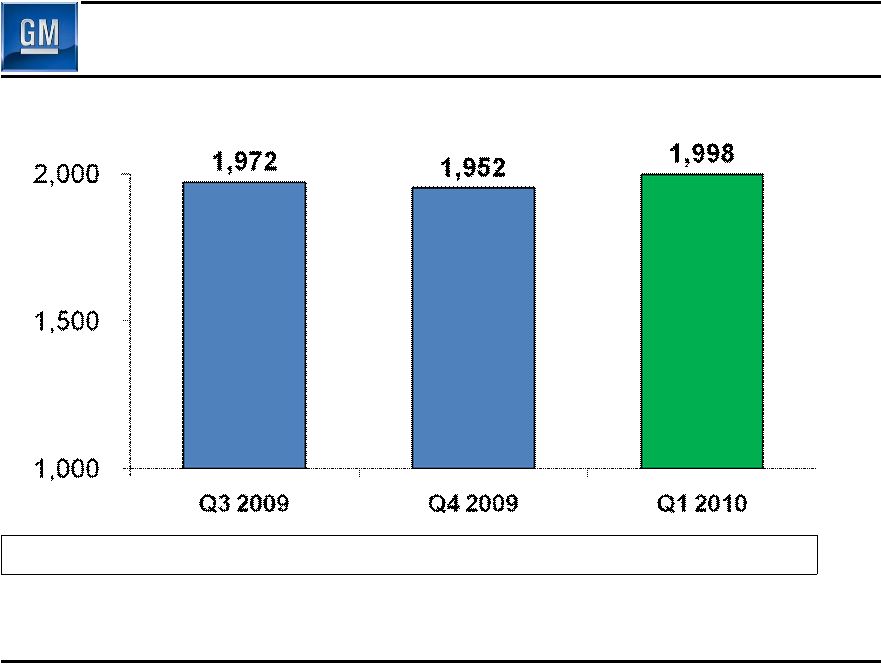 Q1
2010 Global Deliveries 5
(000’s)
Global Share
11.8%
11.5%
11.2%
GM deliveries & market share includes vehicles sold around the world under GM
and JV brands and through GM branded distribution network
|
 Q1
2010 GMNA Deliveries 6
(000’s)
GMNA Share
18.7%
19.3%
17.8%
U.S. Share
19.4%
20.2%
18.4%
U.S. 4 Brand Share
16.7%
18.6%
18.1%
Discontinued
Brands
Chevy, Buick,
GMC, Cadillac
690
637
563 |
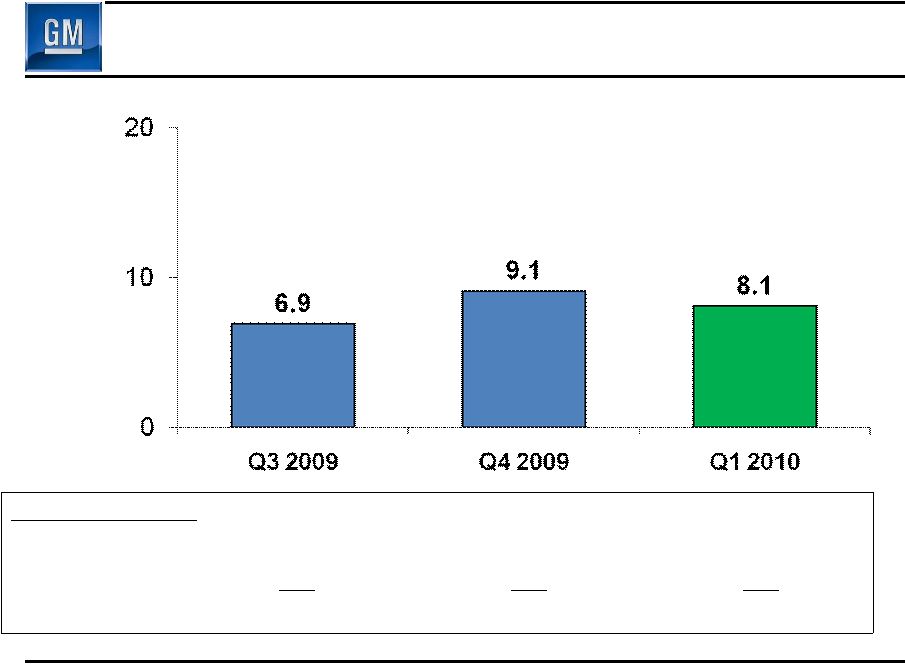
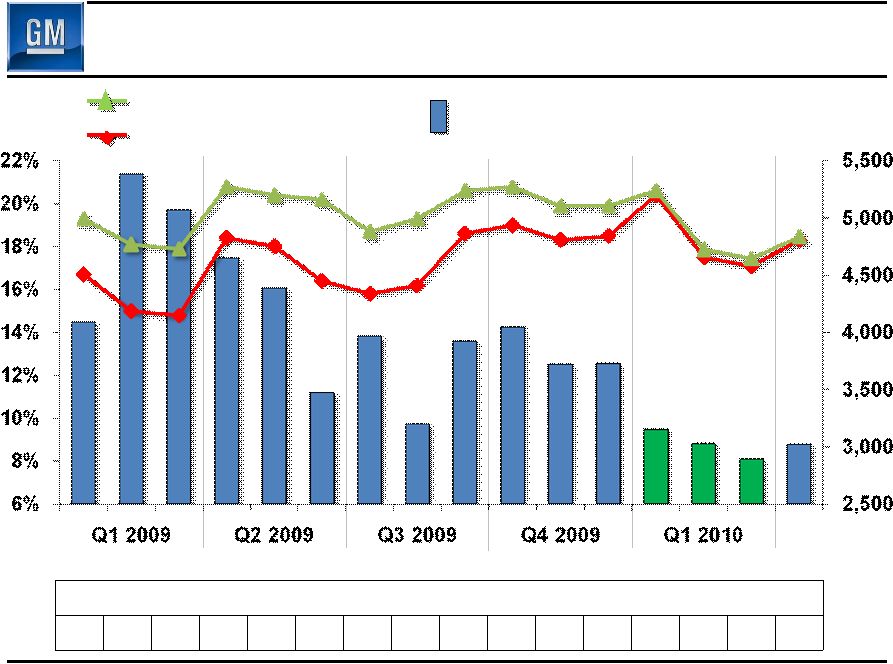 Key
GMNA Performance Indicators 7
GM Average U.S. Retail Incentive (4 Brand) % of Industry Average
127
152
143
137
137
121
143
135
149
154
141
132
119
106
98
108
Share
$/Unit
U.S. 4 Brand Share
U.S. Total Share
Apr
2010
Avg. GM U.S. Retail
Incentive –
4 Brands
Note: Incentive Information Based on J.D. Power and Associates Power
Information Network data |
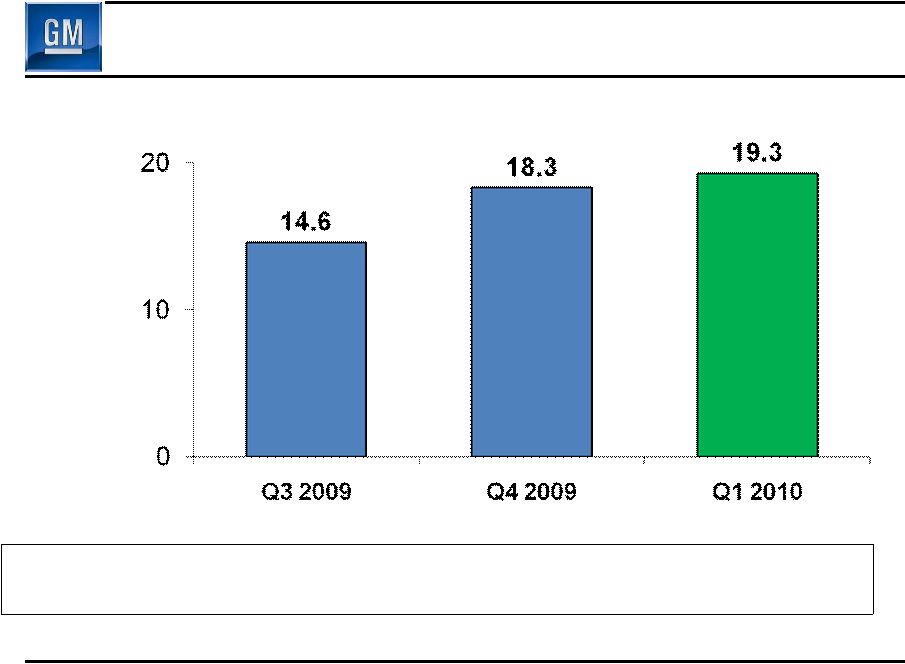 Q1
2010 GMNA Net Revenue 8
($B)
GMNA Production (000’s)
531
616
668
U.S. Dealer Inv (000’s)
424
385
428
Q3 2009 represents combined net revenue for GM and Old GM
|
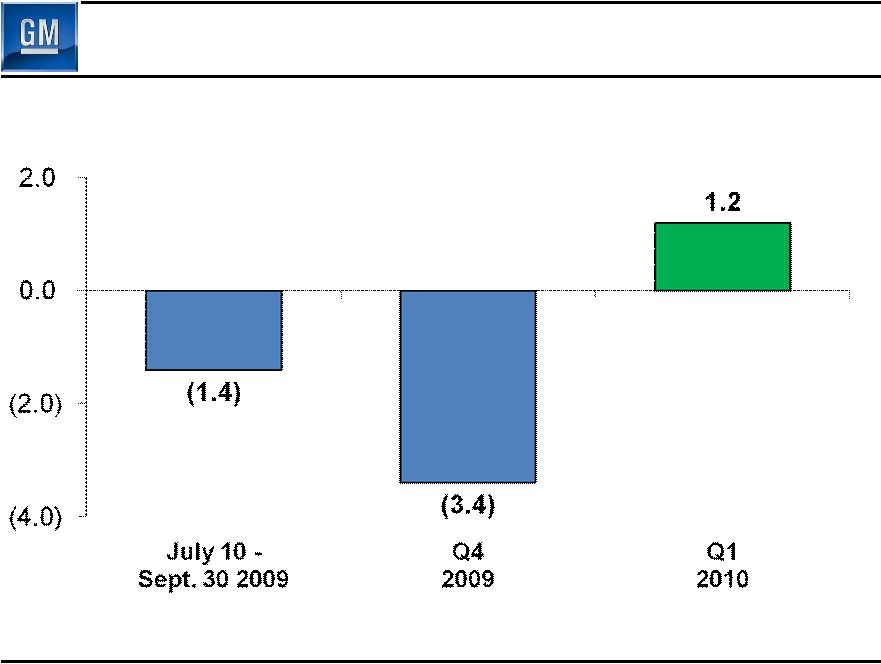 Q1
2010 GMNA Earnings Before Interest & Taxes 9
($B) |
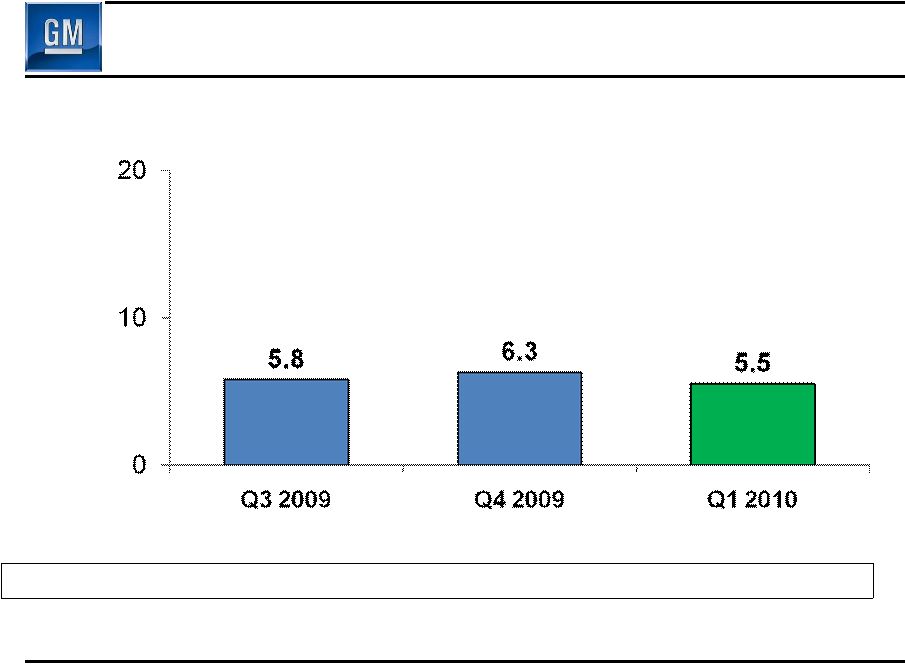
 Q1
2010 GME Deliveries 10
(000’s)
GME Share
8.9%
8.2%
8.5%
Germany Share
9.4%
8.8%
8.2%
U.K. Share
12.0%
11.2%
11.8% |
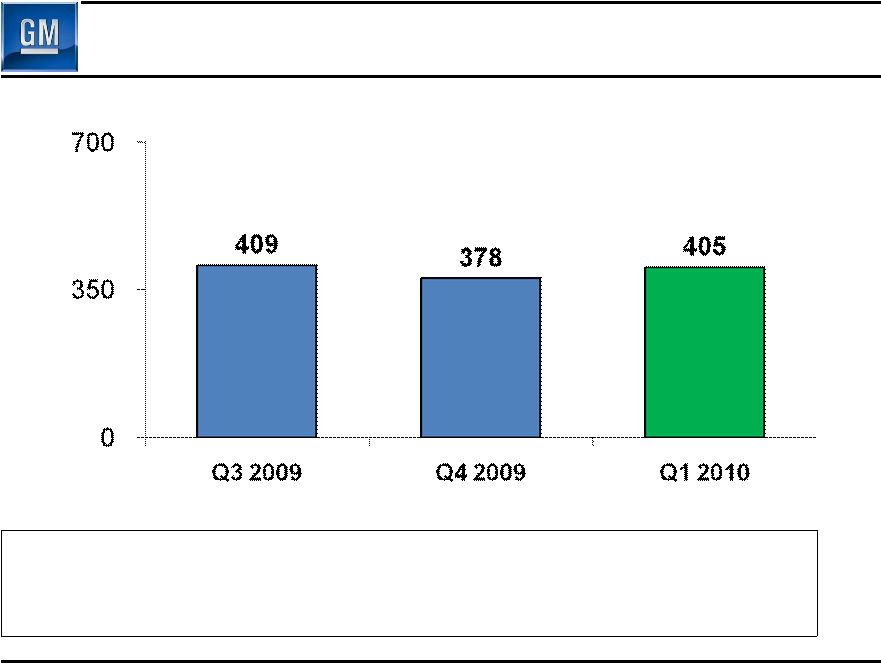
 Q1
2010 GME Net Revenue 11
Total Production (000’s)
277
266
357
($B)
Q3 2009 represents combined net revenue for GM and Old GM
|
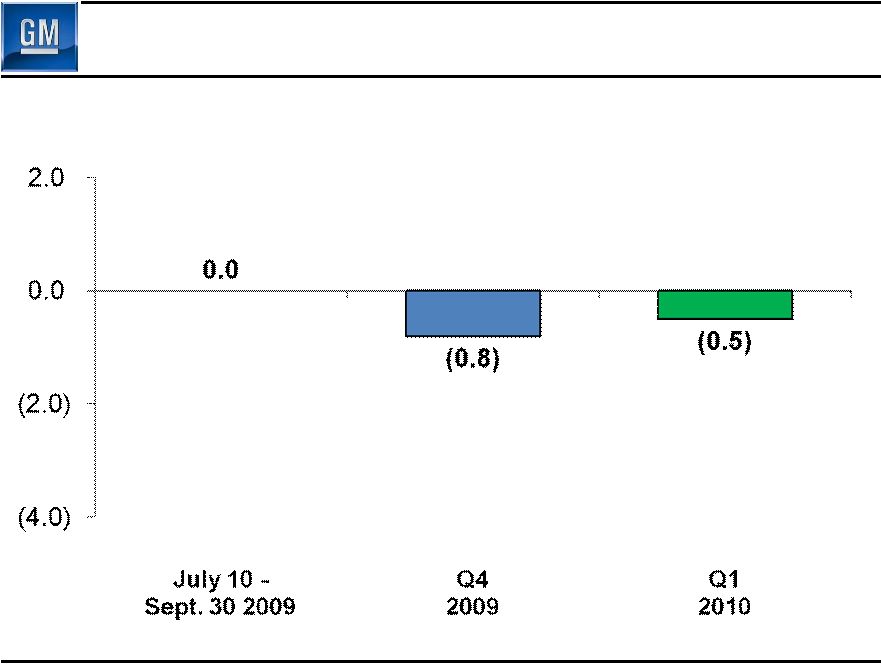 Q1
2010 GME Earnings Before Interest & Taxes 12
($B) |
 Q1
2010 GMIO Deliveries 13
(000’s)
GMIO Share
10.3%
10.3%
10.3%
China Share
13.4%
13.3%
13.5%
Brazil Share
19.8%
18.7%
19.9%
India Share
3.1%
3.7%
4.2%
China
GMIO Excl.
China |
 Q1
2010 GMIO Net Revenue 14
Production (000’s)
Fully Consolidated
414
456
455
Joint Venture
491
584
605
Total
905
1,040
1,060
($B)
Q3 2009 represents combined net revenue for GM and Old GM
|
 Q1
2010 GMIO Earnings Before Interest & Taxes 15
($B)
0.5
0.7
1.2
Equity
Income
Inc. Before
Int/Tax/Equity |
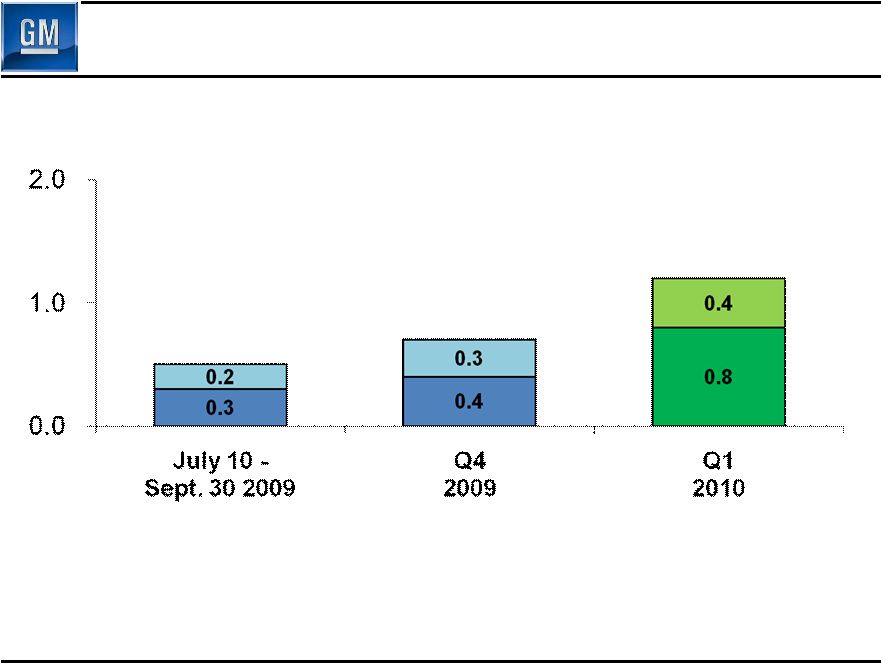
 Cash
Flow 16
($B)
July 10 –
Sept 30
2009
Q4
2009
Q1
2010
Net Income /(Loss)
(0.6)
(3.2)
1.2
Depreciation / Amortization
2.0
2.2
1.8
Working Capital
6.4
(2.1)
(0.7)
Pension / OPEB & Other
(4.9)
1.2
(0.6)
Net cash provided/(used)
operating activities
2.9
(1.9)
1.7
Capital Expenditures
(0.9)
(1.0)
(0.7)
Free Cash Flow
2.0
(2.9)
1.0 |
 Depreciation / Amortization & Cap Ex
17
($M)
July 10 –
Sept 30
2009
Q4
2009
Q1
2010
GMNA
1,348
1,384
1,174
GME
401
551
384
GMIO
170
277
194
Corp / Other
66
44
51
Total Depreciation &
Amortization
1,985
2,256
1,803
Capital Expenditures
881
1,033
755 |
 Key
Balance Sheet Items ($B)
December 31
2009
March 31
2010
Cash & marketable securities*
36.2
35.7
Key Obligations:
Debt
15.8
14.2
Preferred Stock
7.0
7.0
Underfunded Pensions
27.5
26.9
Underfunded OPEB
9.6
9.4
18
* Includes UST & Canadian HC Trust Restricted Cash
|
 Summary
•
Profitable, and positive cash flow
•
U.S. y-o-y 4-brand share up & average retail incentive
down, GMNA breakeven substantially lowered
•
Well positioned to grow profitably in GMIO
•
More work to do in GME
•
Making progress on designing, building and selling the
world's best vehicles
19 |
 General Motors Company
Select Supplemental Financial Information
*****************************
*****************************
*****************************
*****************************
*****************************
******
******
******
******
******
******
******
******
******
******
******
******
******
******
******
******
******
******
******
******
******
******
* |
 Operating Income Walk to EBIT-
Adj
S1
($ Billions)
Jul 10 –
Sep 30
2009
Q4
2009
Q1
2010
Operating Income
(1.0)
(3.9)
1.2
Equity Income
0.2
0.3
0.4
Non-Controlling Interests
(0.3)
(0.2)
(0.1)
Non-Operating Income/(Expense)
0.4
(0.2)
0.3
Earnings Before Interest & Taxes
(0.7)
(4.0)
1.8
Less Adjustments
(0.1)
(3.0)
0.1
EBIT-
Adj.
(0.6)
(1.0)
1.7 |
 Detail of Adjustments
S2
($M)
July 10 –
Sept 30
2009
Q4
2009
Q1
2010
Earnings Before Interest
& Taxes (EBIT)
(741)
(4,046)
1,824
Less Adjustments
-
Gain on Saab Sale
-
-
123
-
VEBA Settlement
-
(2,571)
-
-
GMAC Investment Impairment
-
(270)
-
-
Delphi Related
(110)
(150)
-
-
CAMI Debt Ext.
-
(101)
-
Total Adjustments
(110)
(3,092)
123
EBIT –
Adj.
(631)
(954)
1,701 |
 Restructuring Excluded From Adjustments
S3
($M)
July 10 –
Sept 30
2009
Q4
2009
Q1
2010
GMNA –
Dealer Related
(187)
(88)
(18)
GMNA –
Non-Dealer Related
134
(208)
97
Total GMNA
(53)
(296)
79
Total GME
(9)
(28)
(273)
Total GMIO
(27)
(56)
-
Total
(89)
(380)
(194) |
 GMIO
Joint Ventures S4
Shanghai -
GM
SAIC -
GM
Wuling
FAW -
GM
GM -
Daewoo
GM
Ownership
49%
34%
50%
70%
Deliveries
100%
100%
100%
100%
Market
Share
100%
100%
100%
100%
Revenue
0%
0%
0%
100%
Earnings
49%
Equity Income
34%
Equity Income
50%
Equity Income
70%
After adj. for Non-
Controlling Interest |