Attached files
| file | filename |
|---|---|
| 8-K - 8-K - CF Industries Holdings, Inc. | a10-10609_18k.htm |
Exhibit 99.1
|
|
Corporate Development Supply Chain Sales Finance Legal Operations Human Resources Dv Sc Sa Fi Le Op Hr 2010 Agriculture, Protein & Fertilizer Conference May 20, 2010 CF Industries NYSE: CF |
|
|
Certain statements contained in this communication may constitute “forward-looking statements.” All statements in this communication, other than those relating to historical information or current condition, are forward-looking statements. These forward-looking statements are subject to a number of risks and uncertainties, many of which are beyond our control, which could cause actual results to differ materially from such statements. Important factors that could cause actual results to differ materially from our expectations include, among others: our ability to integrate the businesses of CF Industries and Terra Industries promptly and effectively and to achieve the cost savings and synergies we anticipate from the Terra acquisition within the expected time frame or at all; the potential for disruption from the Terra acquisition to make it more difficult for us to maintain relationships with customers, employees or suppliers; the volatile cost of natural gas in the areas where our production facilities are principally located; the cyclical nature of our business and the agricultural sector; the global commodity nature of our fertilizer products, the impact of global supply and demand on our selling prices, and the intense global competition in the consolidating markets in which we operate; conditions in the U.S. agricultural industry; weather conditions; our inability to accurately predict seasonal demand for our products; the concentration of our sales with certain large customers; the impact of changing market conditions on our Forward Pricing Program; risks involving derivatives and the effectiveness of our risk measurement and hedging activities; the reliance of our operations on a limited number of key facilities and the significant risks and hazards against which we may not be fully insured; reliance on third party transportation providers; risks associated with joint ventures; risks associated with expansion of our business, including unanticipated adverse consequences and the significant resources that could be required; potential liabilities and expenditures related to environmental and health and safety laws and regulations; our potential inability to obtain or maintain required permits and governmental approvals or to meet financial assurance requirements; future regulatory restrictions and requirements related to GHG emissions, climate change or other environmental requirements; acts of terrorism and regulations to combat terrorism; difficulties in securing the supply and delivery of raw materials we use and increases in their costs; risks associated with international operations; losses on our investments in securities; deterioration of global market and economic conditions; our substantial indebtedness and the limitations on our operations imposed by the terms of our indebtedness; our ability to comply with the covenants under our indebtedness and to make payments under such indebtedness when due; potential inability to refinance our indebtedness in connection with any change of control affecting us; and loss of key members of management and professional staff. Forward-looking statements are given only as of the date of this release and we disclaim any obligation to update or revise the forward-looking statements, whether as a result of new information, future events or otherwise, except as required by law. Safe Harbor |
|
|
The New Nitrogen Fertilizer Bellwether |
|
|
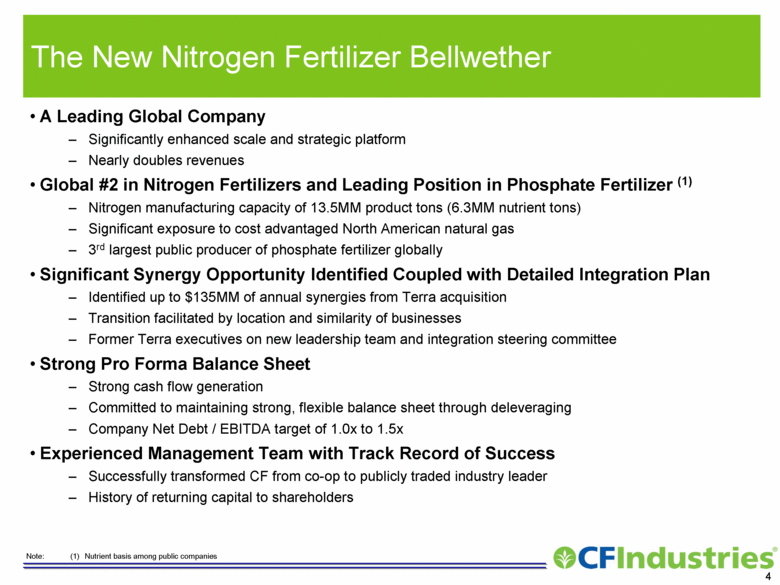
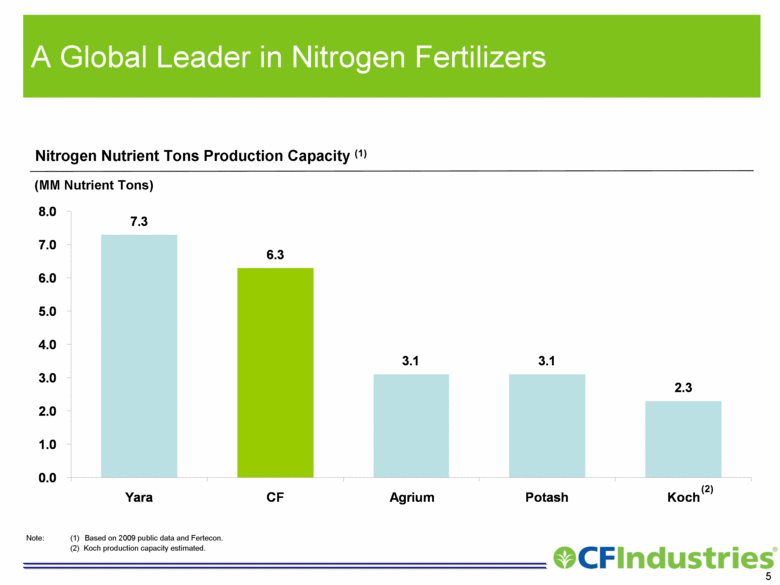
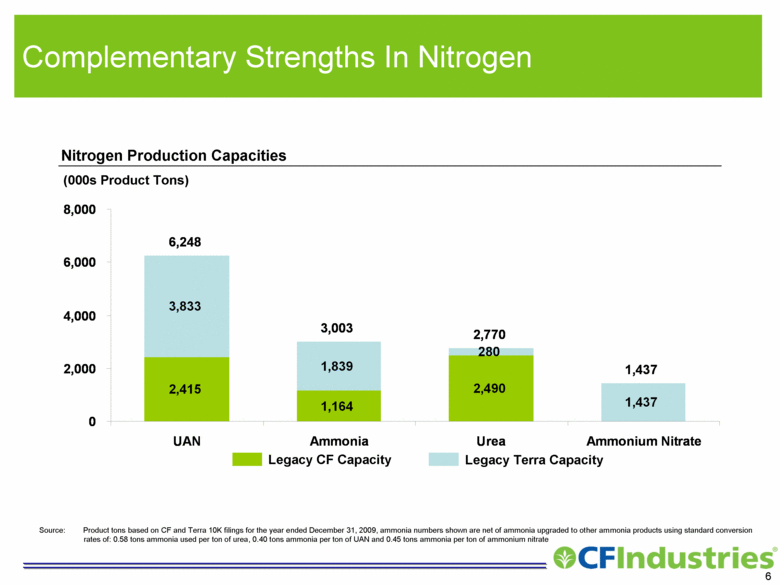
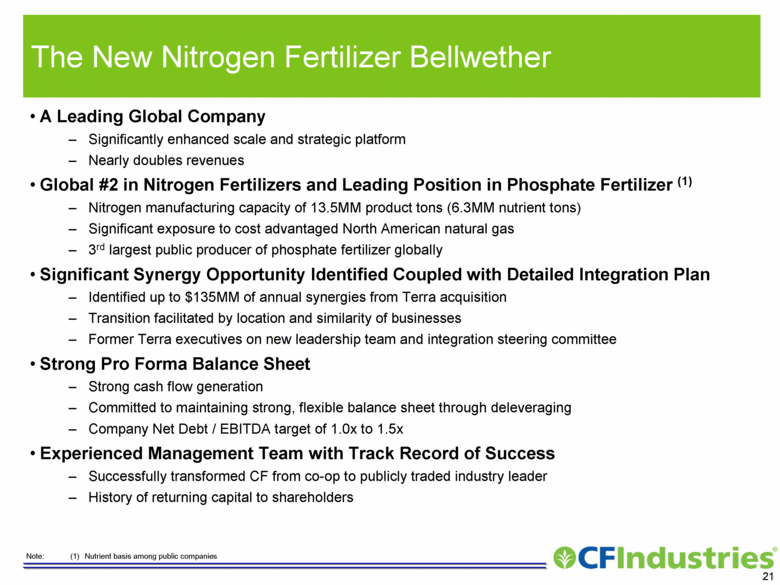
The New Nitrogen Fertilizer Bellwether A Leading Global Company Significantly enhanced scale and strategic platform Nearly doubles revenues Global #2 in Nitrogen Fertilizers and Leading Position in Phosphate Fertilizer (1) Nitrogen manufacturing capacity of 13.5MM product tons (6.3MM nutrient tons) Significant exposure to cost advantaged North American natural gas 3rd largest public producer of phosphate fertilizer globally Significant Synergy Opportunity Identified Coupled with Detailed Integration Plan Identified up to $135MM of annual synergies from Terra acquisition Transition facilitated by location and similarity of businesses Former Terra executives on new leadership team and integration steering committee Strong Pro Forma Balance Sheet Strong cash flow generation Committed to maintaining strong, flexible balance sheet through deleveraging Company Net Debt / EBITDA target of 1.0x to 1.5x Experienced Management Team with Track Record of Success Successfully transformed CF from co-op to publicly traded industry leader History of returning capital to shareholders Note: (1) Nutrient basis among public companies |
|
|
A Global Leader in Nitrogen Fertilizers Nitrogen Nutrient Tons Production Capacity (1) (MM Nutrient Tons) (2) Note: (1) Based on 2009 public data and Fertecon. (2) Koch production capacity estimated. 7.3 6.3 3.1 3.1 2.3 0.0 1.0 2.0 3.0 4.0 5.0 6.0 7.0 8.0 Yara CF Agrium Potash Koch |
|
|
Complementary Strengths In Nitrogen (000s Product Tons) Legacy Terra Capacity Nitrogen Production Capacities Source: Product tons based on CF and Terra 10K filings for the year ended December 31, 2009, ammonia numbers shown are net of ammonia upgraded to other ammonia products using standard conversion rates of: 0.58 tons ammonia used per ton of urea, 0.40 tons ammonia per ton of UAN and 0.45 tons ammonia per ton of ammonium nitrate 2,415 1,164 2,490 3,833 1,839 280 6,248 3,003 2,770 1,437 1,437 0 2,000 4,000 6,000 8,000 UAN Ammonia Urea Ammonium Nitrate Legacy CF Capacity |
|
|
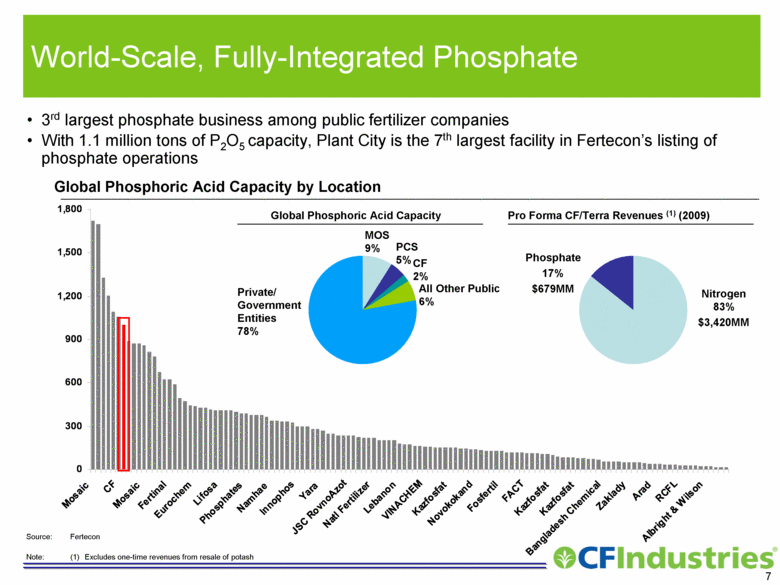
3rd largest phosphate business among public fertilizer companies With 1.1 million tons of P2O5 capacity, Plant City is the 7th largest facility in Fertecon’s listing of phosphate operations World-Scale, Fully-Integrated Phosphate Pro Forma CF/Terra Revenues (1) (2009) Phosphate 17% $679MM Nitrogen 83% $3,420MM Global Phosphoric Acid Capacity by Location Source: Fertecon Global Phosphoric Acid Capacity MOS 9% PCS 5% CF 2% All Other Public 6% Private/Government Entities 78% Note: (1) Excludes one-time revenues from resale of potash 0 300 600 900 1,200 1,500 1,800 Mosaic CF Mosaic Fertinal Eurochem Lifosa Phosphates Namhae Innophos Yara JSC RovnoAzot Natl Fertilizer Lebanon VINACHEM Kazfosfat Novokokand Fosfertil FACT Kazfosfat Kazfosfat Bangladesh Chemical Zaklady Arad RCFL Albright & Wilson |
|
|
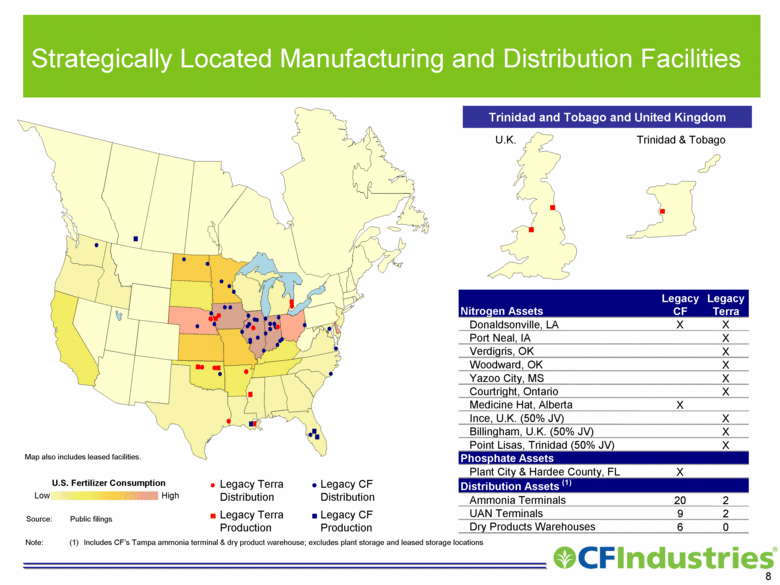
Strategically Located Manufacturing and Distribution Facilities Trinidad & Tobago U.K. Trinidad and Tobago and United Kingdom U.S. Fertilizer Consumption Legacy CF Distribution Legacy CF Production Legacy Terra Production Legacy Terra Distribution Source: Public filings Note: (1) Includes CF’s Tampa ammonia terminal & dry product warehouse; excludes plant storage and leased storage locations Map also includes leased facilities. Nitrogen Assets Legacy CF Legacy Terra Donaldsonville, LA X X Port Neal, IA X Verdigris, OK X Woodward, OK X Yazoo City, MS X Courtright, Ontario X Medicine Hat, Alberta X Ince, U.K. (50% JV) X Billingham, U.K. (50% JV) X Point Lisas, Trinidad (50% JV) X Phosphate Assets Plant City & Hardee County, FL X Distribution Assets (1) Ammonia Terminals 20 2 UAN Terminals 9 2 Dry Products Warehouses 6 0 |
|
|
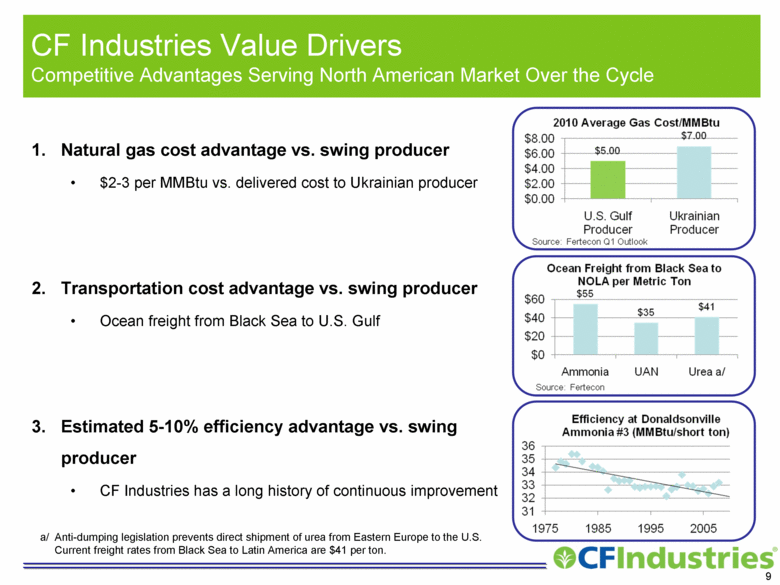
CF Industries Value Drivers Competitive Advantages Serving North American Market Over the Cycle Natural gas cost advantage vs. swing producer $2-3 per MMBtu vs. delivered cost to Ukrainian producer Transportation cost advantage vs. swing producer Ocean freight from Black Sea to U.S. Gulf Estimated 5-10% efficiency advantage vs. swing producer CF Industries has a long history of continuous improvement a/ Anti-dumping legislation prevents direct shipment of urea from Eastern Europe to the U.S. Current freight rates from Black Sea to Latin America are $41 per ton. 2010 Average Gas Cost/MMBtu Ocean Freight from Black Sea to NOLA per Metric Ton Efficiency at Donaldsonville Ammonia #3 (MMBtu/short ton) 1. 2. 3. |
|
|
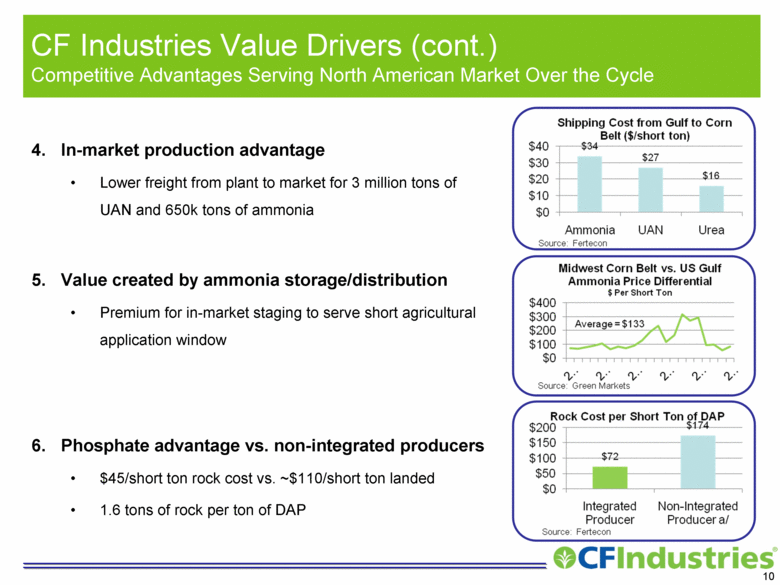
CF Industries Value Drivers (cont.) Competitive Advantages Serving North American Market Over the Cycle In-market production advantage Lower freight from plant to market for 3 million tons of UAN and 650k tons of ammonia Value created by ammonia storage/distribution Premium for in-market staging to serve short agricultural application window Phosphate advantage vs. non-integrated producers $45/short ton rock cost vs. ~$110/short ton landed 1.6 tons of rock per ton of DAP Shipping Cost from Gulf to Corn Belt ($/short ton) Midwest Corn Belt vs. US Gulf Ammonia Price Differential $ Per Short Ton Rock Cost per Short Ton of DAP 4. 5. 6. |
|
|
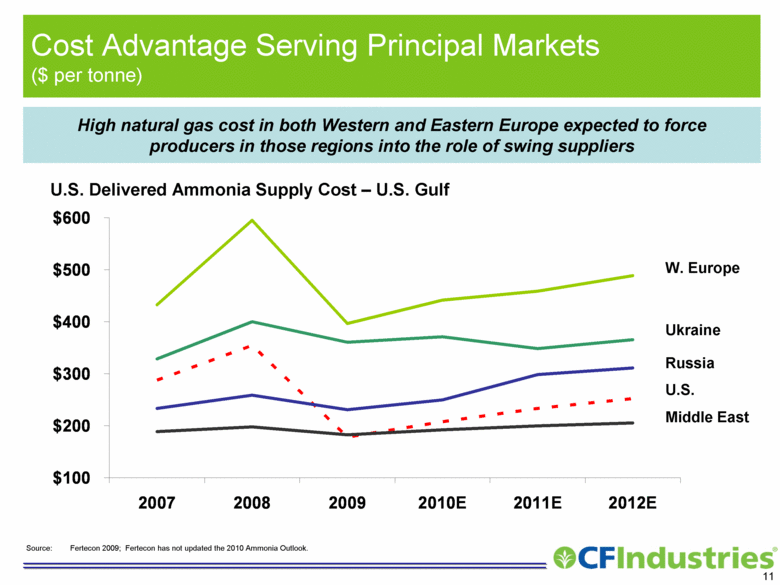
Cost Advantage Serving Principal Markets ($ per tonne) High natural gas cost in both Western and Eastern Europe expected to force producers in those regions into the role of swing suppliers W. Europe Ukraine Russia U.S. Middle East Source: Fertecon 2009; Fertecon has not updated the 2010 Ammonia Outlook. U.S. Delivered Ammonia Supply Cost – U.S. Gulf $100 $200 $300 $400 $500 $600 2007 2008 2009 2010E 2011E 2012E |
|
|
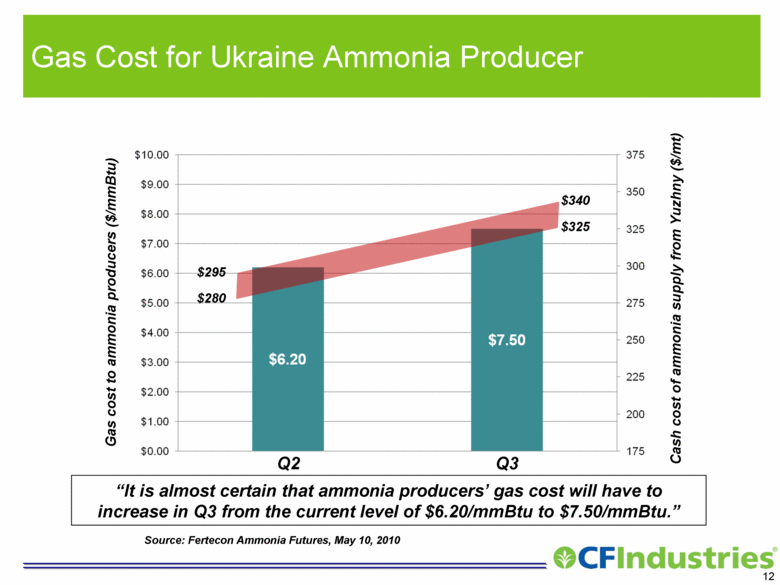
Gas Cost for Ukraine Ammonia Producer Gas cost to ammonia producers ($/mmBtu) Cash cost of ammonia supply from Yuzhny ($/mt) Q2 Q3 $295 $280 $340 $325 “It is almost certain that ammonia producers’ gas cost will have to increase in Q3 from the current level of $6.20/mmBtu to $7.50/mmBtu.” Source: Fertecon Ammonia Futures, May 10, 2010 |
|
|
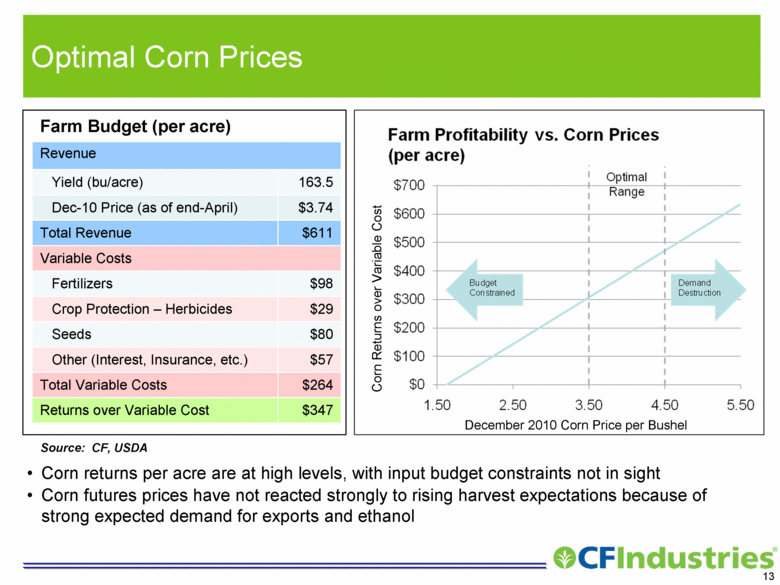
Optimal Corn Prices Farm Budget (per acre) Revenue Yield (bu/acre) 163.5 Dec-10 Price (as of end-April) $3.74 Total Revenue $611 Variable Costs Fertilizers $98 Crop Protection – Herbicides $29 Seeds $80 Other (Interest, Insurance, etc.) $57 Total Variable Costs $264 Returns over Variable Cost $347 December 2010 Corn Price per Bushel Corn Returns over Variable Cost Corn returns per acre are at high levels, with input budget constraints not in sight Corn futures prices have not reacted strongly to rising harvest expectations because of strong expected demand for exports and ethanol Source: CF, USDA |
|
|
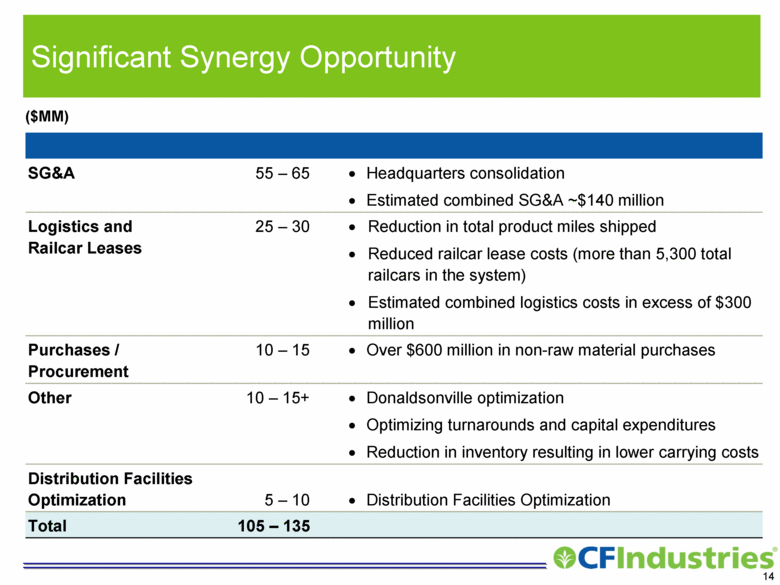
Significant Synergy Opportunity SG&A 55 – 65 Headquarters consolidation Estimated combined SG&A ~$140 million Logistics and Railcar Leases 25 – 30 Reduction in total product miles shipped Reduced railcar lease costs (more than 5,300 total railcars in the system) Estimated combined logistics costs in excess of $300 million Purchases / Procurement 10 – 15 Over $600 million in non-raw material purchases Other 10 – 15+ Donaldsonville optimization Optimizing turnarounds and capital expenditures Reduction in inventory resulting in lower carrying costs Distribution Facilities Optimization 5 – 10 Distribution Facilities Optimization Total 105 – 135 ($MM) |
|
|
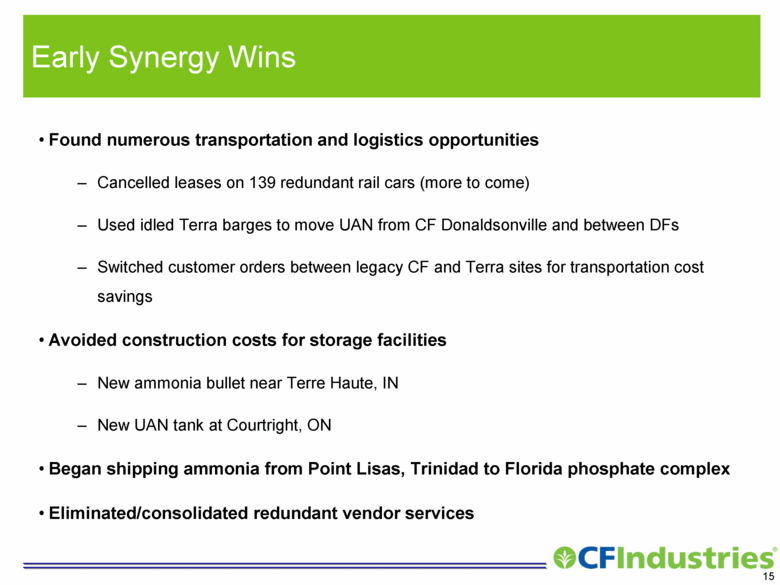
Early Synergy Wins Found numerous transportation and logistics opportunities Cancelled leases on 139 redundant rail cars (more to come) Used idled Terra barges to move UAN from CF Donaldsonville and between DFs Switched customer orders between legacy CF and Terra sites for transportation cost savings Avoided construction costs for storage facilities New ammonia bullet near Terre Haute, IN New UAN tank at Courtright, ON Began shipping ammonia from Point Lisas, Trinidad to Florida phosphate complex Eliminated/consolidated redundant vendor services |
|
|
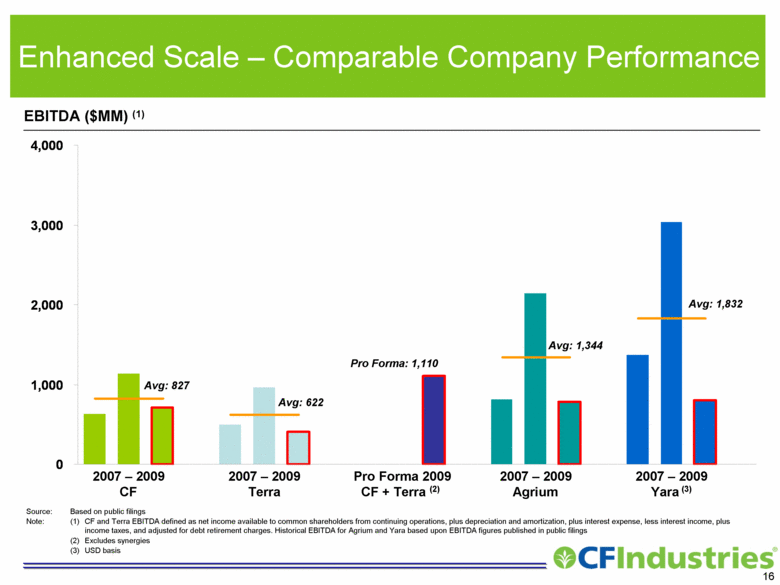
Enhanced Scale – Comparable Company Performance EBITDA ($MM) (1) 2007 – 2009 CF Avg: 827 Avg: 622 Pro Forma: 1,110 Avg: 1,344 2007 – 2009 Terra Pro Forma 2009 CF + Terra (2) 2007 – 2009 Agrium 2007 – 2009 Yara (3) Avg: 1,832 Source: Based on public filings Note: (1) CF and Terra EBITDA defined as net income available to common shareholders from continuing operations, plus depreciation and amortization, plus interest expense, less interest income, plus income taxes, and adjusted for debt retirement charges. Historical EBITDA for Agrium and Yara based upon EBITDA figures published in public filings (2) Excludes synergies (3) USD basis 0 1,000 2,000 3,000 4,000 |
|
|
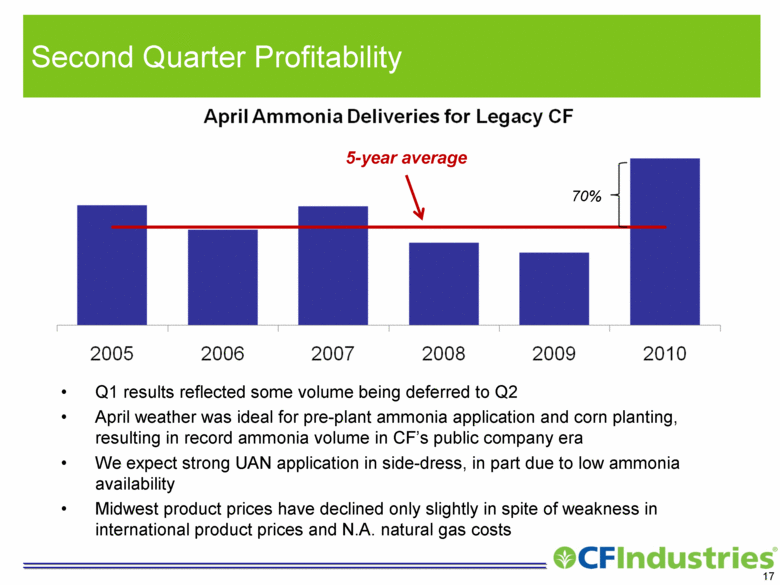
Second Quarter Profitability 5-year average Q1 results reflected some volume being deferred to Q2 April weather was ideal for pre-plant ammonia application and corn planting, resulting in record ammonia volume in CF’s public company era We expect strong UAN application in side-dress, in part due to low ammonia availability Midwest product prices have declined only slightly in spite of weakness in international product prices and N.A. natural gas costs 70% April Ammonia Deliveries for Legacy CF |
|
|
A Clear Path Forward |
|
|
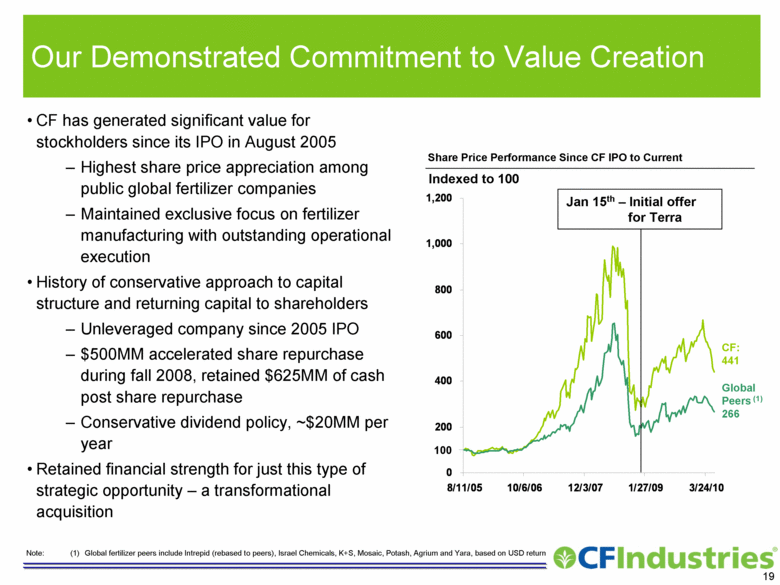
Our Demonstrated Commitment to Value Creation CF has generated significant value for stockholders since its IPO in August 2005 Highest share price appreciation among public global fertilizer companies Maintained exclusive focus on fertilizer manufacturing with outstanding operational execution History of conservative approach to capital structure and returning capital to shareholders Unleveraged company since 2005 IPO $500MM accelerated share repurchase during fall 2008, retained $625MM of cash post share repurchase Conservative dividend policy, ~$20MM per year Retained financial strength for just this type of strategic opportunity – a transformational acquisition Note: (1) Global fertilizer peers include Intrepid (rebased to peers), Israel Chemicals, K+S, Mosaic, Potash, Agrium and Yara, based on USD return Indexed to 100 Share Price Performance Since CF IPO to Current CF: 441 Global Peers (1) 266 100 Jan 15th – Initial offer for Terra 0 200 400 600 800 1,000 1,200 8/11/05 10/6/06 12/3/07 1/27/09 3/24/10 |
|
|
Our Strategic Imperatives Integrate the Operations of CF Industries and Terra Execute detailed integration plan over the next 18 to 24 months Deliver Targeted Cost Synergies Identified up to $135MM of synergies expected to be realized within two years Reaching the Operational Potential of CF Industries Maximize margin through assessment of business mix and use of programs such as FPP Attain and Maintain Optimal Capital Structure Net debt/EBITDA target of 1.0x to 1.5x History of returning capital to stockholders Leverage Terra Environmental Technologies Capitalize on strong TET position through use of internal urea production Pursue Global Strategic Opportunities Continue prudent and value enhancing growth through organic opportunities and acquisitions Maintain focus on high margin fertilizer manufacturing and distribution |
|
|
The New Nitrogen Fertilizer Bellwether A Leading Global Company Significantly enhanced scale and strategic platform Nearly doubles revenues Global #2 in Nitrogen Fertilizers and Leading Position in Phosphate Fertilizer (1) Nitrogen manufacturing capacity of 13.5MM product tons (6.3MM nutrient tons) Significant exposure to cost advantaged North American natural gas 3rd largest public producer of phosphate fertilizer globally Significant Synergy Opportunity Identified Coupled with Detailed Integration Plan Identified up to $135MM of annual synergies from Terra acquisition Transition facilitated by location and similarity of businesses Former Terra executives on new leadership team and integration steering committee Strong Pro Forma Balance Sheet Strong cash flow generation Committed to maintaining strong, flexible balance sheet through deleveraging Company Net Debt / EBITDA target of 1.0x to 1.5x Experienced Management Team with Track Record of Success Successfully transformed CF from co-op to publicly traded industry leader History of returning capital to shareholders Note: (1) Nutrient basis among public companies |
|
|
Appendix |
|
|
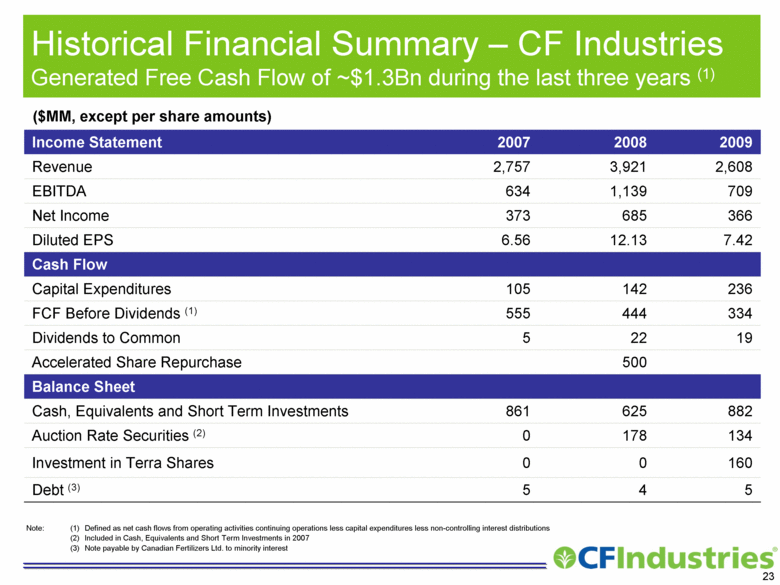
Historical Financial Summary – CF Industries Generated Free Cash Flow of ~$1.3Bn during the last three years (1) Income Statement 2007 2008 2009 Revenue 2,757 3,921 2,608 EBITDA 634 1,139 709 Net Income 373 685 366 Diluted EPS 6.56 12.13 7.42 Cash Flow Capital Expenditures 105 142 236 FCF Before Dividends (1) 555 444 334 Dividends to Common 5 22 19 Accelerated Share Repurchase 500 Balance Sheet Cash, Equivalents and Short Term Investments 861 625 882 Auction Rate Securities (2) 0 178 134 Investment in Terra Shares 0 0 160 Debt (3) 5 4 5 ($MM, except per share amounts) Note: (1) Defined as net cash flows from operating activities continuing operations less capital expenditures less non-controlling interest distributions (2) Included in Cash, Equivalents and Short Term Investments in 2007 (3) Note payable by Canadian Fertilizers Ltd. to minority interest |
|
|
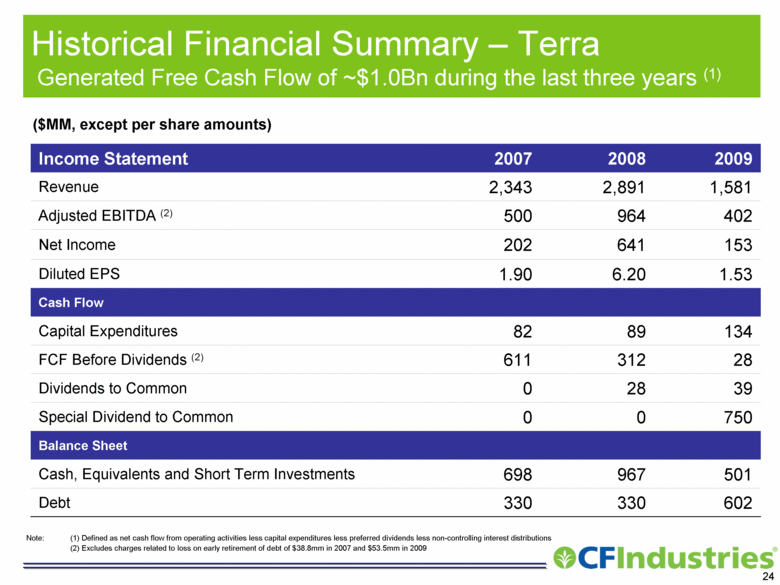
Historical Financial Summary – Terra Generated Free Cash Flow of ~$1.0Bn during the last three years (1) Income Statement 2007 2008 2009 Revenue 2,343 2,891 1,581 Adjusted EBITDA (2) 500 964 402 Net Income 202 641 153 Diluted EPS 1.90 6.20 1.53 Cash Flow Capital Expenditures 82 89 134 FCF Before Dividends (2) 611 312 28 Dividends to Common 0 28 39 Special Dividend to Common 0 0 750 Balance Sheet Cash, Equivalents and Short Term Investments 698 967 501 Debt 330 330 602 ($MM, except per share amounts) Note: (1) Defined as net cash flow from operating activities less capital expenditures less preferred dividends less non-controlling interest distributions (2) Excludes charges related to loss on early retirement of debt of $38.8mm in 2007 and $53.5mm in 2009 |
|
|
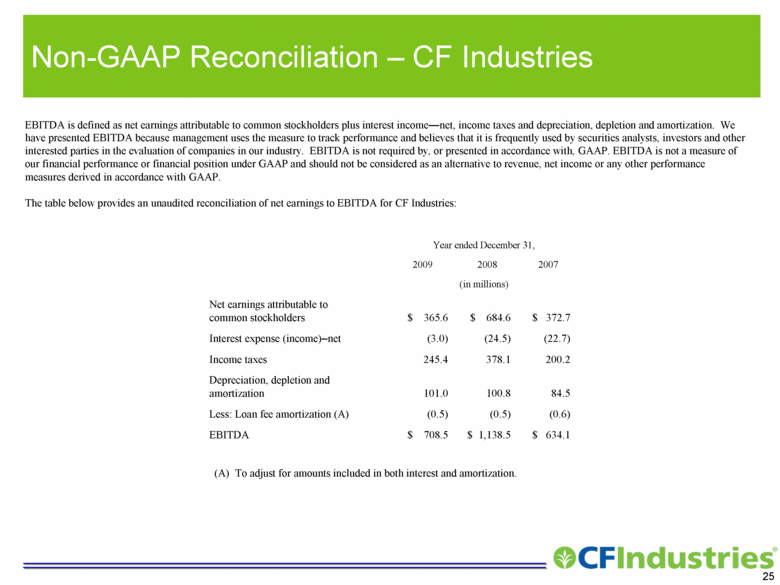
Non-GAAP Reconciliation – CF Industries EBITDA is defined as net earnings attributable to common stockholders plus interest income—net, income taxes and depreciation, depletion and amortization. We have presented EBITDA because management uses the measure to track performance and believes that it is frequently used by securities analysts, investors and other interested parties in the evaluation of companies in our industry. EBITDA is not required by, or presented in accordance with, GAAP. EBITDA is not a measure of our financial performance or financial position under GAAP and should not be considered as an alternative to revenue, net income or any other performance measures derived in accordance with GAAP. The table below provides an unaudited reconciliation of net earnings to EBITDA for CF Industries: Year ended December 31, 2009 2008 2007 (in millions) Net earnings attributable to common stockholders $ 365.6 $ 684.6 $ 372.7 Interest expense (income)–net (3.0) (24.5) (22.7) Income taxes 245.4 378.1 200.2 Depreciation, depletion and amortization 101.0 100.8 84.5 Less: Loan fee amortization (A) (0.5) (0.5) (0.6) EBITDA $ 708.5 $ 1,138.5 $ 634.1 (A) To adjust for amounts included in both interest and amortization. |
|
|
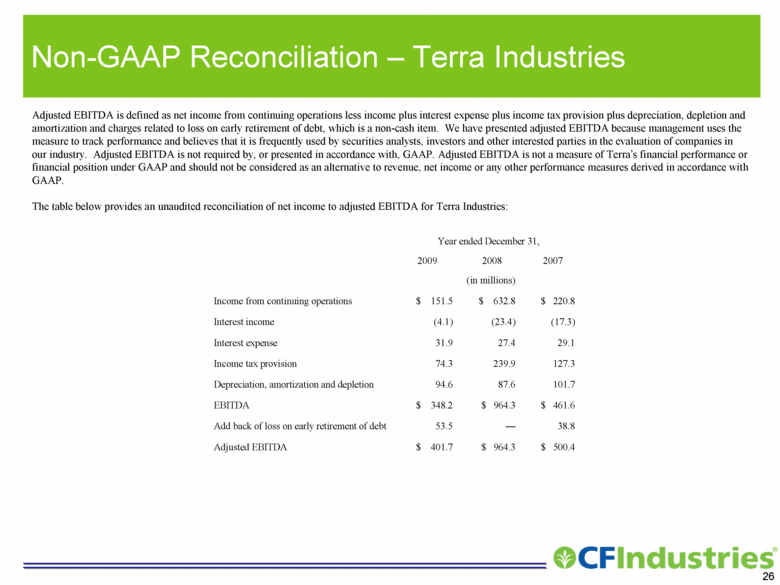
Non-GAAP Reconciliation – Terra Industries Adjusted EBITDA is defined as net income from continuing operations less income plus interest expense plus income tax provision plus depreciation, depletion and amortization and charges related to loss on early retirement of debt, which is a non-cash item. We have presented adjusted EBITDA because management uses the measure to track performance and believes that it is frequently used by securities analysts, investors and other interested parties in the evaluation of companies in our industry. Adjusted EBITDA is not required by, or presented in accordance with, GAAP. Adjusted EBITDA is not a measure of Terra’s financial performance or financial position under GAAP and should not be considered as an alternative to revenue, net income or any other performance measures derived in accordance with GAAP. The table below provides an unaudited reconciliation of net income to adjusted EBITDA for Terra Industries: Year ended December 31, 2009 2008 2007 (in millions) Income from continuing operations $ 151.5 $ 632.8 $ 220.8 Interest income (4.1) (23.4) (17.3) Interest expense 31.9 27.4 29.1 Income tax provision 74.3 239.9 127.3 Depreciation, amortization and depletion 94.6 87.6 101.7 EBITDA $ 348.2 $ 964.3 $ 461.6 Add back of loss on early retirement of debt 53.5 — 38.8 Adjusted EBITDA $ 401.7 $ 964.3 $ 500.4 |
|
|
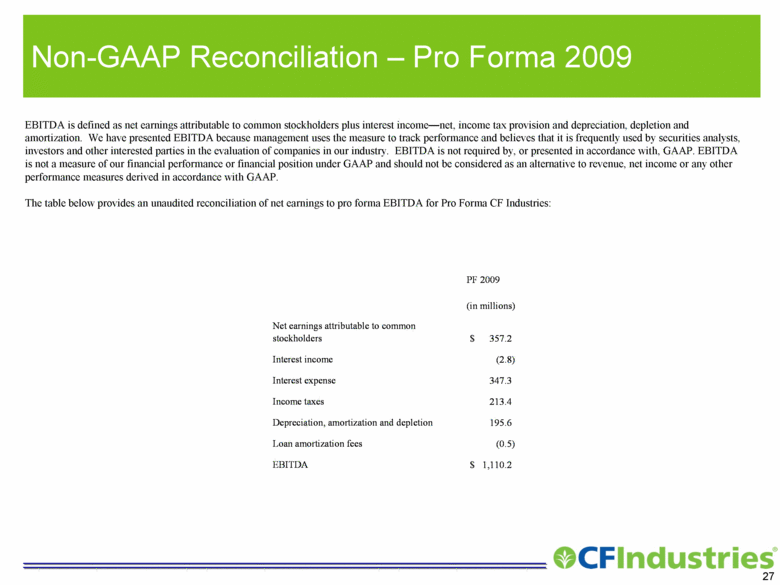
Non-GAAP Reconciliation – Pro Forma 2009 EBITDA is defined as net earnings attributable to common stockholders plus interest income—net, income tax provision and depreciation, depletion and amortization. We have presented EBITDA because management uses the measure to track performance and believes that it is frequently used by securities analysts, investors and other interested parties in the evaluation of companies in our industry. EBITDA is not required by, or presented in accordance with, GAAP. EBITDA is not a measure of our financial performance or financial position under GAAP and should not be considered as an alternative to revenue, net income or any other performance measures derived in accordance with GAAP. The table below provides an unaudited reconciliation of net earnings to pro forma EBITDA for Pro Forma CF Industries: PF 2009 (in millions) Net earnings attributable to common stockholders 357.2 $ Interest income (2.8) Interest expense 347.3 Income taxes 213.4 Depreciation, amortization and depletion 195.6 Loan amortization fees (0.5) EBITDA 1,110.2 $ |
|
|
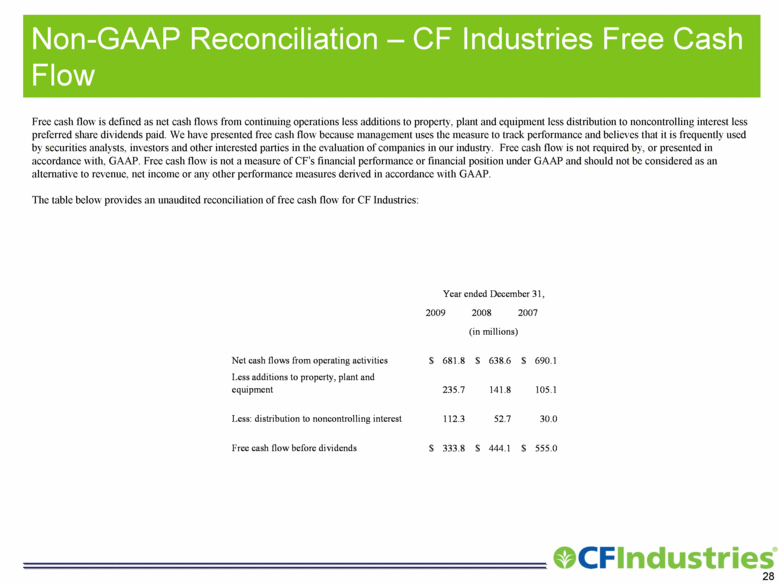
Non-GAAP Reconciliation – CF Industries Free Cash Flow Free cash flow is defined as net cash flows from continuing operations less additions to property, plant and equipment less distribution to noncontrolling interest less preferred share dividends paid. We have presented free cash flow because management uses the measure to track performance and believes that it is frequently used by securities analysts, investors and other interested parties in the evaluation of companies in our industry. Free cash flow is not required by, or presented in accordance with, GAAP. Free cash flow is not a measure of CF’s financial performance or financial position under GAAP and should not be considered as an alternative to revenue, net income or any other performance measures derived in accordance with GAAP. The table below provides an unaudited reconciliation of free cash flow for CF Industries: Year ended December 31, 2009 2008 2007 (in millions) Net cash flows from operating activities 681.8 $ 638.6 $ 690.1 $ Less additions to property, plant and equipment 235.7 141.8 105.1 Less: distribution to noncontrolling interest 112.3 52.7 30.0 Free cash flow before dividends 333.8 $ 444.1 $ 555.0 $ |
|
|
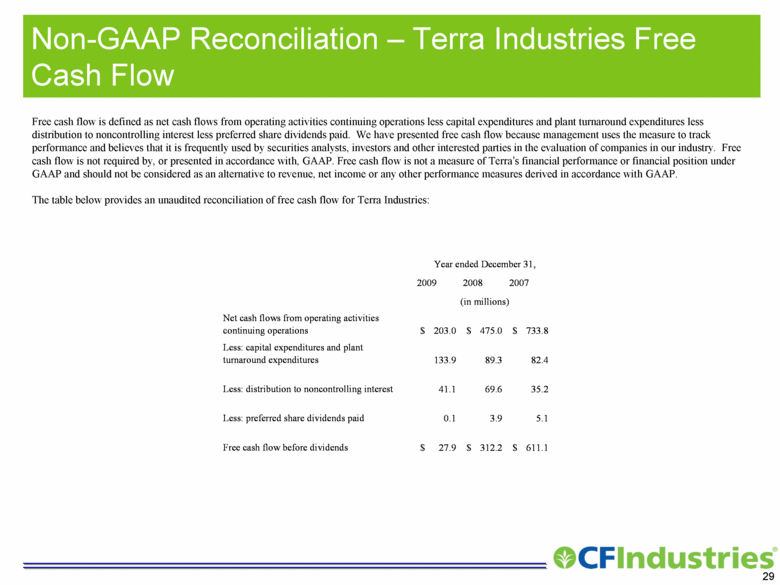
Non-GAAP Reconciliation – Terra Industries Free Cash Flow Free cash flow is defined as net cash flows from operating activities continuing operations less capital expenditures and plant turnaround expenditures less distribution to noncontrolling interest less preferred share dividends paid. We have presented free cash flow because management uses the measure to track performance and believes that it is frequently used by securities analysts, investors and other interested parties in the evaluation of companies in our industry. Free cash flow is not required by, or presented in accordance with, GAAP. Free cash flow is not a measure of Terra’s financial performance or financial position under GAAP and should not be considered as an alternative to revenue, net income or any other performance measures derived in accordance with GAAP. The table below provides an unaudited reconciliation of free cash flow for Terra Industries: Year ended December 31, 2009 2008 2007 (in millions) Net cash flows from operating activities continuing operations 203.0 $ 475.0 $ 733.8 $ Less: capital expenditures and plant turnaround expenditures 133.9 89.3 82.4 Less: distribution to noncontrolling interest 41.1 69.6 35.2 Less: preferred share dividends paid 0.1 3.9 5.1 Free cash flow before dividends 27.9 $ 312.2 $ 611.1 $ |
|
|
[LOGO] |

