Attached files
| file | filename |
|---|---|
| 8-K - FORM 8-K - Kraton Corp | d8k.htm |
 May 18, 2010
Kraton
Performance Polymers, Inc.
Houlihan
Lokey
5th Annual Global Industrials Conference
Exhibit 99.1 |
| Disclaimers
Forward-Looking Statements
This presentation may include “forward-looking statements”
that reflect our plans, beliefs,
expectations and current views with respect to, among other things, future events and
financial performance. Forward-looking statements are often characterized by the use of
words such as “believes,”
“estimates,”
“expects,”
“projects,”
“may,”
“intends,”
“plans”
or
“anticipates,”
or by discussions of strategy, plans or intentions. All forward-looking
statements in this presentation are made based on management's current expectations and
estimates, which involve risks, uncertainties and other factors that could cause actual
results to differ materially from those expressed in forward-looking statements. Readers are
cautioned not to place undue reliance on forward-looking statements. We assume no
obligation to update such information. Further information concerning issues that could
materially affect financial performance related to forward looking statements can be found in
our periodic filings with the Securities and Exchange Commission.
GAAP Disclaimer
This presentation includes the use of both GAAP (generally accepted accounting principles)
and non-GAAP financial measures. The non-GAAP financial measures are EBITDA and
Adjusted EBITDA. The most directly comparable GAAP financial measure is net
income/loss. A reconciliation of the non-GAAP financial measures used in this presentation
to
the
most
directly
comparable
GAAP
measure
is
included
herein.
We
consider
EBITDA
and Adjusted EBITDA important supplemental measures of our performance and believe
they are frequently used by investors and other interested parties in the evaluation of
companies in our industry. EBITDA and Adjusted EBITDA have limitations as analytical
tools and should not be considered in isolation or as a substitute for analysis of our results
under GAAP in the United States.
2 |
 Investment
Highlights Leadership
Clear leader in the fast growing, attractive SBC market
Scale
Approximately twice the size of our largest competitor in each of our end-use
markets
High
Barriers to
Entry
Patented technology, custom designed product, process excellence, global reach
and customer relationships create strong competitive position
Kraton, therefore, commands price premiums in the market
Innovation
Most-productive innovator of new SBC products, often engineered to meet a specific
customer need
Earnings
Growth
Driven by cost initiatives, economic recovery, return to normal customer inventory
levels and new product introductions
Meaningful operating leverage
Experience
Strong leadership team demonstrating continuous improvement in productivity,
innovation and margin improvement even in a difficult macroeconomic environment
3 |
 Experienced Management
Team Name
Title
Previous Experience
Years
Industry
Experience
Dan Smith
Chairman of the
Board
Lyondell
40
Kevin Fogarty
President & CEO
Koch (Invista)
18
Steve Tremblay
Chief Financial
Officer
Vertis
9
David Bradley
Chief Operating
Officer
General Electric (Lexan)
17
Lothar Freund
Research &
Technical Services
Hoechst AG (Invista)
20
4 |
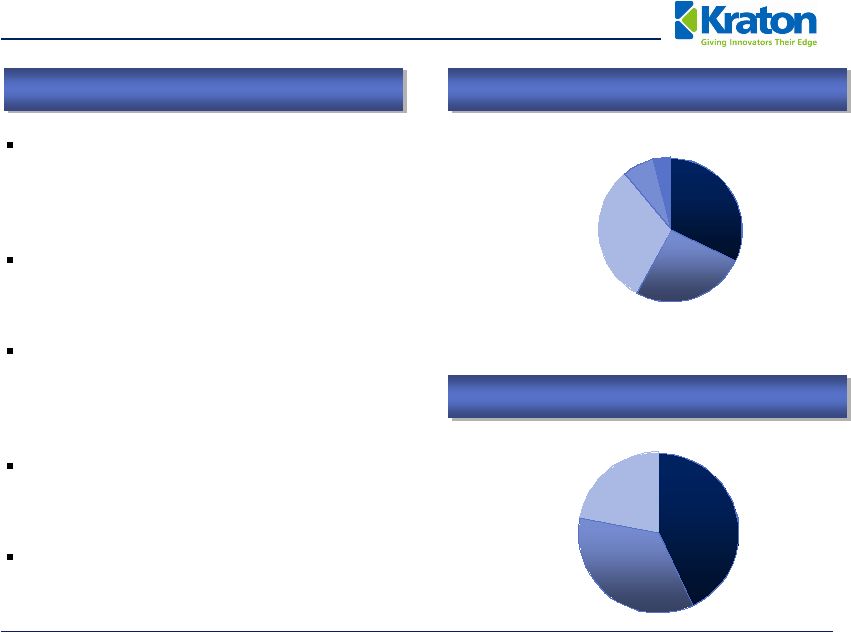 43%
35%
22%
32%
27%
31%
7%
3%
Kraton
Overview
We design and manufacture customized
SBC neat resin and compound solutions
to meet our leading customers’
specific
innovation needs
We currently offer approximately 800
products to more than 700 customers, in
over 60 countries
We are organized around four distinct
markets, or end-uses, providing industrial,
consumer and geographical diversification
second to none
We employ approximately 800 people in
15 locations in all major regions of the
world
LTM March 2010 operating revenue of
$1.1 billion and LTM March 2010 Adjusted
EBITDA
(2)
of $144 million
(1)
Sales revenue excludes by-products sales
(2)
Adjusted EBITDA is GAAP EBITDA excluding sponsor fees, restructuring and related charges, non-cash
expenses, and the gain on extinguishment of debt.
A reconciliation of net income or loss to EBITDA and Adjusted EBITDA is presented in the Appendix.
LTM
March
2010
Sales
Revenue
(1)
by
End-Use
LTM
March
2010
Sales
Revenue
(1)
by
Geography
North and
South
America
Europe,
Middle
East &
Africa
Asia Pacific
Paving and
Roofing
Adhesives,
Sealants and
Coatings
Footwear and
Other
Emerging
Businesses
Advanced
Materials
We are the world’s leading innovator of
Styrenic
Block Copolymers (SBCs)
5 |
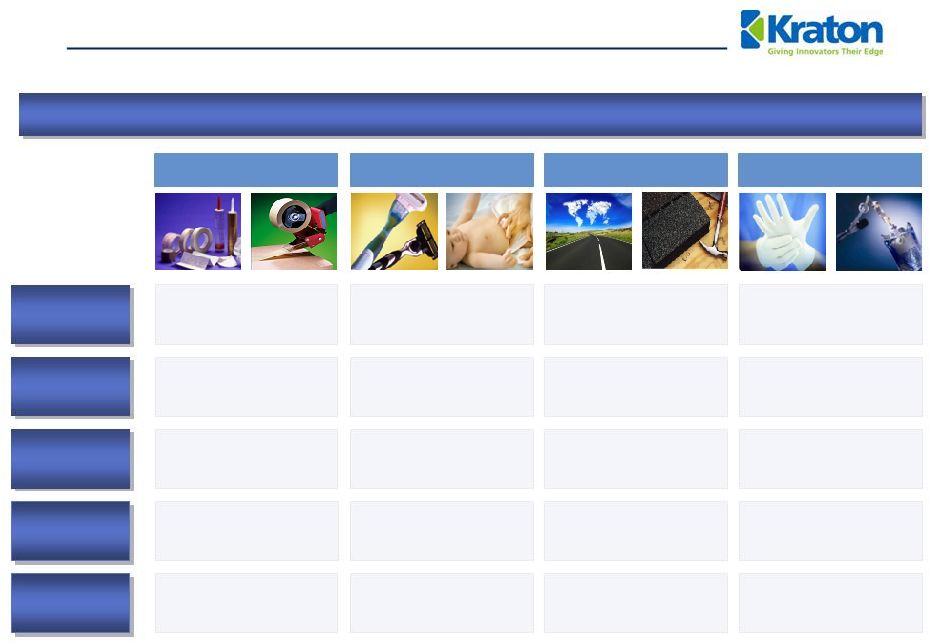
    Before Kraton
After Kraton
Kraton
Makes Products Better
Product Issue
Stretch in legs only (Spandex)
Not a fitted garment
High leakage rate
Overall improvement in stretch
(where it’s needed)
Better fit
Low leakage rate
Kraton
market share: 47%
2001
–
2007
CAGR:
11.4%
Elastic
Films
for
Disposable
Diapers
Kraton
as % of Diaper
cost: <2%
Phthalate plasticizers are used to
make PVC soft. However, plasticizers
can leach from finished products and
create health concerns
Limited recyclability
Vinyl Chloride polymers are unsafe
when burned or incinerated improperly
Fully recyclable
Kraton
imparts softness, toughness and clarity
Plasticizers & chlorine free
Product Issue
Kraton
as
an
alternative
for
soft
PVC
Kraton
as % of finished
product cost: <5%
6 |
 Source:
Management estimates (1)
Based on LTM March 2010 sales of $1, 056 million (excludes by-product sales which are reported as
other revenues) (2)
Industry growth frm 2001-2008; however, IR Latex growth is Kraton growth from 2007-2009
(3)
Management’s estimates vs. next largest competitor based on 2008 sales
Clear Leader in Attractive Markets
Market position
LTM 2010
Revenue
(1)
#1
64%
Adhesives, Sealants,
and Coatings
Advanced Materials
#1
75%
Paving and Roofing
#1
74%
Emerging Businesses
#1
100%
32%
31%
27%
7%
2.6x
2.2x
1.9x
6.1x
#1 Market Position and Approximately Twice the Size of Our Closest Competitors
Top 4 market
share
Kraton
market
share relative to
#2 competitor
(3)
Growth
(2)
5.2%
8.0%
7.1%
28.8%
7 |
 Unparalleled Global
Manufacturing and Service Capability
Houston, Texas
Global Headquarters &
Innovation Center
Not applicable
Belpre, Ohio
Manufacturing
189 kt
Wesseling,
Germany
Manufacturing
95 kt
Berre, France
Manufacturing
87 kt
Paulinia, Brazil
Manufacturing &
Innovation Center
28 kt
Kashima, Japan
Manufacturing Joint
Venture
20 kt
Amsterdam, The
Netherlands
Innovation Center
Not applicable
Mont St. Guibert,
Belgium
Technical Service
Office
Not applicable
Shanghai, China
Customer Service &
Technical Center
Not applicable
Tskuba, Japan
Innovation Center
Not applicable
High quality customer base
Majority of top customers have 15+ year
relationship
Blue chip customer base in the consumer
products, packaging, medical supplies,
construction and textile industries
Several key customer relationships are sole
source
Well diversified customer base
Location
Kraton
Capacity
Capability
8 |
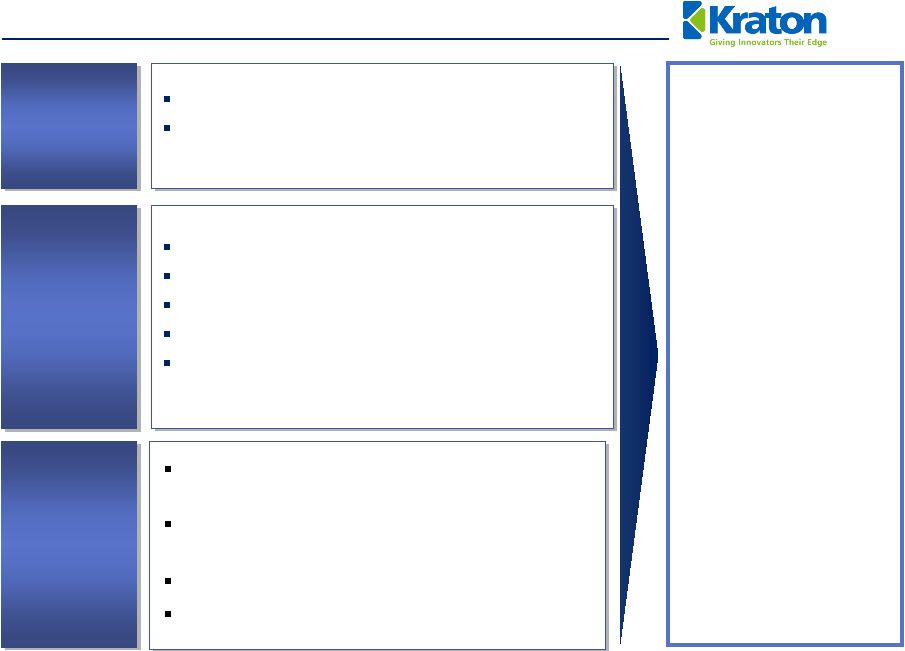 Sustainable Competitive
Advantages Over 40 years of process know-how and expertise
Performance-critical
products
and
manufacturing
complexity
Technical
Barriers
Globally
recognized
brand
–
KRATON
®
Industry-leading R&D infrastructure
Global low-cost manufacturing footprint
Regulatory hurdles to new manufacturing sites
Stable raw material base with multiple sources of
supply and contract / relationships
Infrastructure
Barriers
Superior and
Innovative Products
+
High Customer
Switching Costs
+
Long-Term
Customers
Relationships
=
Leading
Market Position
Products
designed
cooperatively
to
meet
specific
customer needs / applications
Preferred supplier based on manufacturing
consistency and process know-how
Ongoing technical service offering
100% of products offered on demand
High
Value
Added
9 |
 $15
$22
$23
$35
$61
$65
2005
2006
2007
2008
2009
Q1 2010
LTM
6%
11%
13%
14%
12%
13%
20%
2005
2006
2007
2008
2009
Q1 2010 LTM
2011 Goal
Key Attributes
Innovation-led Top Line Growth
Tremendous growth
Rapidly capture share from $2.2 billion natural
rubber latex industry
Margins well in excess of rest of business
Kraton
maintains 86% market share
Challenging process technology to replicate
for competitors and new entrants
IPO proceeds will help fund IR Latex
capacity expansion
20% of revenue from innovation
20% contribution margin premium
US $ in millions
Case Study: IR Latex and IR Revenue
Growth
Vitality Index
10
Vitality index in line with expectations
Strong recovery of automotive and overmolding applications as well as
ASC innovation volumes Encouraging momentum in PVC-free alternative for medical and wire
and cable applications |
 Strong Diversified
Innovation Pipeline to Drive Growth Slush Molding
Protective Films
PVC Replacement
Wire & Cable
PVC Replacement
Medical Applications
11
HiMA |
 Kraton
has Significant Growth & Profitability Opportunities
Project
Description
Estimated
Cost
Expected
Timing
Latex
Expansion
Capture additional market
demand
Up to $30 million
2011 -
2012
Asia Plan /
HSBC
Expansion
High-margin HSBC
capacity expansion
utilizing new technology
TBD
2012 +
Isoprene
Rubber and
Isoprene Latex
Debottleneck
Capital advantaged latex
expansion at Paulinia
and
IR capacity replacement
$37 million
2010 -
2011
We Typically Seek Higher Growth Opportunities with Relatively Rapid Steady-State
Payback
12 |
 $17
$21
$17
$12
Culture of Continuous Cost Improvement
$67
2007
Belpre work process improvement
project
Offsite warehouse
Global office closures
2009
Berre fixed cost reduction
ERP project
Paulinia work process improvement project
Global staff reduction, discretionary
spending reduction
2010
Pernis IR shutdown
2008
Pernis SIS shutdown
RTS and SG&A staff reductions
Freight forward contract
Belpre energy reduction initiatives
Annualized run-rate of cost savings
US $ in millions
13 |
 Earnings Growth
Update on 2010 Business Priorities
Innovation-led Top-line
Growth
Capital Investment
Approved $27 million isoprene rubber conversion at Belpre
Committed to a $10 million isoprene rubber latex debottleneck at
Paulinia
Phase II system and control upgrades at Belpre on target
Initiated project scoping for new HSBC capacity
Solid year-over-year and sequential volume and revenue growth
Benefited
from
“one-time”
sales
volume
and
FIFO
adjustment
Announced several rounds of price increases in response to rising raw
material and energy costs
Adjusted EBITDA up more than $50 million compared to Q109
Critical Capabilities
Filled a majority of open positions in Q1
Recruiting underway for all remaining critical needs, including investor
relations, market development, and engineering capabilities
14
Vitality index improving towards goal
Strong recovery in some key markets such as automotive, consumer
goods and paving & roofing
Encouraging momentum in PVC-free alternative for medical and wire
and cable applications |
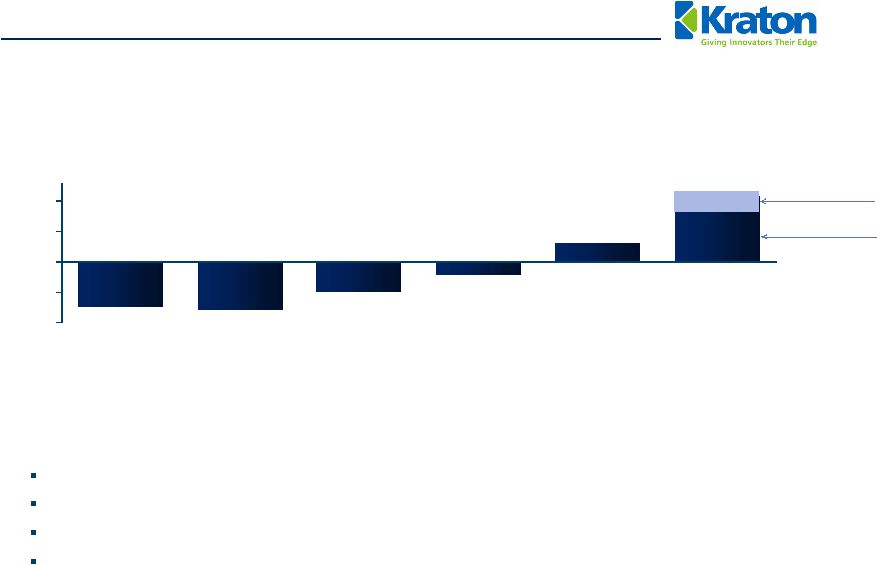 Volume Trends
Year-on-Year Change In Sales Volume:
Late Q3 2009, volume began to return to pre-economic crisis level
Q4 2009 and Q1 2010 represented a reversal in trends with both quarters posting volume growth
Q1 2010 up 20% v. Q4 2009; historically Q1 is flat to down versus prior year’s Q4
Sales volume
grew
from
47
kt
in
Q1
2009
to
73
kt
Q1
2010,
and
excluding
an
estimated
6
kt
(representing approximately $18 million of revenue) of sales that the company believes are
restocking
and
other
“one-time”
sales,
volume
is
up
20
kt
or
approximately
43%
versus
Q1
2009
15
(36.3)%
(38.7)%
(24.2)%
(9.7)%
16.0 %
54.6 %
-50.0%
-25.0%
0.0%
25.0%
50.0%
4Q08
1Q09
2Q09
3Q09
4Q09
1Q10
12.1%
42.5%
“One-time”
Core Growth
Growth |
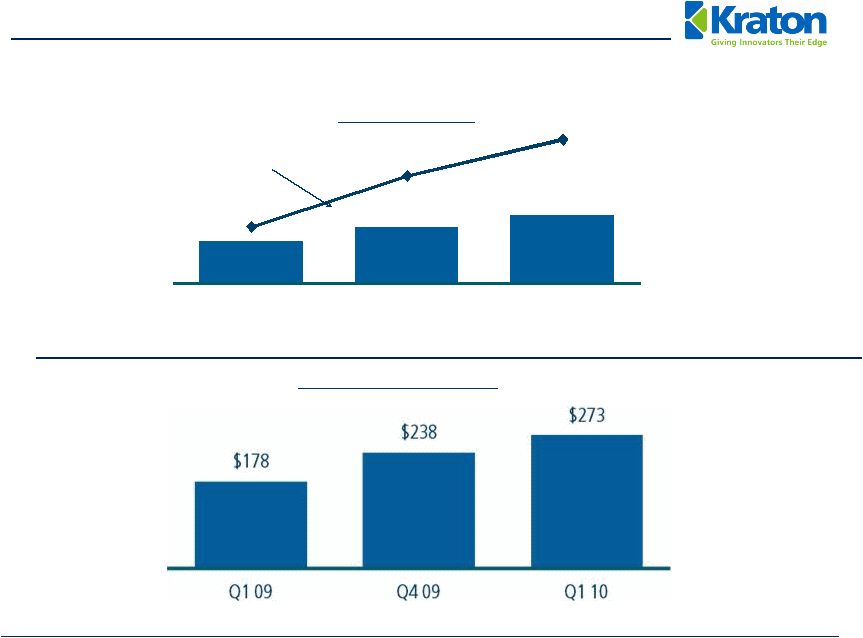 Selected Financial
Trends (1)
Excludes by-product revenue
47
61
73
61%
116%
155%
Q1 09
Q4 09
Q1 10
Volume (kt)
% of prior year
16
Sales Revenue
(1)
(US $ in Millions) |
 Selected Financial
Trends (1)
Adjusted EBITDA is GAAP EBITDA excluding sponsor fees, restructuring and related charges,
non-cash expenses, and the gain on extinguishment of debt
17
$(10)
$35
$43
Q1 09
Q4 09
Q1 10
Diluted Earnings per Share
$(0.85)
$(0.07)
$0.64
Q1 09
Q4 09
Q1 10
Adjusted EBITDA
(1)
(US $ in Millions) |
 $(50)
$(35)
$(73)
Quarterly Net Cash Used in
Operating Activities
Cash Flow
Q1 2010 reflects an increase in
working capital associated with an
increase in sales, higher inventory
(including effect of higher raw
material costs).
Cash conversion cycle (days)
favorable versus Q1 2009.
Working capital of 32% of LTM
revenue currently expected to return
to more normal 23% to 25% by year-
end.
US $ in millions
18
170
161
Q1 09
Q1 10
Q1 2010
Q1 2008
Q1 2009 |
 Q1 2010
Capitalization US $ in millions
19
Amount
Cum. Debt /
Adjusted EBITDA
(1)
Cash and cash equivalents
$
12
Term loan
$
221
1.53x
Senior and Senior Discount Notes
163
1.14x
Total debt
384
2.67x
Stockholders’
equity
377
Total capitalization
$
761
Net debt
$
372
2.58x
(1)
Adjusted EBITDA is GAAP EBITDA excluding sponsor fees, restructuring and related charges,
non-cash expenses, and the gain on extinguishment of debt |
 Appendix
|
 Q1 2010 Financial
Overview (1)
Adjusted EBITDA is GAAP EBITDA excluding sponsor fees, restructuring and related charges, non-cash
expenses, and the gain on extinguishment of debt
US $ in Thousands except per share
data
21
Three months Ended
Three months Ended
Three months Ended
3/31/2010
12/31/2009
3/31/2009
Sales Volume (kt)
73
61
47
Total Operating Revenues
272,732
$
250,708
$
184,957
$
Cost of Goods Sold
203,605
189,840
176,023
Gross Profit
69,127
60,868
8,934
Operating expenses
Research and Development
5,984
6,098
4,969
Selling, General and Administrative
22,062
22,919
18,250
Depreciation and Amortization of Identifiable Intangibles
11,046
25,168
12,564
Gain on Extinguishment of Debt
-
-
19,491
Equity in Earnings of Unconsolidated Joint Venture
74
98
74
Interest Expense, net
6,064
9,179
8,908
Income (Loss) Before Income Taxes
24,045
(2,398)
(16,192)
Income Tax Expense
4,250
(882)
269
Net Income (Loss)
19,795
$
(1,516)
$
(16,461)
$
Earnings (Loss)
per
Common
Share
-
Diluted
0.64
$
(0.07)
$
(0.85)
$
Adjusted EBITDA
(1)
42,622
$
35,043
$
(9,717)
$
|
 Q1 2010 Reconciliation of
Net Income/(Loss) to EBITDA and Adjusted EBITDA
(1) The EBITDA measure is used by management to evaluate operating performance. Management believes
that EBITDA is useful to investors because it is frequently used by investors and other
interested parties in the evaluation of companies in our industry. EBITDA is not a recognized
term under GAAP and does not purport to be an alternative to net income (loss) as an indicator of operating
performance or to cash flows from operating activities as a measure of liquidity. Since not all
companies use identical calculations, this presentation of EBITDA may not be comparable to
other similarly titled measures of other companies. Additionally, EBITDA is not intended to be a measure of
free cash flow for management's discretionary use, as it does not consider certain cash requirements
such as interest payments, tax payments and debt service requirements.
(2) Adjusted EBITDA is EBITDA excluding
sponsor fees, restructuring and related charges, non-cash expenses, and the gain on
extinguishment of debt.
22
US $ in Thousands
Three months Ended
Three months Ended
Three months Ended
3/31/2010
12/31/2009
3/31/2009
Net Income (Loss)
19,795
$
(1,516)
$
(16,461)
$
Add(deduct):
Interest expense, net
6,064
9,179
8,908
Income tax expense
4,250
(882)
269
Depreciation and amortization expenses
11,046
25,168
12,564
EBITDA
(1)
41,155
$
31,949
$
5,280
$
EBITDA
(1)
41,155
$
31,949
$
5,280
$
Add(deduct):
Sponsor fees and expenses
-
500
500
Restructuring and related charges
135
2,144
694
Other non-cash expenses
1,332
450
3,301
Gain on extinguishment of debt
-
-
(19,491)
Adjusted EBITDA
(2)
42,622
$
35,043
$
(9,716)
$
Restructuring and related detail:
Cost of goods sold
-
$
105
$
78
$
Selling, general and administrative
135
2,039
616
Total restructuring and related charges
135
$
2,144
$
694
$
|
 May 18, 2010
Kraton
Performance Polymers, Inc.
Houlihan
Lokey
5th Annual Global Industrials Conference |