Attached files
| file | filename |
|---|---|
| 8-K - CURRENT REPORT - FIFTH THIRD BANCORP | d8k.htm |
 Exhibit 99.1
Barclays Capital
Financial Services Conference
Kevin T. Kabat
Chairman, President & Chief Executive Officer
May 18, 2010
Please refer to earnings release dated April 22, 2010 and 10-Q dated
May 7, 2010 for further information, including full results reported on a U.S.
GAAP basis
Fifth Third Bank | All Rights Reserved |
 2
Fifth Third Bank | All Rights Reserved
Fifth Third franchise
*
As of 5/13/10
$113 billion assets (#13)
$84 billion deposits (#13)
$11 billion market cap (#13)*
16 affiliates in 12 states
1,309 banking centers
2,364 ATMs
Leading market share in mature Midwest
market
Built strong presence in higher growth
Southeastern markets over past 5 years
Naples
Kentucky
Tennessee
Georgia
Florida
North
Carolina
West
Virginia
Pennsylvania
Ohio
Michigan
Illinois
Indiana
Missouri |
 3
Fifth Third Bank | All Rights Reserved
Diversified franchise
2009
net
revenue
-
$2.8
billion*
Branch Banking (38% of net revenue)
Retail and business banking
$18.4B average loans; $44.6B average core deposits
3.8M customers; 1.4M online banking customers
Commercial Banking (35% of net revenue)
Corporate and middle market lending, treasury services,
international trade finance, commercial leasing and
syndicated finance
$41.4B average loans; $18.4B average core deposits
765 corporate client relationships and 13,500 middle market
client relationships
Consumer Lending (22% of net revenue)
Real estate-secured mortgages, home equity loans, credit
cards, student loans, and auto lending
$20.5B average loans
7,600 dealer indirect auto lending network
Investment Advisors (5% of net revenue)
Private Bank, Retail Brokerage, Asset Management, and
Institutional Services
$3.1B average loans; $4.9B average core deposits
$25B assets under management; $187B assets under care
*
Represents
tax-equivalent
net
revenue
(income
before
taxes,
excluding
provision
for
loan
and
lease
losses).
Excludes
$1.5B
general
corporate,
of
which
approximately
$221M represented 1H09 contribution of Fifth Third Processing Solutions (51%
interest subsequently sold) 38%
22%
35%
5%
Branch
Banking
$1.1B
Investment
Advisors
$139M
Commercial
Banking
$1.0B
Consumer Lending
$610M |
 4
Fifth Third Bank | All Rights Reserved
1Q10 in review
•
Net loss of $10 million
versus 4Q09 net loss of
$98 million
•
Pre-provision net revenue
of $568 million, up $6
million from 4Q09
•
Net interest margin of
3.63%, up 8 bps
sequentially
•
Average core deposits up
$4.4B, or 6% sequentially
•
Extended $18 billion of new
and renewed credit
Strong operating trends
•
Nonperforming assets declined
3% and nonperforming loans
declined 7% sequentially
(lowest levels since 2Q09)
–
Total delinquencies
declined 15% sequentially
(lowest level since 3Q07)
•
Net charge-offs declined 18%
sequentially (lowest level since
1Q09)
•
Allowance to loan ratio of
4.91%, 139% of nonperforming
loans and leases and 1.6 times
annualized 1Q10 net charge-
offs
•
Realized credit losses have
been significantly below SCAP
scenarios
Significant improvements in credit
•
Tangible common equity
ratio of 6.4%
•
Tier 1 common ratio of
7.0%
•
Leverage ratio of 12.0%
(8.9% ex-TARP)
•
Tier 1 capital ratio of
13.4% (10.0% ex-TARP)
Robust capital levels |
 5
Fifth Third Bank | All Rights Reserved
Peer performance summary
Source: SNL and company reports.
(1)
Regional bank peer average consists of BBT, CMA, HBAN, KEY, MTB,
MI, PNC, RF, STI, USB, WFC, and ZION, unless otherwise noted.
(2)
Midwest peer average consists of CMA, HBAN, KEY, MI, and USB, unless
otherwise noted. *
Operating fee growth, core pre-tax pre-provision earnings, and operating
efficiency ratio exclude the following items: securities gains/losses, gains/losses from debt
extinguishments, leveraged lease gains/losses, gains from asset sales, goodwill
impairment charges, and other non-recurring items. Average loans include only loans
held-for-investment. NPAs exclude loans held-for-sale and covered
assets. Continued relative outperformance on key value drivers
FITB
1Q10
Regional
bank peers
(1)
1Q10
Midwest
peers
(2)
1Q10
SEQ performance
vs. peers
Net interest margin /
(bps)
3.63% (+8)
3.60% (+13)
3.37% (+18)
Better
Operating fee growth*
-1%
-9%
-5%
Better
Core pre-tax pre-provision earnings* / loans
2.9%
2.7%
2.6%
Better
Operating efficiency ratio*
62%
64%
65%
Better
Average core deposits growth
6%
0%
0%
Better
Average loan growth*
1%
-1%
-2%
Better
NPA ratio* /
(bps)
4.02% (-20)
4.33% (+11)
3.47% (-7)
Better
Net charge-off ratio /
(bps)
3.01% (-61)
2.48% (-46)
2.86% (-90)
Area of focus |
 6
Fifth Third Bank | All Rights Reserved
Pre-tax pre-provision earnings
4.6%
4.5%
4.2%
3.2%
2.9%
2.7%
2.6%
2.0%
1.9%
1.9%
1.7%
1.7%
1.4%
WFC
USB
PNC
BBT
FITB
MTB
HBAN
KEY
MI
CMA
STI
RF
ZION
Peer average: 2.7%
1Q10 core PPNR / average loans (annualized)*
Core PPNR trend
Fifth
Third’s
pre-tax,
pre-provision
net
revenue
(PPNR)
to
loans
higher
than
most
regional
bank
peers
Core PPNR reconciliation
Credit
adjusted
PPNR
/
Average
Loans
Source: SNL and company reports. Core PPNR excludes securities gains/losses,
gains/losses from debt extinguishments, leveraged lease gains/losses, gains from asset
sales, goodwill impairment charges, divested fees and expenses related to FTPS, and
other non-recurring items where appropriate. Credit-related adjustments include
mortgage
repurchase
expenses,
provision
for
unfunded
commitments
expense,
derivative
valuation
adjustments,
OREO
expenses
and
other
workout
related
expenses.
94
57
111
73
91
483
564
535
562
3
8
45
30
1
$0
$100
$200
$300
$400
$500
$600
$700
1Q09
2Q09
3Q09
4Q09
1Q10
Core
Fee Income Credit Items
Noninterest Expense Credit Items
569
1Q09
2Q09
3Q09
4Q09
1Q10
Reported PPNR (GAAP)
$511
$2,393
$844
$562
$568
Adjustments:
Gain on sale of Visa shares
-
-
(244)
-
-
BOLI charge
54
-
-
-
-
Gain from sale of processing interest
-
(1,764)
6
-
-
Divested merchant and EFT revenue
(155)
(169)
-
-
-
Class B Visa swap fair value adjustment
-
-
-
-
9
Securities gains/losses
24
(5)
(8)
(2)
(14)
Visa litigation reserve expense
-
-
(73)
-
-
Other litigation reserve expense
-
-
-
22
4
FTPS Warrants
-
-
-
(20)
2
Seasonal pension expense
-
-
10
-
-
FDIC special assessment
-
55
-
-
-
Divested merchant and EFT expense (estimated)
49
54
-
-
-
Core PPNR
$483
$564
$535
$562
$569
Credit Related Items:
OREO write-downs, FV adjs, & G/L on loan sales
3
8
45
30
1
Problem asset work-out expenses
94
57
111
73
91
Credit adjusted PPNR
$580
$629
$691
$665
$661 |
 7
Fifth Third Bank | All Rights Reserved
Stable income and expense in difficult environment
Core fee income ($M)
Core expenses ($M)
•
Strong mortgage banking results continued in 1Q10,
resulting in $3.5B of originations and $152M in net
revenue
•
Investment advisory revenue up 5% from previous qtr
•
Card and processing revenue sequential decrease 4%
–
Debit interchange: $46M 1Q10; $177M 2009
–
Credit interchange: $21M 1Q10; $85M 2009
•
Corporate banking revenue down 8% sequentially
driven by declines in business lending fees, foreign
exchange revenue, and institutional sales
•
Credit-related costs affected fee income by $1M in
1Q10 compared with $30M the previous quarter
•
Sequential increase in core expenses driven by
elevated credit costs and seasonal benefits expense
partially offset by disciplined discretionary expense
control
•
Core efficiency ratio of 62.4% in 1Q10, an improvement
from 65.1% in 1Q09
•
Credit-related costs affected non-interest expenses by
$91M in 1Q10 compared with $73M the previous
quarter
•
Total expense related to mortgage repurchases ~$39M
in 1Q10 compared with $18M in 4Q09 and $6M in 1Q09
* Refer to slide 6 for itemized effects of non-core fees and expenses
620
645
605
629
624
624
653
650
659
625
$0
$100
$200
$300
$400
$500
$600
$700
1Q09
2Q09
3Q09
4Q09
1Q10
Core
Fee Income Excluding Credit Items
913
912
938
945
952
819
856
828
872
861
$0
$100
$200
$300
$400
$500
$600
$700
$800
$900
$1,000
1Q09
2Q09
3Q09
4Q09
1Q10
Core
Noninterest Expense Excluding Credit Items |
 8
Fifth Third Bank | All Rights Reserved
Net interest income
Core NII and NIM*
•
Trends in net interest income and net
interest margin favorably compare with
peers
–
NIM up 8 bps in 1Q10 vs. 4Q09
•
Expect continued margin benefit
through 2010 from CD maturities and
improved loan spreads
(bps)
Reported NIM and YOY growth versus peers
Peers include: BBT, CMA, HBAN, KEY, MI, MTB, PNC, RF, STI, USB, WFC, ZION
Source: SNL and company reports
*
Core
results
exclude
$6M
charge
related
to
leveraged
lease
litigation
in
1Q09.
Also
excluded
are
$41M,
$35M,
$27M,
$24M,
and
$19M
in
loan
discount accretion from the First Charter acquisition in 1Q09, 2Q09, 3Q09, 4Q09,
and 1Q10 respectively. Yields and rates*
($Ms)
$746
$801
$847
$859
$882
2.92%
3.13%
3.33%
3.45%
3.55%
2.0%
2.5%
3.0%
3.5%
4.0%
1Q09
2Q09
3Q09
4Q09
1Q10
$400
$500
$600
$700
$800
$900
Net interest income (right axis)
NIM
3.63%
57 bps
3.60%
36 bps
NIM
NIM growth
FITB
Peer average
1.0%
2.0%
3.0%
4.0%
5.0%
1Q09
2Q09
3Q09
4Q09
1Q10
0
100
200
300
400
Spread (right axis)
Asset yield
Liability rate |
 9
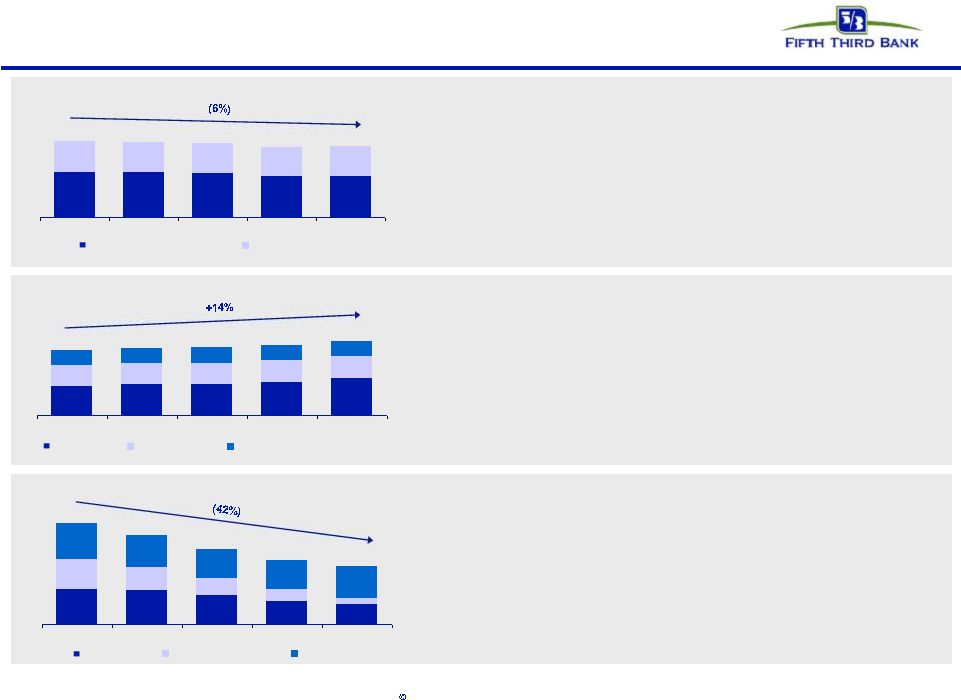
Fifth Third Bank | All Rights Reserved
Balance sheet:
Continued growth in core funding
•
Extended $18B of new and renewed credit in 1Q10
•
CRE loans down 4% sequentially and 12% from the previous year
–
New homebuilder/developer, non-owner occupied CRE suspended 2008
•
C&I loans down 1% sequentially and 12% from the previous year largely due
to lower line utilization and soft demand*
•
Strong
mortgage
originations
-
$1.5B in residential mortgage loans held-for-
sale warehouse (not carried in loans held-for investment)
•
Core deposit to loan ratio of 97%, up from 80% in 1Q09
•
Everyday Great Rates strategy continues to drive core deposit growth
–
DDAs
up 4% sequentially and 21% from the previous year
–
Commercial core deposits up 20% sequentially and 46% from the previous
year
–
Retail
core
deposits
up
1%
sequentially
and
3%
from
the
previous
year
Average loan growth ($B)^
Average core deposit growth ($B)
84
82
80
78
78
67
69
70
72
76
Average wholesale funding ($B)
35
31
26
20
22
•
Reduced wholesale funding by $1.9 billion sequentially and $14.7
billion from
the previous year
–
Non-core deposits down 14% sequentially and 40% from the previous year
–
Short term borrowings down 52% sequentially and 84% from the previous
year
–
Long-term debt up 10% sequentially and down 8% from the previous year
•
Portion of excess core funding invested in agency mortgage-backed securities
(balance sheet hedges added to mitigate interest rate risk)
^ Excludes loans held-for-sale
* Excludes the impact of $724M in C&I balances that were consolidated on
January 1, 2010 Note: Numbers may not sum due to rounding
50
49
48
45
45
34
33
33
32
33
1Q09
2Q09
3Q09
4Q09
1Q10
Commercial Loans
Consumer Loans
30
32
32
34
38
21
21
21
22
23
16
16
17
16
15
1Q09
2Q09
3Q09
4Q09
1Q10
Demand/IBT
Savings/MMDA
Consumer CD/Core foreign
12
12
10
8
7
10
8
6
4
2
13
11
10
10
11
1Q09
2Q09
3Q09
4Q09
1Q19
Non-core deposits
ST borrowings
LT debt |
 Improving credit results
Source: SNL and company reports. NPA and NCO ratios exclude loans
held-for-sale and covered assets for peers where appropriate. * 4Q08
net charge-offs included $800M in NCOs related to commercial losses moved to held-for-sale
NPA ratio vs. peers
Net charge-off ratio vs. peers*
Loans 90+ days delinquent % vs. peers
Loans 30-89 days delinquent % vs. peers
10
Fifth Third Bank | All Rights Reserved |
 11
Fifth Third Bank | All Rights Reserved
Manageable commercial real estate exposure
CRE / Assets
Source: SNL and company reports.
Peer average: 215%
CRE / (TCE + Reserves)
Peer average: 18%
12%
12%
11%
11%
8%
33%
30%
24%
24%
24%
15%
14%
MI
MTB
ZION
RF
CMA
KEY
HBAN
FITB
STI
USB
BBT
WFC
PNC
473%
312%
295%
264%
209%
173%
168%
154%
147%
143%
136%
123%
117%
MTB
MI
RF
ZION
CMA
USB
HBAN
KEY
STI
BBT
FITB
WFC
PNC
13%
CRE exposure lower than peer average; problems relatively more manageable given capital and
reserves |
 12
Fifth Third Bank | All Rights Reserved
$1,500
$1,750
$2,000
$2,250
$2,500
$2,750
$3,000
$3,250
$3,500
$3,750
$4,000
$4,250
$4,500
$4,750
$5,000
$5,250
$5,500
Updated credit loss expectations vs. SCAP scenarios
Realized credit losses have been significantly below SCAP submissions; expected to
continue 2008
2009
2010
*
Red SCAP line represents more adverse scenario as adjusted by supervisors for
additional assumed two-year losses. Supervisory estimates of total two-year losses
under more adverse scenario were not allocated by period. Estimate allocates total
two-year supervisory losses using the allocation under Fifth Third’s submission.
** Source for macroeconomic assumptions: Moody’s Economy.com. Assumptions as
of March 2010. Fifth Third
capitalized for this
level of credit
losses under SCAP
(plus surplus raised
vs. buffer)
$4.1B
$5.0B
$2.8B
Moody’s Weaker
Recovery / Mild
Second Recession
Case** Assumptions
(Mar. 2010)
Moody’s Base
Case** Assumptions
(Mar. 2010)
SCAP Baseline Scenario
(Submitted; Mar 2009)
SCAP Adverse Scenario*
(Supervisory; Mar 2009)
Actual
$2.6B
Actual
$2.7B
$2.9B
Fifth Third’s realized credit losses
have been significantly below its
SCAP submitted baseline and
more adverse scenarios
–
In SCAP submissions, we
incorporated significant
conservatism, given then
prevailing negative economic
and industry trends and
extreme uncertainty in
potential loss outcomes
–
Economic and credit market
conditions are much
improved versus those
expected in spring 2009
Base and stress scenarios reflect
Moody’s Base Case and Moody’s
Weaker Recover / Mild Second
Recession Case (as of March
2010)**
Our current expectation is for
2010 losses to be lower than 2009 |
 13
Fifth Third Bank | All Rights Reserved
Strong reserve position
Coverage ratios are strong relative to peers
Industry leading reserve level
1.
FITB
4.91%
2.
KEY
4.34%
3.
ZION
4.05%
4.
HBAN
4.00%
5.
RF
3.61%
6.
MI
3.57%
7.
PNC
3.38%
8.
WFC
3.22%
9.
USB
2.80%
10.
STI
2.79%
11.
BBT
2.65%
12.
CMA
2.42%
13.
MTB
1.75%
Peer Average
3.21%
Reserves / Loans
490
626
756
708
582
196
283
415
68
8
4.88%
4.91%
3.31%
4.28%
4.69%
0%
1%
2%
3%
4%
5%
1Q09
2Q09
3Q09
4Q09
1Q10
$0
$200
$400
$600
$800
$1,000
$1,200
$1,400
Net Charge-offs
Additional Provision
Reserves
139%
122%
161%
90%
78%
141%
Reserves / NPLs
Reserves / NPAs
Reserves / Annualized NCOs
FITB
Peer Average
Source: SNL and company reports. NPAs/NPLs exclude held-for-sale portion for all banks and
covered assets for BBT, USB, and ZION. |
 14
Fifth Third Bank | All Rights Reserved
Robust capital position
Source: SNL and company reports.
* MTB Tier 1 common ratio as of 12/31/09.
Strong capital ratios relative to peers, particularly considering reserve
levels 11.7%
10.4%
10.3%
10.0%
9.9%
9.9%
9.9%
9.6%
8.7%
8.3%
8.2%
7.9%
7.4%
BBT
CMA
PNC
FITB
WFC
KEY
USB
STI
HBAN
ZION
RF
MTB
MI
16.8%
15.9%
14.3%
14.1%
13.7%
12.7%
12.5%
12.2%
12.2%
12.0%
11.9%
10.6%
8.6%
KEY
CMA
FITB
MI
WFC
RF
STI
BBT
ZION
HBAN
PNC
USB
MTB
(TCE + reserves) / Loans
Peer average: 12.8%
Peer average w/
TARP: 11.1%
Peer average
w/o TARP: 9.4%
Tier 1 capital ratio (with and without TARP)
8.9%
11.1%
13.1%
12.0%
11.2%
13.4%
12.9%
11.7%
Tangible common equity ratio
9.7%
8.0%
7.4%
6.8%
6.7%
6.4%
6.3%
6.2%
6.1%
5.8%
5.4%
5.4%
5.3%
CMA
MI
KEY
WFC
STI
FITB
ZION
BBT
RF
HBAN
MTB
USB
PNC
Peer average: 6.6%
Tier 1 common ratio
9.6%
8.7%
7.9%
7.7%
7.5%
7.3%
7.1%
7.1%
7.1%
7.1%
7.0%
6.5%
5.7%
CMA
BBT
PNC
STI
KEY
MI
RF
USB
WFC
ZION
FITB
HBAN
MTB*
Peer average: 7.4% |
 15
Fifth Third Bank | All Rights Reserved
Strong liquidity profile
Net loans and leases / core deposits
Source: 3/31/2010 Company Y9C reports
*Noncore funding dependence as of 12/31/09 as 3/31/10 BHCPR reports not yet
available •
Over the past year, Fifth Third has reduced its net noncore funding reliance by 20%,
more than any peer other than Comerica*
–
Fifth
Third
has
the
2
nd
lowest
net
noncore
funding
dependence
among
its
peers*
•
Fifth Third has no holding company debt maturing in the next year and less than 1% of
consolidated Bancorp debt, lower than peers
Peer average: 104%
92%
94%
98%
98%
99%
102%
105%
106%
107%
107%
111%
112%
116%
PNC
HBAN
RF
FITB
ZION
STI
MI
KEY
BBT
WFC
MTB
CMA
USB |
 16
Fifth Third Bank | All Rights Reserved
Strong liquidity profile
Retail Brokered CD maturities: $813M in 2010; $31M in 2011
3/31 unused avail. capacity $27B ($18.5B in Fed and $8.7B in FHLB)
FHLB borrowings $2.6B; Q1 avg. core deposits $76B; equity $14B
All market borrowings by Fifth Third Bank
Holding Company cash at 3/31/10: $1.35B
—
Total Fed deposits ~$4.0B
Expected cash obligations over the next 12 months (assuming no
TARP repayment)
—
$0 debt maturities
—
~$39M common dividends
—
~$205M preferred dividends (~$35M Series G, ~$170M TARP)
—
~$237M interest and other expenses
Cash currently sufficient to satisfy all fixed obligations* over
the
next
24 months without accessing capital markets/subsidiary
dividends
Bank unsecured debt maturities ($M –
excl. Brokered CDs)
Heavily core funded
Holding company unsecured debt maturities ($M)
* Debt maturities, common and preferred dividends, interest and other expenses
$52
$500
$500
0
0
0
2010
2011
2012
2013
2014
2015 on
0
0
0
$750
0
$5.0B
2010
2011
2012
2013
2014
2015 on
Fifth Third Bancorp
Fifth Third Capital Trust |
 17
Fifth Third Bank | All Rights Reserved
2010 developments
Fifth Third response
Macro themes
•
Sluggish loan demand
•
Deposits to grow but
expect some diminution
as later liquidity drawn
down by deposits to
support expansion in
spending
•
Additional consumer
regulation
•
Higher interest rates late
2010 / early 2011
•
TARP repayment
•
Leverage existing customer relationships at the local level to
offer our full portfolio of products and services across all of
our lines of business
•
Invest in sales force expansion initiatives to increase
resources and branch hours while maintaining focus on
a near-term return to
profitability •
Reorient fee structure of products and services to offer a clearer
and higher value proposition to our clients and create more
sustainable, consistent growth
•
Maintain excess liquidity, neutral to modest asset sensitive
positioning
•
Remain committed to repayment in a manner that is in the best
interest of all constituents, including shareholders |
 18
Fifth Third Bank | All Rights Reserved
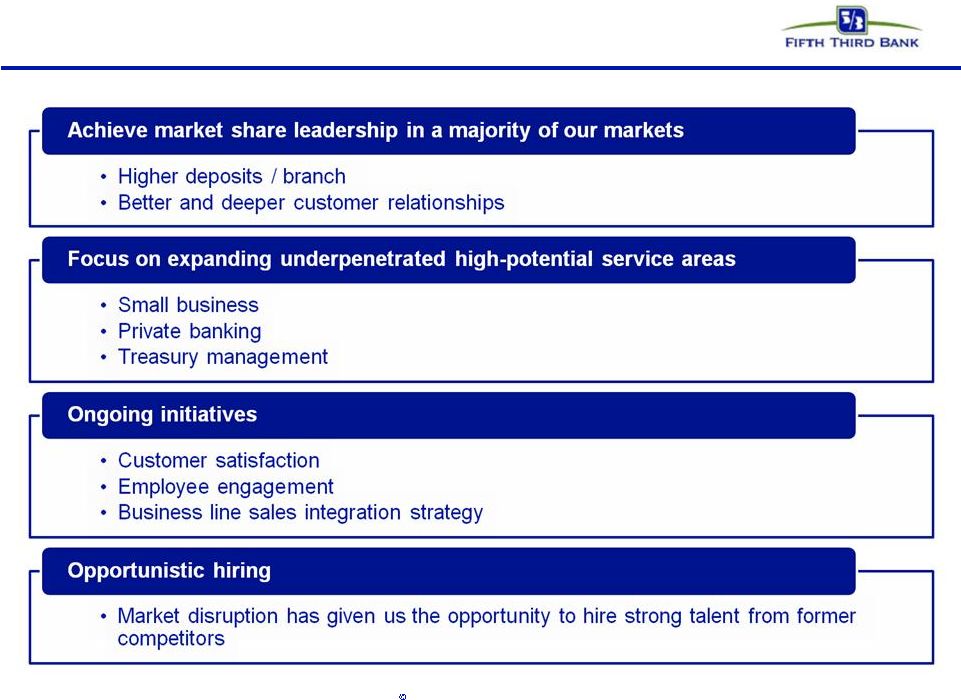
Continuing to invest for the future
18
Fifth Third Bank | All Rights Reserved |
 19
Fifth Third Bank | All Rights Reserved
Summary
Fifth Third continues to execute on its strategic initiatives and
is focused on being well-positioned for the turn of the cycle.
•
Dedicated to serving the needs
of families and businesses for
more than 150 years
•
Businesses creating new and
profitable opportunities to
enhance value
•
Trends in NII and NIM
favorably compare with peers
•
Ongoing expense control
•
Continued shift back toward
core funding
Core franchise remains strong
•
Strong reserve coverage of
problem loans
•
Aggressive management has
mitigated areas of highest risk
•
Significantly enhanced SAG
and workout resources, while
continuing prudent lending
practices
•
Significantly improved credit
trends in 1Q10
Aggressive management of
credit issues
•
Successfully completed June
2008 capital plan and SCAP
capital actions
•
Actions exceeded SCAP Tier 1
common equity commitment
by 80%
•
Current capital levels able to
withstand significant additional
economic deterioration as
demonstrated by the SCAP
assessment
Robust capital levels |
 20
Ó
Fifth Third Bank | All Rights Reserved
Cautionary statement
This report may contain statements that we believe are “forward-looking statements”
within the meaning of Section 27A of the Securities Act of 1933, as amended, and Rule 175
promulgated thereunder, and Section 21E of the Securities Exchange Act of 1934, as amended, and Rule 3b-6
promulgated thereunder. These statements relate to our financial condition, results of operations,
plans, objectives, future performance or business. They usually can be identified by the use of
forward-looking language such as “will likely result,” “may,” “are expected to,” “is
anticipated,” “estimate,” “forecast,” “projected,” “intends
to,” or may include other similar words or phrases such as “believes,” “plans,” “trend,”
“objective,” “continue,” “remain,” or similar expressions, or future or
conditional verbs such as “will,” “would,” “should,” “could,” “might,” “can,” or
similar verbs. You should not place undue reliance on these statements, as they are subject to risks
and uncertainties, including but not limited to the risk factors set forth in our most recent
Annual Report on Form 10-K and our most recent quarterly report on Form 10-Q. When considering
these forward-looking statements, you should keep in mind these risks and uncertainties, as well
as any cautionary statements we may make. Moreover, you should treat these statements as
speaking only as of the date they are made and based only on information then actually known to
us.
There are a number of important factors that could cause future results to differ materially from
historical performance and these forward-looking statements. Factors that might cause such
a difference include, but are not limited to: (1) general economic conditions and weakening in the
economy, specifically the real estate market, either nationally or in the states in which Fifth Third,
one or more acquired entities and/or the combined company do business, are less favorable than
expected; (2) deteriorating credit quality; (3) political developments, wars or other
hostilities may disrupt or increase volatility in securities markets or other economic conditions; (4)
changes in the interest rate environment reduce interest margins; (5) prepayment speeds, loan
origination and sale volumes, charge-offs and loan loss provisions; (6) Fifth Third’s ability to
maintain required capital levels and adequate sources of funding and liquidity; (7) maintaining
capital requirements may limit Fifth Third’s operations and potential growth; (8) changes
and trends in capital markets; (9) problems encountered by larger or similar financial institutions may
adversely affect the banking industry and/or Fifth Third (10) competitive pressures among depository
institutions increase significantly; (11) effects of critical accounting policies and judgments;
(12) changes in accounting policies or procedures as may be required by the Financial Accounting
Standards Board (FASB) or other regulatory agencies; (13) legislative or regulatory changes or
actions, or significant litigation, adversely affect Fifth Third, one or more acquired entities
and/or the combined company or the businesses in which Fifth Third, one or more acquired entities
and/or the combined company are engaged; (14) ability to maintain favorable ratings from rating
agencies; (15) fluctuation of Fifth Third’s stock price; (16) ability to attract and
retain key personnel; (17) ability to receive dividends from its subsidiaries; (18) potentially dilutive effect of future
acquisitions on current shareholders’ ownership of Fifth Third; (19) effects of accounting or
financial results of one or more acquired entities; (20) difficulties in separating Fifth Third
Processing Solutions from Fifth Third; (21) loss of income from any sale or potential sale of businesses that
could have an adverse effect on Fifth Third’s earnings and future growth; (22) ability to secure
confidential information through the use of compute systems and telecommunications networks; and
(23) the impact of reputational risk created by these developments on such matters as business
generation and retention, funding and liquidity.
You should refer to our periodic and current reports filed with the Securities and Exchange
Commission, or “SEC,” for further information on other factors, which could cause
actual results to be significantly different from those expressed or implied by these forward-looking statements. |