Attached files
| file | filename |
|---|---|
| 8-K - CURRENT REPORT - FIFTH THIRD BANCORP | d8k.htm |
 Fifth Third Bank | All Rights Reserved
Investor Update
May 2010
Please refer to earnings release dated April 22, 2010 and 10-Q dated
May 7, 2010 for further information, including full results reported on a U.S.
GAAP basis
Exhibit 99.1 |
 2
Fifth Third Bank | All Rights Reserved
Fifth Third franchise
*
As of 5/13/10
$113 billion assets (#13)
$84 billion deposits (#13)
$11 billion market cap (#13)*
16 affiliates in 12 states
1,309 banking centers
2,364 ATMs
Leading market share in mature Midwest
market
Built strong presence in higher growth
Southeastern markets over past 5 years
Naples
Kentucky
Tennessee
Georgia
Florida
North
Carolina
West
Virginia
Pennsylvania
Ohio
Michigan
Illinois
Indiana
Missouri |
 3
Fifth Third Bank | All Rights Reserved
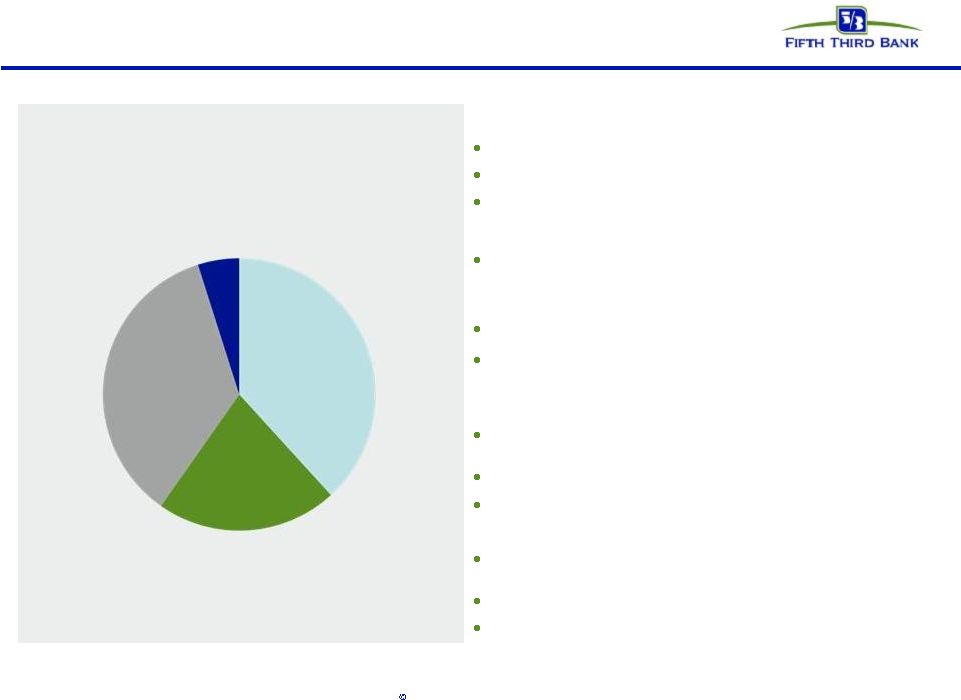
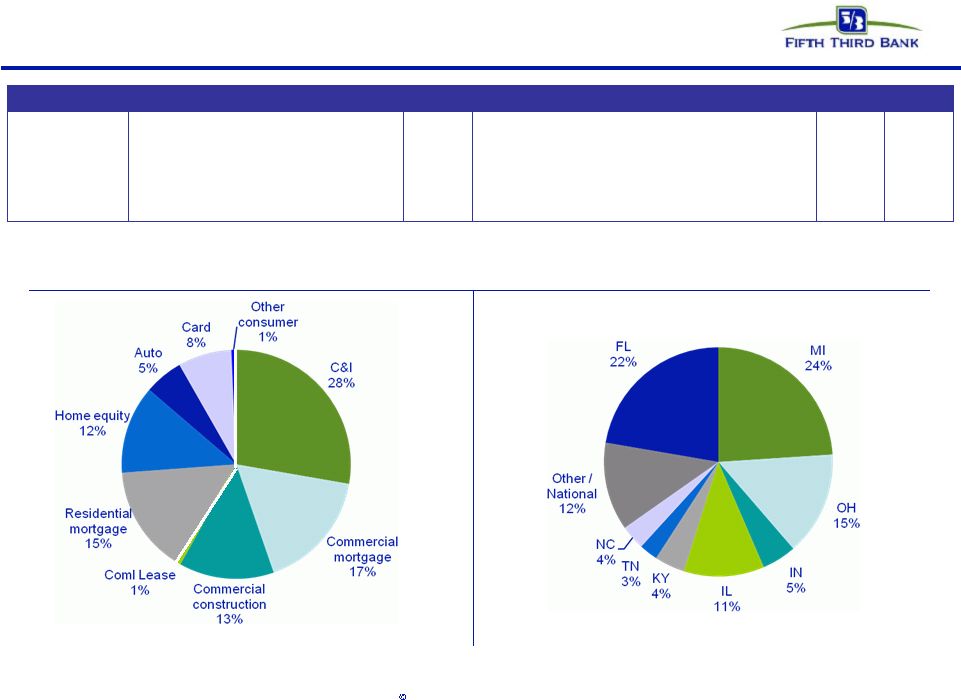
Diversified franchise
2009
net
revenue
-
$2.8
billion*
Branch Banking (38% of net revenue)
Retail and business banking
$18.4B average loans; $44.6B average core deposits
3.8M customers; 1.4M online banking customers
Commercial Banking (35% of net revenue)
Corporate and middle market lending, treasury services,
international trade finance, commercial leasing and
syndicated finance
$41.4B average loans; $18.4B average core deposits
765 corporate client relationships and 13,500 middle market
client relationships
Consumer Lending (22% of net revenue)
Real estate-secured mortgages, home equity loans, credit
cards, student loans, and auto lending
$20.5B average loans
7,600 dealer indirect auto lending network
Investment Advisors (5% of net revenue)
Private Bank, Retail Brokerage, Asset Management, and
Institutional Services
$3.1B average loans; $4.9B average core deposits
$25B assets under management; $187B assets under care
*
Represents
tax-equivalent
net
revenue
(income
before
taxes,
excluding
provision
for
loan
and
lease
losses).
Excludes
$1.5B
general
corporate,
of
which
approximately
$221M represented 1H09 contribution of Fifth Third Processing Solutions (51%
interest subsequently sold) 38%
22%
35%
5%
Branch
Banking
$1.1B
Investment
Advisors
$139M
Commercial
Banking
$1.0B
Consumer Lending
$610M |
 4
Fifth Third Bank | All Rights Reserved
1Q10 in review
•
Net loss of $10 million
versus 4Q09 net loss of
$98 million
•
Pre-provision net revenue
of $568 million, up $6
million from 4Q09
•
Net interest margin of
3.63%, up 8 bps
sequentially
•
Average core deposits up
$4.4B, or 6% sequentially
•
Extended $18 billion of new
and renewed credit
Strong operating trends
•
Nonperforming assets declined
3% and nonperforming loans
declined 7% sequentially
(lowest levels since 2Q09)
–
Total delinquencies
declined 15% sequentially
(lowest level since 3Q07)
•
Net charge-offs declined 18%
sequentially (lowest level since
1Q09)
•
Allowance to loan ratio of
4.91%, 139% of nonperforming
loans and leases and 1.6 times
annualized 1Q10 net charge-
offs
•
Realized credit losses have
been significantly below SCAP
scenarios
Significant improvements in credit
•
Tangible common equity
ratio of 6.4%
•
Tier 1 common ratio of
7.0%
•
Leverage ratio of 12.0%
(8.9% ex-TARP)
•
Tier 1 capital ratio of
13.4% (10.0% ex-TARP)
Robust capital levels |
 5
Fifth Third Bank | All Rights Reserved
Peer performance summary
Source: SNL and company reports.
(1)
Regional bank peer average consists of BBT, CMA, HBAN, KEY, MTB,
MI, PNC, RF, STI, USB, WFC, and ZION, unless otherwise noted.
(2)
Midwest peer average consists of CMA, HBAN, KEY, MI, and USB, unless
otherwise noted. *
Operating fee growth, core pre-tax pre-provision earnings, and operating
efficiency ratio exclude the following items: securities gains/losses, gains/losses from debt
extinguishments, leveraged lease gains/losses, gains from asset sales, goodwill
impairment charges, and other non-recurring items. Average loans include only loans
held-for-investment. NPAs exclude loans held-for-sale and covered
assets. Continued relative outperformance on key value drivers
FITB
1Q10
Regional
bank peers
(1)
1Q10
Midwest
peers
(2)
1Q10
SEQ performance
vs. peers
Net interest margin /
(bps)
3.63% (+8)
3.60% (+13)
3.37% (+18)
Better
Operating fee growth*
-1%
-9%
-5%
Better
Core pre-tax pre-provision earnings* / loans
2.9%
2.7%
2.6%
Better
Operating efficiency ratio*
62%
64%
65%
Better
Average core deposits growth
6%
0%
0%
Better
Average loan growth*
1%
-1%
-2%
Better
NPA ratio* /
(bps)
4.02% (-20)
4.33% (+11)
3.47% (-7)
Better
Net charge-off ratio /
(bps)
3.01% (-61)
2.48% (-46)
2.86% (-90)
Area of focus |
 6
Fifth Third Bank | All Rights Reserved
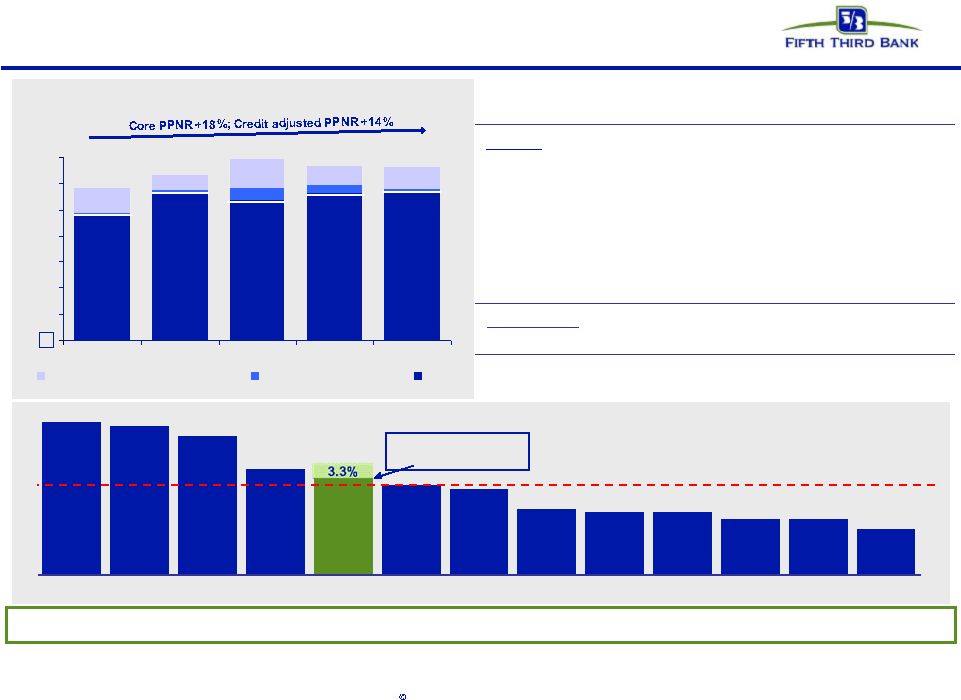
Pre-tax pre-provision earnings
4.6%
4.5%
4.2%
3.2%
2.9%
2.7%
2.6%
2.0%
1.9%
1.9%
1.7%
1.7%
1.4%
WFC
USB
PNC
BBT
FITB
MTB
HBAN
KEY
MI
CMA
STI
RF
ZION
Peer average: 2.7%
1Q10 core PPNR / average loans (annualized)*
Core PPNR trend
Fifth
Third’s
pre-tax,
pre-provision
net
revenue
(PPNR)
to
loans
higher
than
most
regional
bank
peers
Core PPNR reconciliation
Credit
adjusted
PPNR
/
Average
Loans
Source: SNL and company reports. Core PPNR excludes securities gains/losses,
gains/losses from debt extinguishments, leveraged lease gains/losses, gains from asset
sales, goodwill impairment charges, divested fees and expenses related to FTPS, and
other non-recurring items where appropriate. Credit-related adjustments include
mortgage
repurchase
expenses,
provision
for
unfunded
commitments
expense,
derivative
valuation
adjustments,
OREO
expenses
and
other
workout
related
expenses.
94
57
111
73
91
483
564
535
562
3
8
45
30
1
$0
$100
$200
$300
$400
$500
$600
$700
1Q09
2Q09
3Q09
4Q09
1Q10
Core
Fee Income Credit Items
Noninterest Expense Credit Items
569
1Q09
2Q09
3Q09
4Q09
1Q10
Reported PPNR (GAAP)
$511
$2,393
$844
$562
$568
Adjustments:
Gain on sale of Visa shares
-
-
(244)
-
-
BOLI charge
54
-
-
-
-
Gain from sale of processing interest
-
(1,764)
6
-
-
Divested merchant and EFT revenue
(155)
(169)
-
-
-
Class B Visa swap fair value adjustment
-
-
-
-
9
Securities gains/losses
24
(5)
(8)
(2)
(14)
Visa litigation reserve expense
-
-
(73)
-
-
Other litigation reserve expense
-
-
-
22
4
FTPS Warrants
-
-
-
(20)
2
Seasonal pension expense
-
-
10
-
-
FDIC special assessment
-
55
-
-
-
Divested merchant and EFT expense (estimated)
49
54
-
-
-
Core PPNR
$483
$564
$535
$562
$569
Credit Related Items:
OREO write-downs, FV adjs, & G/L on loan sales
3
8
45
30
1
Problem asset work-out expenses
94
57
111
73
91
Credit adjusted PPNR
$580
$629
$691
$665
$661 |
 7
Fifth Third Bank | All Rights Reserved
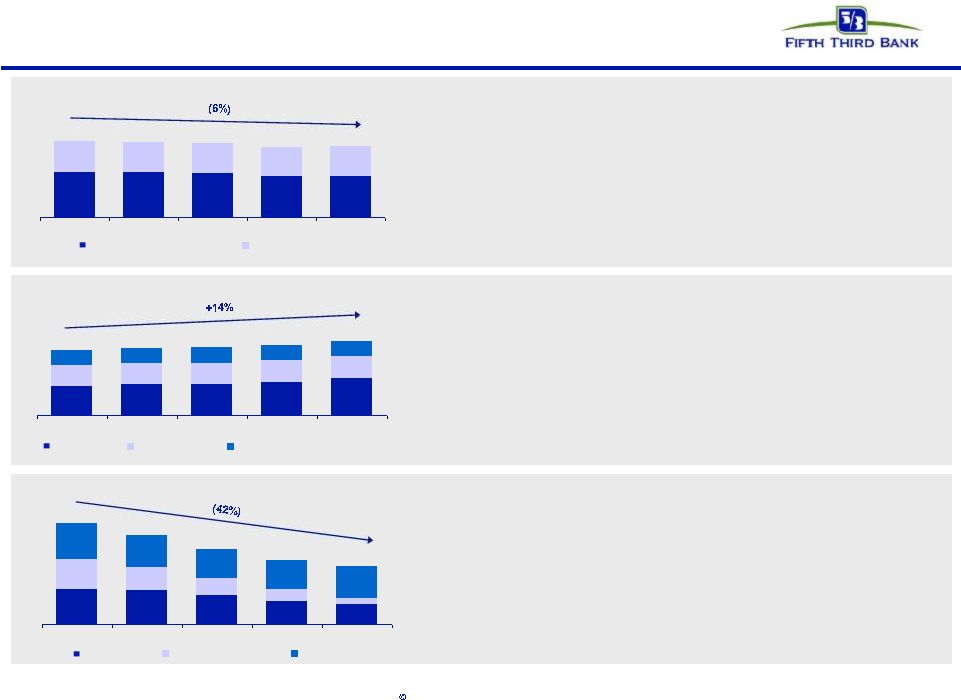
Stable income and expense in difficult environment
Core fee income ($M)
Core expenses ($M)
•
Strong mortgage banking results continued in 1Q10,
resulting in $3.5B of originations and $152M in net
revenue
•
Investment advisory revenue up 5% from previous qtr
•
Card and processing revenue sequential decrease 4%
–
Debit interchange: $46M 1Q10; $177M 2009
–
Credit interchange: $21M 1Q10; $85M 2009
•
Corporate banking revenue down 8% sequentially
driven by declines in business lending fees, foreign
exchange revenue, and institutional sales
•
Credit-related costs affected fee income by $1M in
1Q10 compared with $30M the previous quarter
•
Sequential increase in core expenses driven by
elevated credit costs and seasonal benefits expense
partially offset by disciplined discretionary expense
control
•
Core efficiency ratio of 62.4% in 1Q10, an improvement
from 65.1% in 1Q09
•
Credit-related costs affected non-interest expenses by
$91M in 1Q10 compared with $73M the previous
quarter
•
Total expense related to mortgage repurchases ~$39M
in 1Q10 compared with $18M in 4Q09 and $6M in 1Q09
* Refer to slide 6 for itemized effects of non-core fees and expenses
620
645
605
629
624
624
653
650
659
625
$0
$100
$200
$300
$400
$500
$600
$700
1Q09
2Q09
3Q09
4Q09
1Q10
Core
Fee Income Excluding Credit Items
913
912
938
945
952
819
856
828
872
861
$0
$100
$200
$300
$400
$500
$600
$700
$800
$900
$1,000
1Q09
2Q09
3Q09
4Q09
1Q10
Core
Noninterest Expense Excluding Credit Items |
 8
Fifth Third Bank | All Rights Reserved
Net interest income
Core NII and NIM*
•
Trends in net interest income and net
interest margin favorably compare with
peers
–
NIM up 8 bps in 1Q10 vs. 4Q09
•
Expect continued margin benefit
through 2010 from CD maturities and
improved loan spreads
(bps)
Reported NIM and YOY growth versus peers
Peers include: BBT, CMA, HBAN, KEY, MI, MTB, PNC, RF, STI, USB, WFC, ZION
Source: SNL and company reports
*
Core
results
exclude
$6M
charge
related
to
leveraged
lease
litigation
in
1Q09.
Also
excluded
are
$41M,
$35M,
$27M,
$24M,
and
$19M
in
loan
discount accretion from the First Charter acquisition in 1Q09, 2Q09, 3Q09, 4Q09,
and 1Q10 respectively. Yields and rates*
($Ms)
$746
$801
$847
$859
$882
2.92%
3.13%
3.33%
3.45%
3.55%
2.0%
2.5%
3.0%
3.5%
4.0%
1Q09
2Q09
3Q09
4Q09
1Q10
$400
$500
$600
$700
$800
$900
Net interest income (right axis)
NIM
3.63%
57 bps
3.60%
36 bps
NIM
NIM growth
FITB
Peer average
1.0%
2.0%
3.0%
4.0%
5.0%
1Q09
2Q09
3Q09
4Q09
1Q10
0
100
200
300
400
Spread (right axis)
Asset yield
Liability rate |
 9
Fifth Third Bank | All Rights Reserved
Balance sheet:
Continued growth in core funding
•
Extended $18B of new and renewed credit in 1Q10
•
CRE loans down 4% sequentially and 12% from the previous year
–
New homebuilder/developer, non-owner occupied CRE suspended 2008
•
C&I loans down 1% sequentially and 12% from the previous year largely due
to lower line utilization and soft demand*
•
Strong
mortgage
originations
-
$1.5B in residential mortgage loans held-for-
sale warehouse (not carried in loans held-for investment)
•
Core deposit to loan ratio of 97%, up from 80% in 1Q09
•
Everyday Great Rates strategy continues to drive core deposit growth
–
DDAs
up 4% sequentially and 21% from the previous year
–
Commercial core deposits up 20% sequentially and 46% from the previous
year
–
Retail
core
deposits
up
1%
sequentially
and
3%
from
the
previous
year
Average loan growth ($B)^
Average core deposit growth ($B)
84
82
80
78
78
67
69
70
72
76
Average wholesale funding ($B)
35
31
26
20
22
•
Reduced wholesale funding by $1.9 billion sequentially and $14.7
billion from
the previous year
–
Non-core deposits down 14% sequentially and 40% from the previous year
–
Short term borrowings down 52% sequentially and 84% from the previous
year
–
Long-term debt up 10% sequentially and down 8% from the previous year
•
Portion of excess core funding invested in agency mortgage-backed securities
(balance sheet hedges added to mitigate interest rate risk)
^ Excludes loans held-for-sale
* Excludes the impact of $724M in C&I balances that were consolidated on
January 1, 2010 Note: Numbers may not sum due to rounding
50
49
48
45
45
34
33
33
32
33
1Q09
2Q09
3Q09
4Q09
1Q10
Commercial Loans
Consumer Loans
30
32
32
34
38
21
21
21
22
23
16
16
17
16
15
1Q09
2Q09
3Q09
4Q09
1Q10
Demand/IBT
Savings/MMDA
Consumer CD/Core foreign
12
12
10
8
7
10
8
6
4
2
13
11
10
10
11
1Q09
2Q09
3Q09
4Q09
1Q19
Non-core deposits
ST borrowings
LT debt |
 Improving credit results
Source: SNL and company reports. NPA and NCO ratios exclude loans
held-for-sale and covered assets for peers where appropriate. * 4Q08
net charge-offs included $800M in NCOs related to commercial losses moved to held-for-sale
NPA ratio vs. peers
Net charge-off ratio vs. peers*
Loans 90+ days delinquent % vs. peers
Loans 30-89 days delinquent % vs. peers
10
Fifth Third Bank | All Rights Reserved |
 11
Fifth Third Bank | All Rights Reserved
Manageable commercial real estate exposure
CRE / Assets
Source: SNL and company reports.
Peer average: 215%
CRE / (TCE + Reserves)
Peer average: 18%
12%
12%
11%
11%
8%
33%
30%
24%
24%
24%
15%
14%
MI
MTB
ZION
RF
CMA
KEY
HBAN
FITB
STI
USB
BBT
WFC
PNC
473%
312%
295%
264%
209%
173%
168%
154%
147%
143%
136%
123%
117%
MTB
MI
RF
ZION
CMA
USB
HBAN
KEY
STI
BBT
FITB
WFC
PNC
13%
CRE exposure lower than peer average; problems relatively more manageable given capital and
reserves |
 12
Fifth Third Bank | All Rights Reserved
$1,500
$1,750
$2,000
$2,250
$2,500
$2,750
$3,000
$3,250
$3,500
$3,750
$4,000
$4,250
$4,500
$4,750
$5,000
$5,250
$5,500
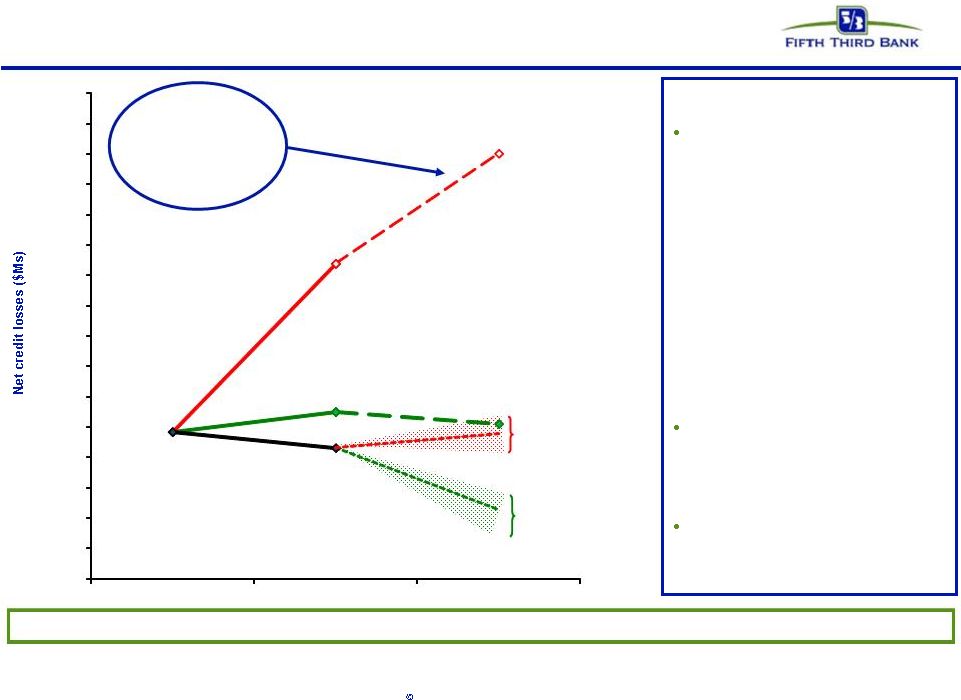
Updated credit loss expectations vs. SCAP scenarios
Realized credit losses have been significantly below SCAP submissions; expected to
continue 2008
2009
2010
*
Red SCAP line represents more adverse scenario as adjusted by supervisors for
additional assumed two-year losses. Supervisory estimates of total two-year losses
under more adverse scenario were not allocated by period. Estimate allocates total
two-year supervisory losses using the allocation under Fifth Third’s submission.
** Source for macroeconomic assumptions: Moody’s Economy.com. Assumptions as
of March 2010. Fifth Third
capitalized for this
level of credit
losses under SCAP
(plus surplus raised
vs. buffer)
$4.1B
$5.0B
$2.8B
Moody’s Weaker
Recovery / Mild
Second Recession
Case** Assumptions
(Mar. 2010)
Moody’s Base
Case** Assumptions
(Mar. 2010)
SCAP Baseline Scenario
(Submitted; Mar 2009)
SCAP Adverse Scenario*
(Supervisory; Mar 2009)
Actual
$2.6B
Actual
$2.7B
$2.9B
Fifth Third’s realized credit losses
have been significantly below its
SCAP submitted baseline and
more adverse scenarios
–
In SCAP submissions, we
incorporated significant
conservatism, given then
prevailing negative economic
and industry trends and
extreme uncertainty in
potential loss outcomes
–
Economic and credit market
conditions are much
improved versus those
expected in spring 2009
Base and stress scenarios reflect
Moody’s Base Case and Moody’s
Weaker Recover / Mild Second
Recession Case (as of March
2010)**
Our current expectation is for
2010 losses to be lower than 2009 |
 13
Fifth Third Bank | All Rights Reserved
Strong reserve position
Coverage ratios are strong relative to peers
Industry leading reserve level
1.
FITB
4.91%
2.
KEY
4.34%
3.
ZION
4.05%
4.
HBAN
4.00%
5.
RF
3.61%
6.
MI
3.57%
7.
PNC
3.38%
8.
WFC
3.22%
9.
USB
2.80%
10.
STI
2.79%
11.
BBT
2.65%
12.
CMA
2.42%
13.
MTB
1.75%
Peer Average
3.21%
Reserves / Loans
490
626
756
708
582
196
283
415
68
8
4.88%
4.91%
3.31%
4.28%
4.69%
0%
1%
2%
3%
4%
5%
1Q09
2Q09
3Q09
4Q09
1Q10
$0
$200
$400
$600
$800
$1,000
$1,200
$1,400
Net Charge-offs
Additional Provision
Reserves
139%
122%
161%
90%
78%
141%
Reserves / NPLs
Reserves / NPAs
Reserves / Annualized NCOs
FITB
Peer Average
Source: SNL and company reports. NPAs/NPLs exclude held-for-sale portion for all banks and
covered assets for BBT, USB, and ZION. |
 14
Fifth Third Bank | All Rights Reserved
Robust capital position
Source: SNL and company reports.
* MTB Tier 1 common ratio as of 12/31/09.
Strong capital ratios relative to peers, particularly considering reserve
levels 11.7%
10.4%
10.3%
10.0%
9.9%
9.9%
9.9%
9.6%
8.7%
8.3%
8.2%
7.9%
7.4%
BBT
CMA
PNC
FITB
WFC
KEY
USB
STI
HBAN
ZION
RF
MTB
MI
16.8%
15.9%
14.3%
14.1%
13.7%
12.7%
12.5%
12.2%
12.2%
12.0%
11.9%
10.6%
8.6%
KEY
CMA
FITB
MI
WFC
RF
STI
BBT
ZION
HBAN
PNC
USB
MTB
(TCE + reserves) / Loans
Peer average: 12.8%
Peer average w/
TARP: 11.1%
Peer average
w/o TARP: 9.4%
Tier 1 capital ratio (with and without TARP)
8.9%
11.1%
13.1%
12.0%
11.2%
13.4%
12.9%
11.7%
Tangible common equity ratio
9.7%
8.0%
7.4%
6.8%
6.7%
6.4%
6.3%
6.2%
6.1%
5.8%
5.4%
5.4%
5.3%
CMA
MI
KEY
WFC
STI
FITB
ZION
BBT
RF
HBAN
MTB
USB
PNC
Peer average: 6.6%
Tier 1 common ratio
9.6%
8.7%
7.9%
7.7%
7.5%
7.3%
7.1%
7.1%
7.1%
7.1%
7.0%
6.5%
5.7%
CMA
BBT
PNC
STI
KEY
MI
RF
USB
WFC
ZION
FITB
HBAN
MTB*
Peer average: 7.4% |
 15
Fifth Third Bank | All Rights Reserved
Strong liquidity profile
Net loans and leases / core deposits
Source: 3/31/2010 Company Y9C reports
*Noncore funding dependence as of 12/31/09 as 3/31/10 BHCPR reports not yet
available •
Over the past year, Fifth Third has reduced its net noncore funding reliance by 20%,
more than any peer other than Comerica*
–
Fifth
Third
has
the
2
nd
lowest
net
noncore
funding
dependence
among
its
peers*
•
Fifth Third has no holding company debt maturing in the next year and less than 1% of
consolidated Bancorp debt, lower than peers
Peer average: 104%
92%
94%
98%
98%
99%
102%
105%
106%
107%
107%
111%
112%
116%
PNC
HBAN
RF
FITB
ZION
STI
MI
KEY
BBT
WFC
MTB
CMA
USB |
 16
Fifth Third Bank | All Rights Reserved
Strong liquidity profile
Retail Brokered CD maturities: $813M in 2010; $31M in 2011
3/31 unused avail. capacity $27B ($18.5B in Fed and $8.7B in FHLB)
FHLB borrowings $2.6B; Q1 avg. core deposits $76B; equity $14B
All market borrowings by Fifth Third Bank
Holding Company cash at 3/31/10: $1.35B
—
Total Fed deposits ~$4.0B
Expected cash obligations over the next 12 months (assuming no
TARP repayment)
—
$0 debt maturities
—
~$39M common dividends
—
~$205M preferred dividends (~$35M Series G, ~$170M TARP)
—
~$237M interest and other expenses
Cash currently sufficient to satisfy all fixed obligations* over
the
next
24 months without accessing capital markets/subsidiary
dividends
Bank unsecured debt maturities ($M –
excl. Brokered CDs)
Heavily core funded
Holding company unsecured debt maturities ($M)
* Debt maturities, common and preferred dividends, interest and other expenses
$52
$500
$500
0
0
0
2010
2011
2012
2013
2014
2015 on
0
0
0
$750
0
$5.0B
2010
2011
2012
2013
2014
2015 on
Fifth Third Bancorp
Fifth Third Capital Trust |
 17
Fifth Third Bank | All Rights Reserved
2010 developments
Fifth Third response
Macro themes
•
Sluggish loan demand
•
Deposits to grow but
expect some diminution
as later liquidity drawn
down by deposits to
support expansion in
spending
•
Additional consumer
regulation
•
Higher interest rates late
2010 / early 2011
•
TARP repayment
•
Leverage existing customer relationships at the local level to
offer our full portfolio of products and services across all of
our lines of business
•
Invest in sales force expansion initiatives to increase
resources and branch hours while maintaining focus on
a near-term return to
profitability •
Reorient fee structure of products and services to offer a clearer
and higher value proposition to our clients and create more
sustainable, consistent growth
•
Maintain excess liquidity, neutral to modest asset sensitive
positioning
•
Remain committed to repayment in a manner that is in the best
interest of all constituents, including shareholders |
 18
Fifth Third Bank | All Rights Reserved
Continuing to invest for the future
18
Fifth Third Bank | All Rights Reserved |
 19
Fifth Third Bank | All Rights Reserved
Summary
Fifth Third continues to execute on its strategic initiatives and
is focused on being well-positioned for the turn of the cycle.
•
Dedicated to serving the needs
of families and businesses for
more than 150 years
•
Businesses creating new and
profitable opportunities to
enhance value
•
Trends in NII and NIM
favorably compare with peers
•
Ongoing expense control
•
Continued shift back toward
core funding
Core franchise remains strong
•
Strong reserve coverage of
problem loans
•
Aggressive management has
mitigated areas of highest risk
•
Significantly enhanced SAG
and workout resources, while
continuing prudent lending
practices
•
Significantly improved credit
trends in 1Q10
Aggressive management of
credit issues
•
Successfully completed June
2008 capital plan and SCAP
capital actions
•
Actions exceeded SCAP Tier 1
common equity commitment
by 80%
•
Current capital levels able to
withstand significant additional
economic deterioration as
demonstrated by the SCAP
assessment
Robust capital levels |
 20
Ó
Fifth Third Bank | All Rights Reserved
Cautionary statement
This report may contain statements that we believe are “forward-looking statements”
within the meaning of Section 27A of the Securities Act of 1933, as amended, and Rule 175
promulgated thereunder, and Section 21E of the Securities Exchange Act of 1934, as amended, and Rule 3b-6
promulgated thereunder. These statements relate to our financial condition, results of operations,
plans, objectives, future performance or business. They usually can be identified by the use of
forward-looking language such as “will likely result,” “may,” “are expected to,” “is
anticipated,” “estimate,” “forecast,” “projected,” “intends
to,” or may include other similar words or phrases such as “believes,” “plans,” “trend,”
“objective,” “continue,” “remain,” or similar expressions, or future or
conditional verbs such as “will,” “would,” “should,” “could,” “might,” “can,” or
similar verbs. You should not place undue reliance on these statements, as they are subject to risks
and uncertainties, including but not limited to the risk factors set forth in our most recent
Annual Report on Form 10-K and our most recent quarterly report on Form 10-Q. When considering
these forward-looking statements, you should keep in mind these risks and uncertainties, as well
as any cautionary statements we may make. Moreover, you should treat these statements as
speaking only as of the date they are made and based only on information then actually known to
us.
There are a number of important factors that could cause future results to differ materially from
historical performance and these forward-looking statements. Factors that might cause such
a difference include, but are not limited to: (1) general economic conditions and weakening in the
economy, specifically the real estate market, either nationally or in the states in which Fifth Third,
one or more acquired entities and/or the combined company do business, are less favorable than
expected; (2) deteriorating credit quality; (3) political developments, wars or other
hostilities may disrupt or increase volatility in securities markets or other economic conditions; (4)
changes in the interest rate environment reduce interest margins; (5) prepayment speeds, loan
origination and sale volumes, charge-offs and loan loss provisions; (6) Fifth Third’s ability to
maintain required capital levels and adequate sources of funding and liquidity; (7) maintaining
capital requirements may limit Fifth Third’s operations and potential growth; (8) changes
and trends in capital markets; (9) problems encountered by larger or similar financial institutions may
adversely affect the banking industry and/or Fifth Third (10) competitive pressures among depository
institutions increase significantly; (11) effects of critical accounting policies and judgments;
(12) changes in accounting policies or procedures as may be required by the Financial Accounting
Standards Board (FASB) or other regulatory agencies; (13) legislative or regulatory changes or
actions, or significant litigation, adversely affect Fifth Third, one or more acquired entities
and/or the combined company or the businesses in which Fifth Third, one or more acquired entities
and/or the combined company are engaged; (14) ability to maintain favorable ratings from rating
agencies; (15) fluctuation of Fifth Third’s stock price; (16) ability to attract and
retain key personnel; (17) ability to receive dividends from its subsidiaries; (18) potentially dilutive effect of future
acquisitions on current shareholders’ ownership of Fifth Third; (19) effects of accounting or
financial results of one or more acquired entities; (20) difficulties in separating Fifth Third
Processing Solutions from Fifth Third; (21) loss of income from any sale or potential sale of businesses that
could have an adverse effect on Fifth Third’s earnings and future growth; (22) ability to secure
confidential information through the use of compute systems and telecommunications networks; and
(23) the impact of reputational risk created by these developments on such matters as business
generation and retention, funding and liquidity.
You should refer to our periodic and current reports filed with the Securities and Exchange
Commission, or “SEC,” for further information on other factors, which could cause
actual results to be significantly different from those expressed or implied by these forward-looking statements. |
 Fifth Third Bank | All Rights Reserved
Investor Update
Supplement
May 2010
Please refer to earnings release dated April 22, 2010 and 10-Q dated
May 7, 2010 for further information, including full results reported on a U.S.
GAAP basis |
 2
Fifth Third Bank | All Rights Reserved
Balance Sheet:
Average loans & leases
Average core deposits
Income Statement:
Net interest income*
Net interest margin*
Noninterest income
Noninterest expense
Pre-provision net revenue
Asset Quality:
Net charge-offs
Loan loss allowance^
Nonperforming assets^
Capital Ratios:
Tier I common equity
Tier I leverage
Tier I capital
Total risk-based capital
Category
Fifth Third: Second quarter 2010 outlook
2Q10 Outlook
$80.1 billion
$76.3 billion
$901 million
3.63%
$627 million
$956 million
$568 million
$582 million
$3.8 billion (4.9%)
$3.1 billion (4.0%)
7.0%
12.0%
13.4%
17.6%
Relatively stable
Consistent with 1Q10
Consistent with 1Q10 or
up modestly
~$600 million +/-
Down ~$10-$15 million
Consistent with 1Q10
Down ~$100 million +/-
Begin to decline
Relatively stable
Stable to modestly
higher
Please see cautionary statement for risk factors related to forward-looking
statements. * Presented on a fully-taxable equivalent basis.
^ Ratios as a percent of loans excluding held-for-sale.
1Q10 Actual Results |
 3
Fifth Third Bank | All Rights Reserved
Fifth Third credit ratings
Fifth Third Bancorp
Moody's
Standard & Poor's
Fitch
DBRS
Short Term Debt
P-2
Short Term Issuer
A-2
Short Term Issuer
F1
Short Term
R-1L
Senior Unsecured
Baa1
Long Term Issuer
BBB
Long Term Issuer
A-
Long Term Issuer
AL
Individual Rating
C
Outlook
Negative
Outlook
Negative
Outlook
Negative
Outlook
Stable
Outlook Date
4/14/2009
Outlook Date
6/17/2009
Outlook Date
6/23/2009
Outlook Date
11/24/2009
Fifth Third Bank (OH)
Moody's
Standard & Poor's
Fitch
DBRS
Short Term Debt
P-1
Short Term Issuer
A-2
ST Issuer Default
F1
Short Term
R-1L
Long Term Issuer
A2
Long Term Issuer
BBB+
Long Term Issuer
A-
Long Term Deposit
A
Long Term Deposit
A2
Long Term Deposit
A
Senior Unsecured
A |
 4
Fifth Third Bank | All Rights Reserved
Fifth Third outstanding debt
Outstanding Debt
Holding Company
Type
Issue Date
Maturity Date
Amount
Rate Type
Rate
Senior Notes
04/30/08
05/01/13
$ 750,000,000
Fixed
6.25%
Subordinated Debt
12/13/06
12/20/16
$ 250,000,000
Floating
3ML + .42%
Subordinated Debt
12/20/06
01/15/17
$ 500,000,000
Fixed
5.45%
Subordinated Debt
05/23/03
06/01/18
$ 500,000,000
Fixed
4.50%
Trust Preferred*
04/10/02
04/22/32
$
25,774,000 Floating
6ML + 3.70%
Trust Preferred*
12/19/02
12/26/32
$
10,310,000 Floating
3ML + 3.25%
Trust Preferred*
08/08/03
09/17/33
$
15,464,000 Floating
3ML + 3.10%
Trust Preferred*
12/31/03
12/30/33
$
41,238,000 Floating
3ML + 2.79%
Trust Preferred*
03/31/04
06/17/34
$
25,774,000 Floating
3ML + 2.90%
Trust Preferred*
06/28/05
09/15/35
$
36,083,000 Floating
3ML + 1.42%
Trust Preferred*
09/29/05
12/15/35
$
25,774,000 Floating
3ML + 1.69%
Subordinated Debt
03/04/08
03/01/38
$ 1,000,000,000
Fixed
8.25%
Trust Preferred
03/30/07
04/15/47
$ 750,000,000
Fixed / Float
6.5% / 3ML + 1.37%
Trust Preferred
08/08/07
08/15/67
$ 575,000,000
Fixed / Float
7.25% / 3ML + 2.57%
Trust Preferred
10/23/07
11/15/67
$ 862,500,000
Fixed / Float
7.25% / 3ML + 3.03%
Trust Preferred
05/06/08
05/15/68
$ 400,000,000
Fixed / Float
8.88% / 3ML + 5.00%
* Acquired through acquisitions
Bank Entity
Type
Issue Date
Maturity Date
Amount
Rate Type
Rate
Senior Notes
05/17/06
05/17/13
$ 500,000,000
Floating
3ML + .11%
Subordinated Debt
01/31/05
02/01/15
$ 500,000,000
Fixed
4.75% |
 5
Fifth Third Bank | All Rights Reserved
Updated stress testing -
process overview
Similar process to that used in 2008 and SCAP processes; updated
for actual
performance and current economic expectations
Moody’s “Base”
and “Weaker Recovery/Mild Second Recession”
scenarios key
economic assumptions
Commercial
—
33 geographic/industry sectors analyzed and regressed against economic and
performance drivers
—
Migration trends from criticized to nonaccrual and charge-off evaluated by
region and industry
Consumer
—
Portfolios subdivided into appropriate categories (i.e. liquidating vs.
non- liquidating home equity)
—
Results derived using combination of regression models, loss curves and roll
rates, and applied economic factors
–
Mortgage and home equity key correlation: HPI
–
Credit card key correlation: unemployment
–
Other consumer key correlations: unemployment and GDP
Base
Adverse
Economic Assumptions*
2010
2010
Peak Unemployment
10.3%
11.4%
GDP
2.4%
0.3%
Avg. change in quarterly HPI
(1.8%)
(2.7%)
* Moody’s Economy.com; as of March 2010 |
 6
Fifth Third Bank | All Rights Reserved
Fifth Third Bank: Strongly capitalized
Data as of 1Q10. Source: SNL Financial.
Fifth Third Bank is the most well-capitalized large U.S. bank.
Tier 1
Total Capital
Capital Ratio
Ratio
Lead Banks
1Q10
Lead Banks
1Q10
Fifth Third Bank
13.9%
Fifth Third Bank
15.9%
CitiBank, NA
13.6%
CitiBank, NA
15.5%
BB&T (Bank)
12.3%
PNC Bank, National Association
15.1%
PNC Bank, National Association
11.5%
BB&T (Bank)
14.8%
Regions Bank
10.6%
KeyBank
National Association
14.4%
Bank of America, National Association
10.5%
JPMorgan Chase Bank, National Association
14.1%
Capital One, National Association
10.3%
Bank of America, National Association
14.0%
Wells Fargo Bank, National Association
10.2%
Regions Bank
13.9%
KeyBank
National Association
10.2%
Comerica Bank
13.7%
JPMorgan Chase Bank, National Association
10.0%
Wells Fargo Bank, National Association
13.3%
Comerica Bank
9.6%
M&I
Marshall
and
Illsey
Bank
12.8%
M&I
Marshall
and
Illsey
Bank
9.2%
SunTrust Bank
12.2%
SunTrust Bank
8.9%
Manufacturer's and Traders Bank
12.0%
Manufacturer's and Traders Bank
8.2%
Capital One, National Association
11.7%
U.S. Bank National Association
7.6%
Huntington Bancshares, NA
11.5%
Huntington Bancshares, NA
7.1%
U.S. Bank National Association
11.4%
Peer Average
10.0%
Peer Average
13.4% |
 7
Fifth Third Bank | All Rights Reserved
Industry leading reserve levels
Reserves / NPAs
Reserves / Loans
Data as of 1Q10. Source: SNL Financial and company reports.
NPLs
and NPAs
exclude loans held-for-sale.
Reserves / Net Charge-offs (Annualized)
Reserves / NPLs
Peer average: 3.2%
Peer average: 141%
Peer average: 90%
Peer average: 78%
4.9%
4.3%
4.1%
4.0%
3.6%
3.6%
3.4%
3.2%
2.8%
2.8%
2.7%
2.4%
1.8%
FITB
KEY
ZION
HBAN
RF
MI
PNC
WFC
USB
STI
BBT
CMA
MTB
150%
139%
117%
94%
92%
92%
86%
85%
84%
80%
76%
67%
61%
USB
FITB
KEY
BBT
PNC
WFC
RF
CMA
HBAN
MI
ZION
MTB
STI
131%
122%
109%
81%
80%
79%
77%
74%
64%
64%
62%
61%
54%
USB
FITB
KEY
PNC
WFC
CMA
HBAN
RF
ZION
MI
MTB
BBT
STI
236%
192%
174%
161%
155%
143%
143%
118%
116%
115%
114%
97%
89%
MTB
PNC
ZION
FITB
HBAN
BBT
CMA
WFC
KEY
USB
RF
STI
MI |
 8
Fifth Third Bank | All Rights Reserved
1Q10 net charge off and NPA ratios
Fifth Third Bank key credit metrics have moved in line with other large U.S.
banks Data as of 1Q10. Source: SNL Financial and company reports.
Bank
1Q10 NCO
Ratio
Bank
1Q10 NPA
Ratio
M&T Bank Corporation
0.7%
U.S. Bancorp
2.3%
Comerica Incorporated
1.7%
JPMorgan Chase & Co.
2.7%
PNC Financial Services Group, Inc.
1.8%
M&T Bank Corporation
2.8%
BB&T Corporation
1.9%
Comerica Incorporated
3.1%
Zions Bancorporation
2.3%
Bank of America Corporation
3.7%
U.S. Bancorp
2.4%
Fifth Third Bancorp
4.0%
Huntington Bancshares Incorporated
2.6%
Wells Fargo & Company
4.0%
Wells Fargo & Company
2.7%
PNC Financial Services Group, Inc.
4.1%
SunTrust Banks, Inc.
2.9%
Citigroup Inc.
4.2%
Fifth Third Bancorp
3.0%
KeyCorp
4.3%
Regions Financial Corporation
3.2%
BB&T Corporation
4.4%
KeyCorp
3.7%
Regions Financial Corporation
5.2%
Marshall & Ilsley Corporation
3.9%
Huntington Bancshares Incorporated
5.2%
Bank of America Corporation
4.4%
SunTrust Banks, Inc.
5.3%
JPMorgan Chase & Co.
4.4%
Marshall & Ilsley Corporation
5.6%
Citigroup Inc.
4.6%
Zions Bancorporation
6.4%
Capital One Financial Corporation
6.1%
Capital One Financial Corporation
N/A
Top U.S. Bank Average
3.1%
Top U.S. Bank Average
4.2% |
 9
Fifth Third Bank | All Rights Reserved
Portfolio performance drivers
Performance Largely Driven By
No Participation In
Discontinued or Suspended Lending
*
Residential construction-related consumer mortgages intended to be held in
portfolio until permanent financing complete. Jumbo mortgage originations currently
being held due to market conditions.
Geography
•
Florida and Michigan most stressed
•
Remaining Midwest and Southeast performance
reflect economic trends
Products
•
Homebuilder/developer
charge-offs
$81
million
in
1Q10
–
Total
charge-off
ratio
3.0%
(2.4%
ex-HBs)
–
Commercial
charge-off
ratio
3.1%
(2.6%
ex-
HBs)
•
Brokered
home
equity
charge-offs
6.2%
in
1Q10
–
Direct home equity portfolio 1.6%
1Q10 NCO Ratios
Coml
Cons
Total
FL/MI
5.5%
5.2%
5.3%
Other
2.3%
2.1%
2.2%
•
Subprime
•
Option ARMs
Discontinued in 2007
•
Brokered home equity ($1.9B)
Suspended in 2008
•
Homebuilder/residential development ($1.3B)
•
Other non-owner occupied commercial RE
excluding homebuilder/developer ($8.0B)
Saleability
•
All mortgages originated for intended sale*
Total
3.1%
2.9%
3.0% |
 10
Fifth Third Bank | All Rights Reserved
Credit by portfolio*
Net charge-offs by loan type
Net charge-offs by geography
*NPAs
exclude loans held-for-sale.
Ratios in above tables are subject to rounding.
($ in millions)
C&I
Commercial
mortgage
Commercial
construction
Commercial
lease
Total
commercial
Residential
mortgage
Home equity
Auto
Credit card
Other
consumer
Total
consumer
Total loans &
leases
Loan balances
$26,131
$11,744
$3,277
$3,388
$44,541
$7,918
$12,186
$10,180
$1,863
$736
$32,882
$77,423
% of total
34%
15%
4%
4%
58%
10%
16%
13%
2%
1%
42%
NPAs
$788
$1,002
$569
$55
$2,414
$521
$70
$22
$101
$1
$715
$3,129
NPA / Loans + OREO
3.01%
8.43%
16.95%
1.62%
5.39%
6.48%
0.57%
0.22%
5.45%
0.12%
2.16%
4.02%
Net charge-offs
$161
$99
$78
$4
$342
$88
$73
$31
$44
$4
$240
$582
Net charge-off ratio
2.49%
3.42%
8.57%
0.44%
3.07%
4.46%
2.38%
1.27%
9.23%
2.07%
2.93%
3.01% |
 11
Fifth Third Bank | All Rights Reserved
Non-performing assets and net charge-offs:
Product view*
* NPAs
exclude loans held-for-sale. Net charge-offs exclude losses on loans
sold or transferred to held-for-sale in 4Q08. During 1Q09 the Bancorp
modified its nonaccrual policy to exclude TDR loans less than 90 days past due because they were performing in accordance with restructured
terms. For comparability purposes, prior periods were adjusted to reflect this
reclassification. Total NPAs
Total NCOs |
 12
Fifth Third Bank | All Rights Reserved
Total NPAs
Total NCOs
* NPAs
exclude loans held-for-sale. Net charge-offs exclude losses on loans
sold or transferred to held-for-sale in 4Q08. During 1Q09 the Bancorp
modified its nonaccrual policy to exclude TDR loans less than 90 days past due because they were performing in accordance with restructured
terms. For comparability purposes, prior periods were adjusted to reflect this
reclassification. Non-performing assets and net charge-offs:
Geographic view* |
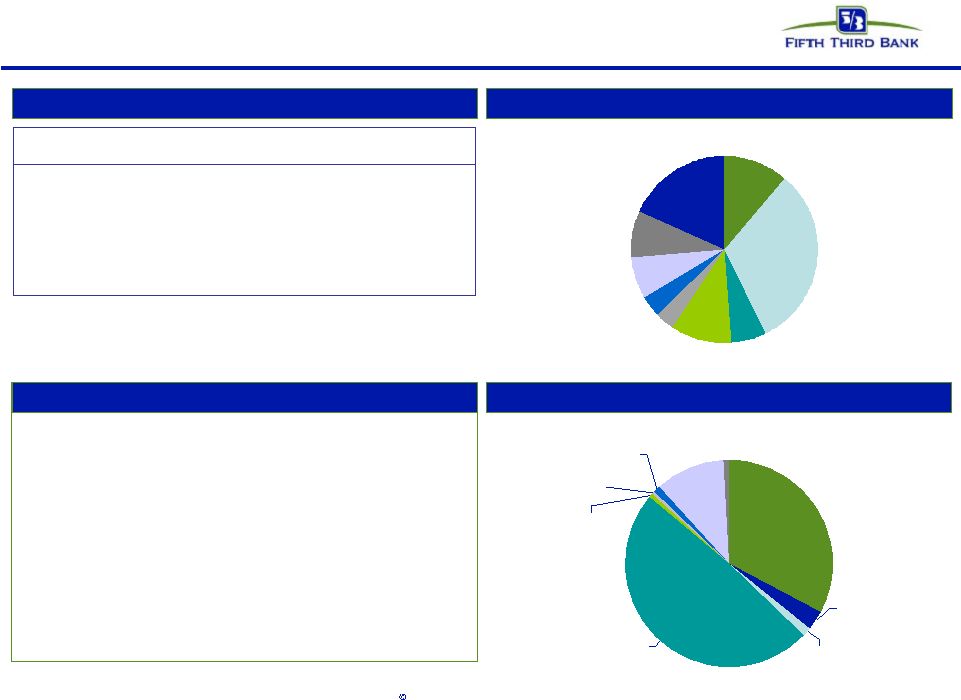
 13
Fifth Third Bank | All Rights Reserved
Nonperforming assets*
•
Total NPAs
of $3.1B
•
Homebuilder/developer
NPAs
of
$520M;
represent 17% of total NPAs
•
Commercial NPAs
of $2.4B; down 5% from
the previous quarter
•
Consumer NPAs
of $715M; up 1% from the
previous quarter
C&I^ (27%)
CRE (50%)
Residential (19%)
Other Consumer (4%)
Residential
$590M
19%
C&I^
$843M
27%
Other
$96M
4%
CRE
$1.6B
50%
^ C&I includes commercial lease
ILLINOIS
INDIANA
FLORIDA
TENNESSEE
KENTUCKY
OHIO
MICHIGAN
NORTH
CAROLINA
OTHER /
NATIONAL
* NPAs
exclude loans held-for-sale. |
 14
Fifth Third Bank | All Rights Reserved
Improving nonperforming loan flows
Commercial
($
in
millions)
Beginning NPL amount
$1,406
$1,937
$2,110
$2,430
$2,392
New nonaccrual loans
799
544
832
602
405
Paydowns, transfers, and sales
(157)
(190)
(246)
(332)
(425)
Charge-offs
(111)
(181)
(266)
(308)
(200)
Ending Commercial NPL
$1,937
$2,110
$2,430
$2,392
$2,172
Consumer
Beginning NPL amount
$457
$459
$477
$517
$555
New nonaccrual loans
157
125
160
152
137
Net other activity
(155)
(107)
(120)
(114)
(131)
Ending Consumer NPL
$459
$477
$517
$555
$561
Total
Total NPL
$2,396
$2,587
$2,947
$2,947
$2,733
Total new nonaccrual loans
$956
$669
$992
$754
$542
$2,396
$2,587
$2,947
$2,733
NPL rollforward
1Q09
2Q09
3Q09
4Q09
1Q10
Total NPLs
New non-accrual loan flows
1,937
2,110
2,430
2,392
2,172
459
477
517
555
561
$0
$500
$1,000
$1,500
$2,000
$2,500
$3,000
$3,500
1Q09
2Q09
3Q09
4Q09
1Q10
Commercial
Consumer
$2,947
$799
$544
$832
$602
$405
$157
$125
$160
$152
$137
$0
$200
$400
$600
$800
$1,000
1Q09
2Q09
3Q09
4Q09
1Q10
Total
Commercial
Consumer |
 15
Fifth Third Bank | All Rights Reserved
Troubled debt restructurings (TDR) overview
Successive improvement in vintage performance during 2008 and
2009, even as volume of modification increased
Fifth Third’s mortgage portfolio TDRs
have redefaulted
at a lower
rate than other bank held portfolio modifications
—
Fifth Third’s TDRs
are about a third less likely to redefault
than modifications on GSE mortgages
Of $1.8B in consumer TDRs, over $1.3B (76%) are current
—
$940M of those have been current more than 6 months,
approximately half of which have been current more than a
year
As current TDRs
season, their default propensity declines
significantly
—
We do not typically see significant defaults on current loans
once a vintage approaches 12 months since modification
Delinquent TDRs
total $415M (24%)
Of $1.8B in consumer TDRs, $1.5B are on accrual status and $271M
are nonaccruals
TDR performance has improved in newer vintages
Outperforming redefault
benchmarks
Source: Fifth Third and OCC/OTS data; data through 3Q09; industry data
cumulative through 3Q09 Mortgage
TDR
60+
redefault
trend
by
vintage
1Q08 $69M
2Q08 $135M
3Q08 $146M
4Q08 $176M
1Q09 $221M
2Q09 $257M
Months since modification
Mortgage
TDR
60+
redefault
rate:
Fifth
Third
comparison
(through Sept. 2009)
Fannie Mae
Industry
portfolio loans
Fifth Third
Volume by
vintage
Freddie Mac
3Q09 $386M
Current consumer TDRs
($ MMs)
0%
10%
20%
30%
40%
50%
3
4
5
6
7
8
9
10
11
12
0%
10%
20%
30%
40%
50%
60%
70%
3 months
6 months
9 months
12 months
448
617
416
208
62
<6 months
6-12 months
12-18 months
18-24 months
24+ months |
  16
Fifth Third Bank | All Rights Reserved
Commercial & industrial*
Loans by geography
Credit trends
Loans by industry
Comments
•
32%
of 1Q10 losses on loans to companies in real estate
related industries
–
Loans to real estate related industries of $3.2B; 1Q10
NCO ratio of 6.6%
–
1Q10 C&I loss rate of 2.5%, excluding loans to real
estate related industries, 1.9%
•
FL represented 16% of 1Q10 losses, 7% of loans; MI
represented 27% of losses, 15% of loans
* NPAs
exclude loans held-for-sale.
($ in millions)
1Q09
2Q09
3Q09
4Q09
1Q10
Balance
$28,617
$28,409
$26,175
$25,683
$26,131
90+ days delinquent
$131
$142
$256
$118
$63
as % of loans
0.46%
0.50%
0.98%
0.46%
0.24%
NPAs
$675
$634
$790
$781
$788
as % of loans
2.36%
2.23%
3.02%
3.04%
3.02%
Net charge-offs
$103
$177
$256
$183
$162
as % of loans
1.45%
2.53%
3.70%
2.81%
2.49%
C&I
16
Fifth Third Bank | All Rights Reserved |
 17
Fifth Third Bank | All Rights Reserved
Commercial mortgage*
Loans by geography
Credit trends
Loans by industry
Comments
•
Owner occupied 1Q10 NCO ratio of 2.1%, other non-owner
occupied 1Q10 NCO ratio of 4.5%
•
In 4Q08 reduced problem assets in most stressed markets (FL
and MI) through portfolio actions
•
Loans from FL/MI represented 40% of total loans, 53% of total
losses in 1Q10
($ in millions)
1Q09
2Q09
3Q09
4Q09
1Q10
Balance
$12,560
$12,407
$12,105
$11,803
$11,744
90+ days delinquent
$124
$131
$184
$59
$44
as % of loans
0.99%
1.06%
1.52%
0.50%
0.38%
NPAs
$718
$791
$968
$985
$1,002
as % of loans
5.72%
6.37%
8.00%
8.34%
8.53%
Net charge-offs
$77
$85
$118
$142
$99
as % of loans
2.50%
2.73%
3.82%
4.69%
3.42%
Commercial mortgage
* NPAs
exclude loans held-for-sale. |
 18
Fifth Third Bank | All Rights Reserved
Commercial construction*
Accomodation
1%
Auto Retailers
0%
Finance &
insurance
3%
Construction
33%
Manufacturing
1%
Real estate
49%
Retail Trade
1%
Other
11%
Wholesale
Trade
1%
Loans by geography
Credit trends
Loans by industry
Comments
•
Owner
occupied
1Q10
NCO
ratio
of
4.6%,
other
non-owner
occupied 1Q10 NCO ratio of 9.7%
•
In 4Q08 reduced problem assets in most stressed markets (FL
and MI) through portfolio actions
•
Loans
from
FL/MI
represented
29%
of
total
loans,
40%
of
total
losses in 1Q10
($ in millions)
1Q09
2Q09
3Q09
4Q09
1Q10
Balance
$4,745
$4,491
$4,147
$3,784
$3,277
90+ days delinquent
$49
$60
$168
$16
$9
as % of loans
1.02%
1.34%
4.04%
0.44%
0.28%
NPAs
$597
$735
$751
$707
$569
as % of loans
12.59%
16.36%
18.11%
18.68%
17.36%
Net charge-offs
$76
$79
$126
$135
$78
as % of loans
6.21%
6.76%
11.56%
13.28%
8.57%
Commercial construction
* NPAs
exclude loans held-for-sale.
MI
11%
OH
32%
IN
6%
KY
3%
TN
4%
NC
7%
FL
18%
IL
10%
Other
9% |
 19
Fifth Third Bank | All Rights Reserved
Homebuilders/developers*
Loans by geography
Credit trends
Loans by industry
Comments
•
Currently making no new loans to builder/developer sector
•
Residential & land valuations under continued
stress •
3% of commercial loans; 2% of total loans
•
Balance by product approximately 39% Construction,
47% Mortgage, 14% C&I
MI
17%
OH
23%
IN
7%
IL
5%
KY
4%
TN
4%
NC
15%
Other
3%
FL
22%
C&I
14%
Commercial
construction
39%
Commercial
mortgage
47%
($ in millions)
1Q09
2Q09
3Q09
4Q09
1Q10
Balance
$2,322
$2,102
$1,846
$1,563
$1,324
90+ days delinquent
$37
$53
$79
$19
$6
as % of loans
1.59%
2.51%
4.29%
1.19%
0.43%
NPAs
$554
$613
$600
$548
$520
as % of loans
23.87%
29.14%
32.51%
35.09%
39.28%
Net charge-offs
$64
$76
$108
$110
$81
as % of loans
10.73%
14.06%
21.92%
26.25%
22.89%
Homebuilders/developers
* NPAs
exclude loans held-for-sale. |
 20
Fifth Third Bank | All Rights Reserved
Residential mortgage
1 liens: 100% ; weighted average
LTV: 78% Weighted average origination FICO:
724 Origination FICO distribution: <660 11%; 660-689 8%;
690-719 12%; 720-749 14%; 750+ 31%; Other
^
24%
(note: loans <660 includes CRA loans and FHA/VA loans)
Origination LTV distribution: <=70 26%; 70.1-80 41%; 80.1-90
11%; 90.1-95 6%; >95% 16%
Vintage distribution: 2010 2%;
2009 6%; 2008 13%; 2007 16%;
2006 15%; 2005 24%; 2004 and prior 24%
% through broker: 13%; performance similar to
direct Loans by geography
Credit trends
Portfolio details
Comments
FL portfolio 28% of loans driving 53% of total losses
FL lots ($260M) running at 29%
annualized loss rate (YTD)
Mortgage company originations targeting 95% salability
^ Includes acquired loans where FICO at origination is not available
During 1Q09 the Bancorp modified its nonaccrual policy to exclude TDR loans less
than 90 days past due because they were performing in accordance with restructured
terms. For comparability purposes, prior periods were adjusted to reflect
this reclassification.
($ in millions)
1Q09
2Q09
3Q09
4Q09
1Q10
Balance
$8,875
$8,489
$8,229
$8,035
$7,918
90+ days delinquent
$231
$242
$198
$189
$157
as % of loans
2.60%
2.85%
2.41%
2.35%
1.98%
NPAs
$475
$475
$484
$523
$521
as % of loans
5.35%
5.59%
5.89%
6.51%
6.57%
Net charge-offs
$75
$112
$92
$78
$88
as % of loans
3.27%
5.17%
4.38%
3.82%
4.46%
Residential mortgage
st |
   21
Fifth Third Bank | All Rights Reserved
Home equity
1
liens:
29%;
2
liens:
71%
Weighted average origination FICO: 757
Origination FICO distribution: <660 4%; 660-689 8%; 690-719 13%;
720-749 17%; 750+ 49%; Other 10%
Average CLTV: 75%
Origination CLTV distribution: <=70 43%; 70.1-80 23%;
80.1-90 17%; 90.1-95 6%; >95 10%
Vintage
distribution:
2010
1%;
2009
5%;
2008
11%;
2007
12%;
2006
16%;
2005 15%; 2004 and prior 41%
% through broker channels: 16% WA FICO: 739 brokered, 760 direct; WA
CLTV: 90% brokered; 73% direct
Portfolio details
Comments
Brokered loans by geography
Direct loans by geography
Credit trends
Approximately 16% of portfolio in broker product driving approximately 40%
total loss
Approximately
one
third
of
Fifth
Third
2
liens
are
behind
Fifth
Third
1
liens
Sequential improvement generally due to lower losses in FL
2005/2006 vintages represent 31% of portfolio; account for 56% of losses
Aggressive home equity line management strategies in place
Note: Brokered and direct home equity net charge-off ratios are calculated
based on end of period loan balances ^ Includes acquired loans where FICO at
origination is not available MI
21%
OH
33%
IN
9%
IL
13%
KY
8%
Other
1%
FL
9%
NC
5%
TN
1%
MI
21%
OH
25%
IN
10%
IL
11%
KY
7%
Other
20%
FL
3%
NC
1%
TN
2%
($ in millions)
1Q09
2Q09
3Q09
4Q09
1Q10
Balance
$2,225
$2,125
$2,028
$1,948
$1,906
90+ days delinquent
$42
$34
$38
$33
$29
as % of loans
1.91%
1.58%
1.87%
1.72%
1.53%
Net charge-offs
$30
$39
$30
$34
$30
as % of loans
5.46%
7.41%
5.96%
7.02%
6.31%
Home equity - brokered
($ in millions)
1Q09
2Q09
3Q09
4Q09
1Q10
Balance
$10,486
$10,386
$10,349
$10,226
$10,280
90+ days delinquent
$61
$63
$66
$65
$60
as % of loans
0.59%
0.61%
0.64%
0.64%
0.58%
Net charge-offs
$42
$49
$49
$48
$43
as % of loans
1.62%
1.91%
1.89%
1.85%
1.65%
Home equity - direct
st
nd
nd
st |
  22
Fifth Third Bank | All Rights Reserved
Florida market*
Deterioration in real estate values having effect on credit trends as evidenced by
increasing NPA/NCOs in real estate related products Homebuilders, developers
tied to weakening real estate market
Losses due to significant declines in
valuations
Valuations; relatively small home
equity portfolio
COML
MORTGAGE
C&I
RESI
MORTGAGE
OTHER
CONS
COML
CONST
COML
LEASE
HOME
EQUITY
AUTO
CREDIT
CARD
Total Loans
NPAs
NCOs
* NPAs
exclude loans held-for-sale.
($ in millions)
Loans (bn)
% of
FITB
NPAs (mm)
% of
FITB
NCOs
(mm)
% of
FITB
Commercial loans
1.7
7%
128
16%
27
16%
Commercial mortgage
1.5
13%
295
29%
20
20%
Commercial construction
0.6
18%
174
31%
16
21%
Commercial lease
0.0
1%
2
4%
-
0%
Commercial
3.9
9%
599
25%
63
18%
Mortgage
2.2
28%
271
52%
46
53%
Home equity
1.0
8%
6
9%
11
15%
Auto
0.5
5%
2
8%
4
12%
Credit card
0.1
6%
7
7%
5
12%
Other consumer
0.0
2%
0
22%
0
9%
Consumer
3.8
12%
286
40%
67
28%
Total
7.7
10%
885
28%
130
22% |
  23
Fifth Third Bank | All Rights Reserved
Michigan market*
Deterioration in home price values coupled with weak economy impacting credit
trends due to frequency of defaults and severity Homebuilders, developers
tied to weak real estate market
Negative impact from housing
valuations, economy,
unemployment
Economic weakness impacts
commercial real estate market
COML
MORTGAGE
C&I
RESI
MORTGAGE
OTHER
CONS
COML
CONST
COML
LEASE
HOME
EQUITY
AUTO
CREDIT
CARD
Total Loans
NPAs
NCOs
* NPAs
exclude loans held-for-sale.
($ in millions)
Loans (bn)
% of
FITB
NPAs (mm)
% of
FITB
NCOs
(mm)
% of
FITB
Commercial loans
3.9
15%
143
18%
44
27%
Commercial mortgage
3.2
27%
218
22%
33
33%
Commercial construction
0.4
11%
51
9%
15
19%
Commercial lease
0.2
6%
9
16%
2
0%
Commercial
7.7
17%
421
17%
94
27%
Mortgage
1.1
14%
51
10%
13
15%
Home equity
2.6
21%
22
32%
21
28%
Auto
1.0
10%
4
16%
3
11%
Credit card
0.3
16%
23
22%
8
19%
Other consumer
0.1
10%
0
11%
1
13%
Consumer
5.1
16%
100
14%
46
19%
Total
12.8
16%
521
17%
140
24% |
 24
Fifth Third Bank | All Rights Reserved
Deposit share momentum
Source: FDIC, SNL Financial; branches included are full service retail / brick and
mortar; data excludes headquarters branches with over $250 million in deposits.
•
Continued focus on
customer satisfaction
and building full
relationships has
given strong
momentum to the
retail network
•
Fifth Third grew
deposits in 15 of 16
affiliate markets in
2009
–
Modest attrition in
North Carolina
acquisition market
•
Fifth Third grew
deposit market share
in 75% of affiliate
markets in 2009
Affiliate
5/3 Deposit
(08-09)
5/3 Market Share
Name
Deposit
($)
(%)
Share
2009
2008
Chicago
788,601
9.8%
4.0%
3.8%
Northeastern Ohio
606,708
17.0%
4.2%
3.8%
South Florida
579,342
21.1%
3.1%
2.8%
Eastern Michigan
418,525
11.9%
5.4%
5.0%
Central Florida
338,091
28.9%
3.0%
2.5%
Tampa
334,080
24.5%
3.5%
3.1%
Central Ohio
213,971
5.6%
11.1%
11.2%
Cincinnati
212,656
2.2%
21.5%
21.9%
Southern Indiana
195,169
8.6%
4.1%
4.0%
Louisville
194,593
13.0%
8.9%
8.2%
Northwestern Ohio
177,122
7.5%
16.2%
15.4%
Western Michigan
149,252
2.1%
18.4%
18.4%
Tennessee
142,615
12.8%
3.5%
3.3%
Central Indiana
139,354
4.7%
8.4%
8.3%
Central Kentucky
2,608
0.3%
8.1%
8.7%
North Carolina
(113,631)
-4.4%
4.8%
5.3% |
 Liability mix and pricing discipline drive
strong net interest income/NIM results
•
Strong, deposit rich core funding mix
supports relatively low cost of funds
–
Low reliance on wholesale funding
•
Continued pricing discipline on
commercial loans, consistent with market
trends toward better risk-adjusted spreads
–
C&I spreads over 1-month LIBOR
have increased more than 150 bps in
the past two years
Source: SNL and company reports. Cost of Funds defined as interest incurred on
interest-bearing liabilities as a percentage of average noninterest-bearing deposits and
interest-bearing liabilities; Transaction deposits defined as DDA, NOW and
Savings/MMDA accounts. Avg. Transaction Deposits / Avg. Liabilities
C&I Spread to 1-month LIBOR
1Q10 Cost of Funds Peer Comparison
Peer average 1.08%
Peer average 57%
25
Fifth Third Bank | All Rights Reserved |
 26
Fifth Third Bank | All Rights Reserved
Cautionary statement
This
report
may
contain
statements
that
we
believe
are
“forward-looking
statements”
within
the
meaning
of
Section
27A
of
the
Securities
Act
of
1933,
as
amended,
and
Rule
175
promulgated
thereunder,
and
Section
21E
of
the
Securities
Exchange
Act
of
1934,
as
amended,
and
Rule
3b-6
promulgated
thereunder.
These
statements
relate
to
our
financial
condition,
results
of
operations,
plans,
objectives,
future
performance
or
business.
They
usually
can
be
identified
by
the
use
of
forward-looking
language
such
as
“will
likely
result,”
“may,”
“are
expected
to,”
“is
anticipated,”
“estimate,”
“forecast,”
“projected,”
“intends
to,”
or
may
include
other
similar
words
or
phrases
such
as
“believes,”
“plans,”
“trend,”
“objective,”
“continue,”
“remain,”
or
similar
expressions,
or
future
or
conditional
verbs
such
as
“will,”
“would,”
“should,”
“could,”
“might,”
“can,”
or
similar
verbs.
You
should
not
place
undue
reliance
on
these
statements,
as
they
are
subject
to
risks
and
uncertainties,
including
but
not
limited
to
the
risk
factors
set
forth
in
our
most
recent
Annual
Report
on
Form
10-K
and
our
most
recent
quarterly
report
on
Form
10-Q.
When
considering
these
forward-looking
statements,
you
should
keep
in
mind
these
risks
and
uncertainties,
as
well
as
any
cautionary
statements
we
may
make.
Moreover,
you
should
treat
these
statements
as
speaking
only
as
of
the
date
they
are
made
and
based
only
on
information
then
actually
known
to
us.
There
are
a
number
of
important
factors
that
could
cause
future
results
to
differ
materially
from
historical
performance
and
these
forward-
looking
statements.
Factors
that
might
cause
such
a
difference
include,
but
are
not
limited
to:
(1)
general
economic
conditions
and
weakening
in
the
economy,
specifically
the
real
estate
market,
either
nationally
or
in
the
states
in
which
Fifth
Third,
one
or
more
acquired
entities
and/or
the
combined
company
do
business,
are
less
favorable
than
expected;
(2)
deteriorating
credit
quality;
(3)
political
developments,
wars
or
other
hostilities
may
disrupt
or
increase
volatility
in
securities
markets
or
other
economic
conditions;
(4)
changes
in
the
interest
rate
environment
reduce
interest
margins;
(5)
prepayment
speeds,
loan
origination
and
sale
volumes,
charge-offs
and
loan
loss
provisions;
(6)
Fifth
Third’s
ability
to
maintain
required
capital
levels
and
adequate
sources
of
funding
and
liquidity;
(7)
maintaining
capital
requirements
may
limit
Fifth
Third’s
operations
and
potential
growth;
(8)
changes
and
trends
in
capital
markets;
(9)
problems
encountered
by
larger
or
similar
financial
institutions
may
adversely
affect
the
banking
industry
and/or
Fifth
Third
(10)
competitive
pressures
among
depository
institutions
increase
significantly;
(11)
effects
of
critical
accounting
policies
and
judgments;
(12)
changes
in
accounting
policies
or
procedures
as
may
be
required
by
the
Financial
Accounting
Standards
Board
(FASB)
or
other
regulatory
agencies;
(13)
legislative
or
regulatory
changes
or
actions,
or
significant
litigation,
adversely
affect
Fifth
Third,
one
or
more
acquired
entities
and/or
the
combined
company
or
the
businesses
in
which
Fifth
Third,
one
or
more
acquired
entities
and/or
the
combined
company
are
engaged;
(14)
ability
to
maintain
favorable
ratings
from
rating
agencies;
(15)
fluctuation
of
Fifth
Third’s
stock
price;
(16)
ability
to
attract
and
retain
key
personnel;
(17)
ability
to
receive
dividends
from
its
subsidiaries;
(18)
potentially
dilutive
effect
of
future
acquisitions
on
current
shareholders’
ownership
of
Fifth
Third;
(19)
effects
of
accounting
or
financial
results
of
one
or
more
acquired
entities;
(20)
difficulties
in
separating
Fifth
Third
Processing
Solutions
from
Fifth
Third;
(21)
loss
of
income
from
any
sale
or
potential
sale
of
businesses
that
could
have
an
adverse
effect
on
Fifth
Third’s
earnings
and
future
growth;
(22)
ability
to
secure
confidential
information
through
the
use
of
computer
systems
and
telecommunications
networks;
and
(23)
the
impact
of
reputational
risk
created
by
these
developments
on
such
matters
as
business
generation
and
retention,
funding
and
liquidity.
You
should
refer
to
our
periodic
and
current
reports
filed
with
the
Securities
and
Exchange
Commission,
or
“SEC,”
for
further
information
on
other
factors,
which
could
cause
actual
results
to
be
significantly
different
from
those
expressed
or
implied
by
these
forward-looking
statements. |