Attached files
| file | filename |
|---|---|
| 8-K - FORM 8-K - BROADRIDGE FINANCIAL SOLUTIONS, INC. | d8k.htm |
 Broadridge
Financial Solutions, Inc.
May 2010
Investor Presentation
Richard J. Daly
Chief Executive Officer
Exhibit 99.1 |
 2
Forward-Looking Statements
This presentation and other written or oral statements made from time to time by representatives of
Broadridge may contain “forward-looking statements” within the meaning of the
Private Securities Litigation Reform Act of 1995. Statements that are not historical in nature,
such as our fiscal year 2010 financial guidance, and which may be identified by the use of words
like “expects,” “assumes,” “projects,” “anticipates,” “estimates,” “we believe,” “could be” and other
words of similar meaning, are forward-looking statements. These statements are based on
management’s expectations and assumptions and are subject to risks and uncertainties that
may cause actual results to differ materially from those expressed. These risks and
uncertainties include those risk factors discussed in Part I, “Item 1A. Risk Factors” of our
Annual Report on Form 10-K for the fiscal year ended June 30, 2009 (the “2009 Annual
Report”), as they may be updated in any future reports filed with the Securities and
Exchange Commission. Any forward-looking statements are qualified in their entirety by
reference to the factors discussed in the 2009 Annual Report. These risks include: the success
of Broadridge in retaining and selling additional services to its existing clients and in obtaining new clients; the
pricing of Broadridge’s products and services; changes in laws affecting the investor
communication services provided by Broadridge; changes in laws regulating registered securities
clearing firms and broker-dealers; declines in trading volume, market prices, or the
liquidity of the securities markets; any material breach of Broadridge security affecting its
clients’ customer information; the failure of our outsourced data center services provider to
provide the anticipated levels of service; any significant slowdown or failure of
Broadridge’s systems; Broadridge’s failure to keep pace with changes in technology
and demands of its clients; availability of skilled technical employees; the impact of new
acquisitions and divestitures; competitive conditions; and overall market and economic conditions.
Broadridge disclaims any obligation to update any forward-looking statements, whether as a
result of new information, future events or otherwise.
This presentation may include certain non-GAAP (generally accepted accounting principles)
financial measures in describing Broadridge’s performance. Management believes that such
non-GAAP measures, when presented in conjunction with comparable GAAP measures provide
investors a more complete understanding of Broadridge’s underlying operational results.
These non-GAAP measures are indicators that management uses to provide additional
meaningful comparisons between current results and prior reported results, and as a basis for planning
and forecasting for future periods. These measures should be considered in addition to and not
substitute for the measures of financial performance prepared in accordance with GAAP. The
reconciliations of such measures to the comparable GAAP figures are included in this
presentation.
|
 3
Use of Material Contained Herein
The information contained in this presentation is being provided
for your
convenience and information only. This information is accurate as of the date
of its initial presentation. If you plan to use this information for
any purpose, verification of its continued accuracy is your
responsibility. Broadridge assumes no duty to update or revise the
information contained in this
presentation. You may reproduce information contained in this presentation
provided you do not alter, edit, or delete any of the content and provided
you identify the source of the information as Broadridge Financial
Solutions, Inc., which owns the copyright.
Broadridge and the Broadridge logo are registered trademarks of Broadridge
Financial Solutions, Inc. Ridge is a trademark of Broadridge Financial
Solutions, Inc.
©
2010 Broadridge Financial Solutions, Inc. |
 4
Agenda
Broadridge Overview and Summary
Business Overview
Business Expansion Strategy Overview
Financial Overview
Conclusion |
 Broadridge: Investment Thesis
Generate
very strong and
highly predictable
free cash flows
Strong core Investor
Communications business
which generates over 70% of
annual revenues and earnings
Market leader with high
client retention rates
driven by product innovation
Approximately 80%
in recurring annual revenues
Dependable mid-single-digit
revenue growth business
(5% CAGR since 2002)
Highly experienced
management team
(averaging 14 years)
focused on delivering
shareholder return
Scalable business model
with core business
generating margin expansion
(>16% margins, averaging ~50bps
annual growth last 3 fiscal years)
Averaged over $250M per year
during the last 3 fiscal years
Aim to invest in existing businesses and acquisitions to generate mid to
high-single-digit revenue growth and return excess cash to shareholders
|
 6
$252
Forecast
$290
$251
$248
Broadridge: Free Cash Flow & Capital Allocation
Note: Free Cash Flow excludes financing activities in the Clearing and Outsourcing
Solutions segment •Doubled annual dividend
from $0.28 to $0.56 per
share for FY10, or
approximately 35% payout
of FY09 GAAP net earnings
•Authorized repurchase of
up to 10 million shares, or
approximately 7% of the
shares outstanding
•Strategic acquisitions to
leverage the Broadridge
brand and distribution
channels
Strong predictable free cash flow allows for flexible capital allocation
options (1) Free cash flow is a Non-GAAP financial measure
and is defined as net cash flow provided by operating activities excluding Ridge Clearing financing activities, less capital
expenditures and intangibles. A reconciliation to the nearest GAAP
numbers are provided in the Appendix. FY06
FY07
FY08
FY09
FY10
Free Cash Flow
(Non-GAAP)
(1)
($ in millions)
High: $270
Low: $235
Dividends
Stock
Repurchases
Acquisitions |
 7
Broadridge
Mission
Partner with
Financial Institutions
to:
Reduce
Risk & Cost
Increase
Performance
•
Enable the financial services
industry to achieve higher levels
of performance by allowing firms
to focus on their core business
•
Help clients manage their
regulatory compliance risk by
improving
clients’
processing,
communication accuracy and
data security
•
Deliver cost savings to financial
institutions through outsourcing
their non-differentiating back-
office processes
•
Develop long lasting relationships
with world class companies built
on mutual success
Our
Mission
is
To
Reduce
Clients’
Risk
While
Lowering
Their
Total
Cost
of
Ownership |
 8
Individual (Retail) and Institutional
Clients
Broker-Dealers, Banks, Mutual Funds, Corporate Issuers
Integrated Solutions Spanning the Investment Lifecycle
Investment
Decision
(Pre-Trade)
Trade Processing
&
Books and Records
Asset
Servicing
(Post-Trade)
New Accounts
Welcome Kits
Proxy
Fulfillment
Archival
Confirms
Across the
investment
lifecycle...
...By partnering
with the world’s
leading financial
institutions...
...And delivering
broad and
innovative
global solutions
Investor Communications
Proxy management, corporate governance, and stockholder
communications Securities Processing
Global trade processing for equities, options,
mutual funds, and fixed income securities
and operations outsourcing solutions
Processing
Reporting
Statements
...Broadridge
touches
investors... |
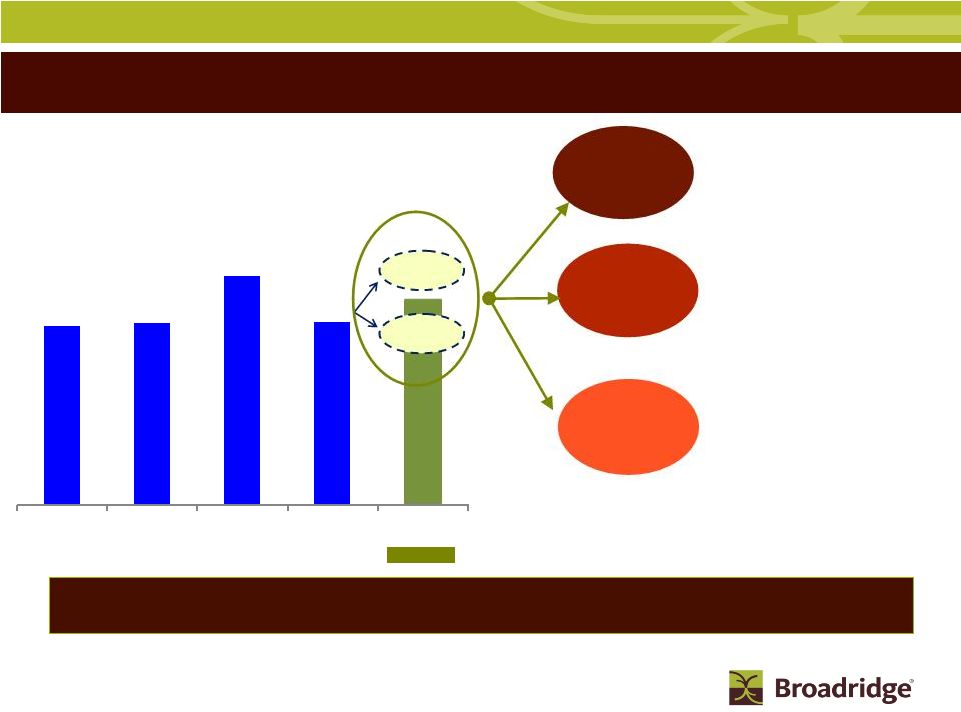
 9
Resilient and Predictable Business Model
Business is resilient and largely independent of the stock market being at its highs
or lows……….predictable revenue stream drives predictable free
cash flow Shareholder Positions
Images and Pieces
Processed
Revenue Drivers
A Market Leader
with
High Retention Rates
Recurring Revenue
Complex Proprietary
Processing Platforms
High
Client
Satisfaction
and
Highly
Engaged
Associates
Investor Communication
Solutions
Securities Processing
Solutions
Indispensable Provider for
Mission Critical Processing
Processing Fees
(Trades Per Day)
# of Accounts |
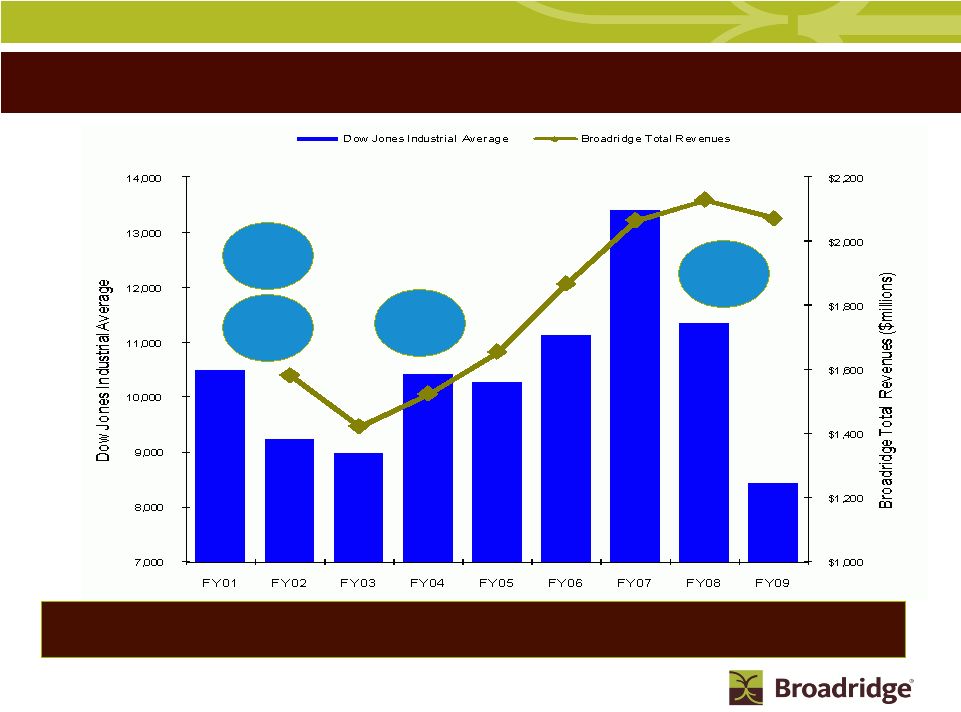 10
Business is Resilient in Changing Markets
Our revenue growth has been resilient through various economic and
market cycles
Stock Market
Rebounds
Decimalization
of Trades
Internet Bubble
Impact
Financial
Crisis
Note: Fiscal year is based on June 30
year end th |
 11
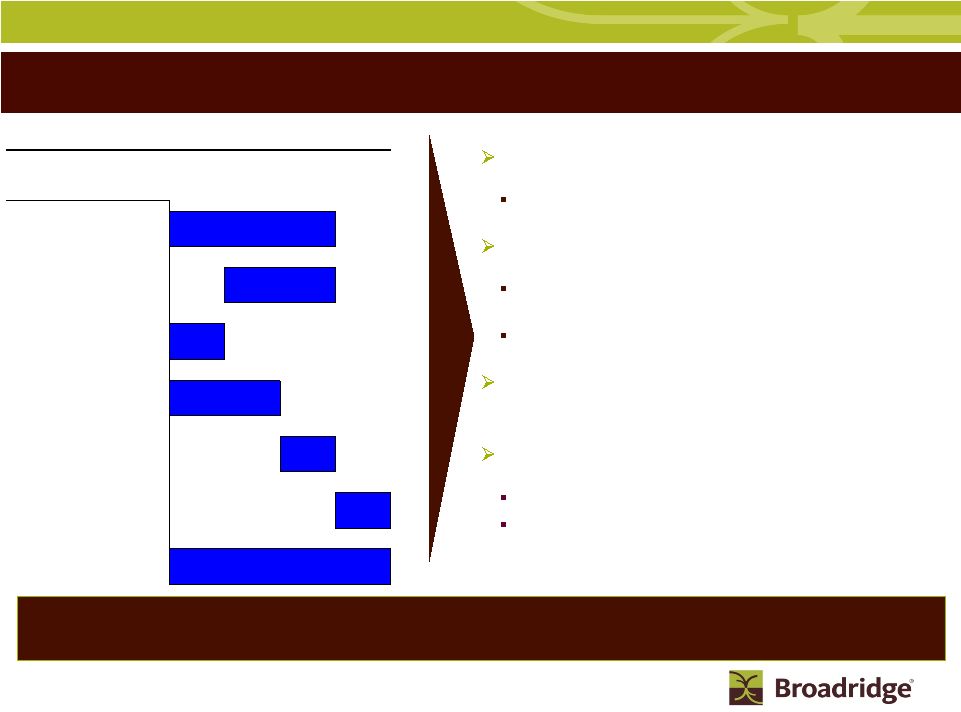
Revenue Growth Drivers
Low
double-digit
revenue
growth
in
robust
markets
and
flat
to
slightly
negative
growth
in severe
down markets. Historically, growth from Sales is consistent in all markets
cycles. Average historical growth of 5%, which included two severe
down market cycles
(1)
In high growth economic cycles revenue growth averages 10-
12% and flat to negative 3% in severe down markets
Historical sales growth component consistent in all market
cycles
ICS sales expected to be driven by market share gains in
transaction reporting and registered proxy
SPS sales expected to be driven by our unique Operations
Outsourcing offering
ICS internal growth is driven by stock record growth for equities
and mutual funds and SPS is driven by trades per day (TPD),
which is somewhat offset by price concessions
Event-driven revenue activity declines in severe down markets
and rebounds to new highs in robust markets.
Last trough to peak cycle had 20% CAGR (FY03-FY07)
Mutual Fund Proxy is the most volatile component of event-
driven revenue activity
FY02 -
FY09 (%)
Average Revenue
Growth From:
+ Acquisitions
1%
= Total Revenue Growth
5%
= Net New Business
1%
+ Internal Growth
(2)
2%
+ Event-Driven
1%
Sales
4%
-
Losses
(3%)
(1) Average annual growth rate over 7 years, which contemplates up
and down economic cycles (2) Internal growth
represents “same client” additional market driven growth |
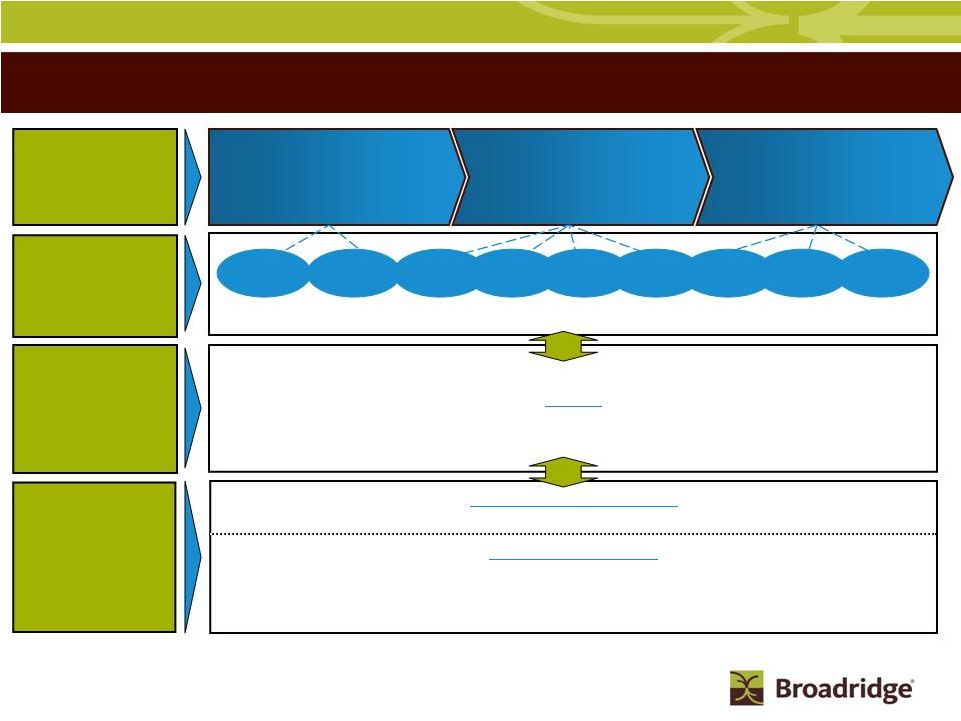
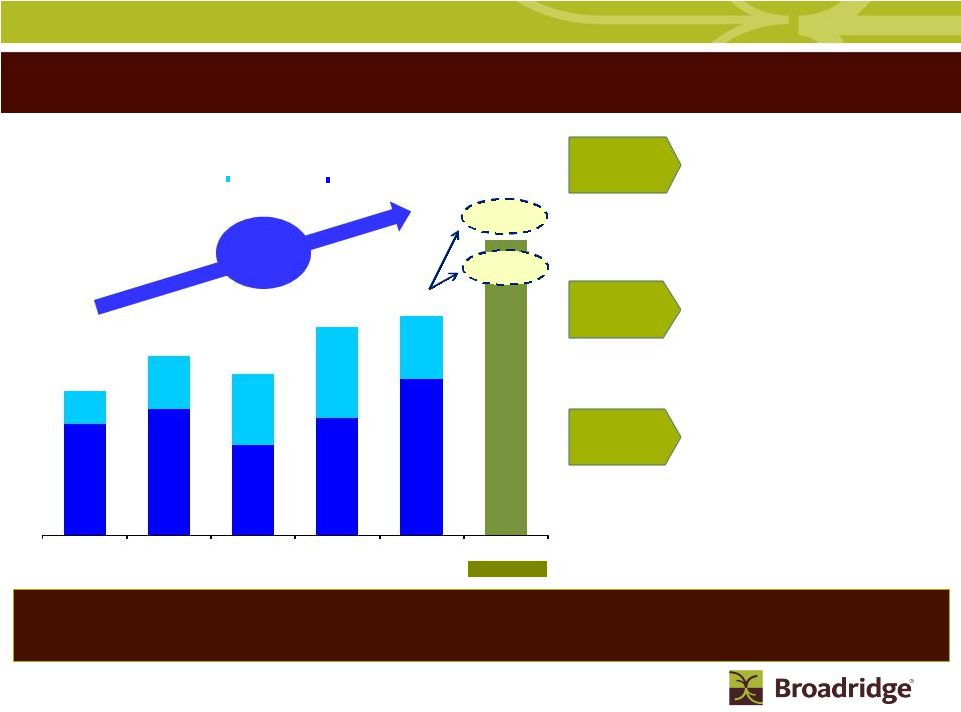 12
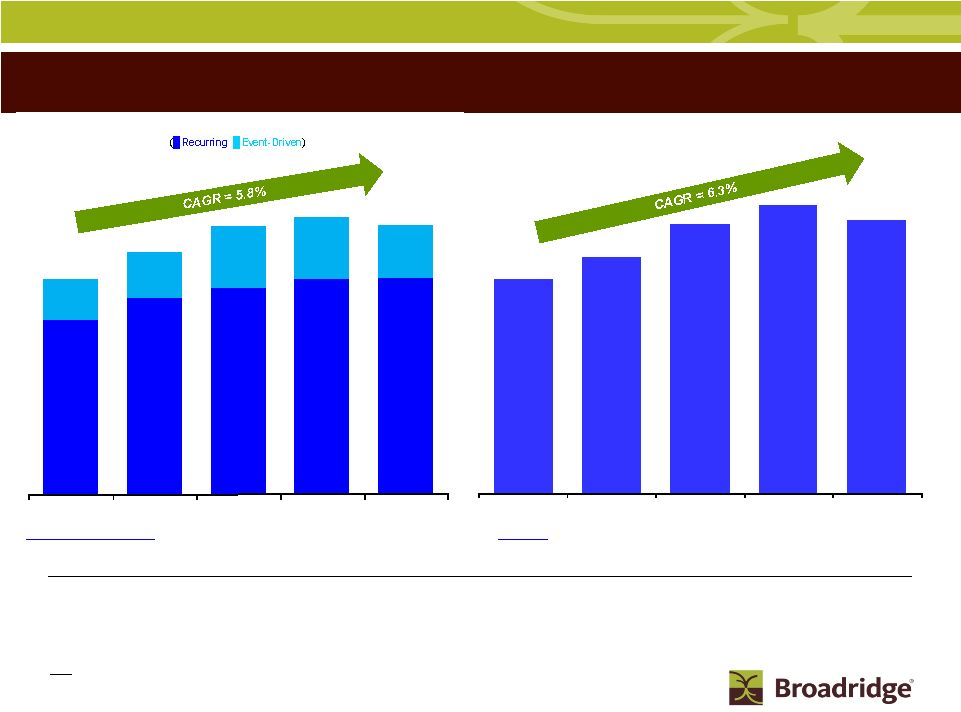
Business Expansion Focus
Closed Sales
(Fee Only $ in millions)
Event-Driven (ED)
Recurring (RC)
$100
$145
$125
$112
$152
Forecast (1)
$77
$88
$63
$82
$109
$23
$37
$49
$63
$43
FY05
FY06
FY07
FY08
FY09
FY10
High: $205
Low: $185
Broadridge
is well-positioned and on the high ground as a result of our recurring revenue
base, great value propositions, new initiatives, free cash flow and solid
balance sheet Closed
Sales
Challenges
Long-Term
Growth
•Strong
and growing pipeline with large opportunities in all segments
•Winning
a meaningful percentage of each year’s market-driven sales
activity
•Growth
in recurring closed sales >30% in FY09, representing the second
consecutive year of record sales
•Leverage
our core capabilities and unique communications network
•Investments
in the business have started to introduce new and exciting
opportunities
•Meaningful
growth opportunities in the mutual fund area via data hub
strategy
•Accelerating
Operations Outsourcing by leveraging our unique multi-tier
capabilities
•SPS
business, despite retaining its market leadership position, faces
challenges of price compression and how to monetize its
unique opportunities for growth
•Overcoming
conversion decision hurdles for large clients and industry
consolidation CAGR = 11%
ED = 17%
RC = 9%
(1)
Financial guidance provided in Broadridge’s February 4, 2010
earnings release |
       13
This is Broadridge
•We
are a market leader in processing and distributing shareholder
communications, and provider of choice for mission-critical
securities processing solutions
•Over
40 years of experience and a solid customer base with long standing
relationships
•Our
core business is resilient and largely independent of the stock
market being at its highs or lows
•Strong
and predictable Free Cash Flow of ~$250M in each of the last 3
fiscal years FY10 Forecast Segment Revenues
(1)
FY10 Forecast Segment Margins
Investor
Communications
$1,671-1,688M
(76%)
Securities
Processing
$531-533M
(24%)
Investor
Communications
$279-285M
Margin: 16.7-16.9%
Securities
Processing
$87-94M
Margin: 16.4-17.7%
Outsourcing
Innovative industry service provider of
outsourcing of critical back-office labor
functions that are integrated with our
processing technology platform:
Operations Outsourcing offering -
growth opportunity to expand existing
relationships and add new clients
Outsourcing
(~5%)
Investor Communications
(2)
Securities Processing
Leading global back-office processing service
bureau, as 8 of top 10 U.S. broker-dealers use
equity and fixed income components of our
technology
processing
platform
(3)
:
Hosted
applications
for
self-clearing
firms
using
Broadridge’s
service
bureau
for:
•Equity
(~80%)
•Fixed
Income (~15%)
World’s largest processor and provider of investor
communications with over one billion
communications processed annually:
Primary
business
unit
is
a
clear
market
leader
with
over
70%
of
Broadridge
revenues
and
pre-tax
earnings
Proxy
communications and vote processing and
interim
communications
(~65%)
Transaction
reporting
and
fulfillment
services
(~30%)
Other
(~5%)
Securities Processing
(2)
Only service provider offering service bureau and operations outsourcing
on a single multi-entity and multi-currency
platform (1) Based on financial guidance provided during
Broadridge’s May 10 2010 earnings release call. Segment financials do not include FX and other corporate expense
(2) Percentages represent revenue contribution within each reporting
segment (3) Based on SIFMA’s 2007-2008 Annual
Yearbook’s top member firm list ranked by capital. This top 10 list does not include the impact of the Lehman Brothers
(declared bankruptcy), Merrill Lynch (acquired by Bank of
America) and Bear Stearns (acquired by JP Morgan) transactions, all of which occurred in 2008 |
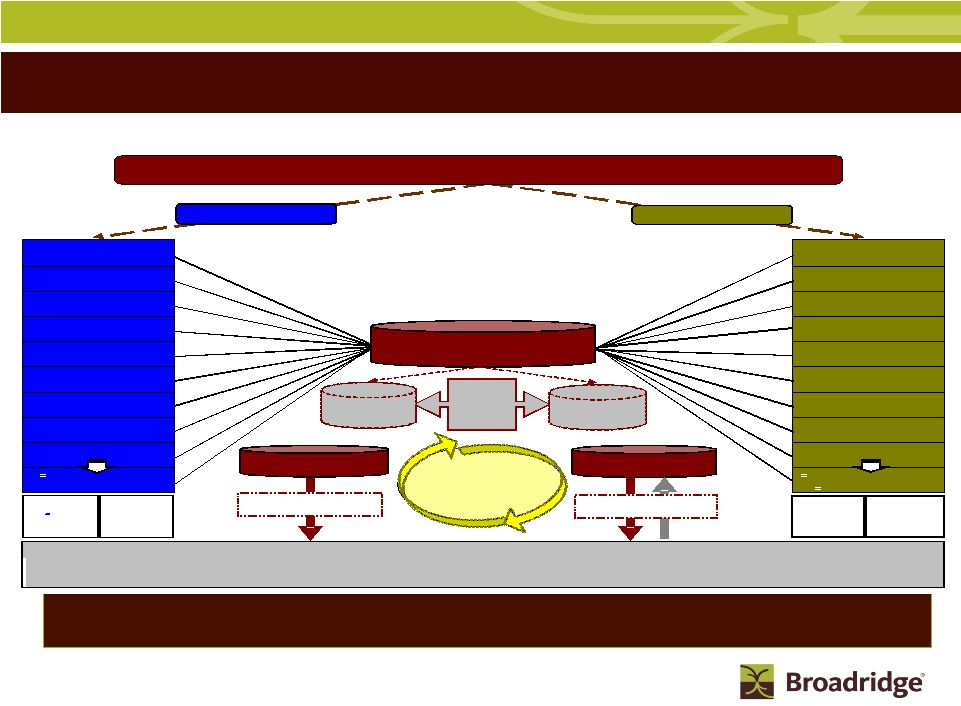 14
ICS Unique Business Systems Processing Model
Proxy and Interim processing system is the “plumbing”
supporting the voting
process for corporate governance
PROXY & INTERIMS PROCESSING OVERVIEW
"THE PLUMBING"
Broker/Bank 1
Issuer 1 / Fund 1
Broker/Bank 2
Issuer 2 / Fund 2
Broker/Bank 3
Issuer 3 / Fund 3
Broker/Bank 4
Issuer 4 / Fund 4
Broker/Bank 5
Issuer 5 / Fund 5
Broker/Bank 6
Issuer 6 / Fund 6
Broker/Bank 7
Issuer 7 / Fund 7
Broker/Bank 8
Issuer 8 / Fund 8
Broker/Bank 9
Issuer 9 / Fund 9
Brokers/Banks
800+
(1)
Issuers 10,000+
(3)
Funds 700+
(4)
ANNUAL CORPORATE ISSUER AND MUTUAL FUND EVENTS
Approximately 12,000 Events Per Year
(Annual Corporate Issuer Shareholder Meetings and Mutual Fund Proxy Meetings)
Proxy Distribution
Over 40% of
accounts
require
special
processing
Vote Processing
Managing
350M
active
positions
(2)
Majority of
all shares
are held in
street
-
side
Shareholder
Preferences
Database
Shareholder
Consent
Database
Equity and Mutual Fund Shareholders
Broadridge
manages
>1,500
Corporate
Issuers
Broadridge
processes on
average 70%
of U.S. shares
outstanding
Electronic or
Physical Vote Return
Data Hub and Platform
Electronic or
Physical Delivery
Street-side Processing
Registered Processing
> 50% of Hard Copy
Mailings Eliminated
via E
-
Delivery and
Suppressions
85% of Shares Voted
Electronically
BROADRIDGE
Proxy Processing System
Over 8 million lines of code and approximately 500,000 function points
Supported by 150+ dedicated programmers
(1)
Represents Broadridge’s estimated total number of brokerage firms
and banks in the U.S. and international markets
(2)
Represents Broadridge’s estimated total number of positions
managed by U.S. brokers and banks
(3)
Represents Broadridge’s estimated total number of corporate
issuers in the U.S. (4)
Represents total number of Fund Sponsors in the U.S. who
manage over 16,000 funds including Mutual Funds, Closed-end Funds, ETFs
and UITs, according to the Investment Company Institute’s 2009
Investment Company Year Book |
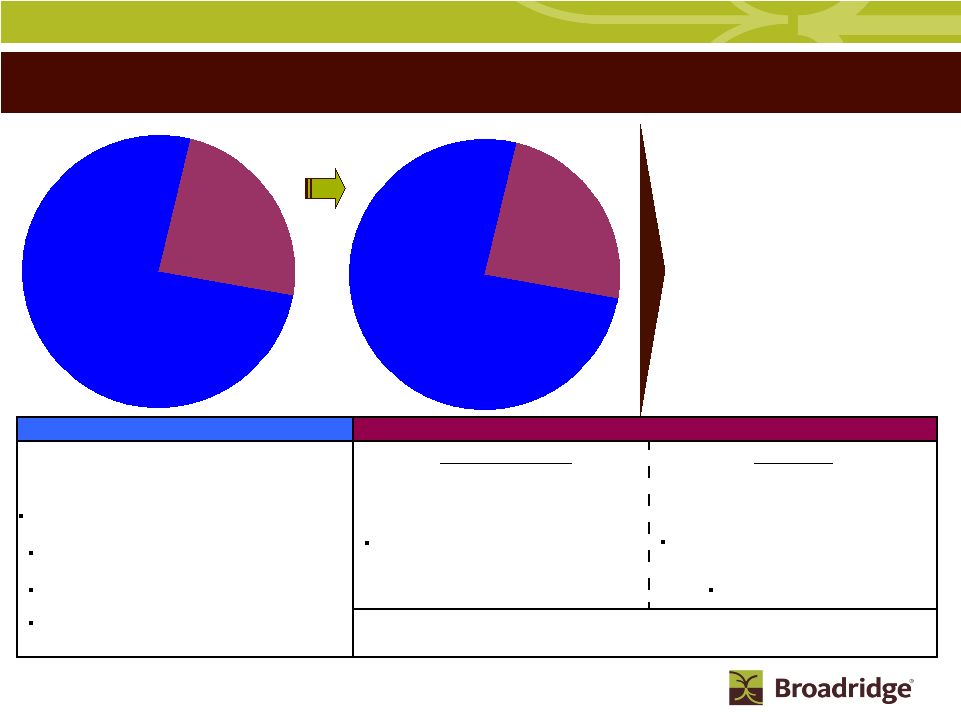
 15
Distribution
$757M (49%)
Other
$46M (3%)
Fulfillment
$110M (7%)
Transaction
Reporting
$132M (9%)
Interims
$136M (9%)
Proxy
$350M (23%)
ICS FY09 Product Revenues
ICS Product and Client Revenue Overview:
We have a strong and diverse product
offering…
ICS is highly resilient due to our deep customer relationships with our
Bank/Broker-Dealer clients
Primarily
Postage
Increase in electronic
distribution reduces postage
revenue and increases profits
Bank/Broker-
Dealer
$1,383M
(90%)
Mutual Fund
$96M (6%)
Corporate
Issuer
$52M (4%)
ICS FY09 Client Revenues
…and we have deep and longstanding
client relationships |
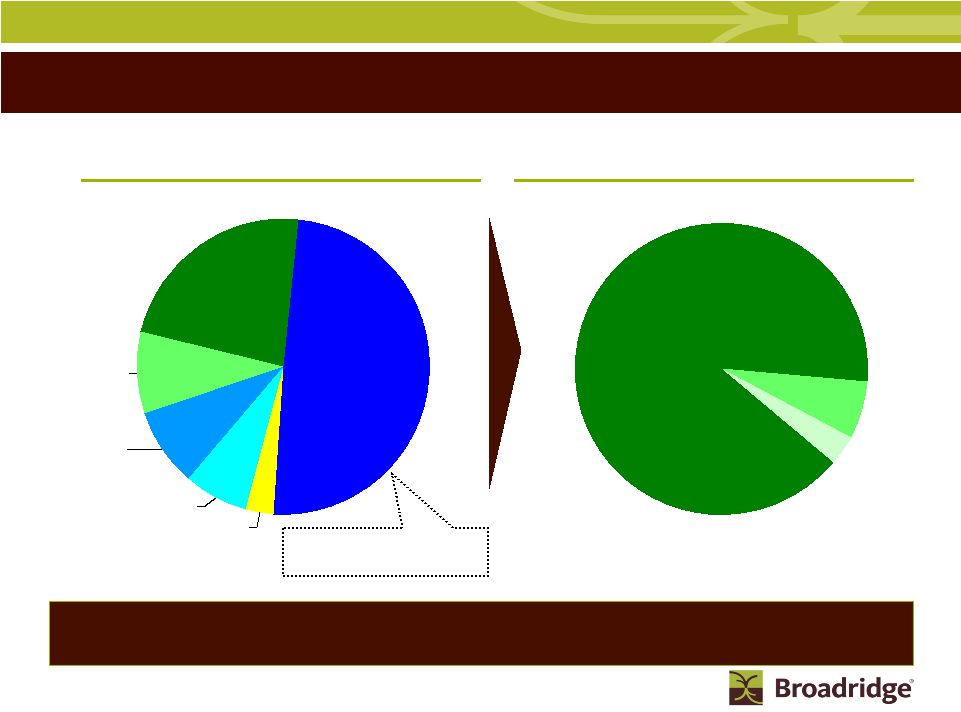
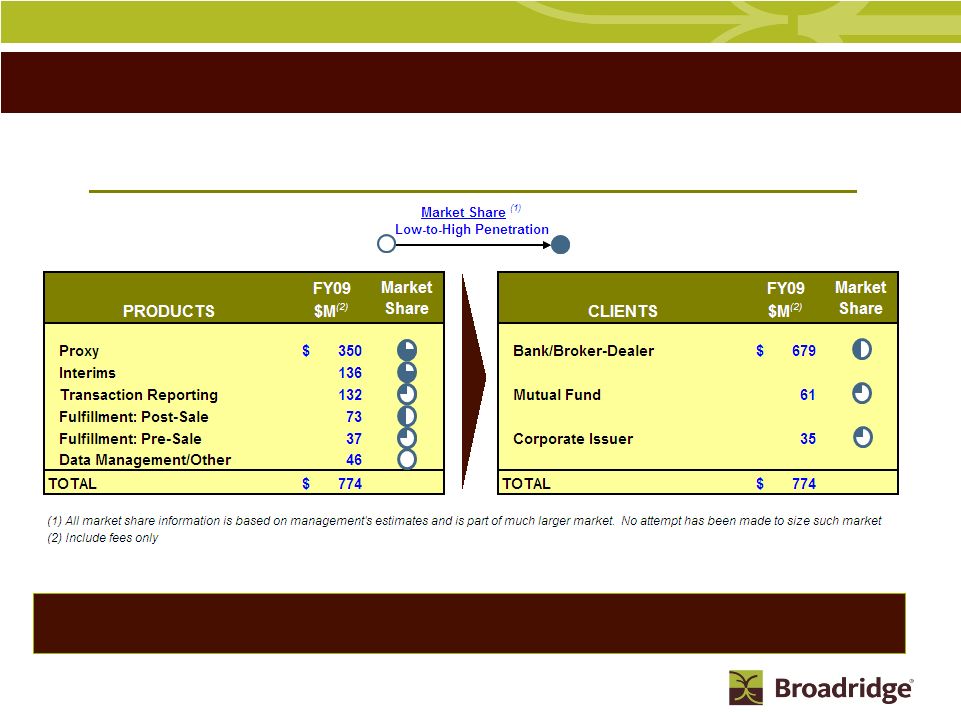 16
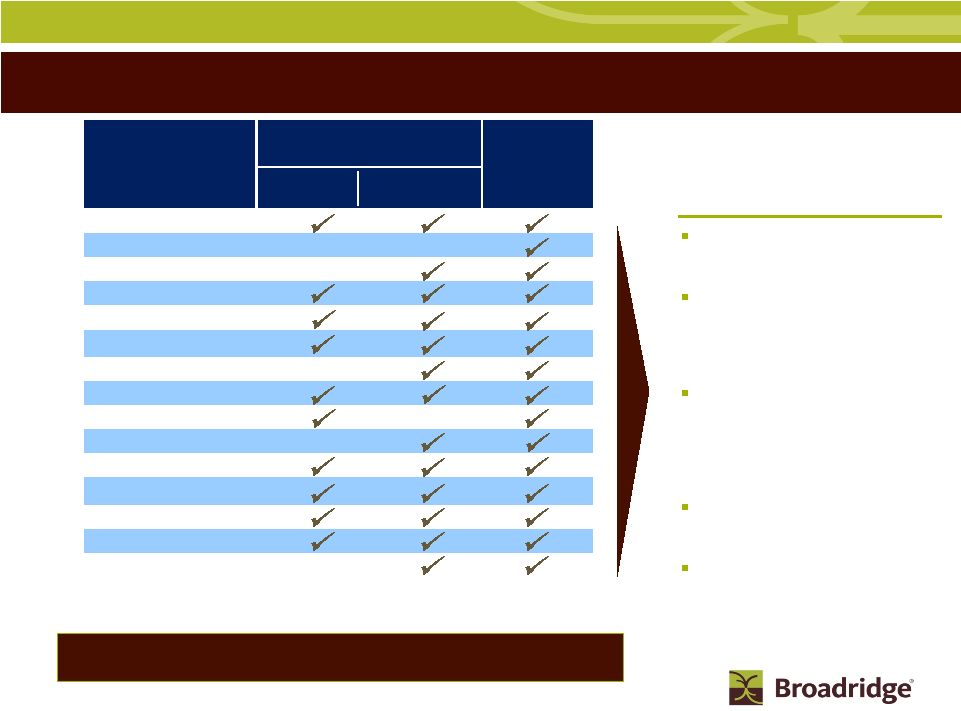
ICS Market Share Overview by Products and Markets
Product depth and relationships with Bank/Broker-Dealers provide high client
retention with large potential upside
We have deep penetration in our core business and clients, yet
large potential to grow market share |
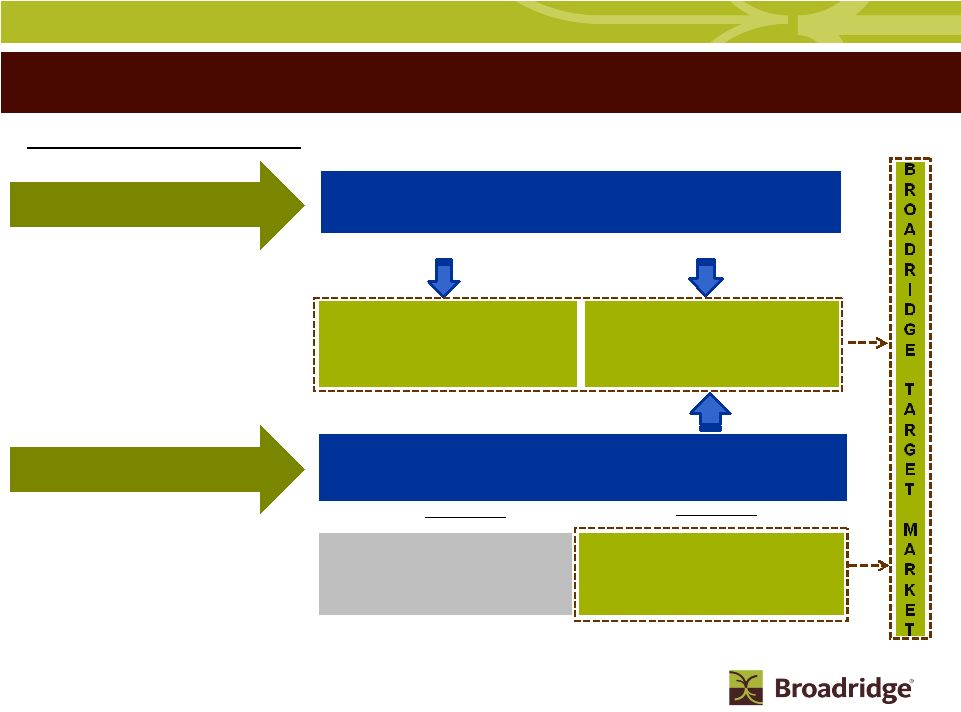 17
Securities Processing & Outsourcing –
Target Market Landscape
How Firms Clear Trades
Fully-Disclosed Broker/Dealer Firms
(Firms that clear their trades through another B/D firm that then clears through
DTC) Self-Clearing Broker-Dealer Firms
(Firms that clear trades directly through the DTC)
Trade Clearing Method #1
Traditional B/D Firms
•Primarily clear
trades for accounts that their firm manages
(e.g., Bank of America)
Clearing B/D Firms
•Primary
business is clearing trades for other B/D
firms (e.g., Penson/Pershing/Fidelity)
Firms that need the balance sheet of
another firm to operate and clear
(Small –
Medium Firms)
Firms that have the capital to be self-
clearing, but need the technology and
people expertise of another firm
(Medium –
Large Firms)
Type of Self-Clearing Firms
Firm Type #1
Firm Type #2
Trade Clearing Method #2 |
 18
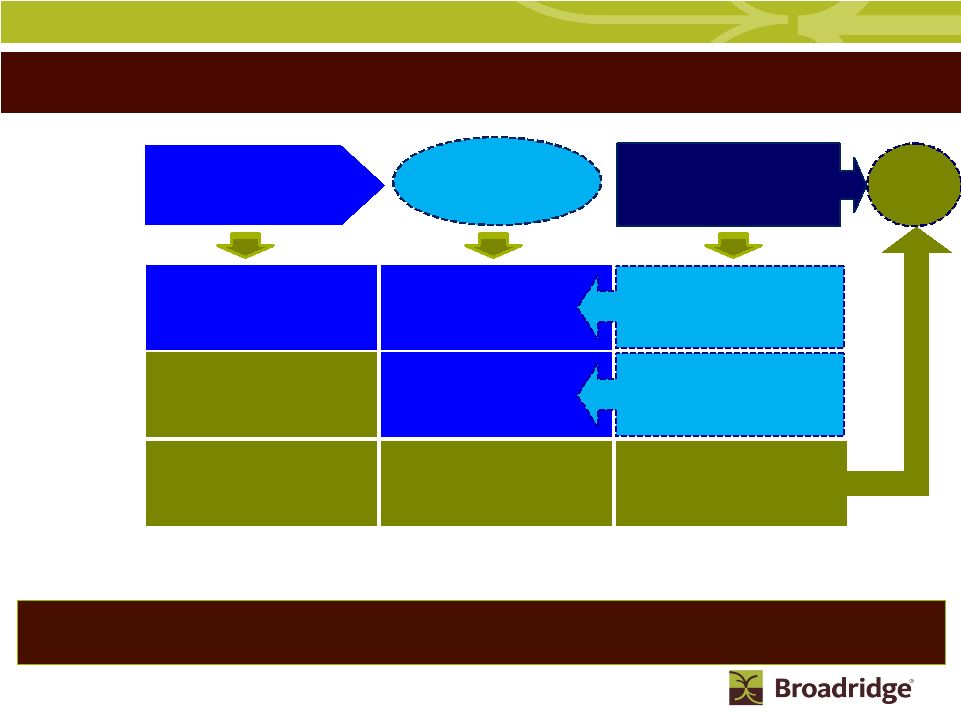
Broadridge -
Revenue Summary for Penson Transaction
We expect the Outsourcing business to be at scale at the completion of the Penson
conversion
Outsourcing Revenue
Related to client contracts sold
~$35-40M
Broadridge
Clearing & Outsourcing
After Penson Transaction
Penson
Existing
Outsourcing Revenue
~$25M
Acquired Revenue -
~ $75M
100+ Correspondents
Total Revenues Before Penson
~100M
Total Revenues After Penson
~$90-100M
Broadridge
Clearing & Outsourcing
Before Penson Transaction
BR Sells clearing
client contracts
New
Outsourcing Revenue
~$30-35M
Clearing Related Revenue
~ $75M
Outsourcing processing services
for Acquired Client Contracts
Outsourcing processing services
for Existing Penson Clients
Existing
Outsourcing Revenue
~$25M
Signs 10-Year
Outsourcing Contract
12-18 month
conversion
Starts at deal
closing |
 19
SPS FY09 Product Revenues
High client retention rates (>95%)
with growth opportunity coming
from firms that perform
processing
in-house
•
BR market share represents
51% of firms that outsource
back-office processing
•
In-house processing firms
account for 40% of industry
total trade volume
•
In-house processing firms are
comprised of small to large
brokerage firms
Fixed-Income platform is the
industry standard
•
BR processes for 10 of the 18
primary dealers of fixed income
•
BR’s clients account for
approximately 66% of the Fixed-
Income trading volume
•
BR processes on average
approximately $3.5 trillion in
trades daily
BR is the only provider of Operations
Outsourcing for self-clearing firms
•
$1 Billion market potential is
based on U.S. self-clearing and
fully-disclosed firms
•
Revenue target of ~$90-100M
upon completion of the Penson
conversion in FY12
Securities Processing Market Share Overview (2)
M
A
R
K
E
T
S
H
A
R
E
Broadridge
is the platform of choice for
firms outsourcing their securities processing
Equity Processing
by # of Firms
(191 total)
Fixed Income
Annual trade volume
(226M)
Broadridge
53 (28%)
Competitors
51 (27%)
In-house
87 (45%)
Broadridge
150M (66%)
Competitors
2M (1%)
In-house
74M (33%)
Equity
(~81%)
Transactions, $260M
Non-transactions, $192M
Fixed Income
(~14%)
Transactions, $52M
Non-transactions, $29M
Outsourcing
(~5%)
$25M
We service 8 of the top 10 largest financial institutions
with
a
strong
potential
to
increase
market
share
(1)
Broadridge
$25M (2%)
Untapped
Market
~$1 Billion
(98%)
Outsourcing
Market
(~$1 Billion total)
(1) Based on SIFMA’s
2007-2008 Annual Yearbook ranked by capital. This top 10 list
included Lehman
Brothers (declared bankruptcy), Merrill Lynch (acquired by Bank of
America), and Bear Stearns (acquired by JP Morgan). All
transactions mentioned occurred during 2008 (2) All market share
information is based on management’s 2008 estimates and is part of much larger market. No
attempt has been made to size such market
|
 20
Securities Processing Solutions Top 15 Clients
Broadridge
has faired well
during the recent industry
consolidations and financial
crisis
The top 15 SPS clients generate
approximately 70% of the SPS
segment’s revenues
11 of 15 top clients have multi-
years remaining under their
existing agreements; contract
extensions for additional clients
are in progress
Closed contract with Barclays to
handle new trade volume as
result of Lehman purchase and
executed direct contract with
Neuberger Berman for
processing
Closed contract with JP Morgan
for Bear Stearns fixed income
processing
Bank of America/Merrill Lynch
transaction resulted in loss of
equity processing business and
win of fixed income processing
business
SPS client relationships are stable in volatile market
Alliance Bernstein
Bank of America/Merrill Lynch*
Barclays Capital Services
BMO Nesbitt Burns
BNP Paribas
CIBC World Markets
Deutsche Bank
E*Trade Group
Edward Jones
HSBC Securities
J.P. Morgan Chase
Jefferies & Company
Royal Bank of Canada
Scotia Capital
UBS Securities
Note: The above schedule is an alphabetical listing of the top 15 SPS clients based
on FY09 revenues * Bank of America/Merrill Lynch includes loss of equity
processing business as previously disclosed Equity Processing
Fixed
Income
Processing
Retail
Institutional
Top
Clients |
 21
Business Expansion Strategy
Focused on core processing and communication businesses and making
investments in business that leverage these strong industry positions
Offer New
Solutions
Leverage
Industry
Position
Margin
Improvement
Foundation
Five Pillars
•
Improve world class
service scores for
every product every
year
•
Zero losses to
competition
•
Be “indispensable”
•
Increase total
sales year-over-
year
•
Increase existing
client penetration
•
Value
propositions with
“teeth”
•
Improve margins in all
products every year
Data center
Leverage
technology
Smart/Off-shoring
Strict financial
controls
Challenge the status
quo
•
Create (build or buy)
unique solutions
enabled by our heritage
Global outsourcing
Electronic delivery
solutions
Global proxy
Mutual Funds
Global Processing
Expansion
CULTURE
Trusting / Engaging / Accountable / Client-Centric / Committed /
Caring / Passionate/ Ethical “A Great Place to
Work” Vision
Be Indispensable!
Accelerate
Sales
•
More than 2 dozen new
products introduced since
spin-off
Virtual Shareholder
meeting
The Investor Network/
Shareholder Forum
Know-On-Pay
12b-1/ 22c-2 reporting
Compliance
Client On-boarding
Data aggregation/
analytics
Client
Retention
We enable the financial services industry
to achieve superior levels of performance through our passion to deliver
extraordinary value to our clients, shareholders, and associates
Successful execution of strategy is expected to accelerate average revenue growth forecast
from mid-single digits to high single-digits |
 22
$352
$371
$347
$304
$275
FY09
FY08
FY07
FY06
FY05
Earnings Before Interest andTaxes
as adjusted
(1)(2)
($ in Millions)
`
Financial Performance is Driven by Recurring Revenues
Recurring
Revenues:
81%
81% 77%
78% 80%
Margins:
16.0%
15.7% 16.2% 16.8%
16.4%
$1,717
$2,149
$1,726
$1,724
$1,651
$1,565
$1,393
$423
$483
$487
$368
$324
FY09
FY08
FY07
FY06
FY05
Net Revenues
-
($ in Millions)
(1)
The comparison between the results of operations for fiscal 2006 and prior periods is affected by the
impact of our adoption of SFAS No.123R effective July 1, 2005. See the Selected
Financial Data table in our 2009 Annual Report on Form 10-K for additional information (2)
Earnings before provision for interest and income taxes, as adjusted, is a Non-GAAP
financial measure. In fiscal 2009, it excludes a one-time gain of $8.4 million on purchase
of senior notes. In fiscal 2008 and fiscal 2007, it excludes $13.7 million and $14.0 million,
respectively, of one-time transition expenses. We believe that this measure is useful
to investors because it excludes the impact of certain transactions or events that we expect to occur
infrequently in order to provide meaningful comparisons between current results and previously
reported results. Management, therefore, believes such Non-GAAP measure provides a useful means for evaluating Broadridge's comparative operating
performance
Note: Historical financials have not been adjusted for the pending disposition of the clearing
services business |
 23
Broadridge
FY10 Guidance from Continuing Operations
(a) FY09 Actual Interest & Other reflects the effect of the one-time gain from the purchase of
the 6.125% Senior Notes of approximately $8M. (b) FY09 Actual Tax Rate of 35.5% is attributable
to the FY08 portion of the approved certification for a state tax credit program of $4M.
Excluding the one-time tax credit the FY09 Full Year tax rate would
be 36.7%. FY10 Low & High Ranges Tax Rates of 34.6% &
34.7% respectively is attributable to the release of a valuation allowance on a deferred tax asset relating to tax loss carryforwards of
approximately $8M. Excluding the year-to-date tax benefit the
FY10 Low & High Tax Rate would be 36.7% (c) FY09 Actual Diluted EPS Before 1-Times
(Non-GAAP) excludes the approximately $8M gain on purchase of $125M of Senior Notes (gain reflected in Interest & Other); $0.04 impact to EPS
and the FY08 portion of the approved certification for a state tax
credit program (gain reflected in Income Taxes); $0.03 impact to EPS.
FY10 Low & High Ranges Diluted EPS Before 1-Times (Non-GAAP)
of $1.52 & $1.58 respectively excludes the release of a valuation allowance on a deferred tax asset
relating to tax loss carryforwards of approximately $8M (gain reflected
in Income Taxes); $0.06 impact to EPS. Revenue
($ in millions)
EBIT
FY09
FY10 Range
FY09
FY10 Range
Actual
Low
High
Actual
Low
High
$1,531
$1,671
$1,688
ICS
$249
$279
$285
-3%
9%
10%
Growth % / Margin %
16.3%
16.7%
16.9%
$559
$531
$533
SPS
$134
$87
$94
5%
-5%
-5%
Growth % / Margin %
23.9%
16.4%
17.7%
$2,090
$2,202
$2,222
Total Segments
$383
$366
$379
-1%
5%
6%
Growth % / Margin %
18.3%
16.6%
17.1%
$1
$2
$2
Other
($29)
($18)
($23)
($18)
$4
$6
FX
*
($2)
($0)
$4
$2,073
$2,208
$2,230
Total Broadridge
$352
$348
$361
-3%
7%
7%
Growth % / Margin %
17.0%
15.8%
16.2%
Interest & Other
(a)
($6)
($11)
($11)
Closed Sales
Total EBT
$346
$337
$350
FY10 Range
Margin %
16.7%
15.3%
15.7%
Segments
Low
High
ICS
$125
$135
Income Taxes
($123)
($116)
($122)
SPS
$60
$70
Tax Rate
(b)
35.5%
34.6%
34.7%
Total
$185
$205
Total Net Earnings
$223
$220
$228
Margin %
10.8%
10.0%
10.3%
Diluted Shares
142
139
139
Diluted EPS (GAAP)
$1.58
$1.58
$1.64
Diluted EPS Before 1-Times (Non-GAAP)
(c)
$1.51
$1.52
$1.58
*
Includes impact of FX P&L Margin and FX Transaction Activity
|
 24
Focused on Capital Stewardship and Long-Term Shareholder Value
Cash Level on
Balance Sheet
•
We expect to keep approximately $100M of cash on hand
Strong Predictable
FCF Allows for
Flexible Capital
Allocation
Options
•
Investing for organic growth
•
Tuck-in acquisitions to sustain organic growth expand product offering
•
Continue to grow dividend payout
•
Pursue stock repurchases to offset any dilution from equity compensation plan
and opportunistic repurchases versus scheduled steady repurchases
Manage to a
Debt to EBITDA
Ratio 1:1
Debt
Mid-single-digit
organic revenue
growth
•
Capitalize on fundamentals driving long-term market growth
•
Invest in and drive new sales of existing solutions
•
Rollout new solutions to enable client efficiencies and facilitate client
growth •
Capture the global securities processing opportunity
Improve Margins
•
Initiatives to sustain and drive continued efficiencies and enhance our
scalability Aim to invest through existing businesses and acquisitions to
generate mid to high single-digit revenue growth and return excess cash
to shareholders Maintain investment grade rating with rating agencies as this is important to our
large clients and
prospects |
 25
Summary
Broadridge is a dependable mid-single-digit revenue grower
with a scalable business model providing opportunity for margin
expansion
We expect to continue to invest in our existing businesses and
execute strategic acquisitions to generate mid to high single-
digit average revenue growth
We expect to generate strong free cash flows and aim to return
cash to shareholders through dividends, repurchasing shares to
offset dilution and to opportunistically repurchase shares
|
 26
Appendix
Appendix |
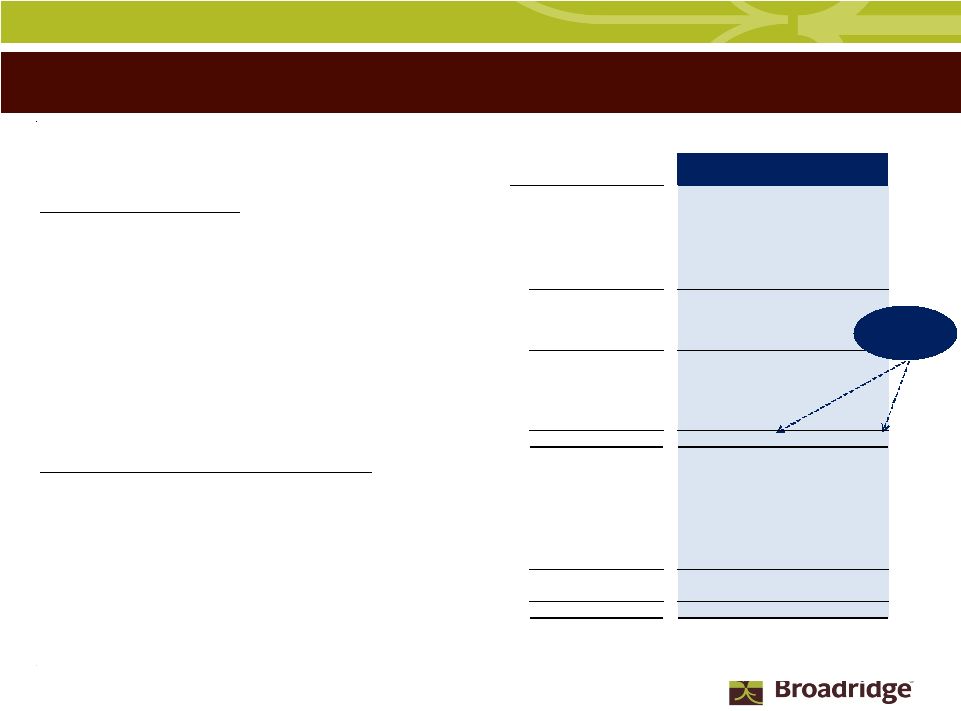
 27
Penson
Update
Evolution of the Penson
Deal
FY09 Actual results to Continuing Operations GAAP
(1)
(2)
(3)
(4)
(5)
(6)
(7)
Pre-Penson
Transaction
-
Discontinued Operations
=
+
Penson
Phase 1
=
FY10 Proforma
+
Penson
Phase 2
=
FY12 Proforma
(FY09 Reported)
(FY09 GAAP)
(A)
(Subtotal)
Converting FY11
Q3 or Q4
(B)
Revenue
$100M
-
=
$25M
+
$30M
=
$55M
+
$25M -
$35M
=
$80M-$90M
($75M Clearing Related)
$75M Contracts Sold to
Penson
(Existing Outsourcing)
($25M Existing Outsourcing)
($25M Existing Outsourcing)
($30M Penson
Phase #1)
Expense
$110M
-
$75M Allocated Expenses
=
$35M
$35M
Note:
$25M
Expenses eliminated
$50M
Remaining expenses
$50M
$50M
to be re-allocated
once Penson
live
$75M
$35M
+
$50M
=
$85M
+
$5M
=
$90M
Operating Losses
($10M)
-
$0M
=
($10M)
+
($20M)
=
($30M)
+
$20M-$30M
=
($10M) -to-
($0M)
Continuing Operations
(B)
-
Phase
2
is
related
to
outsourcing
services
to
support
the
existing
Penson
clients
once
converted
onto
the
Broadridge
processing
platform.
As
a
result,
there
are
less
expenses
necessary
for
Penson
Phase
2.
Note: $ amounts have been rounded for illustrative purposes only
(A)
-
Phase
1
is
related
to
outsourcing
services
to
support
the
client
contracts
acquired
by
Penson
from
Broadridge.
Revenue
amount
originally
expected
to
be
$40M
was
reduced
due
primarily
to
loss
of
Neuberger
contract.
FY09 GAAP Continuing Operations to Fully Converted Penson Phases 1 & 2
|
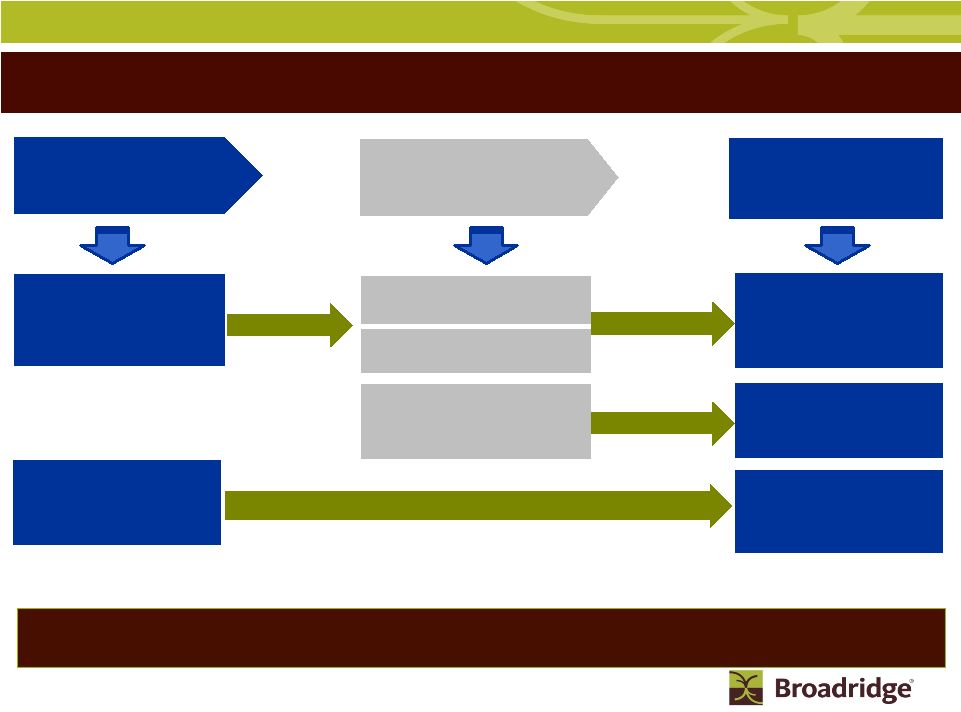
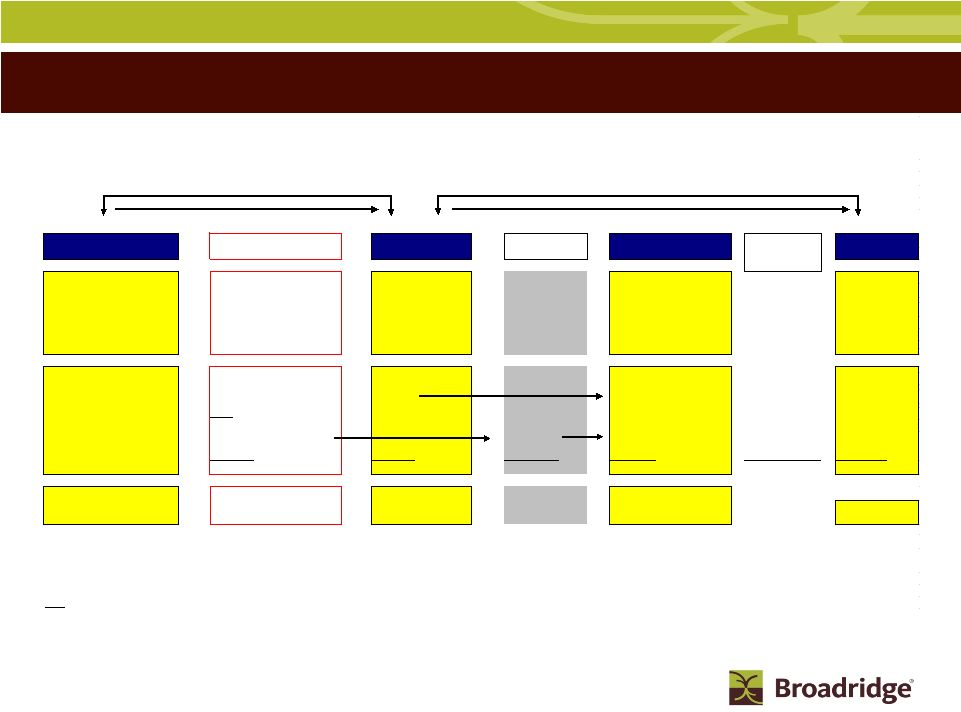
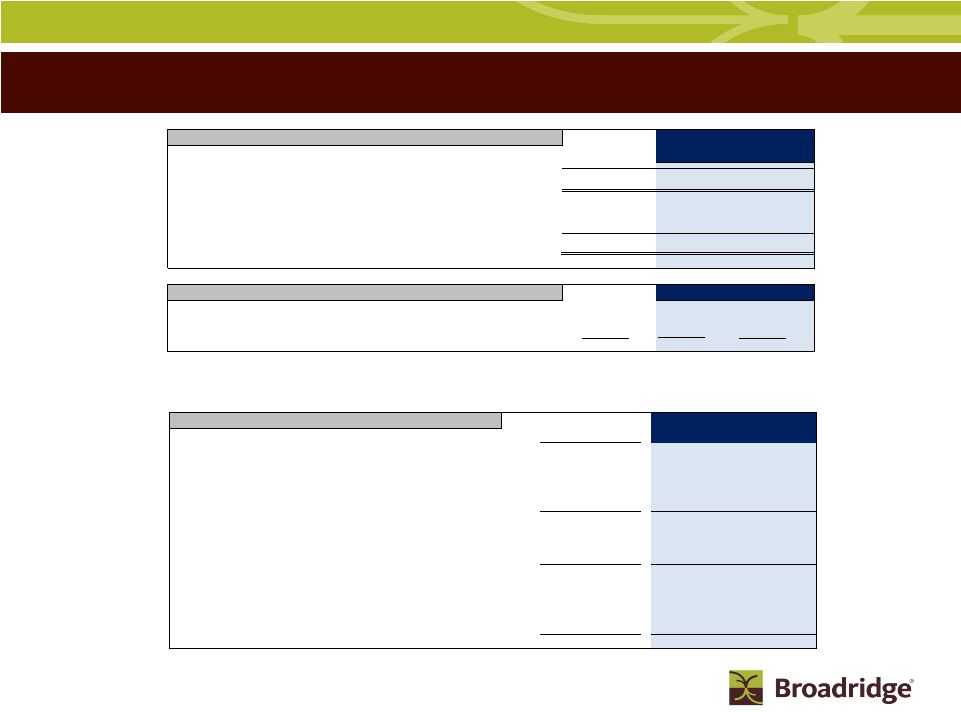
 28
Securities Processing
Self-Clearing with
Service Bureau
Outsourcing
Self-Clearing with Ops.
Outsourcing & Service
Bureau
Broadridge’s Simplified Securities Processing Model
Clearing
Fully-Disclosed Clearing
Financing
Activities and
Compliance
Technology &
Data Center
Operational
Infrastructure
Client
Responsibility
Client
Responsibility
Client
Responsibility
Provided by
Broadridge
Provided by
Broadridge
Provided by
Broadridge
Provided by
Clearing Firm
(Previously provided by Ridge)
Target
Large
Broker-Dealer Firms
Large ~ Medium
Broker-Dealer Firms
Medium ~ Small
Broker-Dealer Firms
Outsourced to
Broadridge
(Previously provided by Ridge)
Outsourced to
Broadridge
(Previously provided by Ridge)
Third Party
Clearing
Clients
Outsourcing business has high growth potential and our simplified processing model
continues to allow us to serve the entire investment process
|
 29
Free Cash Flow (Non-GAAP) –
YTD and FY10 Forecast
Unaudited
(In millions)
Low
High
Cash Flow -
Continuing Operations
Net earnings from continuing operations (GAAP)
109
$
220
$
228
$
Depreciation and amortization (includes other LT assets)
43
60
58
Stock-based compensation expense
21
30
28
Other
(16)
(15)
(10)
Subtotal
157
295
304
Working capital changes
21
(5)
8
Long-term assets & liabilities changes
3
-
3
Net cash flow provided by continuing operating activities
181
290
315
Cash Flows From Investing Activities
Capital expenditures & purchased intangibles
(29)
(55)
(45)
Free cash flow (Non-GAAP)
152
$
235
$
270
$
Cash Flows From Other Investing and Financing Activities
Acquisitions
(11)
(11)
(11)
Freed-up Clearing capital
(b)
10
210
240
Long-term debt repayment
-
-
-
Dividends paid
(48)
(67)
(67)
Other
5
5
5
Stock repurchases net of options proceeds
(103)
(103)
(103)
Net change in cash and cash equivalents
5
269
334
Cash and cash equivalents, at the beginning of year
173
173
173
Cash and cash equivalents, at the end of period
178
$
442
$
507
$
(a) Guidance does not include effect of any future acquisitions,
additional debt or share repurchases
(b) Assumes Penson
transaction will close in Q4 2010
March 2010
Nine Months Ended
FY10 Range
(a)
Free Cash Flow
$235-270M |
 30
Historical Free Cash Flow Non-GAAP to GAAP Reconciliation
Reconciliation of Non-GAAP to GAAP Measures
Free Cash Flow
($ in millions)
(Unaudited)
FY06
FY07
FY08
FY09
Actual
Actual
Actual
Actual
Net cash flow provided by operating activities (GAAP)
426
$
161
$
482
$
359
$
Securities
clearing
activities
(a)
159
(128)
146
77
Net cash flow provided by operating activities, excluding
securities clearing activities
267
289
336
282
Capital expenditures & Intangibles
(41)
(38)
(46)
(30)
Discontinued
Operations
(b)
22
-
-
-
Free
cash
flow
(b)
248
$
251
$
290
$
252
$
(a) Cash and securities segregated for regulatory purposes, securities deposited
with clearing organizations and securities receivables and securities payables
(b)
FY06
excludes
loss
from
discontinued
operations
of
$14M,
net
of
income
taxes
and
include
proceeds
from
sale
of
businessess
of $8M |
 31
Reconciliation of Non-GAAP to GAAP Measures
EBIT Reconciliation
FY09
FY10 Range
($ in millions)
Actual
Low
High
EBIT (Non-GAAP)
*
$352
$348
$361
Margin %
17.0%
15.8%
16.2%
Interest & Other
($6)
($11)
($11)
Total EBT (GAAP)
$346
$337
$350
Margin %
16.7%
15.3%
15.7%
EPS Reconciliation
Low
High
Diluted EPS from continuing operations (GAAP)
$1.58
$1.58
$1.64
Tax Restructuring
**
($0.07)
($0.06)
($0.06)
Diluted EPS before 1-Times (Non-GAAP)
$1.51
$1.52
$1.58
* Includes impact of FX Transaction Activity
** Includes one-time gain on purchase of Senior Notes and one-time state
tax credit benefit Free Cash Flow Reconciliation
(In millions)
Low
High
Net earnings from continuing operations (GAAP)
109
$
220
$
228
$
Depreciation and amortization (includes other LT assets)
43
60
58
Stock-based compensation expense
21
30
28
Other
(16)
(15)
(10)
Subtotal
157
295
304
Working capital changes
21
(5)
8
Long-term assets & liabilities changes
3
-
3
Net cash flow provided by continuing operating activities
181
290
315
Cash Flows From Investing Activities
Capital expenditures & purchased intangibles
(29)
(55)
(45)
Free cash flow (Non-GAAP)
152
$
235
$
270
$
March 2010
Nine Months Ended
FY10 Range |
 32
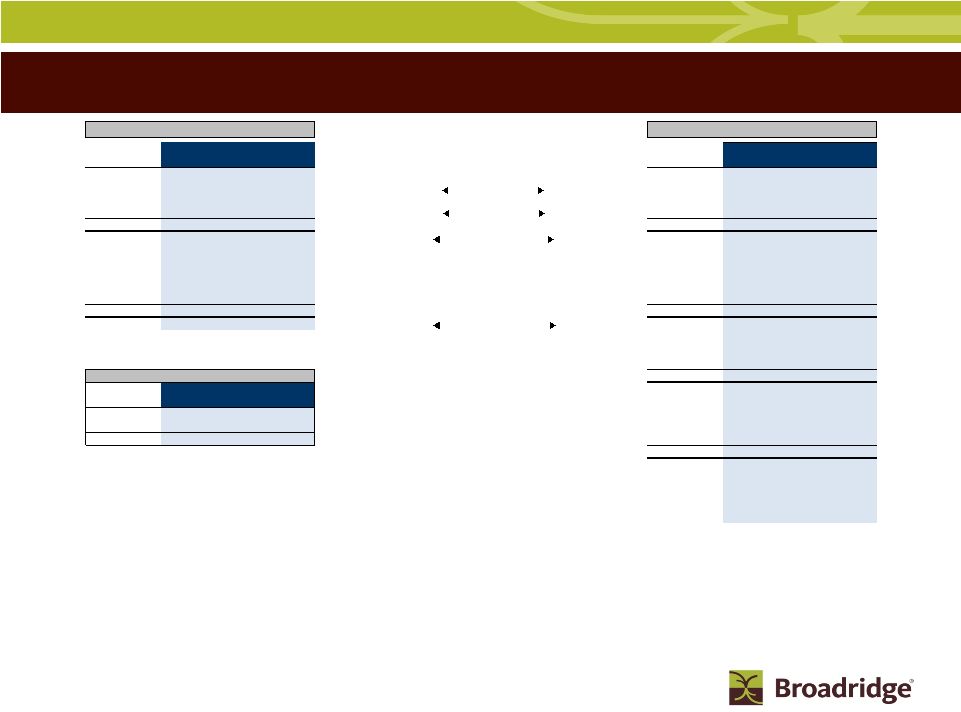
Closed Sales-To-Revenue Overview
General Conversion Time Frames
Closed Sales-to-Revenue Conversion
General Time Frames
Investor Communication Solutions
Registered Mutual Fund Sales
1 to 6 Months
Registered Equity Sales
Issuer's Next Annual Meeting
Transaction Reporting
(1)
and Fulfillment Sales
3 to 9 Months
Global Proxy Sales
1 to 6 Months
Securities Processing Solutions
Small Broker-Dealer Firms
3 to 6 Months
Mid-sized Broker-Dealer Firms
6 to 9 Months
Large Broker-Dealer Firms
9 to18+ Months
Outsourcing
Mid-sized Broker-Dealer Firms
6 to 9 Months
Large Broker-Dealer Firms
9 to18+ Months
(1) Transaction Reporting sales are comprised primarily of production of statements
and confirms Segment Sales Categories |
 33
Broadridge
ICS Key Statistics
$ in millions
RC= Recurring
ED= Event-Driven
FY07
FY08
FY09
Type
Fee
Revenues
(1)
Proxy
Equities
227.0
$
256.0
$
268.4
$
RC
Stock Record Position Growth
0%
2%
-2%
Pieces
289.9
297.8
288.0
Mutual Funds
78.8
$
92.1
$
55.0
$
ED
Pieces
127.3
176.6
73.5
Contests/Specials
28.5
$
19.7
$
26.9
$
ED
Pieces
31.9
21.2
30.8
Total Proxy
334.3
$
367.8
$
350.3
$
Total Pieces
449.1
495.6
392.3
Notice and Access Opt-in %
NA
28%
50%
Suppression %
44%
49%
50%
Interims
Mutual Funds
(Annual/Semi-Annual Reports/Annual Prospectuses)
69.7
$
73.9
$
78.1
$
RC
Position Growth
9%
9%
4%
Pieces
366.3
401.1
440.5
Mutual Funds
(Supplemental Prospectuses) & Other
51.2
$
48.9
$
58.0
$
ED
Pieces
332.8
301.3
349.6
Total Interims
120.9
$
122.8
$
136.1
$
Total Pieces
699.1
702.4
790.1
Transaction
Transaction Reporting
129.6
$
124.7
$
132.0
$
RC
Reporting
Fulfillment
Post-Sale Fulfillment
59.9
$
70.4
$
72.9
$
RC
Pre-Sale Fulfillment
37.4
$
37.5
$
36.6
$
ED
Total Fulfillment
97.3
$
107.9
$
109.5
$
Other
Other
(2)
49.9
$
44.2
$
46.3
$
ED
Communications
Total Fee Revenues
732.0
$
767.4
$
774.2
$
Total Distribution Revenues
820.2
$
807.8
$
756.8
$
Total Revenues (Non-GAAP)
1,552.2
$
1,575.2
$
1,531.0
$
Transfer price adjustment
2.0
-
-
Total Revenues (GAAP)
1,554.2
$
1,575.2
$
1,531.0
$
Total RC Fees
486.3
$
525.0
$
551.4
$
Total ED Fees
245.7
$
242.4
$
222.8
$
(2) Other includes pieces of 18.6M for FY07, 12.6M for FY08 and 14.4M for FY09
primarily related to corporate actions (1) These items represent fee revenues
only and exclude distribution revenues which are set out separately. The historical numbers have been adjusted to
exclude distribution revenues |
 34
Broadridge
SPS Key Statistics
$ in millions
RC= Recurring
ED= Event-Driven
FY07
FY08
FY09
Type
Equity
Transaction-Based
Equity Trades
262.9
$
261.5
$
260.4
$
RC
Trade Volume (Average Trades per Day in '000)
(1)(2)
1,454
1,559
1,648
Non-Transaction
Other Equity Services
172.9
$
177.2
$
191.7
$
RC
Total Equity
435.8
$
438.7
$
452.1
$
Fixed Income
Transaction-Based
Fixed Income Trades
45.2
$
51.1
$
52.3
$
RC
Trade Volume (Average Trades per Day in '000)
195
237
294
Non-Transaction
Other Fixed Income Services
22.9
$
24.6
$
29.4
$
RC
Total Fixed Income
68.1
$
75.7
$
81.7
$
Total Revenues (Non-GAAP)
503.9
$
514.4
$
533.8
$
Transfer price adjustment
6.0
-
-
Total Revenues (GAAP)
509.9
$
514.4
$
533.8
$
Outsourcing
Outsourcing
23.5
$
19.1
$
25.1
$
RC
# of Clients
4
5
6
Combined Revenues with Outsourcing (Non-GAAP)
533.4
$
533.5
$
558.9
$
(1) As of 1Q09, Equity Trade volume adjusted to exclude trades processed under
fixed priced contracts. Management believes excluding this trade
volume presents a stronger correlation between trade volume and Equity Trade revenue
(2)
As
of
2Q09,
Equity
Trade
volume
excluded
trades
per
day
for
Lehman
Brothers,
Inc.
to
reflect
the
loss
of
the
Lehman
business
and to
provide a better historical comparison |
 35
Broadridge
ICS Definitions
Refers to the proxy services we provide in connection with annual stockholder meetings for publicly traded corporate issuers. Annual meetings of public
companies include shares held in "street name" (meaning that they are held of record by
brokers or banks, which in turn hold the shares on behalf of their clients, the ultimate
beneficial owners) and shares held in "registered name" (shares registered directly in the names of their owners).
Refers to the proxy services we provide for funds,
classes or trusts of an investment company. Open-ended mutual funds are not required to have
annual meetings. As a result, mutual fund proxy services provided to open-ended mutual funds
are driven by a "triggering event." These triggering events can be a change in
directors, fee structures, investment restrictions, or mergers of funds.
Refers to the proxy services we provide when a separate agenda is put forth
by one or more stockholders that is in opposition to the proposals presented by management of
the company which is separately distributed and tabulated from the company’s proxy materials.
Refers to the proxy services we provide in connection with stockholder meetings held outside of the
normal annual meeting cycle and are primarily drive by special events (e.g., mergers and
acquisitions in which the company being acquired is a public company and needs to solicit the approval of its stockholders).
Refers to the services we provide investment companies in connection with information they
are required by regulation to distribute periodically to their investors. These reports contain
pertinent information such as holdings, fund performance, and other required disclosure.
Refers primarily to information required to be provided by
mutual funds to supplement information previously provided in an annual mutual fund prospectus
(e.g., change in portfolio managers, closing funds or class of shares to investors, or restating or clarifying items in the original
prospectus). The events could occur at any time throughout the year.
Refers to communications provided by corporate issuers and investment companies to investors
including newsletters, notices, tax information, marketing materials and other information not
required to be distributed by regulation. Refers primarily to the printing and distribution of account statements, trade confirmations and tax
reporting documents to account holders, including electronic delivery and archival services.
Refers primarily to the distribution of prospectuses, offering documents,
and required regulatory disclosure information to investors in connection with purchases of
securities. Refers to the distribution of marketing
literature, welcome kits, enrollment kits, and investor information to prospective investors, existing
stockholders and other targeted recipients on behalf of broker-dealers, mutual fund companies and
401(k) administrators. Refers to the services we provide in connection with the distribution of communications material not
included in the above definitions such as non-objecting beneficial owner (NOBO) lists, and
corporate actions such as mergers, acquisitions, and tender offer transactions.
Proxy
Equities –
Mutual Funds –
Contests –
Specials –
Mutual Funds (Annual/Semi-Annual Reports/Annual Prospectus) –
Interims
Mutual Funds (Supplemental Prospectus) –
Other –
Transaction Reporting
Fulfillment
Transaction Reporting –
Post-Sale Fulfillment –
Pre-Sale Fulfillment –
Other –
Other Communications |