Attached files
| file | filename |
|---|---|
| 8-K - FORM 8-K - MARTIN MIDSTREAM PARTNERS L.P. | d73101e8vk.htm |
Exhibit 99.1
| Martin Midstream Partners L.P. Presentation to May 2010 |
| Forward-Looking Statements 2 Statements included that are not historical facts (including any statements concerning plans and objectives of management for future operations or economic performance, or assumptions or forecasts related thereto), are forward-looking statements. These statements can be identified by the use of forward-looking terminology including "forecast," "may," "believe," "will," "expect," "anticipate," "estimate," "continue," or other similar words. These statements discuss future expectations, contain projections of results of operations or of financial condition or state other "forward-looking" information. We and our representatives may from time to time make other oral or written statements that are also forward-looking statements. These forward-looking statements are based upon management's current plans, expectations, estimates, assumptions and beliefs concerning future events impacting us and therefore involve a number of risks and uncertainties. We caution that forward-looking statements are not guarantees and that actual results could differ materially from those expressed or implied in the forward-looking statements. Because these forward-looking statements involve risks and uncertainties, actual results could differ materially from those expressed or implied by these forward-looking statements for a number of important reasons. A discussion of these factors, including risks and uncertainties, is set forth in Martin Midstream's annual and quarterly reports filed from time to time with the Securities and Exchange Commission. Martin Midstream expressly disclaims any intention or obligation to revise or update any forward-looking statements whether as a result of new information, future events, or otherwise. |

| Use of Non-GAAP Financial Measures 3 This presentation includes certain non-GAAP financial measures, such as EBITDA, Adjusted EBITDA and Distributable Cash Flow. These non-GAAP financial measures are not meant to be considered in isolation or as a substitute for results prepared in accordance with accounting principles generally accepted in the United States (GAAP). A reconciliation of non-GAAP financial measures included in this presentation to the most directly comparable financial measure calculated and presented in accordance with GAAP is set forth elsewhere in this presentation or on our web site at www.martinmidstream.com MMLP's management believes that these non-GAAP financial measures provide useful information to investors regarding the MMLP's financial condition and results of operations as they provide another measure of the profitability and ability to service its debt, and are considered important measures by financial analysts covering MMLP and its peers. |
| Presenters 4 Ruben Martin - President & Chief Executive Officer Joe McCreery - Vice President, Finance / Head of Investor Relations |
| Partnership Overview |
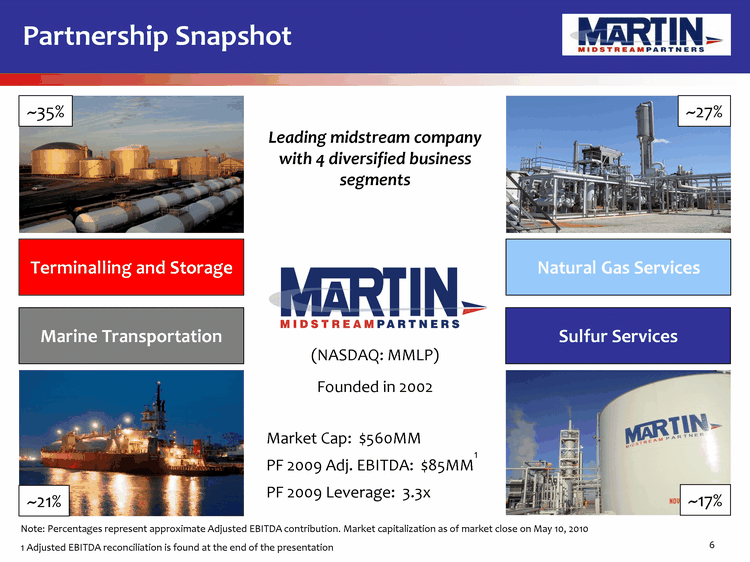
| Sulfur Services Marine Transportation Terminalling and Storage Natural Gas Services ~35% ~21% ~17% Partnership Snapshot 6 ~27% Note: Percentages represent approximate Adjusted EBITDA contribution. Market capitalization as of market close on May 10, 2010 1 Adjusted EBITDA reconciliation is found at the end of the presentation Market Cap: $560MM PF 2009 Adj. EBITDA: $85MM1 PF 2009 Leverage: 3.3x (NASDAQ: MMLP) Founded in 2002 Leading midstream company with 4 diversified business segments |
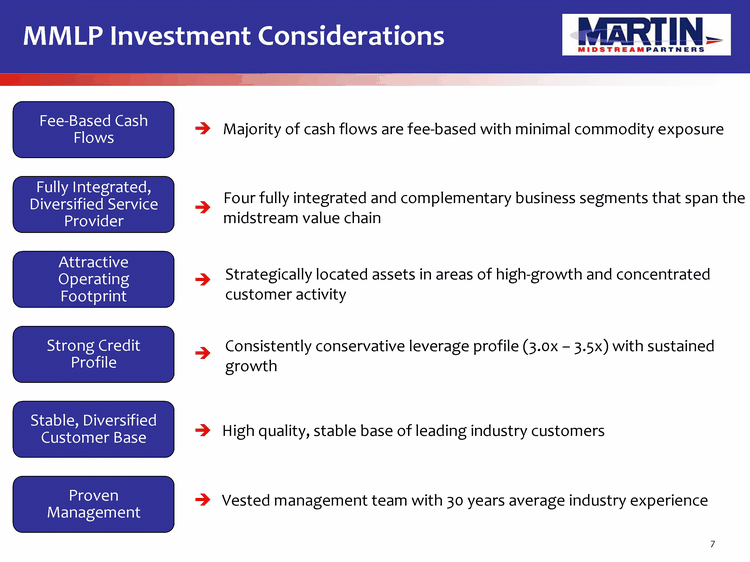
| 7 Investment Considerations Four fully integrated and complementary business segments that span the midstream value chain Proven Management Consistently conservative leverage profile (3.0x - 3.5x) with sustained growth Majority of cash flows are fee-based with minimal commodity exposure High quality, stable base of leading industry customers Vested management team with 30 years average industry experience Stable, Diversified Customer Base Fully Integrated, Diversified Service Provider Strong Credit Profile Fee-Based Cash Flows Strategically located assets in areas of high-growth and concentrated customer activity Attractive Operating Footprint MMLP Investment Considerations |

| 8 Terminalling and Storage: Multi-year, fee-based Specialized products have fee minimums Natural Gas Services: Stable, margin-based wholesale NGLs Multi-year up to life of reserves for gathering and processing Sulfur Services: Take-or-pay prilling Stable, margin-based molten sulfur Stable, margin-based fertilizer Marine Transportation: 100% fee-based, primarily term contracts Infrastructure for hard-to-handle products provides substantial barriers to entry Stable, Fee-Based Cash Flow Concentration Note: "Margin-based" contracts represent buy/sell contracts that are priced off of the same benchmark simultaneously (to account for service fee to facilitate handling) and effectively eliminate pricing risk 2009 PF Adjusted EBITDA |
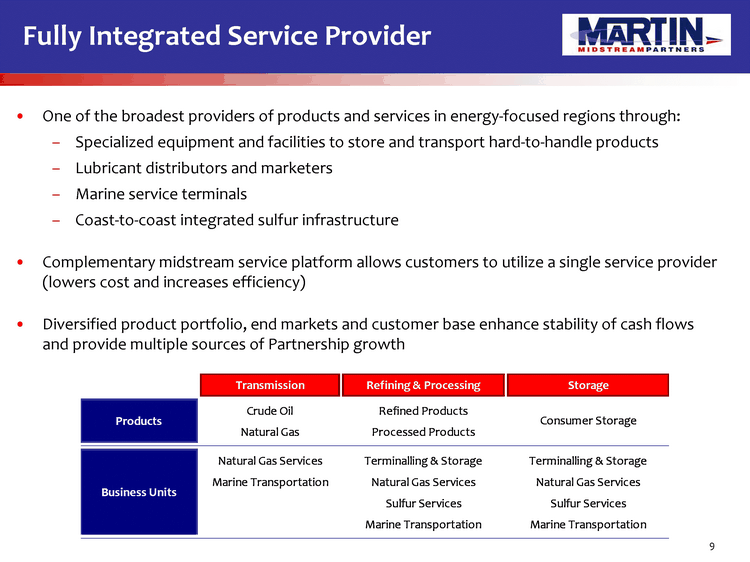
| Fully Integrated Service Provider 9 One of the broadest providers of products and services in energy-focused regions through: Specialized equipment and facilities to store and transport hard-to-handle products Lubricant distributors and marketers Marine service terminals Coast-to-coast integrated sulfur infrastructure Complementary midstream service platform allows customers to utilize a single service provider (lowers cost and increases efficiency) Diversified product portfolio, end markets and customer base enhance stability of cash flows and provide multiple sources of Partnership growth |
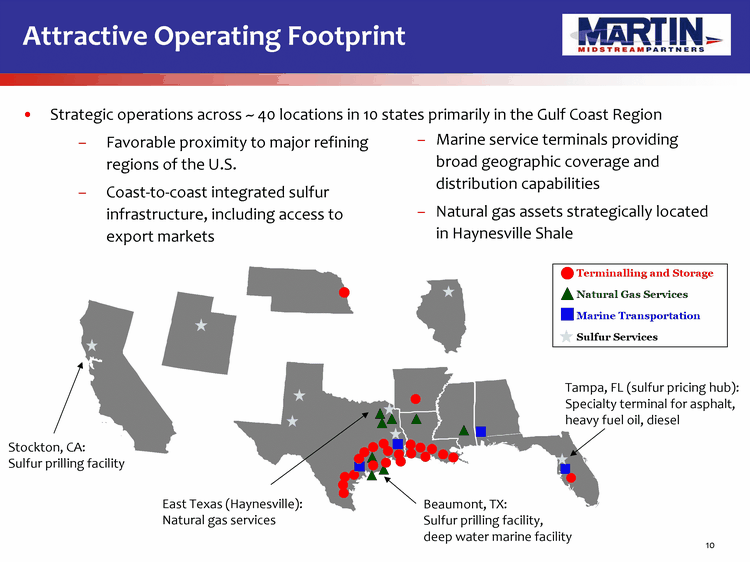
| Strategic operations across ~ 40 locations in 10 states primarily in the Gulf Coast Region Favorable proximity to major refining regions of the U.S. Coast-to-coast integrated sulfur infrastructure, including access to export markets 10 Attractive Operating Footprint Marine service terminals providing broad geographic coverage and distribution capabilities Natural gas assets strategically located in Haynesville Shale Tampa, FL (sulfur pricing hub): Specialty terminal for asphalt, heavy fuel oil, diesel Stockton, CA: Sulfur prilling facility T Beaumont, TX: Sulfur prilling facility, deep water marine facility East Texas (Haynesville): Natural gas services T T T T T T T T M T T T T T M M T T T T T T T T |
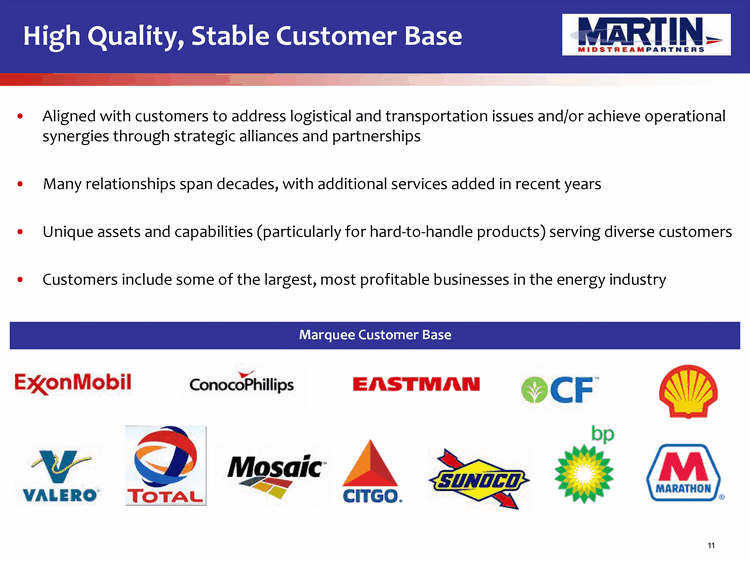
| 11 Aligned with customers to address logistical and transportation issues and/or achieve operational synergies through strategic alliances and partnerships Many relationships span decades, with additional services added in recent years Unique assets and capabilities (particularly for hard-to-handle products) serving diverse customers Customers include some of the largest, most profitable businesses in the energy industry Marquee Customer Base High Quality, Stable Customer Base |
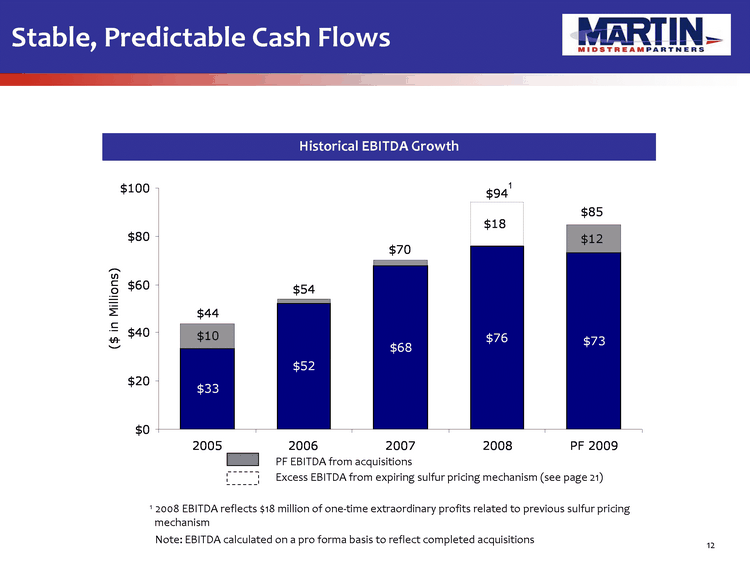
| 12 Stable, Predictable Cash Flows Historical EBITDA Growth Note: EBITDA calculated on a pro forma basis to reflect completed acquisitions 1 2008 EBITDA reflects $18 million of one-time extraordinary profits related to previous sulfur pricing mechanism PF EBITDA from acquisitions Excess EBITDA from expiring sulfur pricing mechanism (see page 21) |
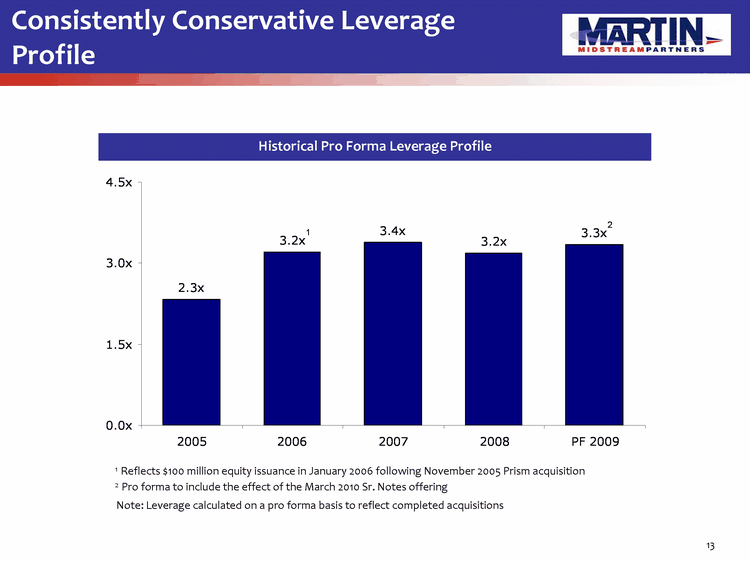
| 13 Consistently Conservative Leverage Profile Historical Pro Forma Leverage Profile 1 Reflects $100 million equity issuance in January 2006 following November 2005 Prism acquisition Note: Leverage calculated on a pro forma basis to reflect completed acquisitions 2 Pro forma to include the effect of the March 2010 Sr. Notes offering |
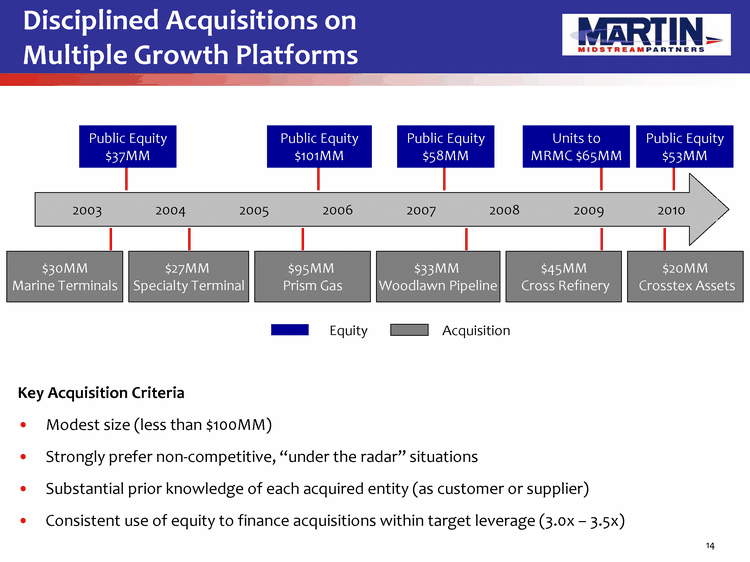
| Key Acquisition Criteria Modest size (less than $100MM) Strongly prefer non-competitive, "under the radar" situations Substantial prior knowledge of each acquired entity (as customer or supplier) Consistent use of equity to finance acquisitions within target leverage (3.0x - 3.5x) 14 Disciplined Acquisitions on Multiple Growth Platforms $30MM Marine Terminals 2003 2004 2005 2006 2007 2008 2009 2010 $27MM Specialty Terminal $95MM Prism Gas $33MM Woodlawn Pipeline $45MM Cross Refinery $20MM Crosstex Assets Public Equity $37MM Public Equity $101MM Public Equity $58MM Units to MRMC $65MM Public Equity $53MM Acquisition Equity |

| 15 Developed infrastructure and brand reputation for the Partnership's business segments over the past 50 years Structured to support the Partnership Maintains distinct set of assets and business units Demonstrated historical support Over $100MM invested through unit purchases to support acquisitions and maintain GP interest Martin Resource Management Corporation Martin Midstream Partners L.P. 58% LP Interest 2% GP Interest Martin Resources LLC 100% Martin Midstream GP LLC 100% Public Unitholders 7.6 million LP Units 40% LP Interest Strong General Partner Support Private Company- 28.5% owned by management / ESOP Notes Issuer |
| Business Segment Overview |
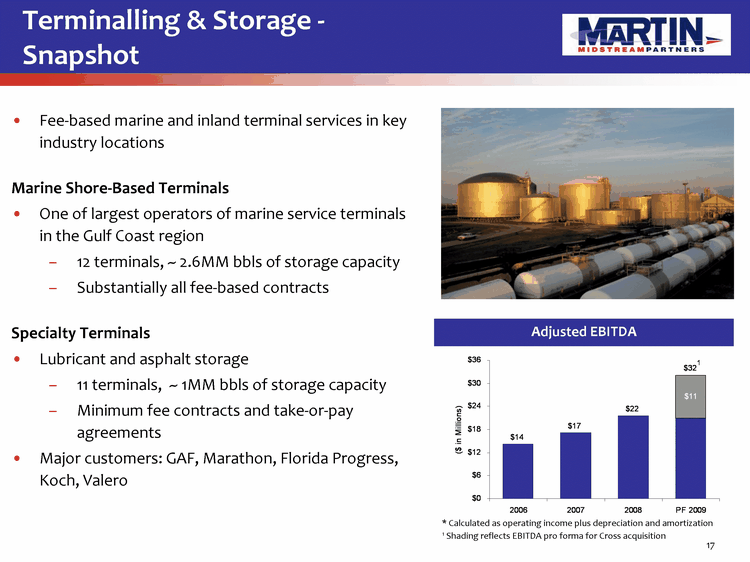
| Terminalling & Storage - Snapshot Fee-based marine and inland terminal services in key industry locations Marine Shore-Based Terminals One of largest operators of marine service terminals in the Gulf Coast region 12 terminals, ~ 2.6MM bbls of storage capacity Substantially all fee-based contracts Specialty Terminals Lubricant and asphalt storage 11 terminals, ~ 1MM bbls of storage capacity Minimum fee contracts and take-or-pay agreements Major customers: GAF, Marathon, Florida Progress, Koch, Valero 17 Adjusted EBITDA * Calculated as operating income plus depreciation and amortization 1 Shading reflects EBITDA pro forma for Cross acquisition |
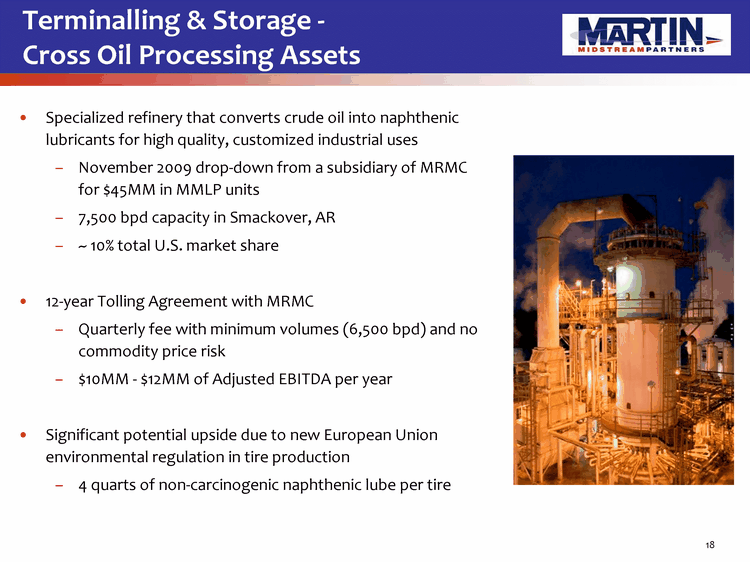
| Specialized refinery that converts crude oil into naphthenic lubricants for high quality, customized industrial uses November 2009 drop-down from a subsidiary of MRMC for $45MM in MMLP units 7,500 bpd capacity in Smackover, AR ~ 10% total U.S. market share 12-year Tolling Agreement with MRMC Quarterly fee with minimum volumes (6,500 bpd) and no commodity price risk $10MM - $12MM of Adjusted EBITDA per year Significant potential upside due to new European Union environmental regulation in tire production 4 quarts of non-carcinogenic naphthenic lube per tire 18 Terminalling & Storage - Cross Oil Processing Assets |
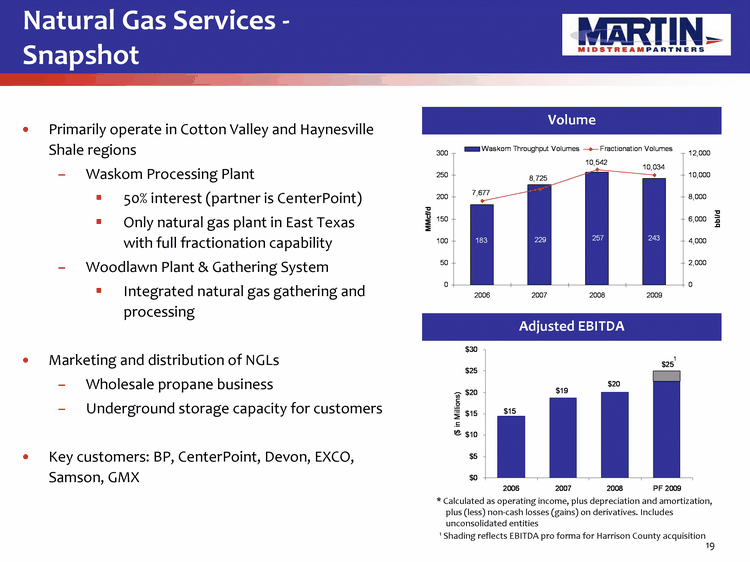
| Natural Gas Services - Snapshot Primarily operate in Cotton Valley and Haynesville Shale regions Waskom Processing Plant 50% interest (partner is CenterPoint) Only natural gas plant in East Texas with full fractionation capability Woodlawn Plant & Gathering System Integrated natural gas gathering and processing Marketing and distribution of NGLs Wholesale propane business Underground storage capacity for customers Key customers: BP, CenterPoint, Devon, EXCO, Samson, GMX 19 * Calculated as operating income, plus depreciation and amortization, plus (less) non-cash losses (gains) on derivatives. Includes unconsolidated entities Adjusted EBITDA 1 Shading reflects EBITDA pro forma for Harrison County acquisition Volume |
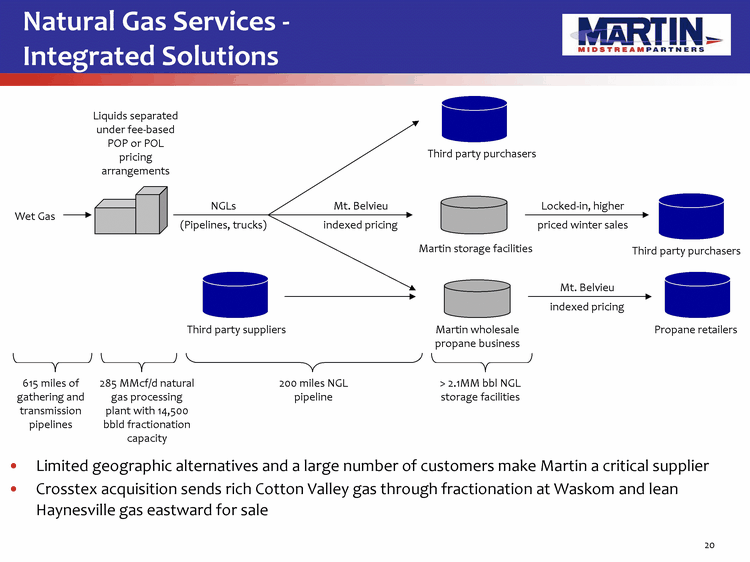
| Locked-in, higher Natural Gas Services - Integrated Solutions 20 Wet Gas Liquids separated under fee-based POP or POL pricing arrangements Third party purchasers (Pipelines, trucks) Martin storage facilities Third party purchasers NGLs Martin wholesale propane business Mt. Belvieu Propane retailers Limited geographic alternatives and a large number of customers make Martin a critical supplier Crosstex acquisition sends rich Cotton Valley gas through fractionation at Waskom and lean Haynesville gas eastward for sale 615 miles of gathering and transmission pipelines 200 miles NGL pipeline 285 MMcf/d natural gas processing plant with 14,500 bbld fractionation capacity > 2.1MM bbl NGL storage facilities Third party suppliers indexed pricing priced winter sales Mt. Belvieu indexed pricing |
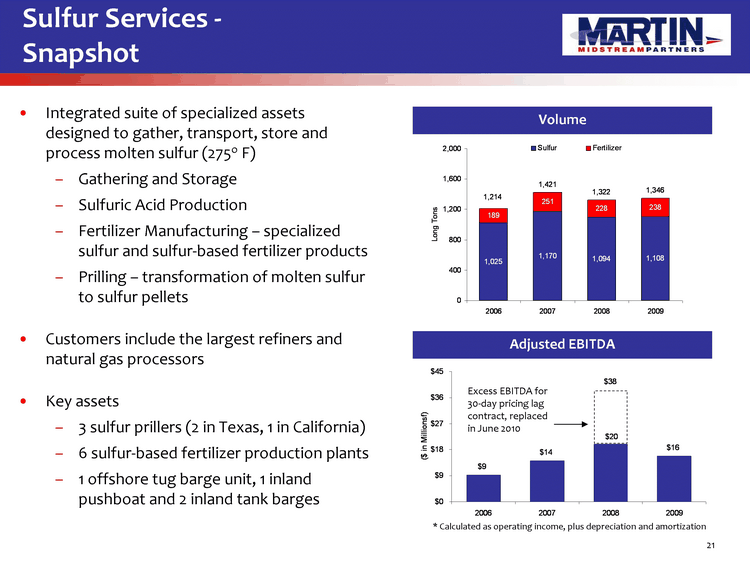
| Sulfur Services - Snapshot Integrated suite of specialized assets designed to gather, transport, store and process molten sulfur (275o F) Gathering and Storage Sulfuric Acid Production Fertilizer Manufacturing - specialized sulfur and sulfur-based fertilizer products Prilling - transformation of molten sulfur to sulfur pellets Customers include the largest refiners and natural gas processors Key assets 3 sulfur prillers (2 in Texas, 1 in California) 6 sulfur-based fertilizer production plants 1 offshore tug barge unit, 1 inland pushboat and 2 inland tank barges 21 Volume Adjusted EBITDA * Calculated as operating income, plus depreciation and amortization Excess EBITDA for 30-day pricing lag contract, replaced in June 2010 |
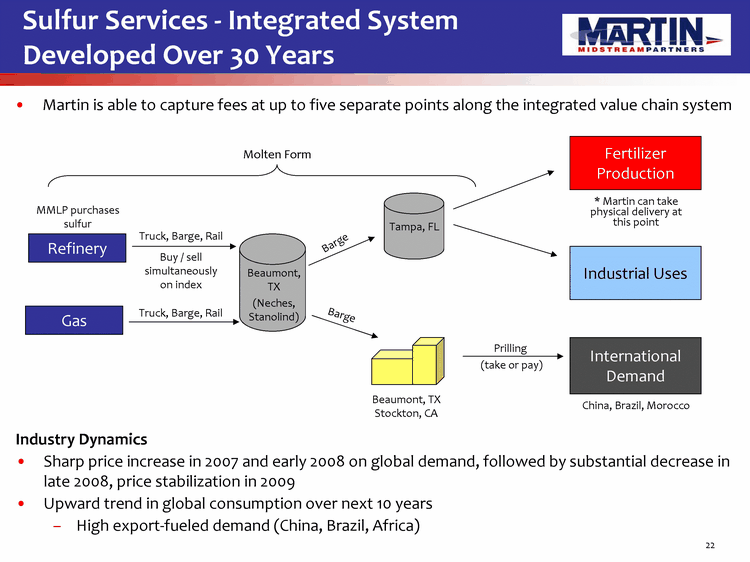
| Sulfur Services - Integrated System Developed Over 30 Years 22 Refinery Gas Fertilizer Production Industrial Uses International Demand Beaumont, TX Stockton, CA Tampa, FL Truck, Barge, Rail Truck, Barge, Rail Barge Barge Prilling (take or pay) Molten Form China, Brazil, Morocco * Martin can take physical delivery at this point Martin is able to capture fees at up to five separate points along the integrated value chain system Beaumont, TX (Neches, Stanolind) MMLP purchases sulfur Industry Dynamics Sharp price increase in 2007 and early 2008 on global demand, followed by substantial decrease in late 2008, price stabilization in 2009 Upward trend in global consumption over next 10 years High export-fueled demand (China, Brazil, Africa) Buy / sell simultaneously on index |
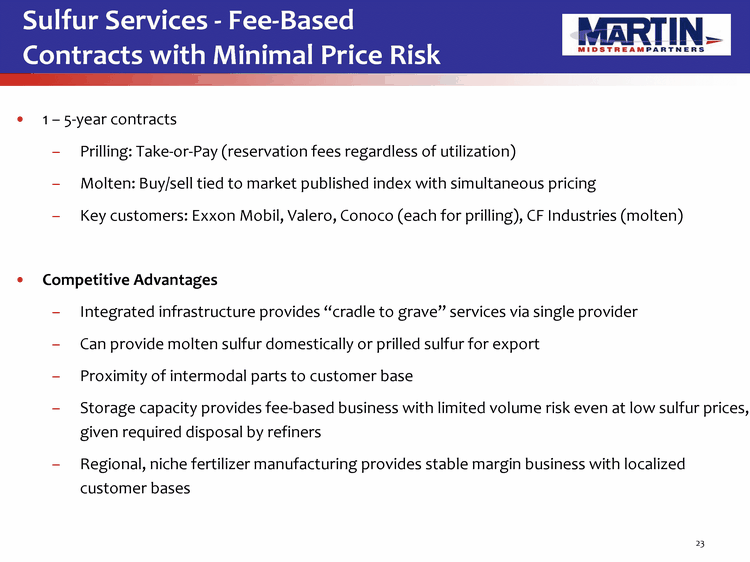
| Sulfur Services - Fee-Based Contracts with Minimal Price Risk 1 - 5-year contracts Prilling: Take-or-Pay (reservation fees regardless of utilization) Molten: Buy/sell tied to market published index with simultaneous pricing Key customers: Exxon Mobil, Valero, Conoco (each for prilling), CF Industries (molten) Competitive Advantages Integrated infrastructure provides "cradle to grave" services via single provider Can provide molten sulfur domestically or prilled sulfur for export Proximity of intermodal parts to customer base Storage capacity provides fee-based business with limited volume risk even at low sulfur prices, given required disposal by refiners Regional, niche fertilizer manufacturing provides stable margin business with localized customer bases 23 |
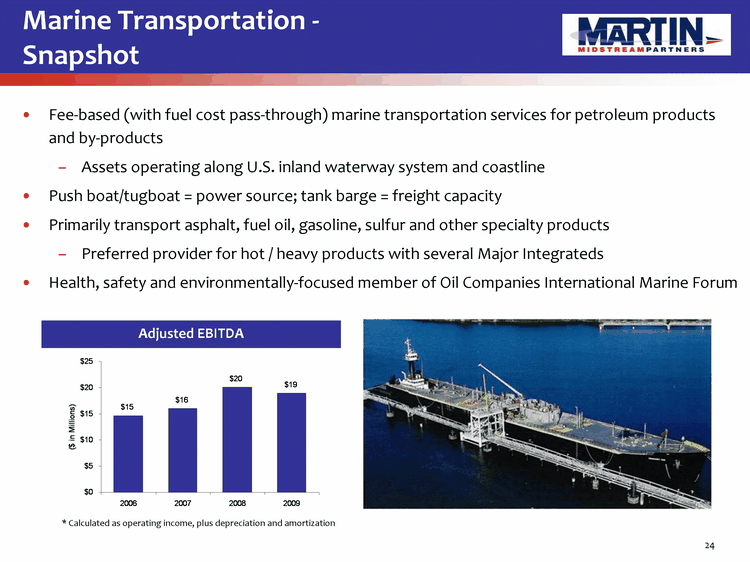
| Marine Transportation - Snapshot Fee-based (with fuel cost pass-through) marine transportation services for petroleum products and by-products Assets operating along U.S. inland waterway system and coastline Push boat/tugboat = power source; tank barge = freight capacity Primarily transport asphalt, fuel oil, gasoline, sulfur and other specialty products Preferred provider for hot / heavy products with several Major Integrateds Health, safety and environmentally-focused member of Oil Companies International Marine Forum 24 * Calculated as operating income, plus depreciation and amortization Adjusted EBITDA |
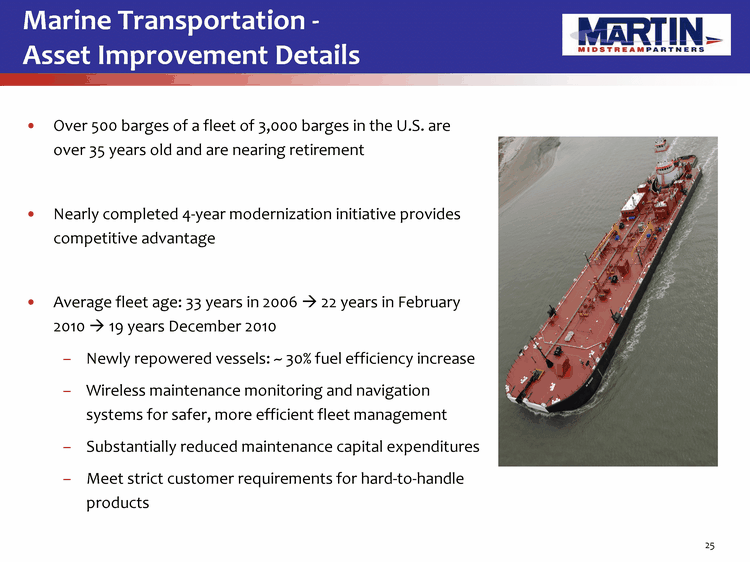
| Marine Transportation - Asset Improvement Details Over 500 barges of a fleet of 3,000 barges in the U.S. are over 35 years old and are nearing retirement Nearly completed 4-year modernization initiative provides competitive advantage Average fleet age: 33 years in 2006 ? 22 years in February 2010 ? 19 years December 2010 Newly repowered vessels: ~ 30% fuel efficiency increase Wireless maintenance monitoring and navigation systems for safer, more efficient fleet management Substantially reduced maintenance capital expenditures Meet strict customer requirements for hard-to-handle products 25 |
| Marine Transportation: Solid Foundation Despite Industry Cycle Term market player for inland transportation services Currently 94% contracted for 1 to 5 years 20% spot pricing at present, but pricing and contract length to improve with stronger economy and older fleet retirement All Jones Act vessels (non-union, less Coast Guard regulation) Competitive Advantages Geographic and product diversification, with high barriers to entry Broad range of differentiated shipping capabilities Specialized tows for higher-margin, hard-to-handle products (only 1 of 3 operators with ability to transport molten sulfur) Long-term customer relationships minimize volatility Single provider for marine and terminal services avoids low-price carrier status Expected utilization > 90% for 2010, despite refinery utilization 26 |
| Financial Overview |
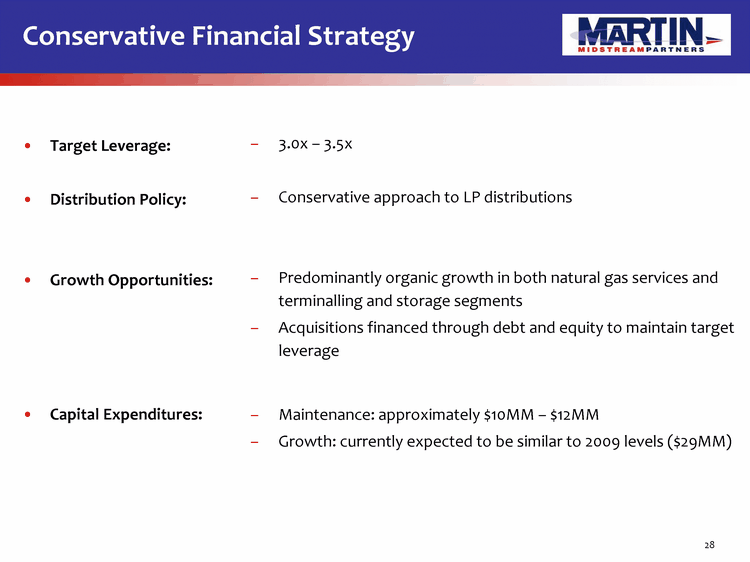
| 28 Conservative Financial Strategy Target Leverage: Distribution Policy: Growth Opportunities: Capital Expenditures: 3.0x - 3.5x Conservative approach to LP distributions Predominantly organic growth in both natural gas services and terminalling and storage segments Acquisitions financed through debt and equity to maintain target leverage Maintenance: approximately $10MM - $12MM Growth: currently expected to be similar to 2009 levels ($29MM) |
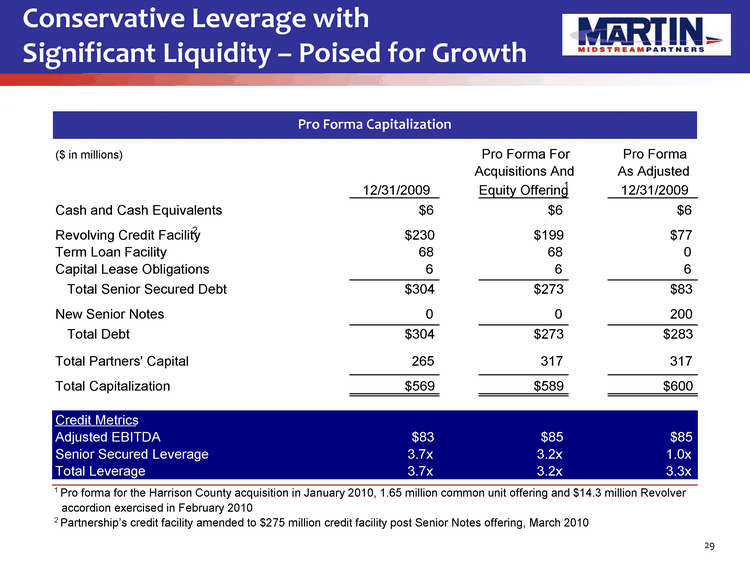
| 29 Pro Forma Capitalization Conservative Leverage with Significant Liquidity - Poised for Growth ($ in millions) Pro Forma For Pro Forma Acquisitions And As Adjusted 12/31/2009 Equity Offering 1 12/31/2009 Cash and Cash Equivalents $6 $6 $6 Revolving Credit Facility 2 $230 $199 $77 Term Loan Facility 68 68 0 Capital Lease Obligations 6 6 6 Total Senior Secured Debt $304 $273 $83 New Senior Notes 0 0 200 Total Debt $304 $273 $283 Total Partners' Capital 265 317 317 Total Capitalization $569 $589 $600 Credit Metrics Adjusted EBITDA $83 $85 $85 Senior Secured Leverage 3.7x 3.2x 1.0x Total Leverage 3.7x 3.2x 3.3x 1 Pro forma for the Harrison County acquisition in January 2010, 1.65 million common unit offering and $14.3 million Revolver accordion exercised in February 2010 2 Partnership's credit facility amended to $275 million credit facility post Senior Notes offering, March 2010 |
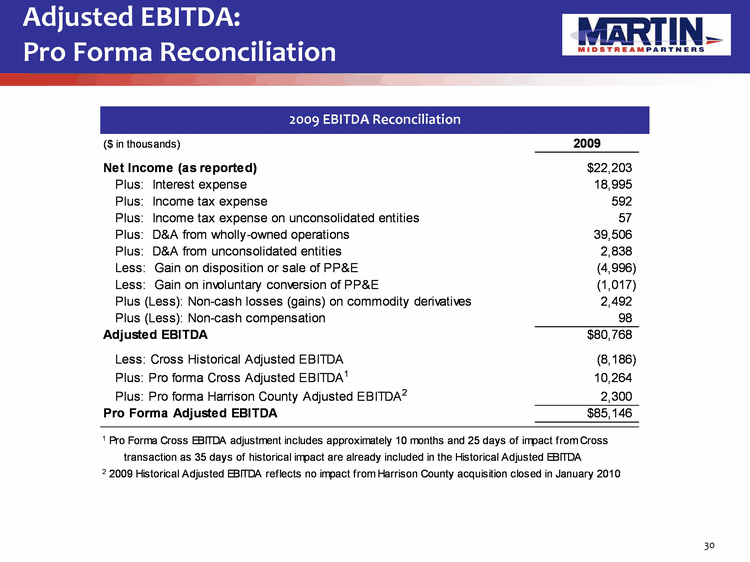
| 30 2009 EBITDA Reconciliation Adjusted EBITDA: Pro Forma Reconciliation |
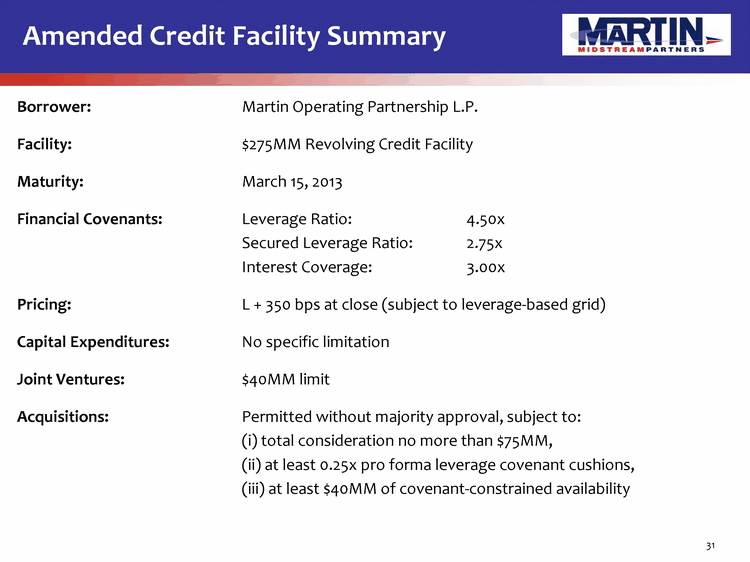
| 31 Amended Credit Facility Summary Borrower: Martin Operating Partnership L.P. Facility: $275MM Revolving Credit Facility Maturity: March 15, 2013 Financial Covenants: Leverage Ratio: 4.50x Secured Leverage Ratio: 2.75x Interest Coverage: 3.00x Pricing: L + 350 bps at close (subject to leverage-based grid) Capital Expenditures: No specific limitation Joint Ventures: $40MM limit Acquisitions: Permitted without majority approval, subject to: (i) total consideration no more than $75MM, (ii) at least 0.25x pro forma leverage covenant cushions, (iii) at least $40MM of covenant-constrained availability |
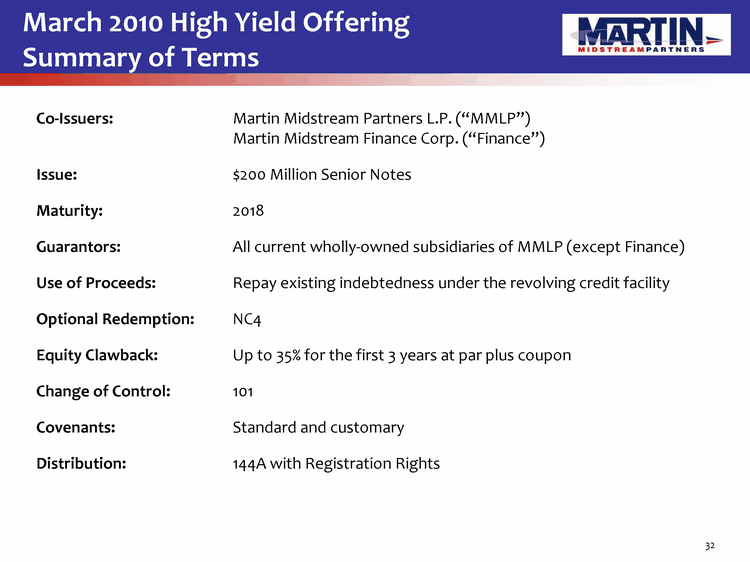
| 32 March 2010 High Yield Offering Summary of Terms Co-Issuers: Martin Midstream Partners L.P. ("MMLP") Martin Midstream Finance Corp. ("Finance") Issue: $200 Million Senior Notes Maturity: 2018 Guarantors: All current wholly-owned subsidiaries of MMLP (except Finance) Use of Proceeds: Repay existing indebtedness under the revolving credit facility Optional Redemption: NC4 Equity Clawback: Up to 35% for the first 3 years at par plus coupon Change of Control: 101 Covenants: Standard and customary Distribution: 144A with Registration Rights |
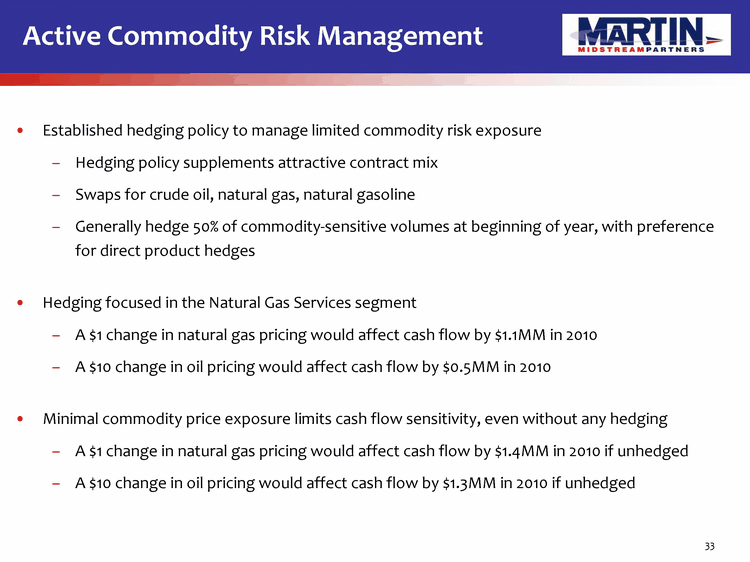
| Active Commodity Risk Management 33 Established hedging policy to manage limited commodity risk exposure Hedging policy supplements attractive contract mix Swaps for crude oil, natural gas, natural gasoline Generally hedge 50% of commodity-sensitive volumes at beginning of year, with preference for direct product hedges Hedging focused in the Natural Gas Services segment A $1 change in natural gas pricing would affect cash flow by $1.1MM in 2010 A $10 change in oil pricing would affect cash flow by $0.5MM in 2010 Minimal commodity price exposure limits cash flow sensitivity, even without any hedging A $1 change in natural gas pricing would affect cash flow by $1.4MM in 2010 if unhedged A $10 change in oil pricing would affect cash flow by $1.3MM in 2010 if unhedged |
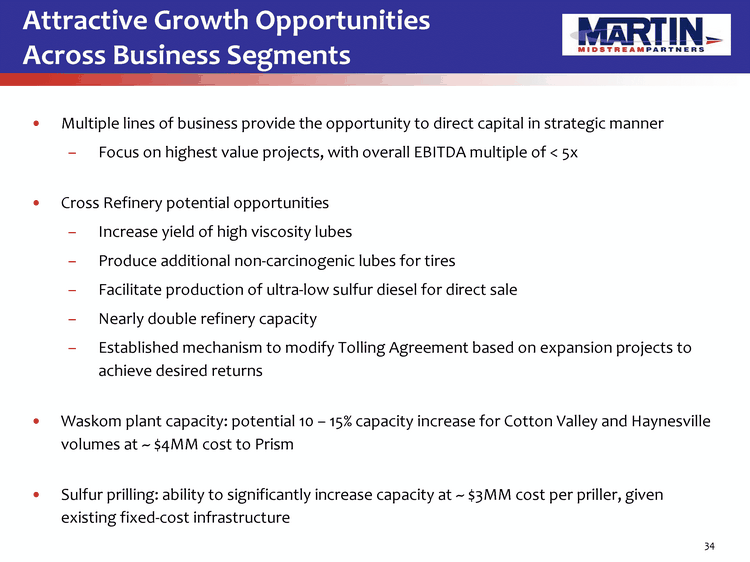
| 34 Multiple lines of business provide the opportunity to direct capital in strategic manner Focus on highest value projects, with overall EBITDA multiple of < 5x Cross Refinery potential opportunities Increase yield of high viscosity lubes Produce additional non-carcinogenic lubes for tires Facilitate production of ultra-low sulfur diesel for direct sale Nearly double refinery capacity Established mechanism to modify Tolling Agreement based on expansion projects to achieve desired returns Waskom plant capacity: potential 10 - 15% capacity increase for Cotton Valley and Haynesville volumes at ~ $4MM cost to Prism Sulfur prilling: ability to significantly increase capacity at ~ $3MM cost per priller, given existing fixed-cost infrastructure Attractive Growth Opportunities Across Business Segments |
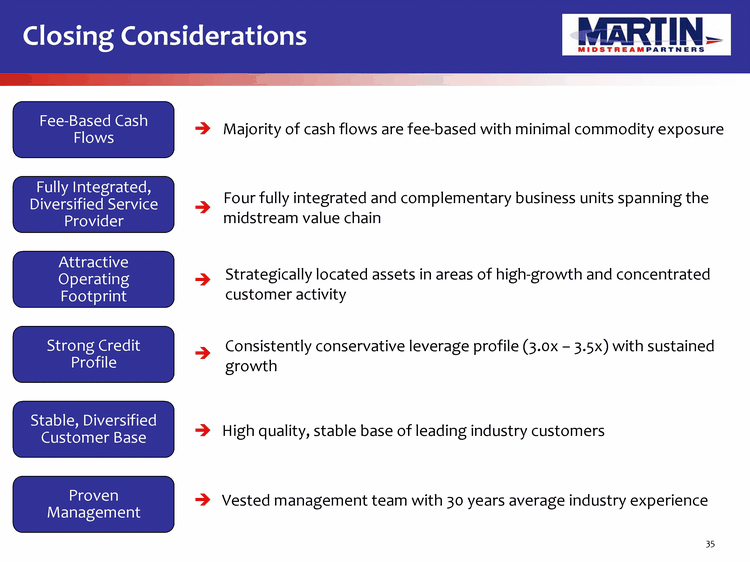
| 35 Investment Considerations Four fully integrated and complementary business units spanning the midstream value chain Proven Management Consistently conservative leverage profile (3.0x - 3.5x) with sustained growth Majority of cash flows are fee-based with minimal commodity exposure High quality, stable base of leading industry customers Vested management team with 30 years average industry experience Stable, Diversified Customer Base Fully Integrated, Diversified Service Provider Strong Credit Profile Fee-Based Cash Flows Strategically located assets in areas of high-growth and concentrated customer activity Attractive Operating Footprint Closing Considerations |
