Attached files
| file | filename |
|---|---|
| 8-K - CURRENT REPORT - CINCINNATI BELL INC | d8k.htm |
| EX-2.1 - EQUITY PURCHASE AGREEMENT DATED AS OF MAY 12, 2010 - CINCINNATI BELL INC | dex21.htm |
 1
Cincinnati Bell
Investor Presentation
May 13, 2010
Exhibit 99.1 |
 2
Safe Harbor
Certain
of
the
statements
and
predictions
contained
in
this
presentation
constitute
forward-looking
statements
within
the
meaning
of
the
Private
Securities
Litigation
Reform
Act.
Statements
that
are
not
historical
facts,
including
statements
about
the
beliefs,
expectations
and
future
plans
and
strategies
of
the
Company,
are
forward-looking
statements.
These
include
any
statements
regarding:
future
revenue,
operating
income,
profit
percentages,
income
tax
refunds,
realization
of
deferred
tax
assets,
earnings
per
share
or
other
results
of
operations;
the
continuation
of
historical
trends;
the
sufficiency
of
cash
balances
and
cash
generated
from
operating
and
financing
activities
for
future
liquidity
and
capital
resource
needs;
the
effect
of
legal
and
regulatory
developments;
and
the
economy
in
general
or
the
future
of
the
communications
services
industries.
Actual
results
may
differ
materially
from
those
expressed
or
implied
in
forward-looking
statements.
The
following
important
factors,
among
other
things
could
cause
or
contribute
to
actual
results
being
materially
different
from
those
described
or
implied
by
such
forward-looking
statements
including,
but
not
limited
to:
changing
market
conditions
and
growth
rates
within
the
telecommunications
industry
or
generally
within
the
overall
economy;
changes
in
competition
in
markets
in
which
the
Company
operates;
pressures
on
the
pricing
of
the
Company’s
products
and
services;
advances
in
telecommunications
technology;
the
ability
to
generate
sufficient
cash
flow
to
fund
the
Company’s
business
plan,
repay
debt
and
interest
obligations,
and
maintain
our
networks;
the
ability
to
refinance
the
Company’s
indebtedness
when
required
on
commercially
reasonable
terms;
changes
in
the
telecommunications
regulatory
environment;
changes
in
the
demand
for
the
services
and
products
of
the
Company;
the
demand
for
particular
products
and
services
within
the
overall
mix
of
products
sold,
as
the
Company’s
products
and
services
have
varying
profit
margins;
the
Company’s
ability
to
introduce
new
service and product offerings on a timely and cost effective basis; work stoppages
caused by labor disputes; restrictions imposed under various credit
facilities and debt instruments; the Company’s ability to attract and retain highly qualified employees; the Company’s ability to access capital
markets and the successful execution of restructuring initiatives; changes in the
funded status of the Company’s retiree pension and healthcare plans;
disruption in operations caused by a health pandemic, such as the H1N1 influenza virus; changes in the Company’s relationships with current
large customers, a small number of whom account for a significant portion of
Company revenue; and disruption in the Company’s back-office
information
technology
systems,
including
its
billing
system.
More
information
on
potential
risks
and
uncertainties
is
available
in
recent
filings
with
the
Securities
and
Exchange
Commission,
including
Cincinnati
Bell’s
Form
10-K
reports,
Form
10-Q
reports
and
Form
8-K
reports.
The
forward-looking
statements included in this presentation represent estimates as of May 13, 2010. It
is anticipated that subsequent events and developments will or may cause
estimates to change. |
 3
3
Non-GAAP Financial Measures
This presentation contains information about adjusted earnings before interest,
taxes, depreciation and amortization (Adjusted EBITDA). This is a
non-GAAP financial measure used by Cincinnati Bell management when
evaluating results of operations. Management believes this measure also
provides users of the financial statements with additional and useful
comparisons of current results of operations with past and future periods.
Non-GAAP financial measures should not be construed as being more
important than comparable GAAP measures. A detailed reconciliation of
Adjusted EBITDA (including the Company’s definition of these terms) to
comparable GAAP financial measures have been included in the tables appearing in
the Appendix to this presentation. |
 4
Overview of Transaction
Cincinnati Bell is acquiring CyrusOne
for $525M (11.8x 2010E EBITDA)
Cincinnati Bell has obtained fully committed financing of $970M to:
•
Fund purchase price with 100% cash consideration
•
Refinance existing term loan with later maturity
•
Refinance existing revolver with new 4-year revolver
CyrusOne
will remain headquartered and operated out of Texas
•
Management team has been retained to generate future growth at the
company
The transaction is expected to close by the end of Q2 subject to
customary closing conditions and regulatory approvals
|
 5
Data Center Investment Thesis
Attractive Industry Dynamics
•
Strong financial model
•
Recurring revenues with contracted
installed base, growing year to year
•
Success-based capital investment
•
Demand continues to outpace supply
•
Significant growth prospects
•
Increased internet usage
•
Increased regulation
•
Increased adoption of data center
outsourcing
Well Positioned Within Industry
•
Proven capabilities and track record
•
Existing in-market reputation with customers
•
“Early mover”
in an industry in its nascency
Natural Extension of Core Competencies
•
Expand geographically outside traditional
territory
•
Reduce
reliance
on
wireline
and
wireless
businesses in local markets
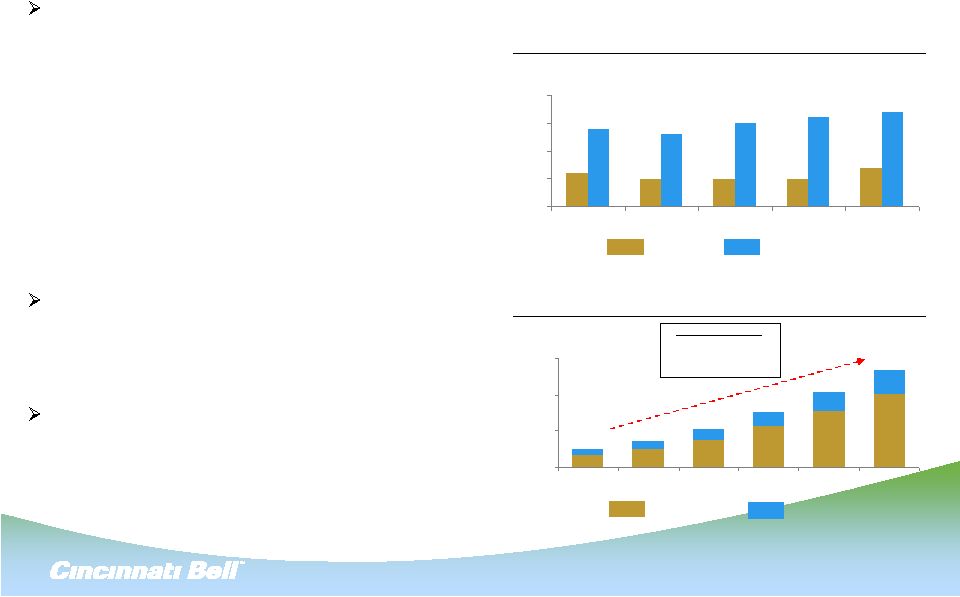
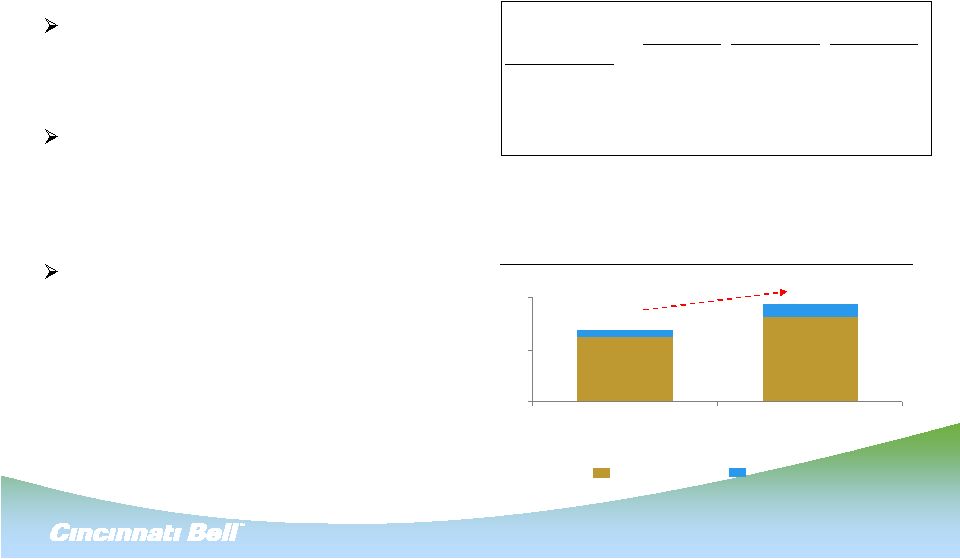
6%
5%
5%
5%
7%
14%
13%
15%
16%
17%
0
5
10
15
20
2008
2009
2010
2011
2012
Global Data Center Supply / Demand Growth Rates
Supply
Demand
(%)
Sources:
Tier 1 Research, Cisco VNI, 2009
Global IP Traffic Volume
PB per Month
40,571
31,211
22,768
15,465
10,488
7,037
12,833
10,022
7,722
5,805
4,258
3,103
0
20,000
40,000
60,000
2008
2009
2010
2011
2012
2013
10,140
14,746
21,270
30,490
41,233
53,404
‘08 –
‘13E CAGR:
Consumer
42%
Business
33%
Total
39%
Consumer
Business |
 6
IP Traffic
Enterprise Internet
Services Revenue
Ethernet Revenue
Hosting Revenue
Drivers
Consumption
Demand
increase
which
fuels
Demand -
Broad Demand Drivers
Sources:
Gartner –
G00167790 April 2009
Tier 1 –
DC Supply/Demand 2009 Midyear
Can accord/Adams –
Equity Research June 2009
Global DC Supply and Demand
Increasing DC Demand vs. Supply
Applications
Industries
Increasing demand increases results |
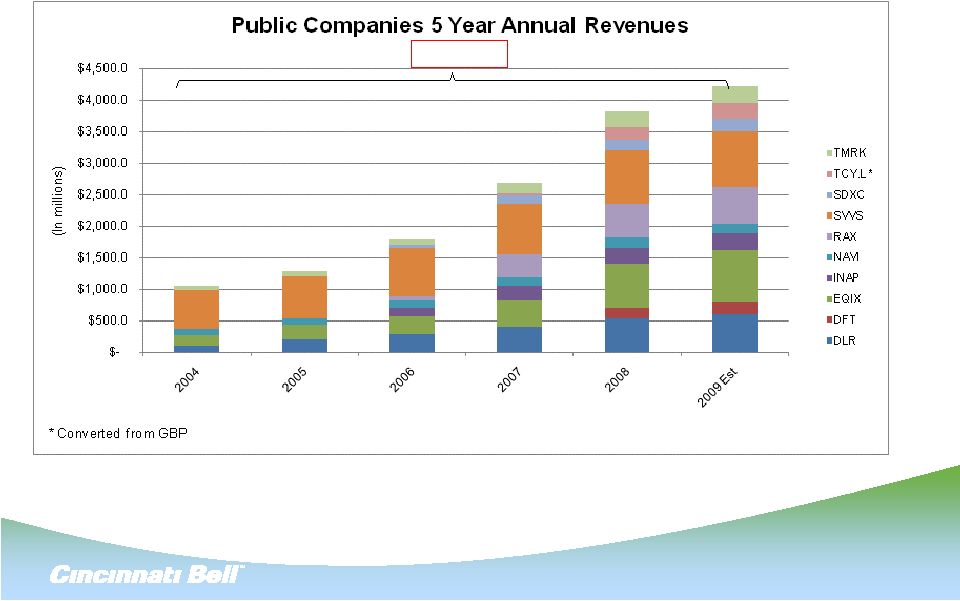 7
Competitors –
Competitors –
Total Revenue less than $5 Billion
Total Revenue less than $5 Billion
Source:
DH
Capital
–
Sept
2009
32% CAGR |
 Public Companies 5 Year Annual EBITDA
-$200.0
$0.0
$200.0
$400.0
$600.0
$800.0
$1,000.0
$1,200.0
$1,400.0
$1,600.0
TMRK
TCY.L *
SDXC
SVVS
RAX
NAVI
INAP
EQIX
DFT
DLR
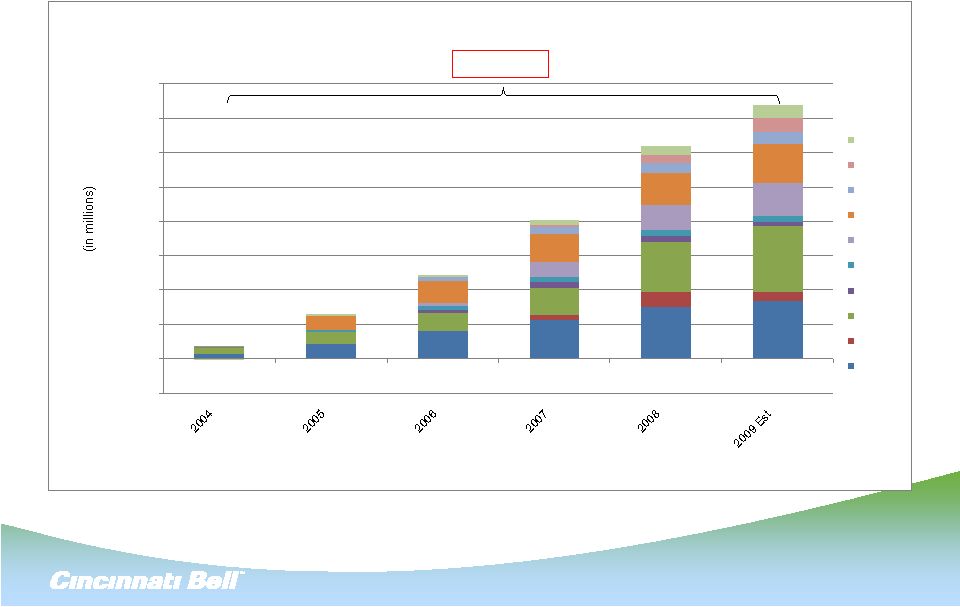
8
Competitors –
Competitors –
Total EBITDA less than $2 Billion
Total EBITDA less than $2 Billion
Source:
DH
Capital
–
Sept
2009
83% CAGR
*Converted from GBP |
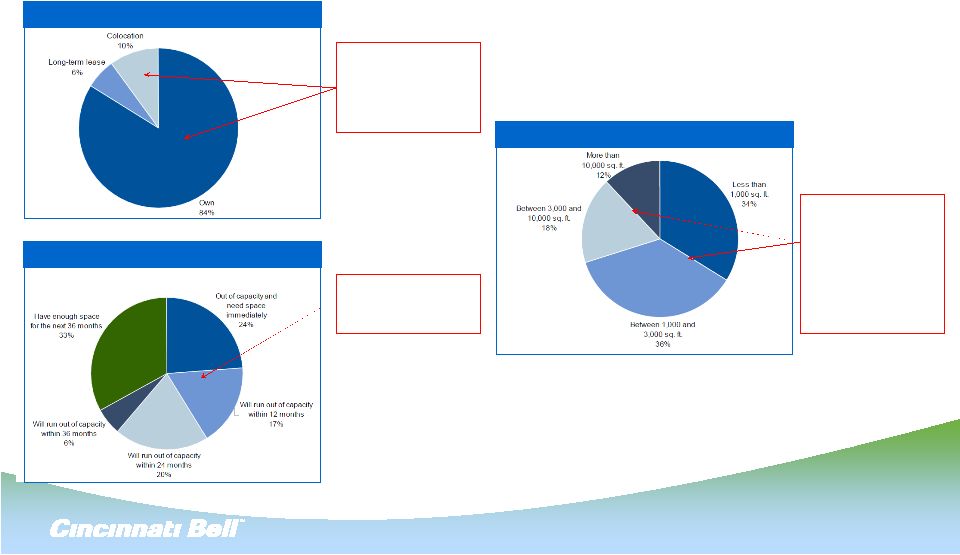 9
Demand –
Only 10% of market is outsourced and
most will run out of space in 3 years
Source: Gartner –
Jan 2009
How do you Obtain DC Space?
What is Your Expected Need?
How much Space will you Need?
Gartner DC Customer
Poll Shows Compelling Statistics
10% of companies
have outsource
relationship
84% currently do not
67% of companies
will need space
within 36 mo’s
70% of companies
will need at least 3K
Sq Ft of Space –
Mid
Range Companies
30% will need
greater than 3K –
Enterprise Range |
 10
Leading Data Center Operator With Premium Data Center Facilities
–
Largest
and
most
prominent
Texas-based
carrier-neutral
colocation
provider
to
large
enterprises
–
Dominant
position
in
Texas,
with
7
best-in-class
facilities
in
Houston,
Dallas
and
Austin
markets
–
High
availability
(2N
power infrastructure)
/
high
power
density
(200+
watts
per
sq.
ft.)
Loyal, Reputable Enterprise-Class Customer Base
–
98% of revenue base is recurring with monthly churn ~0.3%
–
Long-term “take-or-pay”
service agreements with average contract 3-5 years
–
Over 220 enterprise customers, including some of world’s largest
companies –
Particular
strength
and
market
share
in
oil
&
gas,
power,
energy
and
financial
verticals
Proven And Disciplined Business Model
–
Strong organic growth with ~50% of new sales coming from existing customers
–
Highly experienced and proven management team with over 100 years of relevant
experience Strong Financial Results
–
Last
Quarter
Annualized
(unaudited)
(1)
:
Revenue
$73M;
Adjusted
EBITDA
$42M
(Adjusted
EBITDA
margin 57%)
–
2009 Revenue of $58M and Adjusted EBITDA of $32M
–
Annual revenue growth rate during past 4 years of approximately 60%
Overview of CyrusOne
(1) For the quarter ended March 31, 2010 |
 11
Overview of Key Facilities
7 geographically diverse premium data centers throughout Texas (Houston, Dallas
& Austin) Tier III+ equivalent, SAS 70 Type II compliant data
centers 2N redundant power and carrier-neutral network connections
Engineered for dense power configurations (+200 watts/sq. ft)
Currently, 16.8 megawatts of critical load power capacity is in place and
deployable Hurricane
resistant
with
fire
detection,
protection,
suppression
and
alarms
24 x 365 NOCC and facilities staff provide for high security externally and
internally Modular
builds
–
most
expansions
are
less
than
three
years
old
Current utilization rate of ~76% on space and ~60% on power
Data Center Space (Sq. ft.) as of February 28, 2010
Houston
Dallas
Austin
Total
%
Sold Space
79,000
42,000
3,000
124,000
55%
Built-Out Space (Ready for Sale)
16,000
14,000
9,000
39,000
17%
Space Under Construction
11,000
–
–
11,000
5%
Available for Future Space
(1)
22,000
23,000
6,000
51,000
23%
Total Data Center Space
128,000
79,000
18,000
225,000
100%
Note:
(1) Excludes right of first refusal space |
 12
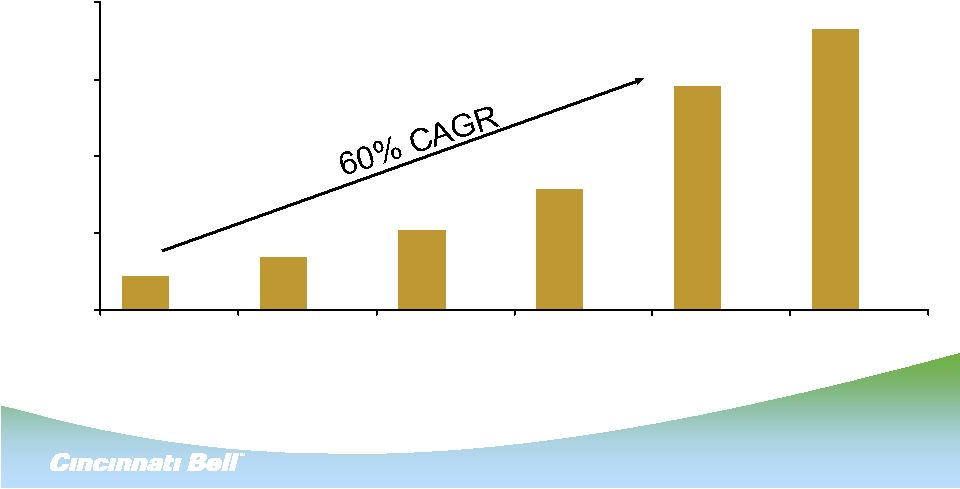
Strong Revenue Growth
$9
$14
$21
$31
$58
$73
$0
$20
$40
$60
$80
2005A
2006A
2007A
2008A
2009A
LQA 3/31/10
($‘s in millions) |
 13
13
Ample Liquidity and No Near Term Maturities
No significant maturities until 2015
Pro forma LTM leverage increases to approx 5.1x
Note:
(1) Excludes undrawn
revolver and capital leases and other debt
Pro Forma Maturity Profile
(1)
$248
$248
$625
$500
$67
$51
$151
$760
0
500
1,000
1,500
'10
'11
'12
'13
'14
'15
'16
'17
'18Thereafter
($’s in millions)
Debt Maturity
Credit Facility
Receivables Purchase Facility |
 14
CyrusOne
Management
Seasoned management team with over 100 years of relevant experience with a proven
track record of growing revenue and EBITDA
Name
Position
Years With CyrusOne
Relevant Experience
David Ferdman
President & CEO
9
17
Blake McLane
SVP, Strategic Development
5
15
Paul Marvin
VP, CFO
3
23
Kenneth Wolverton
VP, Data Center Operations
5
20
Dan Vasquez
VP, Technology
9
30
Total
31
105
Average
6
21 |
 15
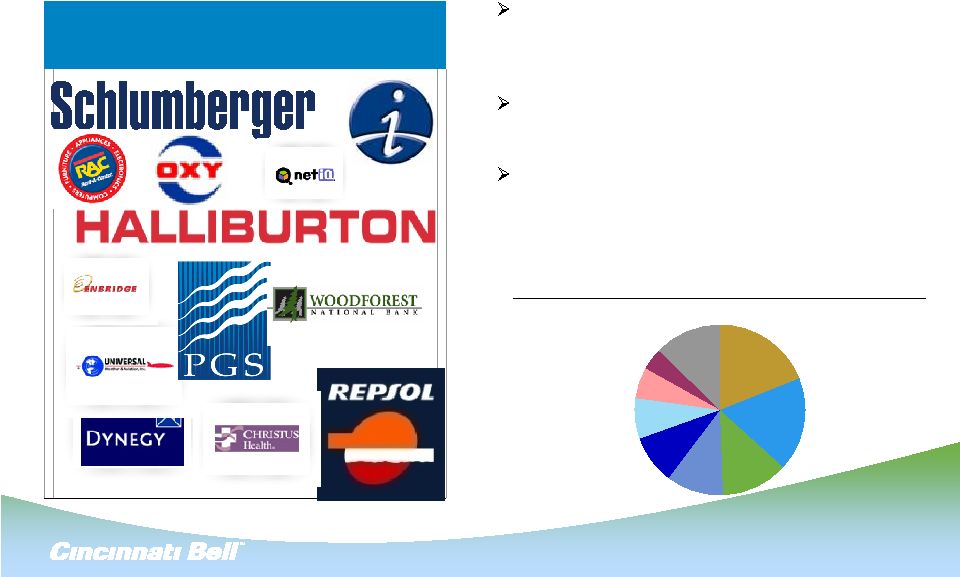
Customer Base and Contract Terms
Take-or-pay contracts with 3-5 year average
contract life and renewal periods
–
High renewal rates with monthly churn of
~0.3%
Blue chip customer base
–
220+ customers with 5 of the top 10 global
companies
High average monthly recurring revenues per
customer of approx $25K (as of 3/31/10)
% Total Recurring Revenue by Industry Vertical
Representative Customers
18%
11%
9%
4%
12%
6%
8%
13%
19%
Integrated Energy
Energy Utilities
Other
Mining
Technology
Upstream Oil & Gas
Oilfield Services
Financial
Healthcare |
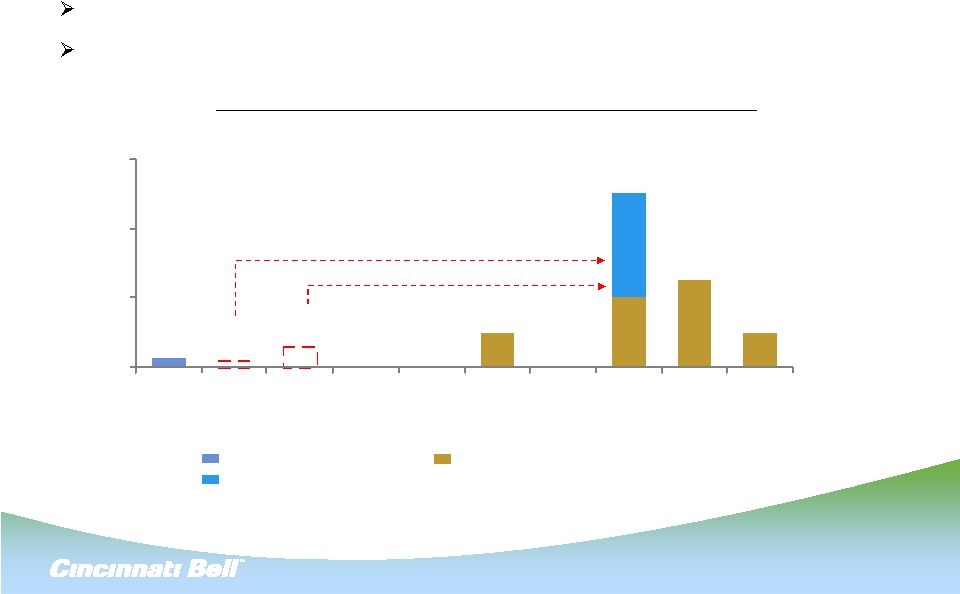
 16
Enhancing the Technology Solutions Business
Greater exposure to attractive industry
with significant growth prospects
Increasing geographical footprint beyond
traditional territory
–
Houston, Dallas and Austin
Diversify revenue stream beyond
wireline
and wireless businesses
1Q10 Square Footage
43
82
403
527
0
325
650
Standalone
Pro Forma
(000s)
Utilized
Available
446
609
90%
87%
Utilization %
$, in millions (unaudited)
Pro Forma
Tech Sol
CyrusOne
Combined
LQA 3/31/2010
Revenue
286
$
73
$
360
$
Adj EBITDA
52
42
94
Margin %
18%
57%
26% |
 17
Sizable Footprint with Significant Upside Opportunities
Markets Served
Data
Facilities
Center
Top 50
# Firms > 500
Fortune 1000
Entity
Market
(#)
Capacity
MSA Rank
(1)
employees
(1)
Company HQ
(2)
CBTS
Cincinnati, OH
6
426,000
24
1,831
15
CyrusOne
Houston, TX
3
95,000
6
2,795
55
CyrusOne
Dallas, TX
2
56,000
4
3,386
45
CyrusOne
Austin, TX
2
12,000
35
1,644
3
CBTS
Chicago, IL
1
7,000
3
3,794
58
CBTS
Other markets
3
13,000
n/a
-
-
17
609,000
13,450
(1)
Population and rankings as of 2009; firms as of 2006
(2)
Fortune, April 2009
Majority of data center capacity located in the Top 25 Metropolitan
Statistical Areas
Approximately 13,000 firms with more than 500 employees
|
 18
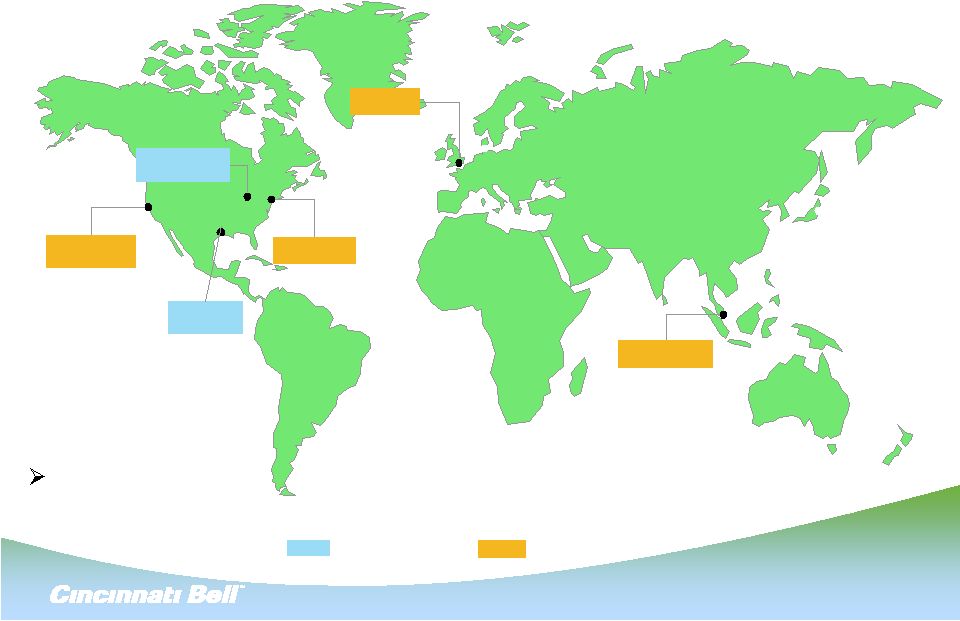
Cincinnati
Texas
Singapore
London
New York
Bay Area
Building a Strong Platform to Launch Global Growth
Significant Fortune 500 customers in Cincinnati and Texas markets provide
platform for future customer driven global expansion
Existing Markets
Future Markets |
 19
Strategic Summary
Significant demand drivers
CyrusOne
is proven leader in the industry
Significant opportunity in combined enterprise customer base
Achieving scale economies and fueling growth by access to internally
generated capital
Expand relationships with several other Fortune 500 customers
Pro Forma Data Center Customer Base |
 20
Question and Answers
*
*
*
* |
 21
Appendix –
Non-GAAP Reconciliations
*
*
*
* |
 22
Non-GAAP Financial Measure
Use of Non-GAAP Financial Measures
This presentation contains information about adjusted earnings before
interest, taxes, depreciation and amortization (Adjusted EBITDA). This is a
non-GAAP financial measure used by Cincinnati Bell management when
evaluating results of operations. Management believes this measure
also provides users of the financial statements with additional and useful
comparisons of current results of operations with past and future
periods. A non-GAAP financial measure should not be construed as
being more important
than
a
comparable
GAAP
measure.
The
following
slide
reconciles
this non-GAAP measure to a comparable GAAP measure.
Adjusted EBITDA
provides a useful measure of operational performance.
The company defines Adjusted EBITDA as GAAP operating income plus
depreciation, amortization, restructuring charges, asset impairments, and
other special items. Adjusted EBITDA should not be considered as an
alternative
to
comparable
GAAP
measures
of
profitability
and
may
not
be
comparable with the measure as defined by other companies.
|
 23
Reconciliation of Operating Income to Adjusted EBITDA
CBTS
CyrusOne
Operating Income (GAAP) for the first quarter 2010
7
$
7
$
Add:
Depreciation and amortization
6
4
Adjusted EBITDA (Non-GAAP) for the first quarter 2010
13
$
11
$
Annualized Adjusted EBITDA based on the first quarter 2010
52
$
42
$
Twelve
months
ended
Dec., 31
2009
CyrusOne
Operating Income (GAAP) for the year ended Dec. 31, 2009
23
$
Add:
Depreciation and amortization
9
Adjusted EBITDA (Non-GAAP) for the year ended Dec. 31, 2009
32
$
Three months ended
March 31, 2010
($ in millions, unaudited) |