Attached files
| file | filename |
|---|---|
| 8-K - FORM 8-K - SENSUS USA INC | d8k.htm |
 Deutsche Bank
2010 Alternative Energy, Utilities & Power Conference
May 12, 2010
1
Exhibit 99.1 |
 Peter
Mainz-
CEO and President
Jeff Kyle-
CFO
Jim Hilty-
VP, Business Development
2 |
 Safe
Harbor Statement The statements made during this presentation, other than
historical facts, are made in reliance on the safe- harbor provisions of
the Private Securities Litigation Reform Act of 1995. These statements involve risks
and uncertainties and are subject to change at any time. These statements reflect
the Company’s current expectations regarding its financial position,
revenues, cash flow and other operating results, business strategy,
financing plans, forecasted trends related to the markets in which the Company operates, legal
proceedings and similar matters. We cannot assure you that the expectations
expressed or implied in these forward-looking statements will turn out
to be accurate. Our actual results could be materially different from our
operations because of various risks. These risks include our susceptibility
to macroeconomic downturns in the United States and abroad, conditions in
the residential, commercial and industrial construction markets and in the
automotive industry, our dependence on new product development and intellectual
property, and our dependence on independent distributors and third-party
contract manufacturers, automotive vehicle production levels and schedules,
our substantial financial leverage, debt service and other cash
requirements, liquidity constraints and risks related to future growth and
expansion. Other important risk factors that could cause actual events or
results to differ from those contained or implied in
the forward-looking statements include, without limitation, our ability to
integrate acquired companies, general economic and business conditions,
competition, adverse changes in the regulatory or legislative environment in
which we operate, customer cancellations and other factors beyond the Company’s control.
We encourage you to review our annual report on Form 10-K, which discusses in
greater detail our results of operations for the most recently completed
fiscal year and consider the risks that relate to any of our
forward-looking statements.
3 |
   Experience
Over a century of experience in providing advanced technologies to utility industry
Technology
Advanced technology and communications for data collection, control and metering
Global
Global footprint on five continents with operations and activities in many countries
Proven
4
A leader in innovative technology solutions that enable intelligent
use and conservation of critical energy and water resources.
Proven technology with 7 Million SmartPoint™ devices deployed at over 225
utilities |
 About
Sensus •
Record $866 million of Net Sales
in FY2010; 9% 5 yr. CAGR
•
Record $128 million Adjusted
EBITDA*; 14.8% margin*
•
A market leader in the
•
NA Smart Grid market
•
Global Water market
•
NA Gas market
•
Nearly 4,000 employees
worldwide
•
Headquarters in Raleigh, N.C.
* See Appendix: Non-GAAP Measures
5 |
 Market Environment
6 |
 Today’s Reality
•
Energy and water -
under pressure
•
Utilities and consumers -
under pressure
•
Politicians and regulators -
under pressure
•
Aging infrastructure -
upgrade
•
Demand growth certain -
local and global
•
Electric cars, renewable/distributed generation
•
Need for control, conservation, cost efficiency
7 |
 •
Technology is here, affordable to deliver
control, conservation, cost efficiency
•
Government seeding investments:
–
$787 billion ARRA stimulus package in US
–
Not limited to the US
•
Risk management is key
The Opportunities
8 |
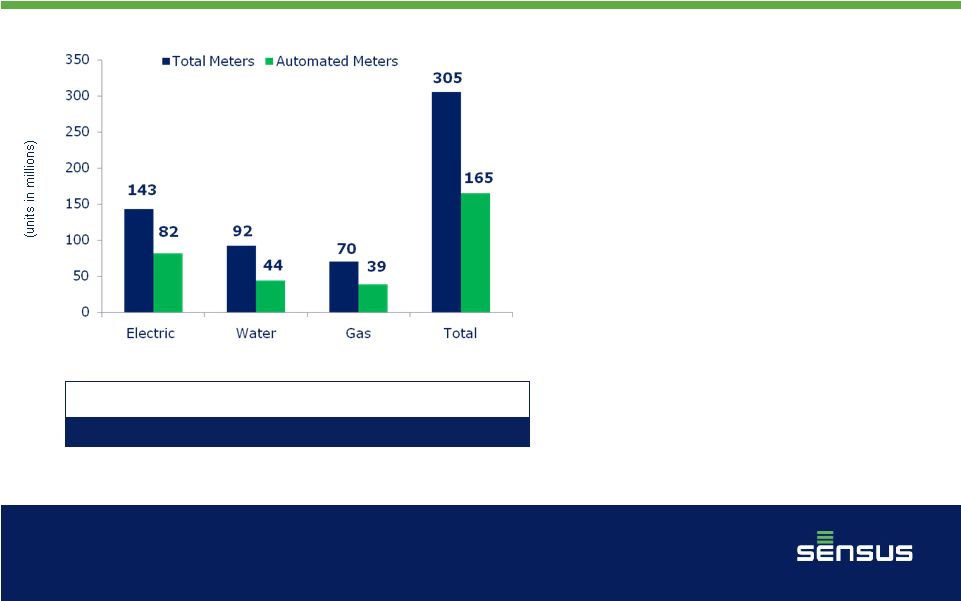 Technology Transition Is Underway
•
Transition to AMI & Smart
Meters is underway
•
165 million (54%) of the
estimated 305 million
installed meters in NA have
been converted to some type
of automated metering
•
Early AMR installations must
be replaced to make them
AMI/Smart Grid compatible
•
2.7 billion global meter
installed base
Source:
“The Scott AMR Report: AMR Deployments in North America, 4th Quarter
2009”, IMS Research “The World Market for Utility Meters
– 2009 Edition”
and Management estimates.
Global Meter Installed Base (units in millions)
1,277
976
442
2,695
9 |
 Our
communication platform is dedicated, reliable, secure –
Minimum infrastructure; FCC licensed protected radio spectrum
–
Standards compliant; Upgradeable in place, over-the-air
Our SmartPoint™
devices are field proven…at scale
–
7 million installed & communicating over the last 3 years
–
2 million for Southern Company
–
225 individual projects electric, water, gas & combination utilities
Our solid track record
–
Long history and experience with global utilities
–
Leading NA smart grid market position
–
Leading global water market position
–
Solid and proven business model
–
Global footprint
–
Commitment to technology innovation and R&D investment
Sensus
Advantages
10 |
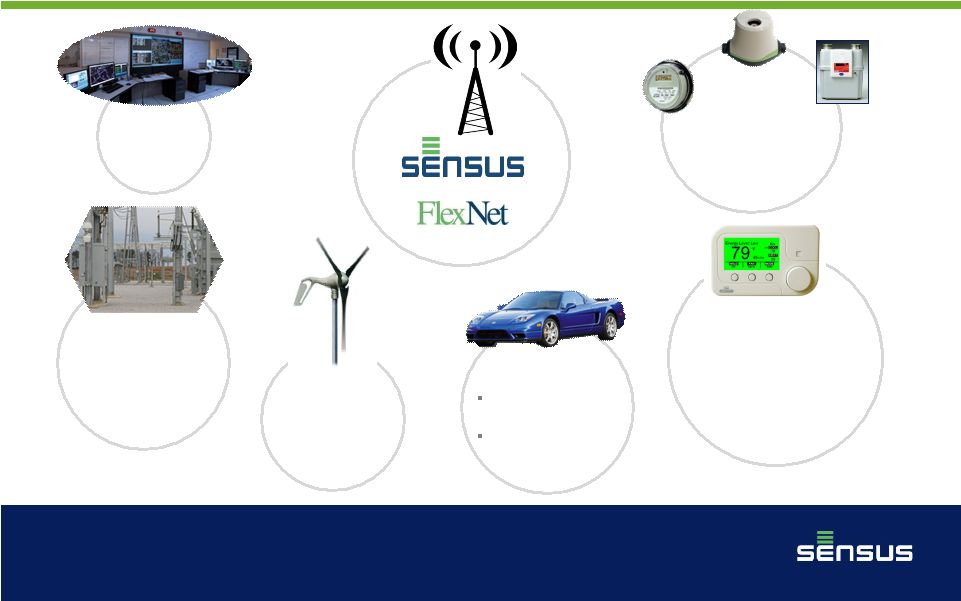 Electric Vehicles
Netmetering &
Distributed Storage
Charging Station
Distributed
Generation
(Wind/Solar/Other)
Meters
Electricity / Water / Gas
Demand Response
Programs
Programmable Thermostats
Water Heaters & Switches
Distribution
Automation
(Substation Equipment)
Utility
Backend
Sensus Smart Grid Solution
11 |
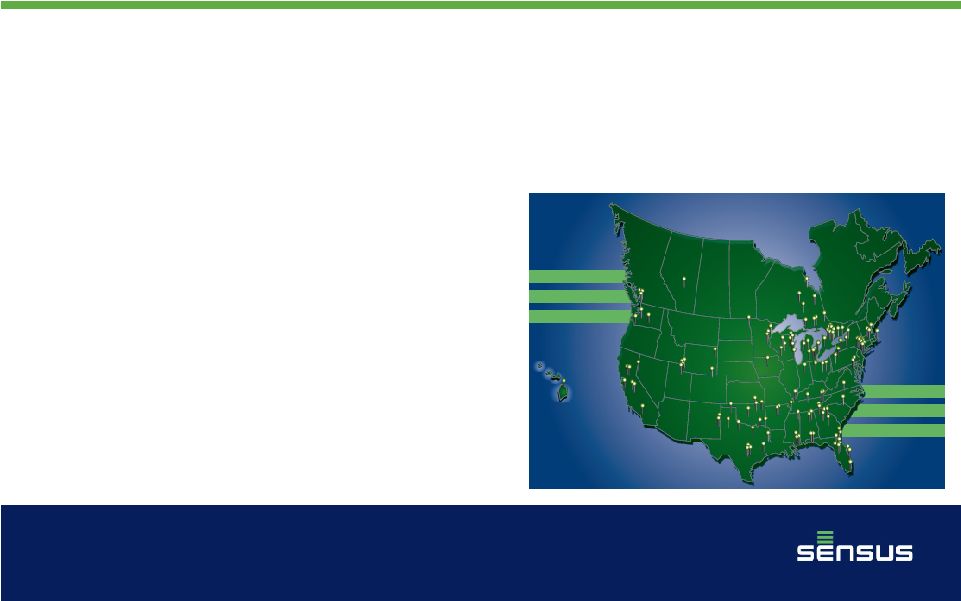 Building the Smart Grid…Today
•
225 Smart Grid projects completed
or in-process
•
37 States
•
2 Canadian Provinces
•
2 European countries
•
7 million SmartPoint™
devices
installed
•
11 million SmartPoint™
devices
when all current projects complete
12 |
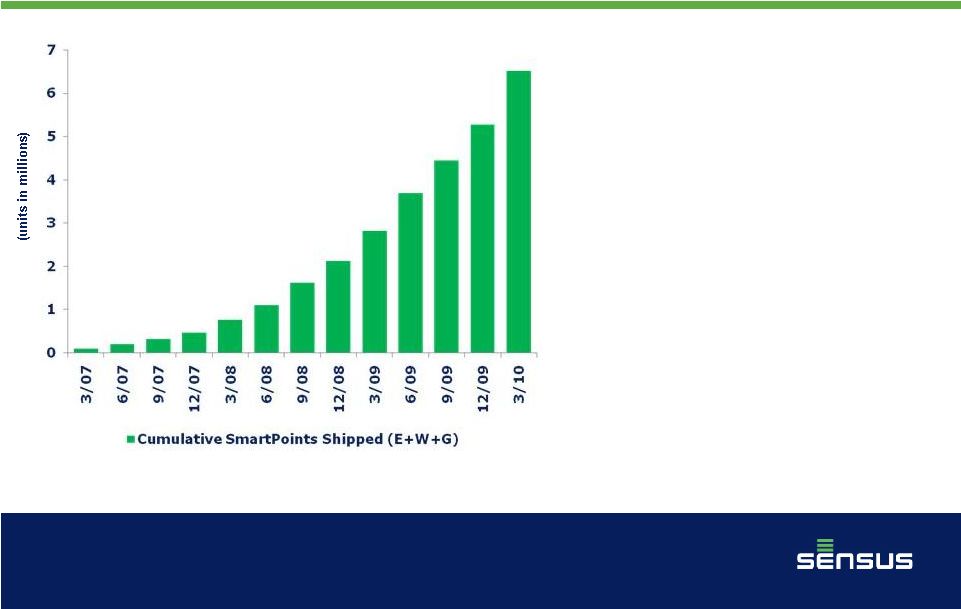 Sensus
SmartPoint™Deployments
•
Dramatic growth in electric
Sensus
SmartPoint
TM
device
deployments
•
Electric growth driven by 2-way
Smart Grid deployments, not
basic AMR
•
Electric AMI market share
increased from 3% to 23% in
two years
•
Water market transitioning from
basic AMR to 2-way smart
metering
Source:
The
Scott
Report:
AMR
Deployments
in
North
America
and
Sensus
13 |
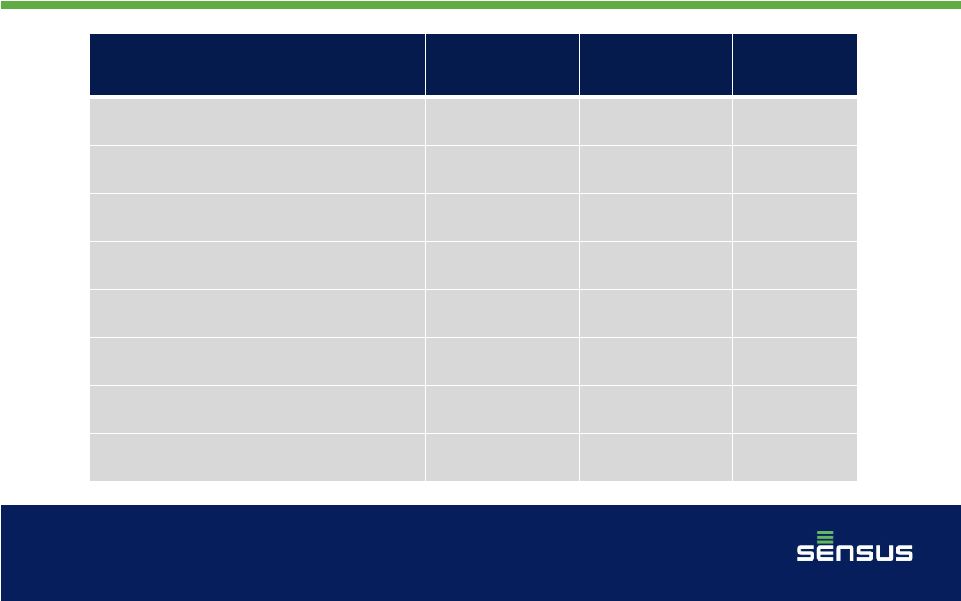
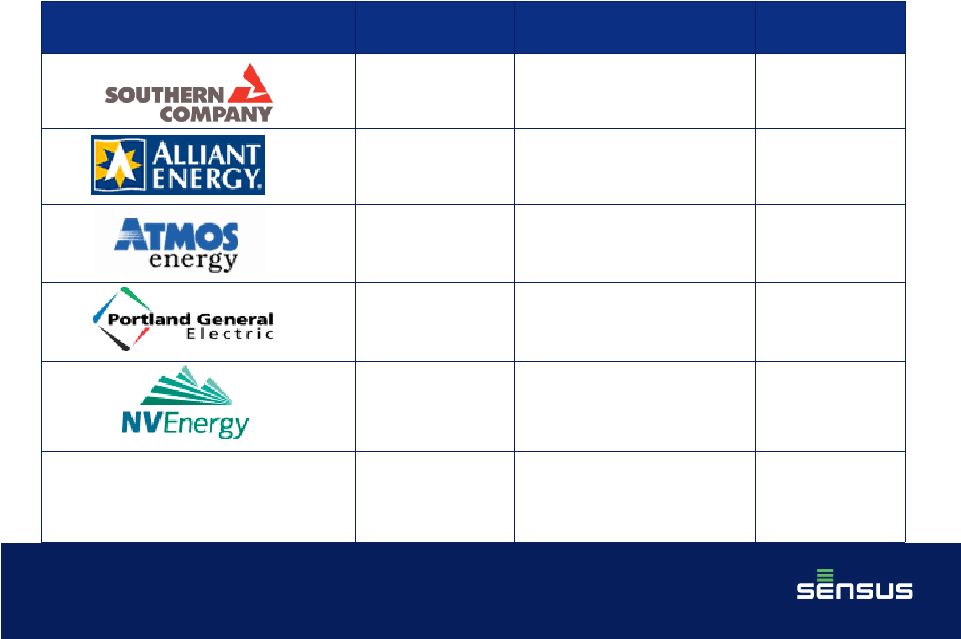 Major
Utilities Selecting Sensus Utilities
Customers
Served
AMI Endpoints
Duration
4.3 million
4.3 million Electric
15 years
1.4 million
1.0 million Electric
0.4 million Gas
15 years
3.0 million
0.3 million Gas
20 years
0.9 million
0.9 million Electric
12 years
2.4 million
1.3 million Electric
0.2 million Gas
20 years
London Hydro
Smart Grid Consortium
Ontario,
Canada
(representing 35 utilities)
1.8 million
1.2 million Electric
15 years
14 |
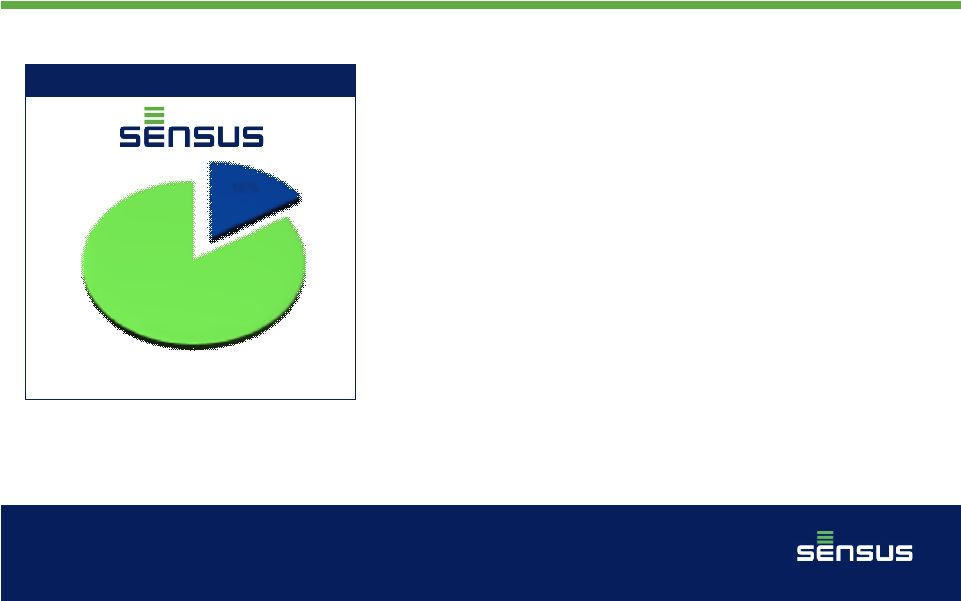 A
Global Water Metering Leader Global Market
Market Size: $2.3 billion
•
Scarcity of water and conservation
initiatives are global factors
•
Key markets of North America (22%
share) and Europe (25% share) are driven
by water meter replacement programs
•
Technology is a driver both for residential
and commercial & industrial applications
–
2-Way water communications network
–
iPERL™
water management device
•
Global market coverage
Source:
IMS Research Report 2008; management estimates.
Note:
Market shares based on revenue.
15
16% |
 Financial Overview
16 |
 Fiscal Year End March 31
(US$ in millions)
FY 2009
FY 2010
Percent
Change
Net Sales
$792
$866
+ 9.3%
Gross Profit
$199
$247
+ 24.1%
Gross Profit %
25.1%
28.5%
R&D Investment / Net Sales %
3.9%
4.8%
Adjusted EBITDA *
$102
$128
+ 25.5%
Adjusted EBITDA % *
12.9%
14.8%
Backlog
$124
$134
+ 8.1%
Average Sales Cycle (days)**
26
15
+ 42.3%
Financial Highlights
* See Appendix: Non-GAAP Measures
** Sales Cycle = Days Sales + Days Inventory -
Days Payable
17 |
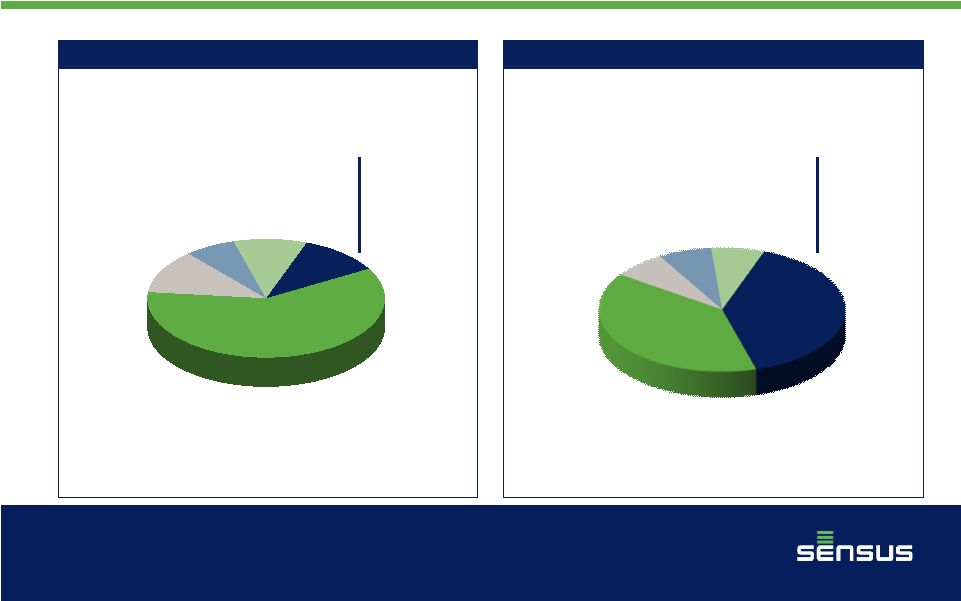 Water Metering
39%
Gas Metering
7%
Precision
Die Casting
7%
Clamps &
Couplings
7%
Clamps & Couplings
10%
Precision
Die Casting
7%
Gas Metering
12%
Water Metering
60%
Evolution of Net Sales
Fiscal Year 2004 Net Sales
Fiscal Year 2010 Net Sales
Conservation Solutions
11%
$59M
Conservation Solutions
40%
$348M up 490%
Net Sales: $529M
Net Sales: $866M
(Fiscal year ended March 31)
18 |
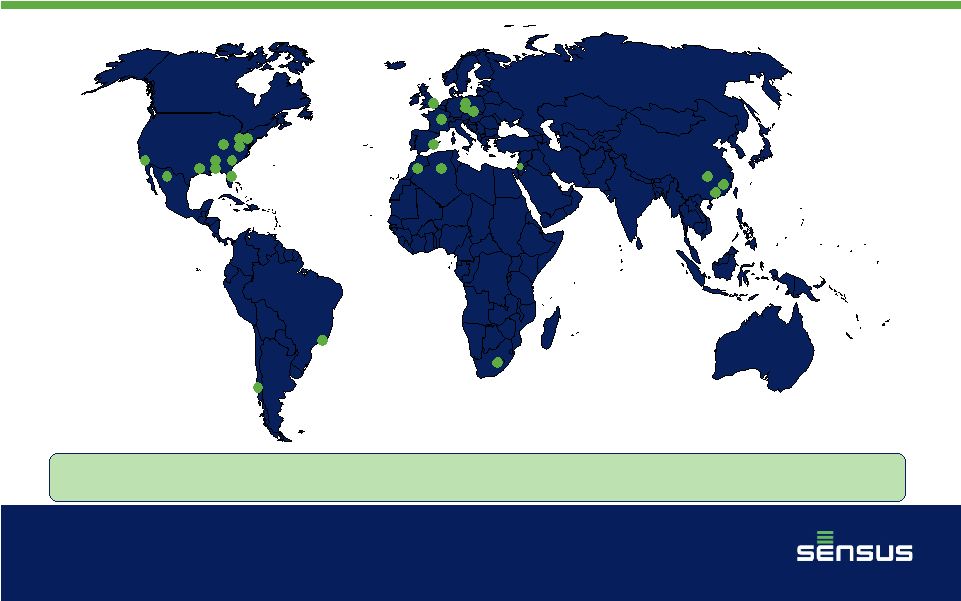 Global
Reach Over 40 facilities on five continents and nearly 4,000 people
Text
$611M
$15M
$28M
$169M
$43M
19
Net Sales by Geography |
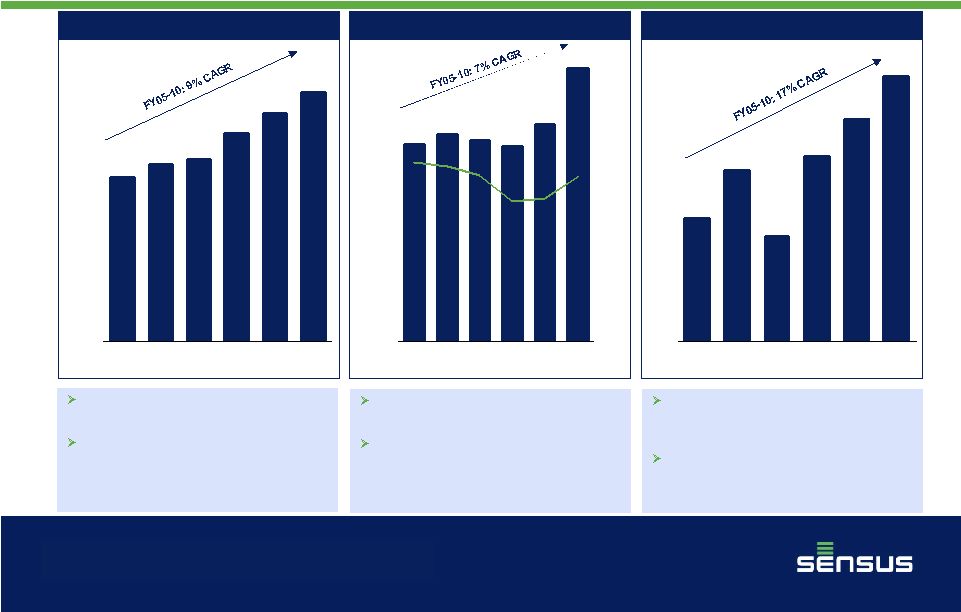 $92
$97
$94
$91
$102
$128
16%
16%
15%
13%
13%
15%
0%
5%
10%
15%
20%
25%
$0
$20
$40
$60
$80
$100
$120
FY
2005
FY
2006
FY
2007
FY
2008
FY
2009
FY
2010
$34
$47
$29
$51
$61
$73
$0
$10
$20
$30
$40
$50
$60
$70
$80
FY
2005
FY
2006
FY
2007
FY
2008
FY
2009
FY
2010
$572
$614
$631
$722
$792
$866
$0
$100
$200
$300
$400
$500
$600
$700
$800
$900
$1,000
FY
2005
FY
2006
FY
2007
FY
2008
FY
2009
FY
2010
Strong Financial Track Record
Net Sales
(1)
Net cash provided by operating activities as reported in the
Company SEC filings.
Adjusted EBITDA margins improving as
leverage and scale drive operating results.
R&D investment rate increase approximately
25% from 2008 levels to 4.8% of net sales as
technology is introduced across the Utility
Infrastructure Systems product portfolios.
2008
Sensus
launches
FlexNet™
systems
and enters AMI Electric markets.
2009 revenue traction attained as market
share expands rapidly to 23% with 7 million
SmartPoint™
devices shipped within just over
2 years.
Fiscal Year Ended March 31 (US$ in millions)
Adjusted EBITDA *
Operating Cash Flow
(1)
Continued drive on balance sheet efficiency
through working capital initiatives. Days sales
cycle improved over 100% since 2008.
Maintained investments in infrastructure and
software to support market strategies and
commitments.
* See Appendix: Non-GAAP Measures
20 |
 Sensus
is “Smart Grid-Ready”
Today
•
Financially strong provider of time-tested technology and
communications to global water, gas and electric utilities
•
No matter what the alternative energy source is, it must be measured,
managed and controlled
•
Increasing water scarcity will drive efficiency and conservation
•
“Future-proof,”
flexible and proven AMI/Smart Grid solutions
•
Cover all types of utilities, population densities and terrain
•
7 million Sensus
SmartPoint™
devices installed to date
•
Our Goal: Sensus
in every home and business
21 |
 What
Does Success Look Like? •
Proven technology solutions and
ongoing innovation
•
Trusted partner whose system
flexibility and ongoing innovations
reduce risk
•
Cost efficiency
•
Execution
22 |
 Success Looks Like Sensus!
23 |
 Thank You
For more information visit: www.sensus.com
24 |
 Appendices
25 |
 Appendix: Financial Position
Fiscal Year End March 31
(US$ in millions )
FY 2008
FY 2009
FY 2010
FY % of
Capitalization
Cash
$ 38
$ 38
$ 59
Short-term loans
$ 6
$ 5
$ 5
1%
Term loans
$174
$159
$186
26%
Sr. Subordinated Notes
$275
$275
$275
38%
Total Debt
$455
$439
$466
65%
Paid-in Capital
$243
$245
$252
35%
Total Book Capitalization
$698
$684
$718
100%
Adjusted
EBITDA
*
(1)
$ 91
$102
$128
Adjusted EBITDA * / Interest
expense, net
(1)
2.4x
3.1x
2.9x
Net Debt / Adjusted EBITDA*
4.5x
3.7x
3.4x
* See Appendix: Non-GAAP Measures
26
(1)
As defined in the credit facility agreements. |
 Appendix: Non-GAAP Measures
•
To enhance the comparability and usefulness of its financial
information, the Company provides certain non-GAAP measures to
describe more fully the results of its underlying business.
Specifically, the Company utilizes the measure of Adjusted EBITDA,
which is defined as follows:
–
Adjusted
EBITDA
is
defined
as
consolidated
earnings
before
interest expense, depreciation and amortization, and income
taxes plus (a) restructuring costs, (b) management fees and (c)
acquisition-related costs, and adjusted for other nonrecurring
items.
•
Refer to the Company’s press release on Form 8-K dated May 7,
2010 for further discussion of non-GAAP measures.
27 |
 Appendix: Non-GAAP Measures
A reconciliation of Adjusted EBITDA to consolidated net loss follows:
FY
FY
FY
FY
FY
FY
Ended
Ended
Ended
Ended
Ended
Ended
($ in millions)
3/31/2010
3/31/2009
3/31/2008
3/31/2007
3/31/2006
3/31/2005
Net sales
$ 865.6 $
791.9 $ 722.0
$ 631.4
$ 613.9
$ 569.8
Adjusted Gross Profit
$ 247.2 $
199.4 $ 186.9
$ 177.7
$ 186.4
$ 170.8
Consolidated net loss
$ (5.0)
$ (16.0)
$ (6.4)
$ (8.4)
$ (3.2)
$ (5.0)
Depreciation and amortization
45.5
46.6
47.7
48.1
42.4
39.8
Interest expense, net
43.6
39.9
41.8
42.4
39.3
36.7
Income tax provision (benefit)
7.7
0.7
(1.4)
0.5
8.2
8.3
Restructuring costs
25.9
9.9
7.0
8.5
7.2
8.1
Management fees
3.3
3.1
2.6
2.6
2.3
2.1
Acquisition-related costs
1.2
-
-
0.1
-
-
Loss on debt extinguishment
5.9
-
-
-
-
-
Other non-recurring items
-
3.3
-
-
1.1
0.9
Goodwill impairment
-
14.4
-
-
-
-
(Gain) loss from discontinued operations
-
-
-
(0.1)
-
0.8
Adjusted EBITDA (excluding discontinued operations)
$ 128.1 $
101.9 $ 91.3
$ 93.7
$ 97.3
$ 91.7
28 |