Attached files
| file | filename |
|---|---|
| 8-K - 8-K - Rockwood Holdings, Inc. | a10-9955_18k.htm |
Exhibit 99.1
|
|
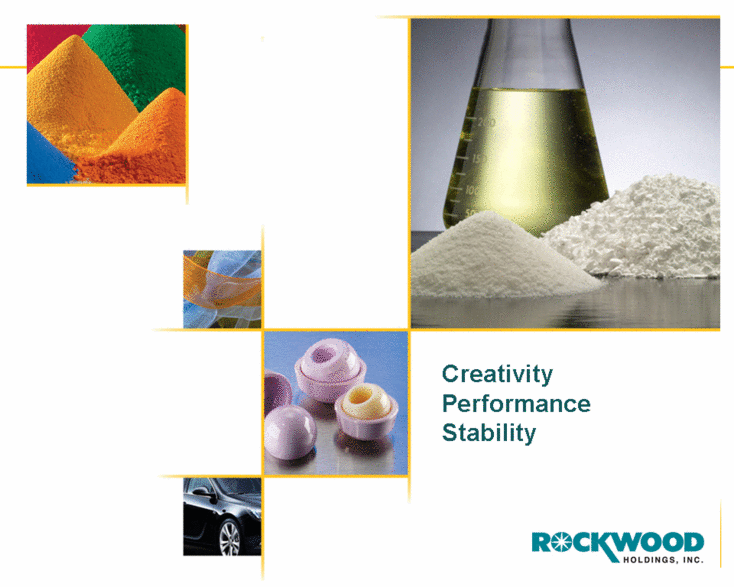
Diversity. Flexibility. Results. Creativity Performance Stability May 2010 |
|
|
Forward Looking Statements This presentation may contain certain "forward-looking statements" within the meaning of the Private Securities Litigation Reform Act of 1995 concerning the business, operations and financial condition of Rockwood Holdings, Inc. and its subsidiaries (“Rockwood”). Although Rockwood believes the expectations reflected in such forward-looking statements are based upon reasonable assumptions, there can be no assurance that its expectations will be realized. "Forward-looking statements" consist of all non-historical information, including the statements referring to the prospects and future performance of Rockwood. Actual results could differ materially from those projected in Rockwood’s forward-looking statements due to numerous known and unknown risks and uncertainties, including, among other things, the "Risk Factors" described in Rockwood’s 2009 Form 10-K with the Securities and Exchange Commission. Rockwood does not undertake any obligation to publicly update any forward-looking statement to reflect events or circumstances after the date on which any such statement is made or to reflect the occurrence of unanticipated events. |
|
|
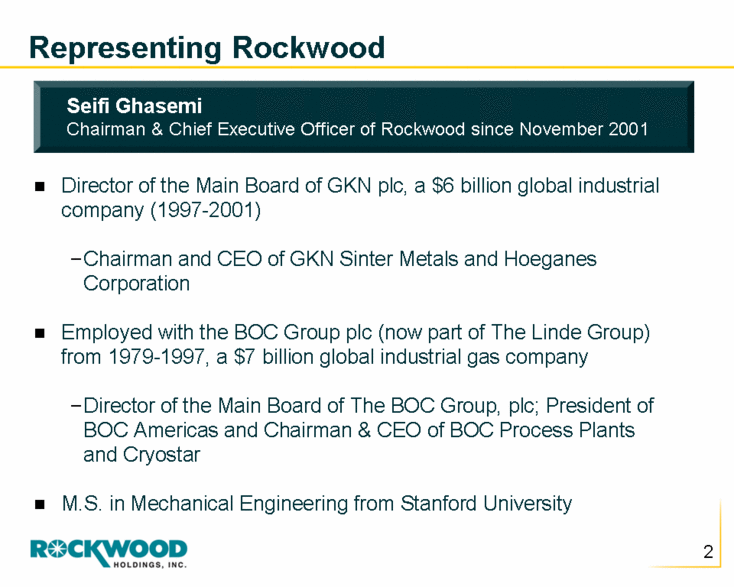
Representing Rockwood Director of the Main Board of GKN plc, a $6 billion global industrial company (1997-2001) Chairman and CEO of GKN Sinter Metals and Hoeganes Corporation Employed with the BOC Group plc (now part of The Linde Group) from 1979-1997, a $7 billion global industrial gas company Director of the Main Board of The BOC Group, plc; President of BOC Americas and Chairman & CEO of BOC Process Plants and Cryostar M.S. in Mechanical Engineering from Stanford University Seifi Ghasemi Chairman & Chief Executive Officer of Rockwood since November 2001 |
|
|
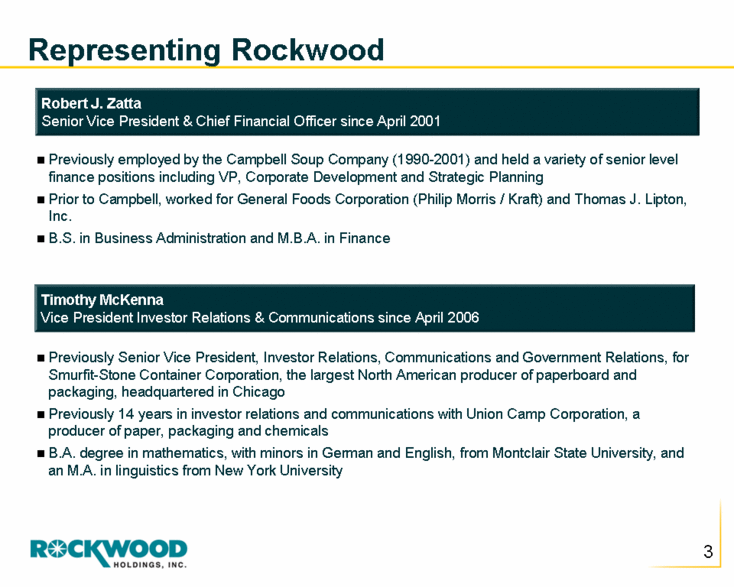
Representing Rockwood Robert J. Zatta Senior Vice President & Chief Financial Officer since April 2001 Timothy McKenna Vice President Investor Relations & Communications since April 2006 Previously Senior Vice President, Investor Relations, Communications and Government Relations, for Smurfit-Stone Container Corporation, the largest North American producer of paperboard and packaging, headquartered in Chicago Previously 14 years in investor relations and communications with Union Camp Corporation, a producer of paper, packaging and chemicals B.A. degree in mathematics, with minors in German and English, from Montclair State University, and an M.A. in linguistics from New York University Previously employed by the Campbell Soup Company (1990-2001) and held a variety of senior level finance positions including VP, Corporate Development and Strategic Planning Prior to Campbell, worked for General Foods Corporation (Philip Morris / Kraft) and Thomas J. Lipton, Inc. B.S. in Business Administration and M.B.A. in Finance |
|
|
Overview |
|
|
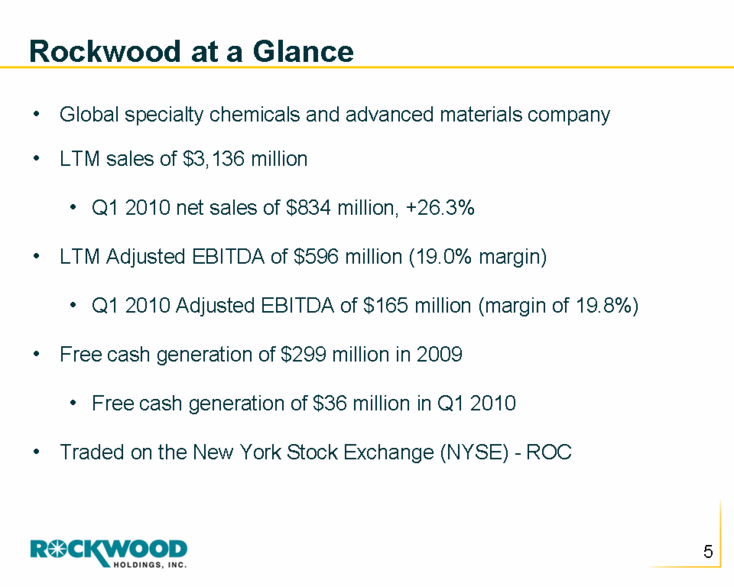
Rockwood at a Glance Global specialty chemicals and advanced materials company LTM sales of $3,136 million Q1 2010 net sales of $834 million, +26.3% LTM Adjusted EBITDA of $596 million (19.0% margin) Q1 2010 Adjusted EBITDA of $165 million (margin of 19.8%) Free cash generation of $299 million in 2009 Free cash generation of $36 million in Q1 2010 Traded on the New York Stock Exchange (NYSE) - ROC |
|
|
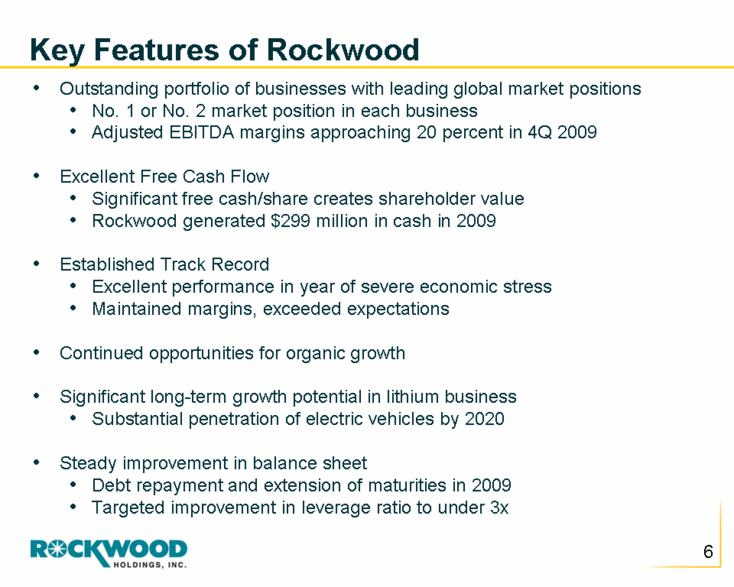
Key Features of Rockwood Outstanding portfolio of businesses with leading global market positions No. 1 or No. 2 market position in each business Adjusted EBITDA margins approaching 20 percent in 4Q 2009 Excellent Free Cash Flow Significant free cash/share creates shareholder value Rockwood generated $299 million in cash in 2009 Established Track Record Excellent performance in year of severe economic stress Maintained margins, exceeded expectations Continued opportunities for organic growth Significant long-term growth potential in lithium business Substantial penetration of electric vehicles by 2020 Steady improvement in balance sheet Debt repayment and extension of maturities in 2009 Targeted improvement in leverage ratio to under 3x |
|
|
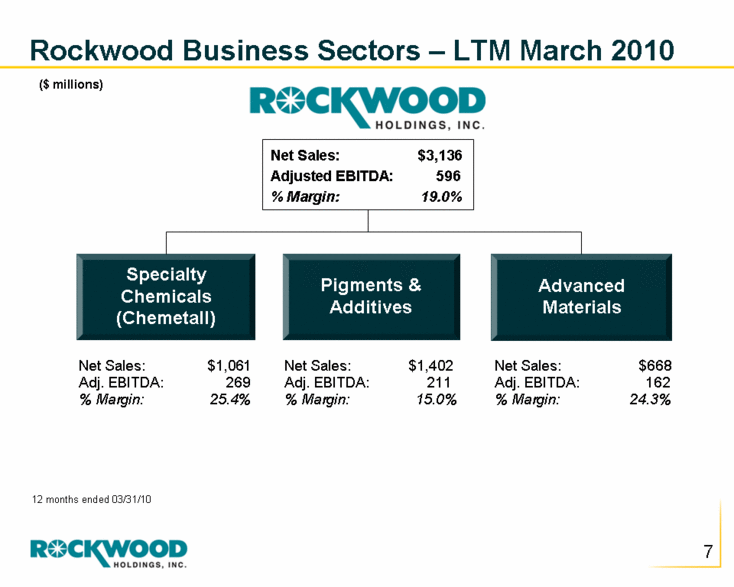
Rockwood Business Sectors – LTM March 2010 Advanced Materials Pigments & Additives Specialty Chemicals (Chemetall) Net Sales: $1,061 Adj. EBITDA: 269 % Margin: 25.4% Net Sales: $1,402 Adj. EBITDA: 211 % Margin: 15.0% Net Sales: $668 Adj. EBITDA: 162 % Margin: 24.3% Net Sales: $3,136 Adjusted EBITDA: 596 % Margin: 19.0% 12 months ended 03/31/10 ($ millions) |
|
|
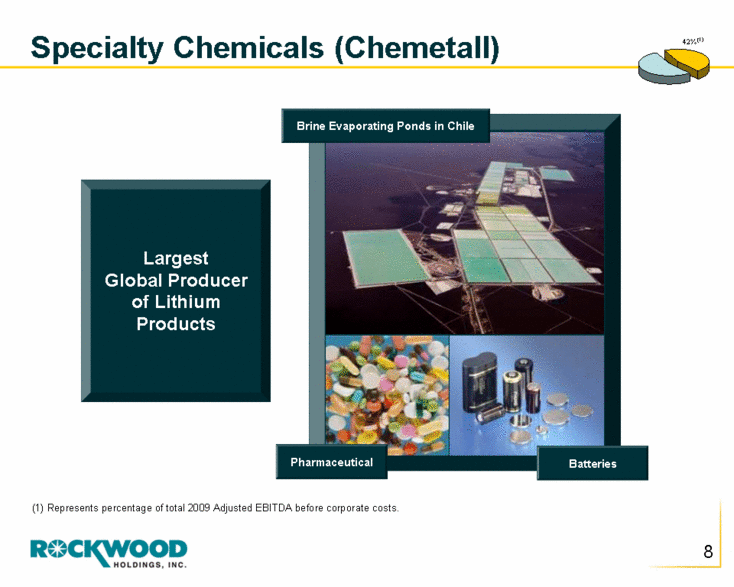
Largest Global Producer of Lithium Products (1) Represents percentage of total 2009 Adjusted EBITDA before corporate costs. Pharmaceutical Batteries Specialty Chemicals (Chemetall) Brine Evaporating Ponds in Chile 42% (1) |
|
|
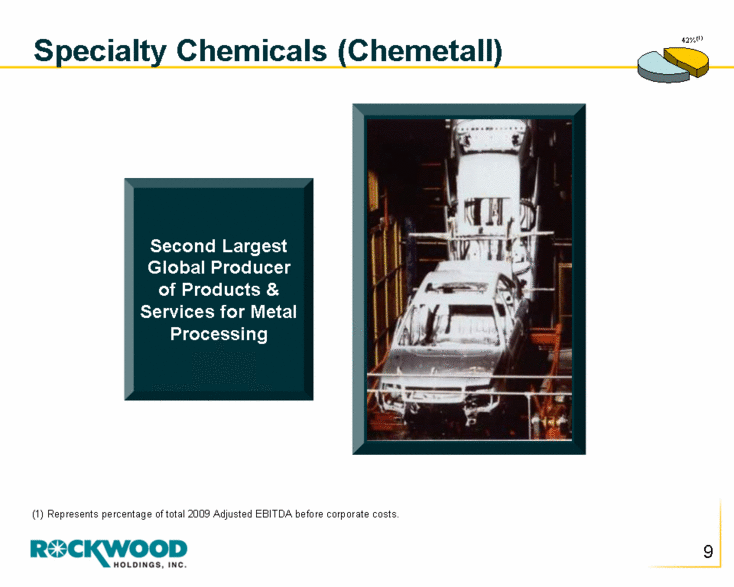
(1) Represents percentage of total 2009 Adjusted EBITDA before corporate costs. Second Largest Global Producer of Products & Services for Metal Processing Specialty Chemicals (Chemetall) 42% (1) |
|
|
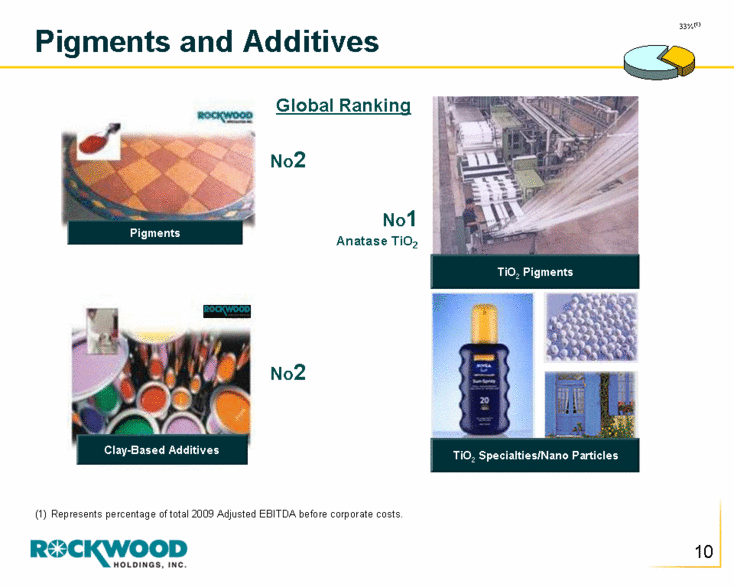
Pigments and Additives TiO2 Specialties/Nano Particles TiO2 Pigments Pigments Clay-Based Additives Represents percentage of total 2009 Adjusted EBITDA before corporate costs. Global Ranking No2 No1 Anatase TiO2 No2 33% (1) |
|
|
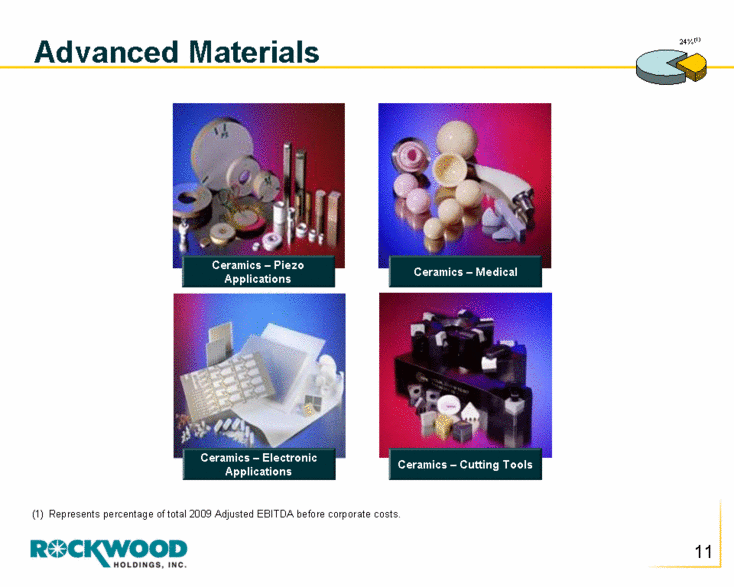
Ceramics – Piezo Applications (1) Represents percentage of total 2009 Adjusted EBITDA before corporate costs. Ceramics – Electronic Applications Ceramics – Cutting Tools Ceramics – Medical Advanced Materials 24% (1) |
|
|
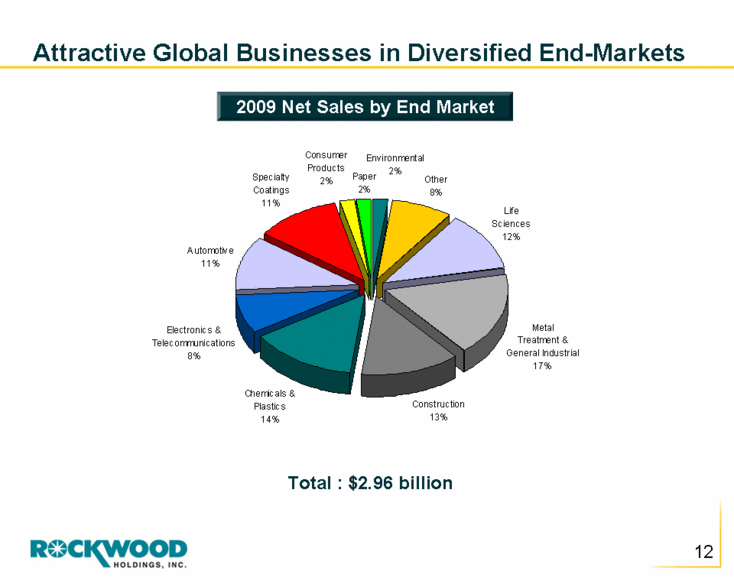
Attractive Global Businesses in Diversified End-Markets 2009 Net Sales by End Market Total : $2.96 billion Other 8% Paper 2% Specialty Coatings 11% Automotive 11% Electronics & Telecommunications 8% Chemicals & Plastics 14% Construction 13% Metal Treatment & General Industrial 17% Life Sciences 12% Consumer Products 2% Environmental 2% |
|
|
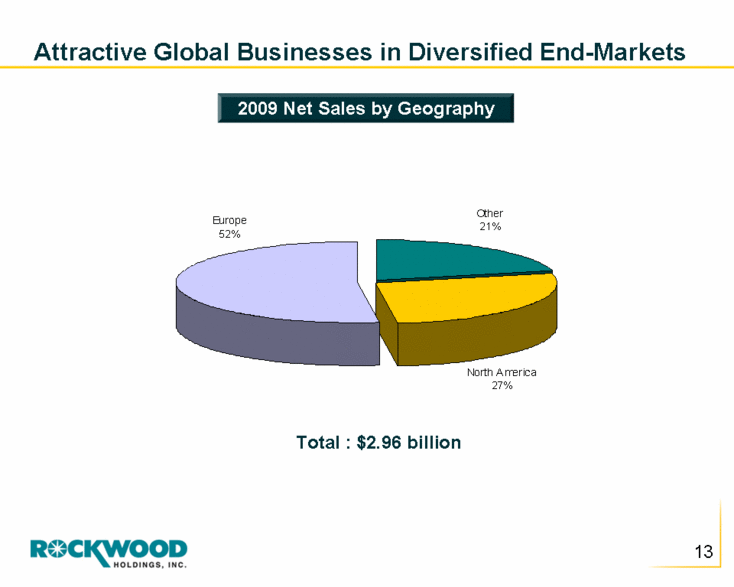
Attractive Global Businesses in Diversified End-Markets Total : $2.96 billion 2009 Net Sales by Geography Europe 52% North America 27% Other 21% |
|
|
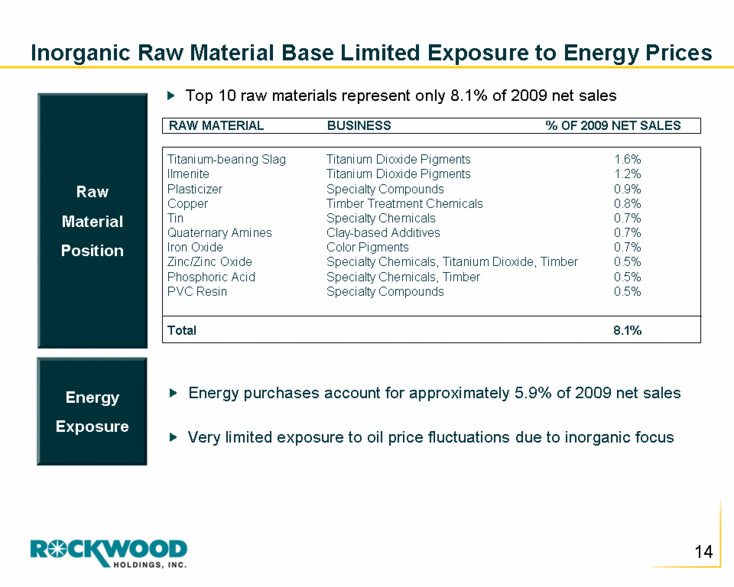
Inorganic Raw Material Base Limited Exposure to Energy Prices Energy purchases account for approximately 5.9% of 2009 net sales Very limited exposure to oil price fluctuations due to inorganic focus Top 10 raw materials represent only 8.1% of 2009 net sales Raw Material Position Energy Exposure Titanium-bearing Slag Titanium Dioxide Pigments 1.6% Ilmenite Titanium Dioxide Pigments 1.2% Plasticizer Specialty Compounds 0.9% Copper Timber Treatment Chemicals 0.8% Tin Specialty Chemicals 0.7% Quaternary Amines Clay-based Additives 0.7% Iron Oxide Color Pigments 0.7% Zinc/Zinc Oxide Specialty Chemicals, Titanium Dioxide, Timber 0.5% Phosphoric Acid Specialty Chemicals, Timber 0.5% PVC Resin Specialty Compounds 0.5% Total 8.1% RAW MATERIAL BUSINESS % OF 2009 NET SALES |
|
|
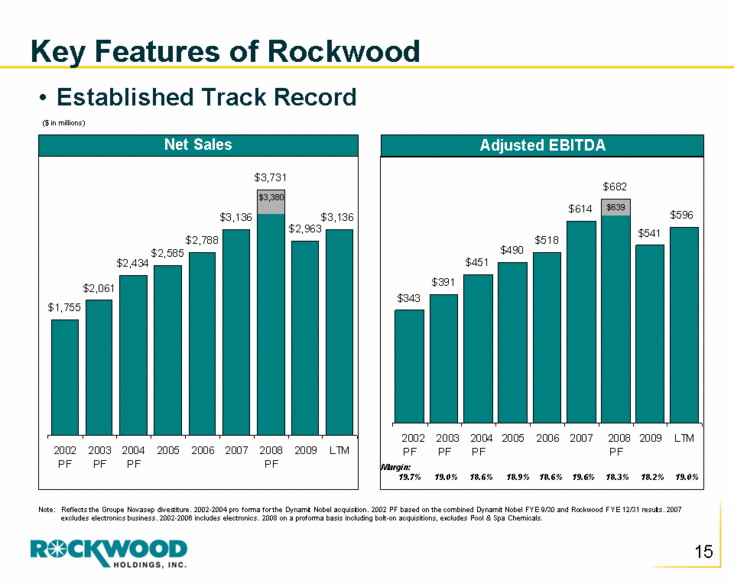
Key Features of Rockwood Established Track Record Note: Reflects the Groupe Novasep divestiture. 2002-2004 pro forma for the Dynamit Nobel acquisition. 2002 PF based on the combined Dynamit Nobel FYE 9/30 and Rockwood FYE 12/31 results. 2007 excludes electronics business. 2002-2006 includes electronics. 2008 on a proforma basis including bolt-on acquisitions, excludes Pool & Spa Chemicals. ($ in millions) Net Sales Adjusted EBITDA Margin: 19.7% 19.0% 18.6% 18.9% 18.6% 19.6% 18.3% 18.2% 19.0% $3,380 $639 $1,755 $2,061 $2,434 $2,585 $2,788 $3,136 $3,731 $2,963 $3,136 2002 PF 2003 PF 2004 PF 2005 2006 2007 2008 PF 2009 LTM $343 $391 $451 $490 $518 $614 $682 $541 $596 2002 PF 2003 PF 2004 PF 2005 2006 2007 2008 PF 2009 LTM |
|
|
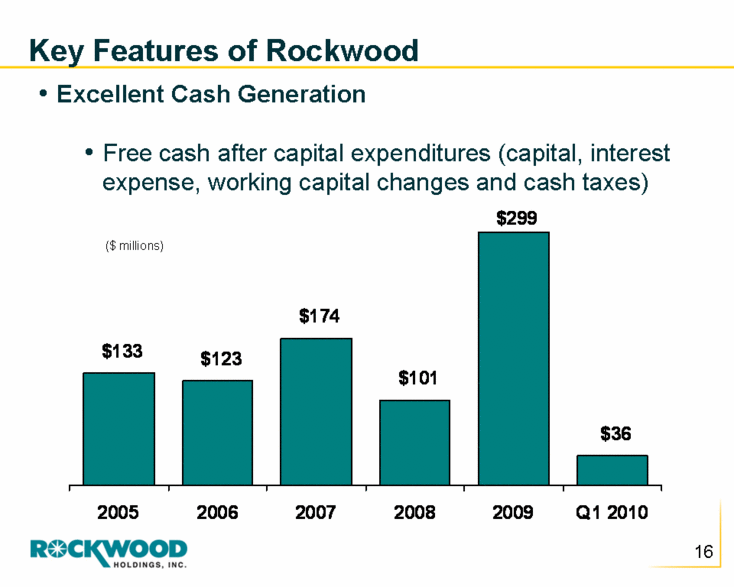
Key Features of Rockwood Excellent Cash Generation Free cash after capital expenditures (capital, interest expense, working capital changes and cash taxes) ($ millions) $133 $123 $174 $101 $299 $36 2005 2006 2007 2008 2009 Q1 2010 |
|
|
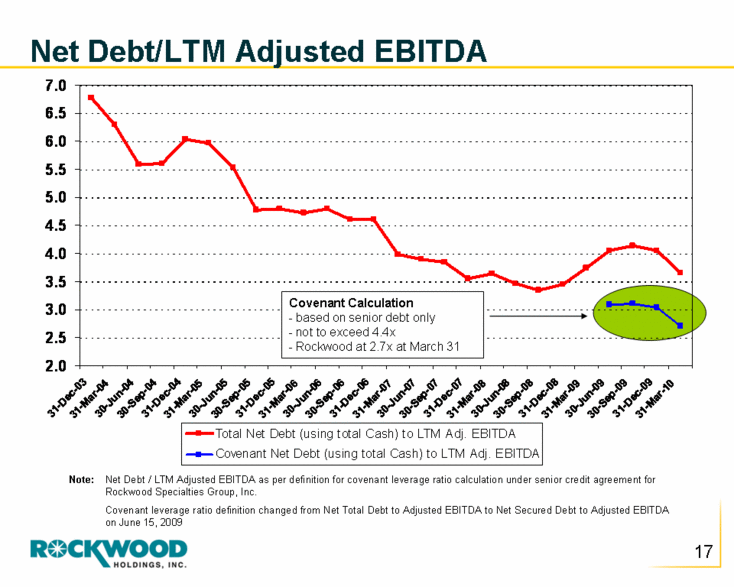
Net Debt/LTM Adjusted EBITDA Note: Net Debt / LTM Adjusted EBITDA as per definition for covenant leverage ratio calculation under senior credit agreement for Rockwood Specialties Group, Inc. Covenant leverage ratio definition changed from Net Total Debt to Adjusted EBITDA to Net Secured Debt to Adjusted EBITDA on June 15, 2009 Covenant Calculation based on senior debt only not to exceed 4.4x Rockwood at 2.7x at March 31 2.0 2.5 3.0 3.5 4.0 4.5 5.0 5.5 6.0 6.5 7.0 31-Dec-03 31-Mar-04 30-Jun-04 30-Sep-04 31-Dec-04 31-Mar-05 30-Jun-05 30-Sep-05 31-Dec-05 31-Mar-06 30-Jun-06 30-Sep-06 31-Dec-06 31-Mar-07 30-Jun-07 30-Sep-07 31-Dec-07 31-Mar-08 30-Jun-08 30-Sep-08 31-Dec-08 31-Mar-09 30-Jun-09 30-Sep-09 31-Dec-09 31-Mar-10 Total Net Debt (using total Cash) to LTM Adj. EBITDA Covenant Net Debt (using total Cash) to LTM Adj. EBITDA |
|
|
Organic Growth Opportunities |
|
|
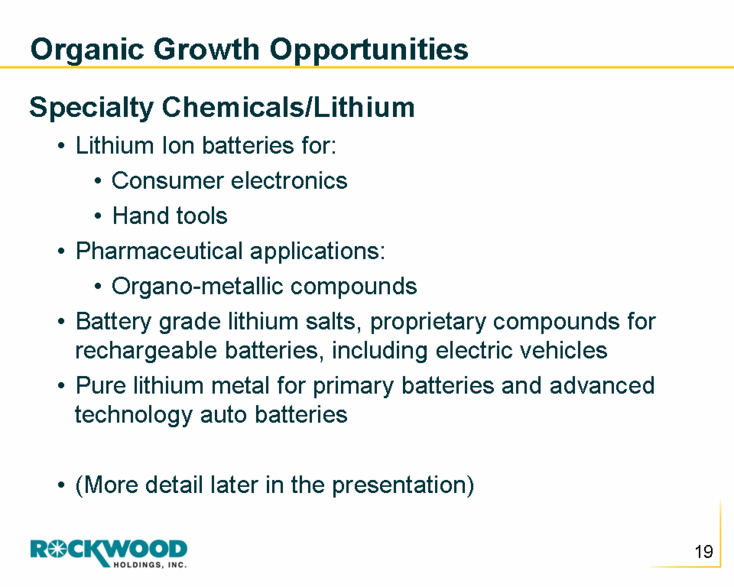
Organic Growth Opportunities Specialty Chemicals/Lithium Lithium Ion batteries for: Consumer electronics Hand tools Pharmaceutical applications: Organo-metallic compounds Battery grade lithium salts, proprietary compounds for rechargeable batteries, including electric vehicles Pure lithium metal for primary batteries and advanced technology auto batteries (More detail later in the presentation) |
|
|
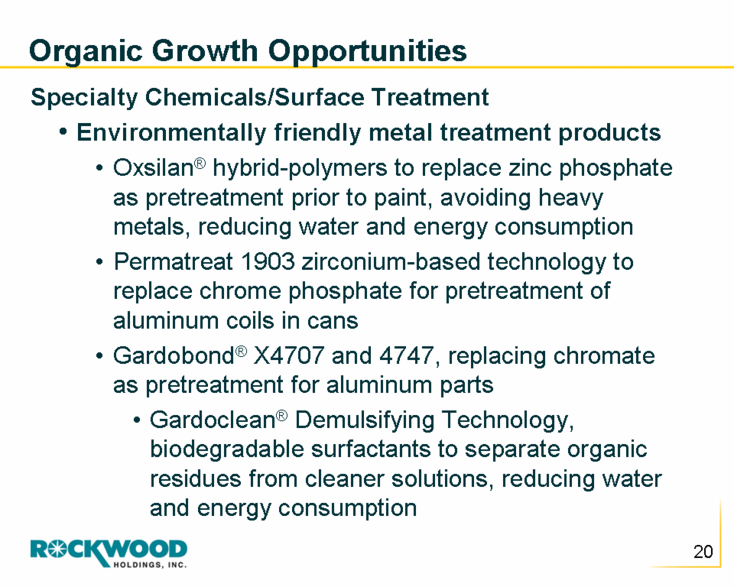
Organic Growth Opportunities Specialty Chemicals/Surface Treatment Environmentally friendly metal treatment products Oxsilan® hybrid-polymers to replace zinc phosphate as pretreatment prior to paint, avoiding heavy metals, reducing water and energy consumption Permatreat 1903 zirconium-based technology to replace chrome phosphate for pretreatment of aluminum coils in cans Gardobond® X4707 and 4747, replacing chromate as pretreatment for aluminum parts Gardoclean® Demulsifying Technology, biodegradable surfactants to separate organic residues from cleaner solutions, reducing water and energy consumption |
|
|
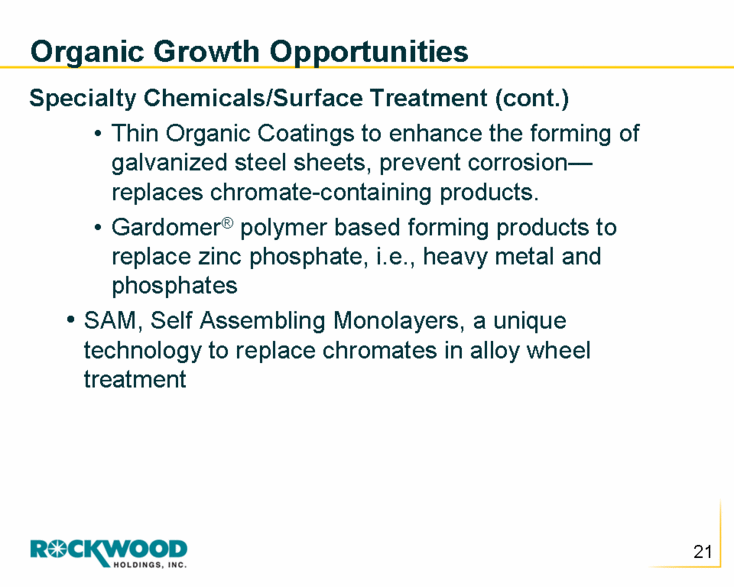
Organic Growth Opportunities Specialty Chemicals/Surface Treatment (cont.) Thin Organic Coatings to enhance the forming of galvanized steel sheets, prevent corrosion—replaces chromate-containing products. Gardomer® polymer based forming products to replace zinc phosphate, i.e., heavy metal and phosphates SAM, Self Assembling Monolayers, a unique technology to replace chromates in alloy wheel treatment |
|
|
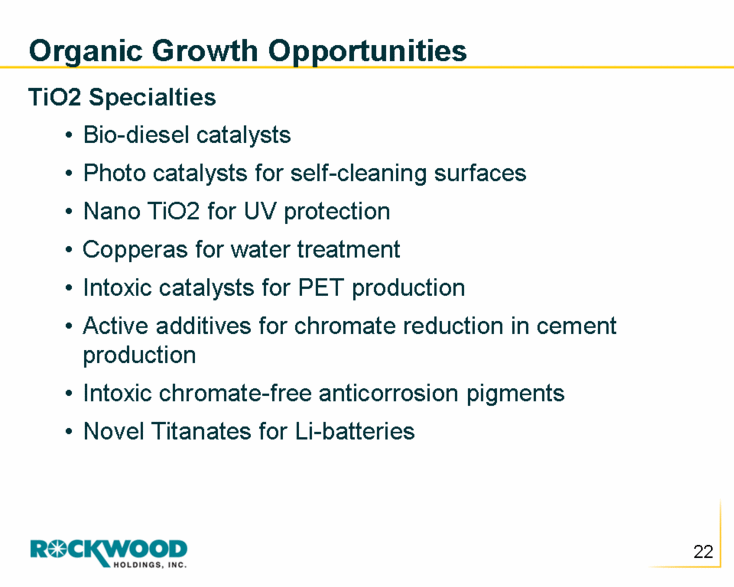
Organic Growth Opportunities TiO2 Specialties Bio-diesel catalysts Photo catalysts for self-cleaning surfaces Nano TiO2 for UV protection Copperas for water treatment Intoxic catalysts for PET production Active additives for chromate reduction in cement production Intoxic chromate-free anticorrosion pigments Novel Titanates for Li-batteries |
|
|
Organic Growth Opportunities Color Pigments Ferroxide® color pigments—non-toxic color pigments made from 60% post-industrial recycled content Granufin® dry, micro-granulated color—free-flowing, dust-free pigments to provide a cleaner work environment Solaplex® line of color pigments—class of bright yellow and orange pigments developed to replace lead and chrome-containing pigments for sun and weather-fast applications Solarox™ patented color pigments, under development by Rockwood, harness light from the sun to remove air pollutants (NOx, VOCs), reduce mold growth and give surfaces self-cleaning properties |
|
|
Organic Growth Opportunities Clay Additives Garamite® unsaturated polyester resins (UPR) to reduce VOC emissions in tubs, showers, boats and coatings Cloisite® additives to allow composite manufacturers to lower the weight of vehicle parts and personal watercraft to reduce fuel consumption Optiflo® VOC free additives to reduce emissions from household paint Bentolite® and Gel White® additives to replace synthetic chemicals in personal care and household cleaning products Viance Timber Treatment Chemicals Ecolife—the first non-metallic biocide for pressure treating wood, preserves natural appearance of treated wood and prolongs outdoor life |
|
|
Organic Growth Opportunities Advanced Materials Medical Ceramics Ceramic ball and cup hip joint for hip replacement surgery, still gaining market share Ceramic orthopedic components in development: ceramic knee joint in test, ceramic discs for spinal surgery Defense Applications Ceramic body armor Ceramic armor plating for military vehicles |
|
|
Strategy & Management Philosophy |
|
|
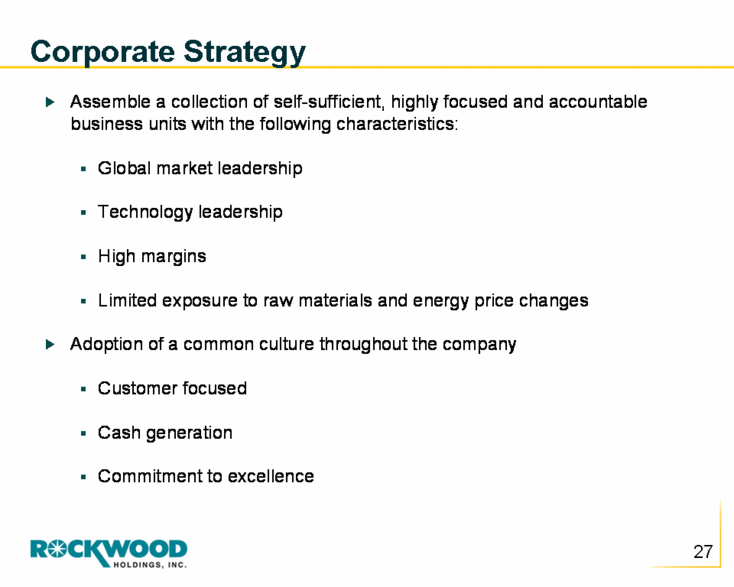
Corporate Strategy Assemble a collection of self-sufficient, highly focused and accountable business units with the following characteristics: Global market leadership Technology leadership High margins Limited exposure to raw materials and energy price changes Adoption of a common culture throughout the company Customer focused Cash generation Commitment to excellence |
|
|
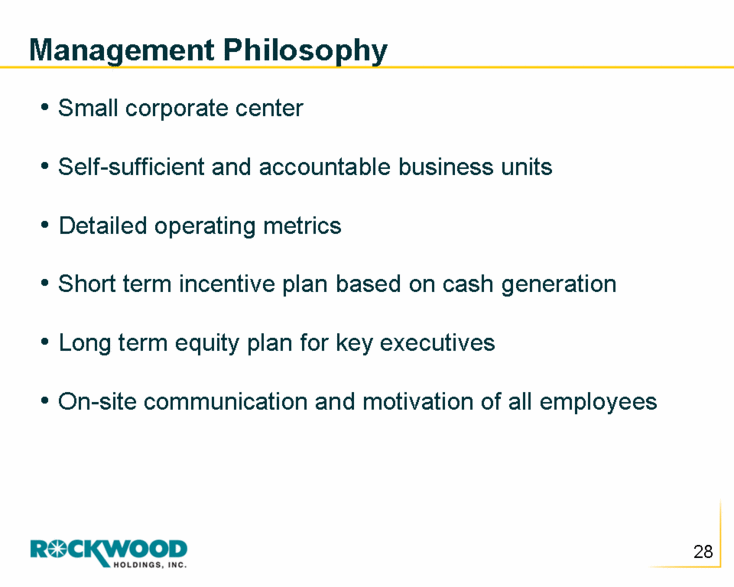
Management Philosophy Small corporate center Self-sufficient and accountable business units Detailed operating metrics Short term incentive plan based on cash generation Long term equity plan for key executives On-site communication and motivation of all employees |
|
|
Moving Forward |

|
|
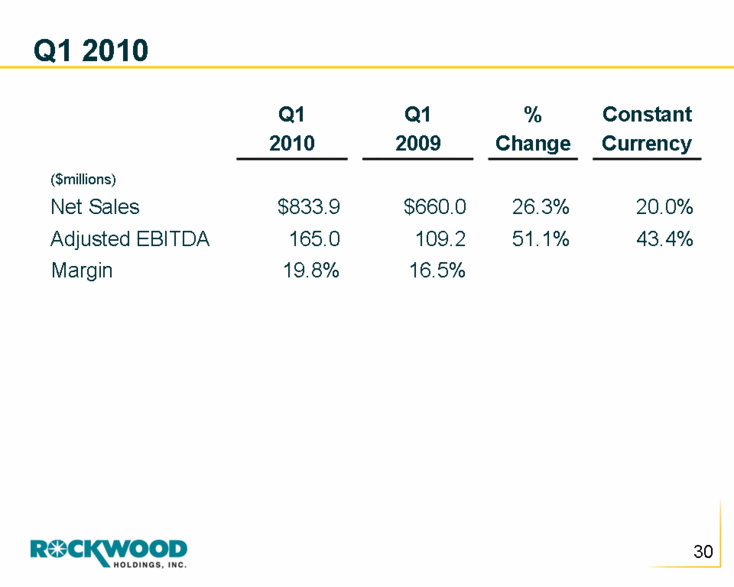
Q1 2010 16.5% 19.8% Margin 43.4% 51.1% 109.2 165.0 Adjusted EBITDA 20.0% 26.3% $660.0 $833.9 Net Sales ($millions) Constant Currency % Change Q1 2009 Q1 2010 |
|
|
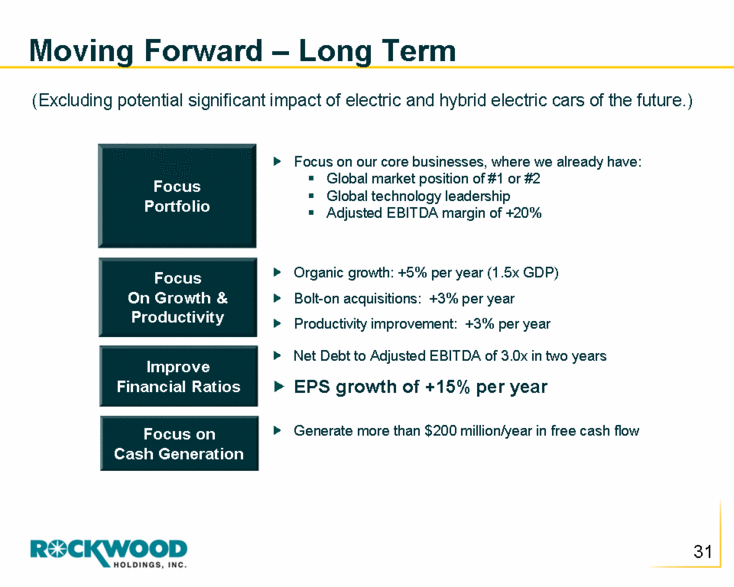
Moving Forward – Long Term Focus Portfolio Focus On Growth & Productivity Improve Financial Ratios Focus on Cash Generation Focus on our core businesses, where we already have: Global market position of #1 or #2 Global technology leadership Adjusted EBITDA margin of +20% Organic growth: +5% per year (1.5x GDP) Bolt-on acquisitions: +3% per year Productivity improvement: +3% per year Net Debt to Adjusted EBITDA of 3.0x in two years EPS growth of +15% per year Generate more than $200 million/year in free cash flow (Excluding potential significant impact of electric and hybrid electric cars of the future.) |
|
|
Lithium & Lithium Growth Potential |
|
|
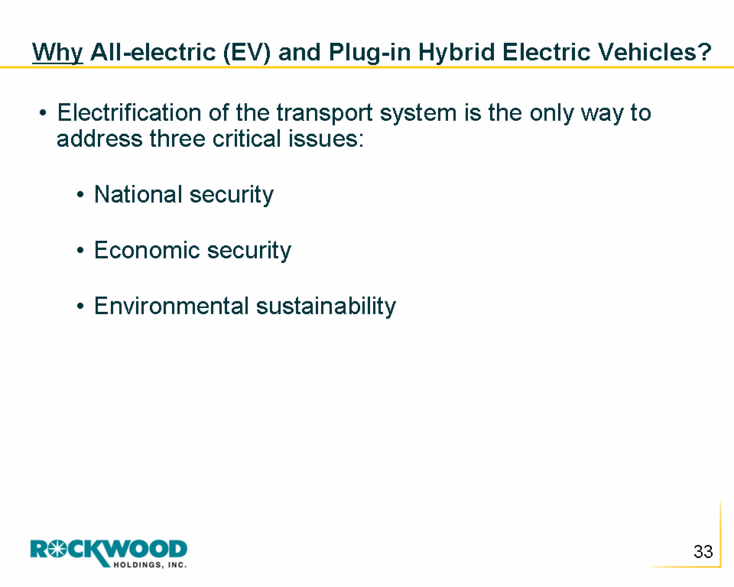
Why All-electric (EV) and Plug-in Hybrid Electric Vehicles? Electrification of the transport system is the only way to address three critical issues: National security Economic security Environmental sustainability |
|
|
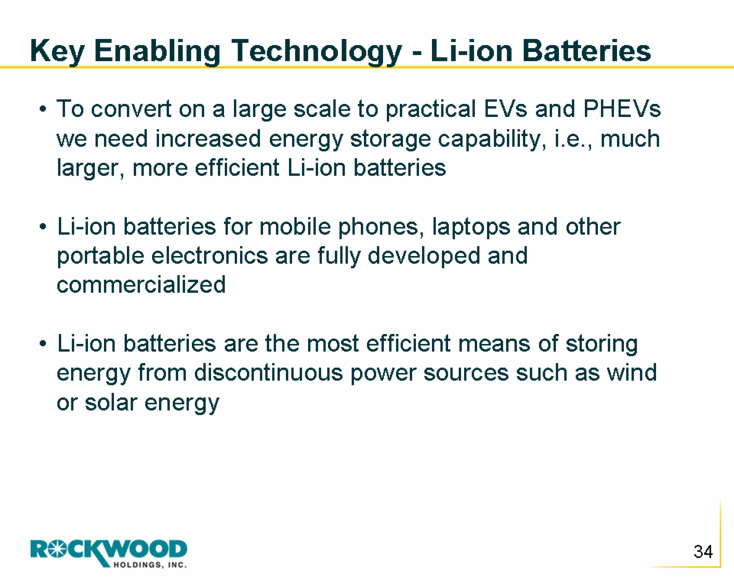
Key Enabling Technology - Li-ion Batteries To convert on a large scale to practical EVs and PHEVs we need increased energy storage capability, i.e., much larger, more efficient Li-ion batteries Li-ion batteries for mobile phones, laptops and other portable electronics are fully developed and commercialized Li-ion batteries are the most efficient means of storing energy from discontinuous power sources such as wind or solar energy |
|
|
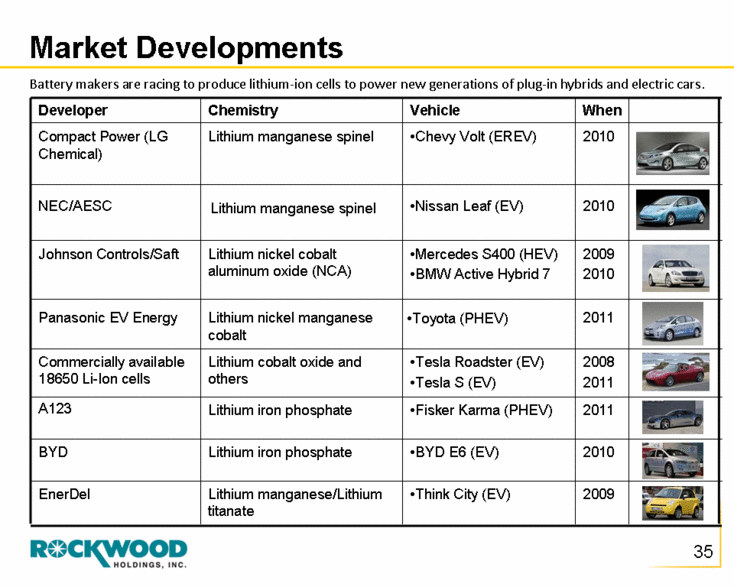
Developer Chemistry Vehicle When Compact Power (LG Chemical) Lithium manganese spinel Chevy Volt (EREV) 2010 NEC/AESC Lithium manganese spinel Nissan Leaf (EV) 2010 Johnson Controls/Saft Lithium nickel cobalt aluminum oxide (NCA) Mercedes S400 (HEV) BMW Active Hybrid 7 2009 2010 Panasonic EV Energy Lithium nickel manganese cobalt Toyota (PHEV) 2011 Commercially available 18650 Li-Ion cells Lithium cobalt oxide and others Tesla Roadster (EV) Tesla S (EV) 2008 2011 A123 Lithium iron phosphate Fisker Karma (PHEV) 2011 BYD Lithium iron phosphate BYD E6 (EV) 2010 EnerDel Lithium manganese/Lithium titanate Think City (EV) 2009 Battery makers are racing to produce lithium-ion cells to power new generations of plug-in hybrids and electric cars. Market Developments |
|
|
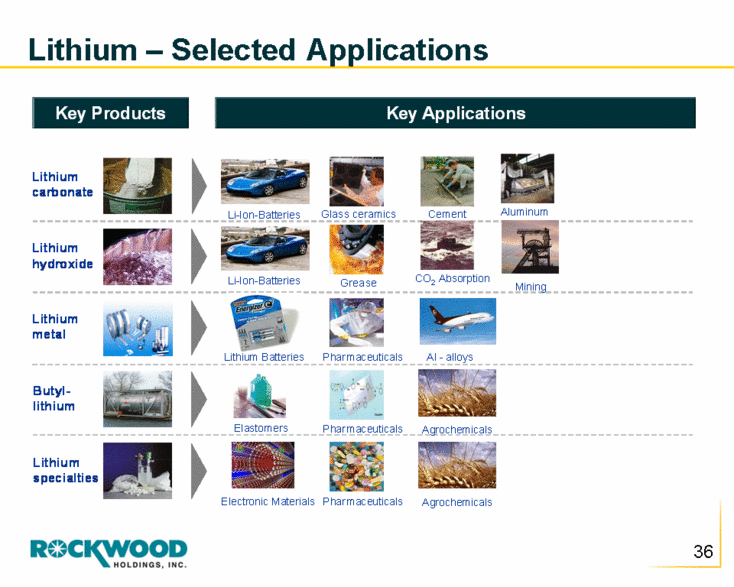
Lithium – Selected Applications Lithium carbonate Butyl - lithium Lithium metal Lithium hydroxide Lithium specialties Pharmaceuticals Pharmaceuticals Pharmaceuticals Glass ceramics Grease CO 2 Absorption Elastomers Aluminum Lithium Batteries Electronic Materials Cement Al - alloys Mining Agrochemicals Li-Ion-Batteries Li-Ion-Batteries Key Products Key Applications |
|
|
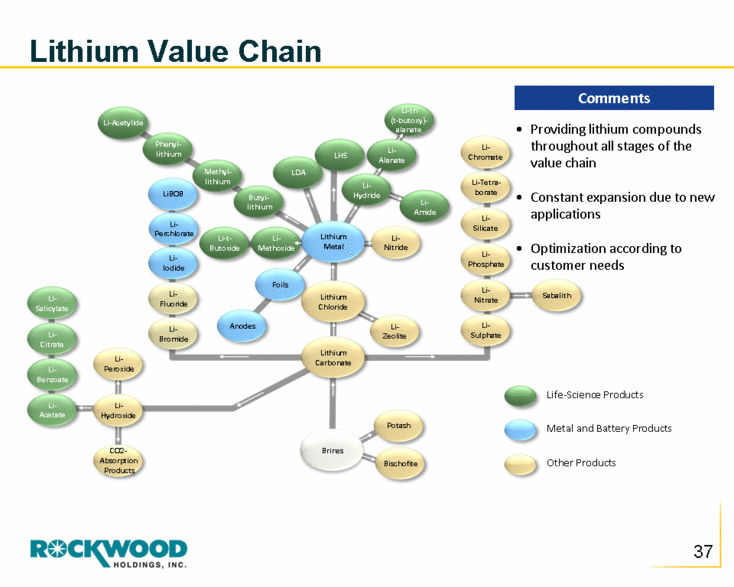
Lithium Value Chain Li-Acetylide Methyl-lithium Phenyl-lithium LDA LHS Li-t-Butoxide Li-Methoxide Li-Hydride Li-tri (t-butoxy)-alanate Li-Amide Li-Salicylate Li-Citrate Li-Benzoate Li-Acetate Li-Zeolite Potash Bischofite Li-Sulphate Li-Nitrate Li-Phosphate Li-Silicate Li-Tetra- borate Li- Chromate Sabalith Li-Nitride Li-Bromide Li-Fluoride Li-Peroxide Li-Hydroxide CO2- Absorption Products Li-Iodide Li-Perchlorate LiBOB Anodes Foils Lithium Carbonate Lithium Chloride Brines Butyl- lithium Li-Alanate Lithium Metal Providing lithium compounds throughout all stages of the value chain Constant expansion due to new applications Optimization according to customer needs Life-Science Products Metal and Battery Products Other Products Comments |
|
|
Rockwood (Chemetall) Lithium Resources |
|
|
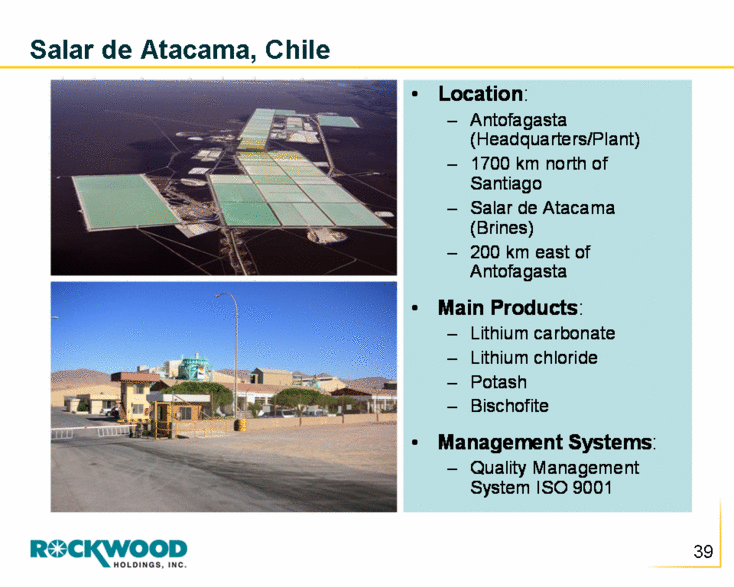
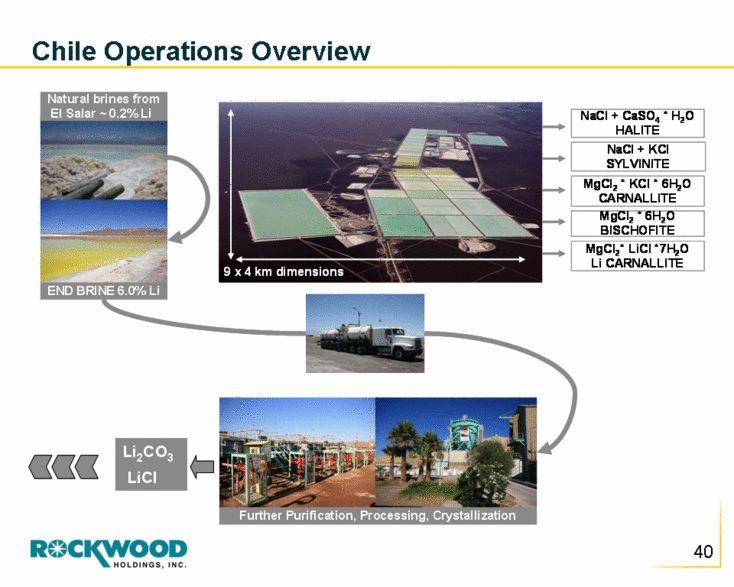
Salar de Atacama, Chile • Location: – Antofagasta (Headquarters/Plant) – 1700 km north of Santiago – Salar de Atacama (Brines) – 200 km east of Antofagasta • Main Products: – Lithium carbonate – Lithium chloride – Potash – Bischofite • Management Systems: – Quality Management System ISO 9001 |
|
|
Chile Operations Overview NaCl + CaSO4 * H2O HALITE NaCl + KCl SYLVINITE MgCl2 * KCl * 6H2O CARNALLITE MgCl2 * 6H2O BISCHOFITE MgCl2 * LiCl *7H2O Li CARNALLITE Natural brines from El Salar ~ 0.2% Li END BRINE 6.0% Li Further Purification, Processing, Crystallization Li2CO3 LiCl 9 x 4 km dimensions |
|
|
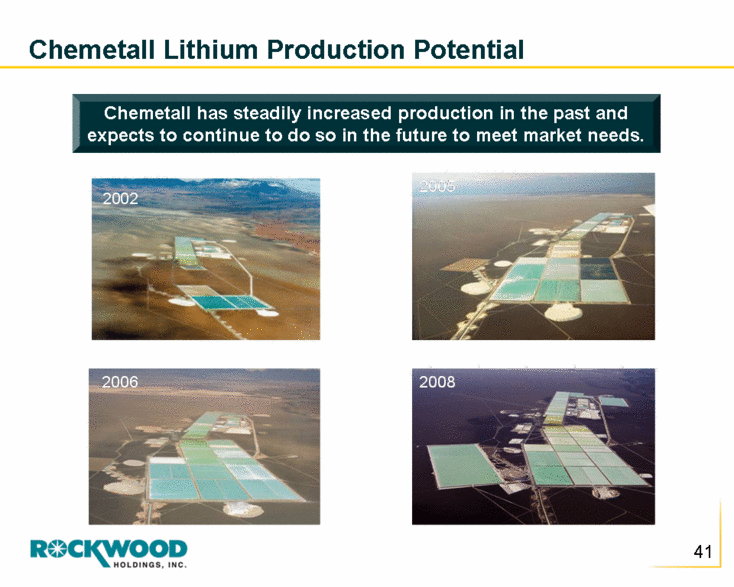
Chemetall Lithium Production Potential Chemetall has steadily increased production in the past and expects to continue to do so in the future to meet market needs. 2002 2005 2006 2008 |
|
|
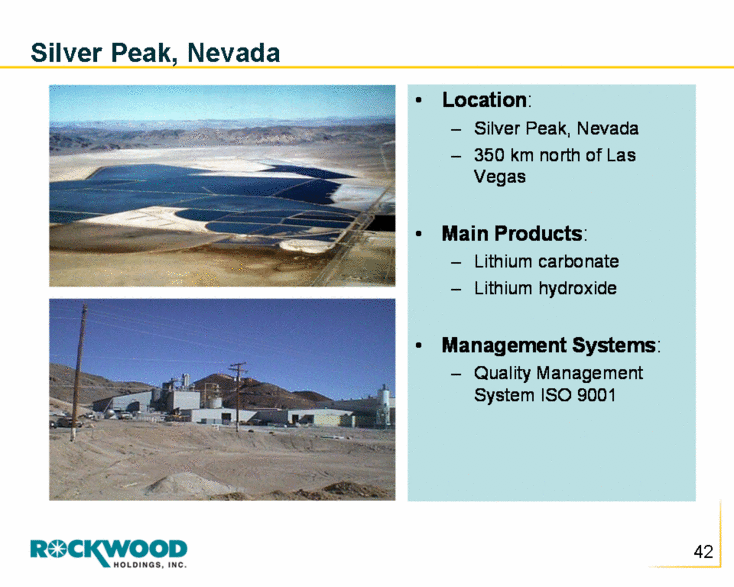
Silver Peak, Nevada • Location: – Silver Peak, Nevada – 350 km north of Las Vegas • Main Products: – Lithium carbonate – Lithium hydroxide • Management Systems: – Quality Management System ISO 9001 |
|
|
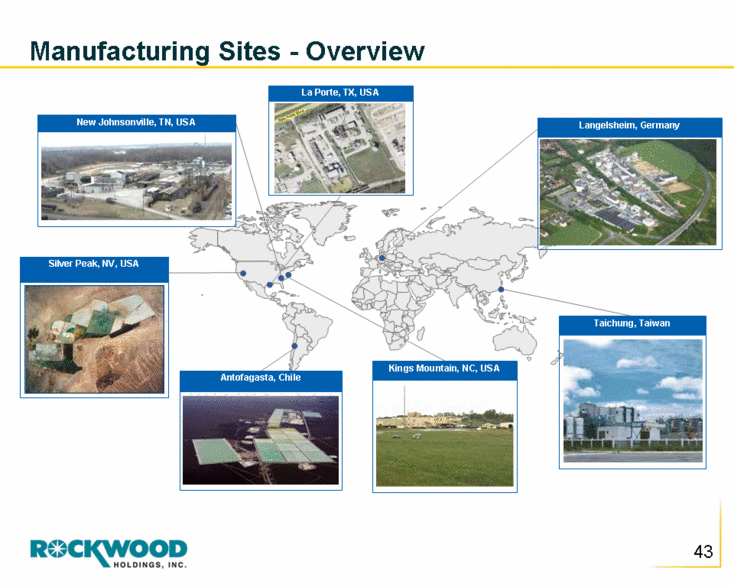
Manufacturing Sites - Overview New Johnsonville, TN, USA Silver Peak, NV, USA Taichung, Taiwan Antofagasta, Chile Kings Mountain, NC, USA Langelsheim, Germany La Porte, TX, USA |
|
|
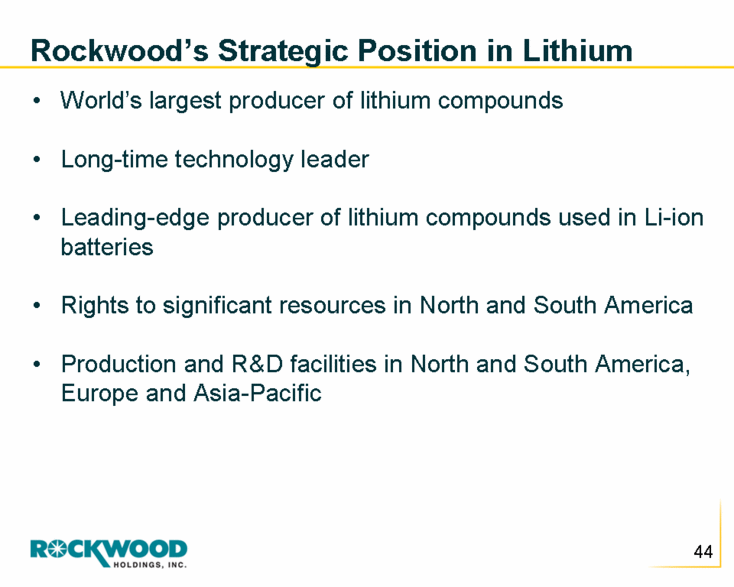
Rockwood’s Strategic Position in Lithium World’s largest producer of lithium compounds Long-time technology leader Leading-edge producer of lithium compounds used in Li-ion batteries Rights to significant resources in North and South America Production and R&D facilities in North and South America, Europe and Asia-Pacific |
|
|
Lithium Growth Impact on Rockwood |
|
|
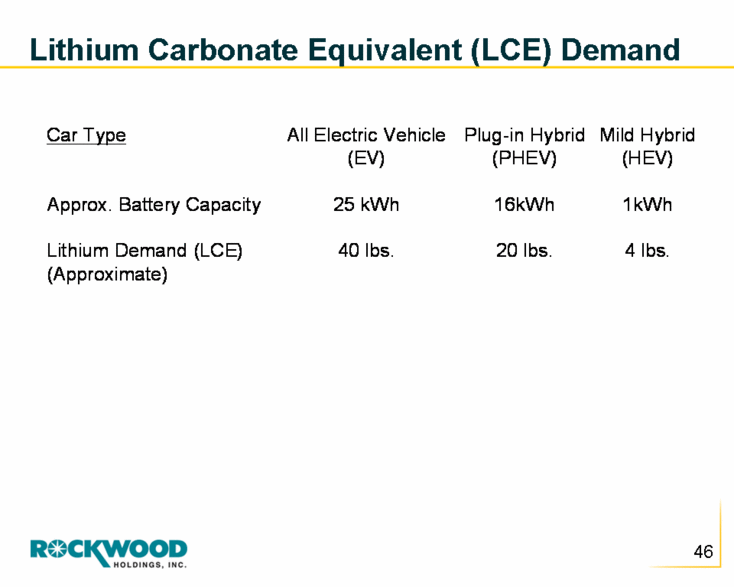
Lithium Carbonate Equivalent (LCE) Demand Car Type All Electric Vehicle Plug-in Hybrid Mild Hybrid (EV) (PHEV) (HEV) Approx. Battery Capacity 25 kWh 16kWh 1kWh Lithium Demand (LCE) 40 lbs. 20 lbs. 4 lbs. (Approximate) |
|
|
Forecast of EV/PHEV Growth and Impact on Lithium |
|
|
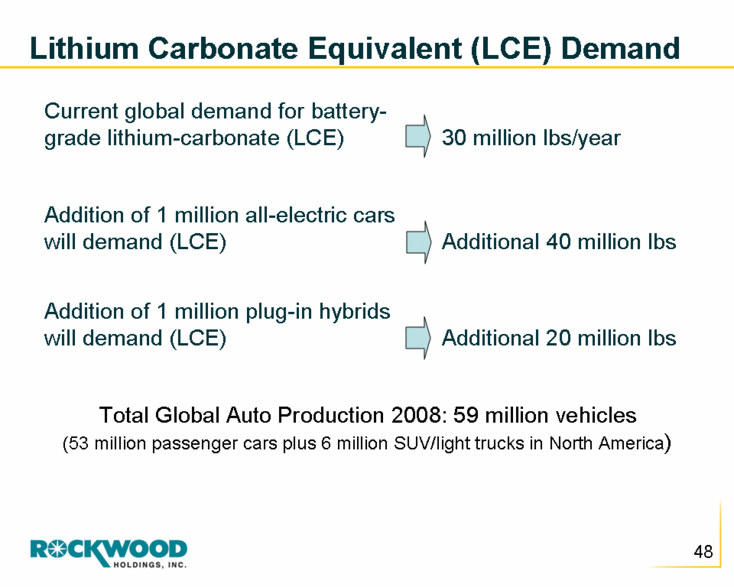
Lithium Carbonate Equivalent (LCE) Demand Additional 20 million lbs Addition of 1 million plug-in hybrids will demand (LCE) Additional 40 million lbs Addition of 1 million all-electric cars will demand (LCE) 30 million lbs/year Current global demand for battery-grade lithium-carbonate (LCE) Total Global Auto Production 2008: 59 million vehicles (53 million passenger cars plus 6 million SUV/light trucks in North America) |
|
|
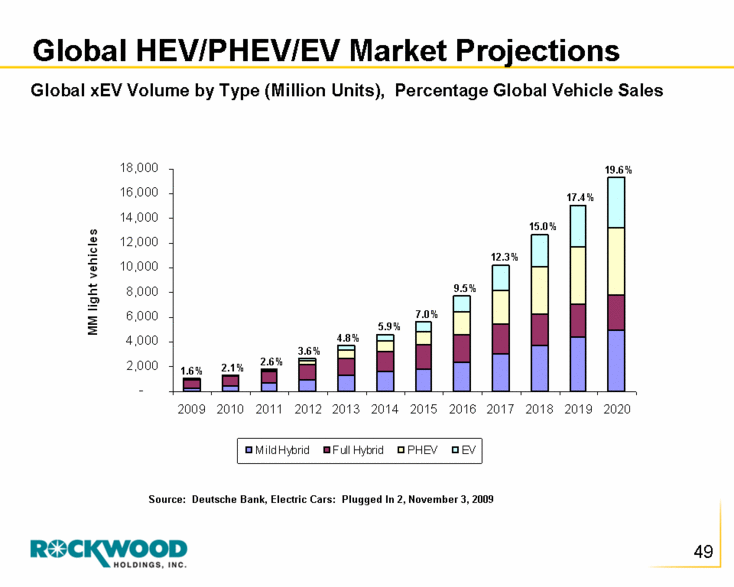
Global HEV/PHEV/EV Market Projections 1.6% 2.1% 2.6% 3.6% 4.8% 5.9% 7.0% 9.5% 12.3% 15.0% 17.4% 19.6% Global xEV Volume by Type (Million Units), Percentage Global Vehicle Sales Source: Deutsche Bank, Electric Cars: Plugged In 2, November 3, 2009 - 2,000 4,000 6,000 8,000 10,000 12,000 14,000 16,000 18,000 2009 2010 2011 2012 2013 2014 2015 2016 2017 2018 2019 2020 MM light vehicles Mild Hybrid Full Hybrid PHEV EV |
|
|
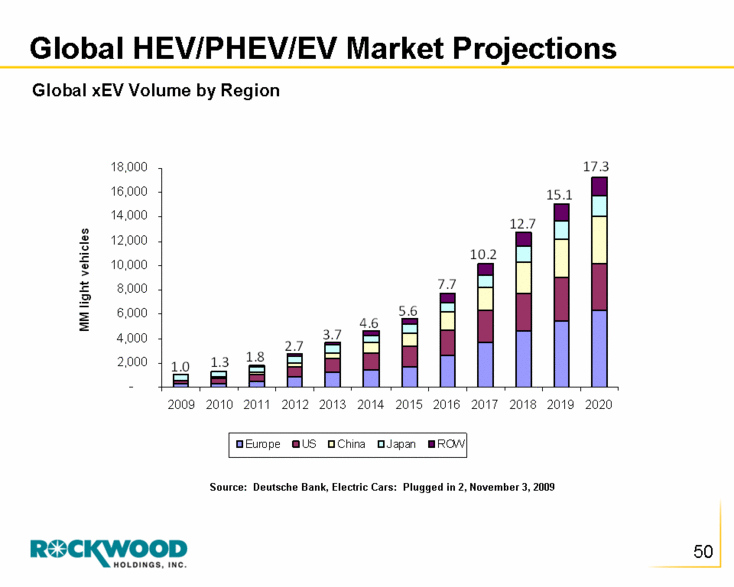
Global HEV/PHEV/EV Market Projections Global xEV Volume by Region Source: Deutsche Bank, Electric Cars: Plugged in 2, November 3, 2009 - 2,000 4,000 6,000 8,000 10,000 12,000 14,000 16,000 18,000 2009 2010 2011 2012 2013 2014 2015 2016 2017 2018 2019 2020 MM light vehicles Europe US China Japan ROW 1.0 1.8 1.3 2.7 3.7 4.6 5.6 7.7 10.2 12.7 15.1 17.3 |
|
|
Depending on your assumptions of the penetration of all electric and hybrid electric cars in the coming years, the growth in demand for lithium can be very substantial. |
|
|
Summary |
|
|
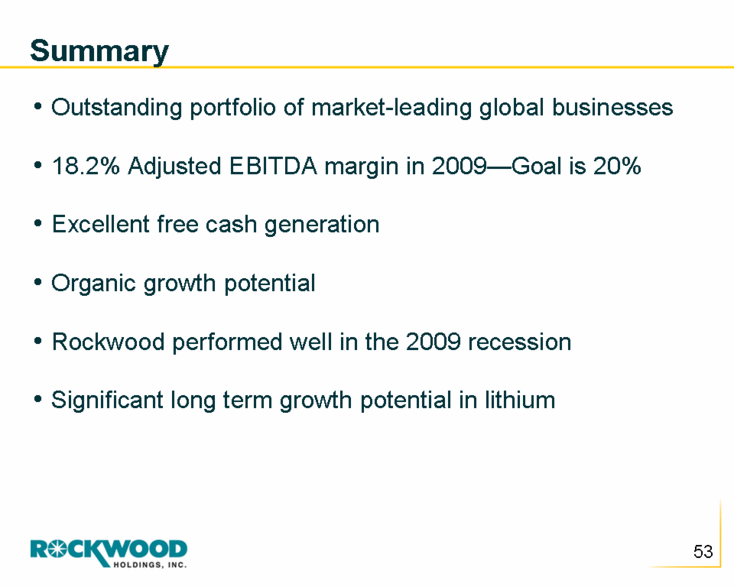
Summary Outstanding portfolio of market-leading global businesses 18.2% Adjusted EBITDA margin in 2009—Goal is 20% Excellent free cash generation Organic growth potential Rockwood performed well in the 2009 recession Significant long term growth potential in lithium |
|
|
Creativity Performance Stability |