Attached files
| file | filename |
|---|---|
| EX-32. - LIFE PARTNERS HOLDINGS INC | v184217_ex32.htm |
| EX-21 - LIFE PARTNERS HOLDINGS INC | v184217_ex21.htm |
| EX-3.4 - LIFE PARTNERS HOLDINGS INC | v184217_ex3-4.htm |
| EX-3.1 - LIFE PARTNERS HOLDINGS INC | v184217_ex3-1.htm |
| EX-3.3 - LIFE PARTNERS HOLDINGS INC | v184217_ex3-3.htm |
| EX-4.1 - LIFE PARTNERS HOLDINGS INC | v184217_ex4-1.htm |
| EX-3.2 - LIFE PARTNERS HOLDINGS INC | v184217_ex3-2.htm |
| EX-31.2 - LIFE PARTNERS HOLDINGS INC | v184217_ex31-2.htm |
| EX-31.1 - LIFE PARTNERS HOLDINGS INC | v184217_ex31-1.htm |
UNITED
STATES
SECURITIES
AND EXCHANGE COMMISSION
WASHINGTON,
D.C. 20549
FORM
10-K
|
x
|
Annual
Report Pursuant to Section 13 or 15 (d) of the Securities Exchange Act of
1934 (the “Exchange Act”)
|
For the
fiscal year ended: February 28, 2010
Commission
File Number: 0-7900
LIFE
PARTNERS HOLDINGS, INC.
(Name of
registrant in its charter)
|
Texas
(State
of incorporation)
|
74-2962475
(I.R.S.
Employer ID no.)
|
|
204
Woodhew Drive
Waco,
Texas
(Address of Principal Executive
Offices)
|
76712
(Zip
Code)
|
Registrant’s
telephone number, including area code: 254-751-7797
Securities
registered pursuant to Section 12(b) of the Exchange Act:
|
Common
Stock (par value $0.01 per share)
(Title
of Class)
|
NASDAQ
Global Select
(Name
of exchange on which registered)
|
Securities
registered pursuant to Section 12(g) of the Exchange Act: None
Indicate
by check mark if the registrant is a well-known seasoned issuer, as defined in
Rule 405 of the
Securities
Act. Yes
¨ No
x
Indicate
by check mark if the registrant is not required to file reports pursuant to
Section 13 or
Section 15(d) of the Exchange Act. ¨
Indicate
by check mark whether the registrant (1) has filed all reports required to be
filed by Section 13 or 15(d) of the Exchange Act during the past 12 months (or
for such shorter period that the registrant was required to file such reports),
and (2) has been subject to such filing requirements for at least the past 90
days. Yes x No ¨
Indicate
by check mark whether the registrant has submitted electronically and posted on
its corporate Web site, if any, every Interactive Data File required to be
submitted and posted pursuant to Rule 405 of Regulation S-T during the preceding
12 months (or for such shorter period that the registrant was required to submit
and post such files).
Yes ¨
No x
Indicate
by check mark if disclosure of delinquent filers pursuant to Item 405 of
Regulation S-K is not contained herein, and will not be contained, to the best
of the registrant’s knowledge, in definitive proxy or information statements
incorporated by reference in Part III of this Form 10-K or any amendment to this
Form 10-K. ¨
Indicate
by check mark whether the registrant is a large accelerated filer, an
accelerated filer, a non-accelerated filer, or a smaller reporting
company. See definitions of “large accelerated filer”, “accelerated
filer” and “smaller reporting company” in Rule 12b-2 of the Exchange
Act. (Check one):
|
Large
accelerated filer ¨
|
Accelerated
filer x
|
|
Non-accelerated
filer ¨
|
Smaller
reporting company ¨
|
Indicated
by check mark whether the registrant is a shell company (as defined in
Section 12b-2 of the Exchange Act).
Yes ¨ No
x
The
aggregate market value of the Common Stock held by non-affiliates of the
Registrant as of August 31, 2009, was $124,733,911, based on the last
reported sale price of $17.14 (adjusted for 2008 and 2009 splits) on that date
on the NASDAQ Global Select Market.
Shares of
Common Stock, $.01 par value, outstanding as of May 1, 2010: 14,859,016
(15,024,354 issued and outstanding less 165,338 treasury shares)
DOCUMENTS
INCORPORATED BY REFERENCE
Our
definitive proxy statement in connection with the Annual Meeting of Shareholders
to be filed with the Commission pursuant to Regulation 14A, is incorporated by
reference into Part III of this report.
2010
Form 10-K Annual Report
Table
of Contents
|
Item
|
Page No.
|
||
|
Part
I
|
|||
|
Special
Note Regarding Forward-Looking Statements
|
3
|
||
|
1.
|
Business
|
3
|
|
|
1A.
|
Risk
Factors
|
9
|
|
|
1B.
|
Unresolved
Staff Comments
|
12
|
|
|
2.
|
Properties
|
12
|
|
|
3.
|
Legal
Proceedings
|
12
|
|
|
4.
|
(Removed
and Reserved)
|
||
|
Part
II
|
|||
|
5.
|
Market
for Our Common Stock, Related Shareholder Matters and Our Purchases of Our
Equity Securities
|
13
|
|
|
6.
|
Selected
Financial Data
|
15
|
|
|
7.
|
Management’s
Discussion and Analysis of Financial Condition and Results of
Operations
|
16
|
|
|
7A.
|
Quantitative
and Qualitative Disclosures about Market Risk
|
23
|
|
|
8.
|
Financial
Statements and Supplementary Data
|
24
|
|
|
9.
|
Changes
in and Disagreements with Accountants on Accounting and Financial
Disclosures
|
24
|
|
|
9A.
|
Controls
and Procedures
|
25
|
|
|
9B.
|
Other
Information
|
28
|
|
|
Part
III
|
|||
|
10.
|
Directors,
Executive Officers and Corporate Governance
|
28
|
|
|
11.
|
Executive
Compensation
|
28
|
|
|
12.
|
Security
Ownership of Certain Beneficial Owners and Management and Related
Shareholder Matters
|
28
|
|
|
13.
|
Certain
Relationships and Related Transactions, and Director
Independence
|
28
|
|
|
14.
|
Principal
Accountant Fees and Services
|
28
|
|
|
Part
IV
|
|||
|
15.
|
Exhibits
and Financial Statement Schedules
|
28
|
|
|
Signatures
|
29
|
||
|
Table
of Contents to Consolidated Financial Statements and Notes
|
30
|
||
|
Exhibit
Index
|
55
|
2
PART
I
Special
Note Regarding Forward-Looking Statements
Certain
statements in this annual report on Form 10-K for the fiscal year ended
February 28, 2010 (“fiscal 2010”), concerning our
business prospects or future financial performance, anticipated revenues,
expenses, profitability or other financial items, estimates as to size, growth
in or projected revenues from the life settlement market, developments in
industry regulations and the application of such regulations, and our
strategies, plans and objectives, together with other statements that are not
historical facts, are “forward-looking statements” as that term is defined under
the federal securities laws. All of these forward-looking statements
are based on information available to us on the date hereof, and we assume no
obligation to update any such forward-looking
statements. Forward-looking statements involve a number of risks,
uncertainties, and other factors, which could cause actual results to differ
materially from those stated in such statements. Factors that could
cause or contribute to such differences include, but are not limited to, those
discussed in this annual report on Form 10-K, particularly in the sections
entitled “Item 1A – Risk Factors” and “Item 7 – Management’s
Discussion and Analysis of Financial Condition and Results of
Operations”. We do not undertake any obligation to release publicly
any revisions to such forward-looking statements to reflect events or
uncertainties after the date hereof or reflect the occurrence of unanticipated
events.
Item
1. Business
Life
Partners
General. Life
Partners Holdings, Inc. (“we” or “Life Partners”) is a
specialty financial services company and the parent company of Life Partners,
Inc. (“LPI”). LPI is the
oldest and one of the most active companies in the United States engaged in the
secondary market for life insurance known generally as “life
settlements”. LPI facilitates the sale of life settlements between
sellers and purchasers, but does not take possession or control of the
policies. The purchasers acquire the life insurance policies at a
discount to their face value for investment purposes.
The Secondary Market for Life
Insurance Policies. LPI was incorporated in 1991 and has
conducted business under the registered service mark “Life Partners” since
1992. Our operating revenues are derived from fees for facilitating
life settlement transactions. Life settlement transactions involve
the sale of an existing life insurance policy to another party. By
selling the policy, the policyholder receives an immediate cash payment to use
as he or she wishes. The purchaser takes an ownership interest in the
policy at a discount to its face value and receives their ownership interest in
the death benefit under the policy when the insured dies.
We are a
specialty financial services company, providing purchasing services for life
settlements to our client base. We facilitate these transactions by
identifying, examining, and purchasing the policies as agent for the
purchasers. To meet market demand and maximize our value to our
clients, we have made significant investments in proprietary software and
processes that enable us to facilitate a higher volume of transactions while
maintaining our quality controls. Since our inception, we have
facilitated over 107,000 purchaser transactions involving over 6,200 policies
totaling over $2.3 billion in face value. We believe our
experience, infrastructure and intellectual capital provide us a unique market
position and will enable us to maintain sustainable growth within the life
settlement market.
3
We act as
a purchasing agent for life settlement purchasers. In performing
these services, we identify, qualify and purchase policies on behalf of our
clients that match their buying parameters and return
expectations. Because we are obliged to work within these parameters,
we must make offers that are competitive from the seller’s point of view, but
still fit within the buying parameters of our clients. This
success-based compensation formula ensures that we bring value to both parties
to the transaction and that both purchaser and seller are
satisfied. We locate potential policy owners through a network of
life settlement brokers and, to a lesser extent, through insurance, financial
and estate planning professionals, through personal referrals and through
Internet and print media advertising. Brokers are typically
compensated based on a percentage of the face value of the policy sold and this
amount is negotiated between the policyholder and the broker. This
compensation is paid upon the closing of a settlement. Estate
planning professionals and financial planners typically operate on a
fee-for-service basis, which is paid directly by their client. We
have long-term relationships with many of the country’s life settlement brokers
and, for those that we transact business with, believe that these brokers adhere
to applicable regulatory requirements when conducting their
business. Broker referrals accounted for 99% of our total business as
measured by policy face value in each of fiscal 2010, 2009 and
2008. In fiscal 2010, only one broker made referrals whose policy
face values represented over 10% of our total business. Referrals
from this broker accounted for 15% of our total business. In fiscal
2009, we had three brokers with 10% or more of our total business and they
accounted for 44% of our total business. In fiscal 2008, we had three
brokers with 10% or more of our total business and they accounted for 69% of our
total business. We are encountering more brokers in the market and believe
that greater competition among brokers has reduced our supply concentration
risk.
We
categorize our purchasers of life settlements as either institutional or
retail. Institutional purchasers are typically investment funds
designed to acquire and hold life settlements. From the beginning of
fiscal 2008, we have acted as the purchasing agent for one institutional
fund, in which we have a $6.5 million investment as of February 28,
2010. The institutional fund has acquired policies through us having
a face value of $278 million. The institutional fund accounted
for 1%, 8% and 7% of our total revenues in fiscal 2010, 2009 and 2008,
respectively.
We have
pursued the sponsorship of two funds ourselves. In fiscal 2008, we
initiated a fund to raise from $20 million to $100 million to acquire policies,
but were not successful in obtaining sufficient subscriptions to close the
fund. The fund was structured as a limited partnership and we offered
the interests ourselves and through placing brokers in a private
placement. In fiscal 2010, we initiated a second fund to raise $10
million. This fund is also structured as a limited partnership, and
we are offering the interests ourselves and through placing brokers to a small
number of qualified investor in a private placement. The fund has not
closed and we cannot ensure that we will raise the required
capital. We have pursued the sponsorship of funds believing that
these funds will expand our retail efforts by affording purchasers an
alternative to the current retail model in which purchasers acquire direct
interests in policies. We believe that securities brokers are
accustomed to seeing investment products in a fund structure and their
familiarity with funds structures may increase broker interest. We
also believe the fund structure will aid market penetration by enabling us to
sell in states that treat life settlement transactions as securities, which
limits or blocks our ability to sell in those states.
The
majority of our clients are high net worth individuals, which we refer to as
retail purchasers. Our retail purchasers generally come to us through
a network of financial planners, whom we call licensees. We developed
this network through referrals and have long-standing relationships with most of
these financial planners. Although the financial planners can be
compensated through fee-based consultations paid by the purchaser, we compensate
most of the financial planners based on the amount invested. The
compensation of financial planners is paid in cash upon the closing date of the
transaction.
4
To
purchase a life settlement, a prospective retail purchaser typically submits a
purchaser application containing personal information such as the purchaser’s
name and address as well as affirmative representations establishing the
purchaser as financially sophisticated. A purchaser will also submit
an agency agreement and special power of attorney, which appoints us as a
limited agent of the purchaser to act on his or her behalf in purchasing a life
settlement. Unless specifically waived by a purchaser, the agency
agreement limits our authority to policies issued by an insurance carrier having
an A.M. Best Company rating of B+ or better and to policies beyond their
contestable period (generally two years or older). For most of the
policies that we broker on behalf of our clients, the insureds have a life
expectancy of between 48 months and 60 months, although we can identify policies
with longer life expectancies or other purchasing parameters if requested by our
clients. As we identify and qualify policies, we distribute insurance
and current medical status information on these policies (with the insured’s
name and other identifying information redacted) throughout our financial
planner network. We also make available to each purchaser, through
their financial planner, standard disclosures discussing the nature and risks of
making a life settlement purchase. Purchasers can then, in
consultation with their financial planner or other professionals, select one or
more policies, specify the portion of the policy or policies to be purchased and
submit a reservation electronically. To diversify their positions,
retail purchasers generally buy fractional interests in one or more policies and
not an entire policy, while institutional purchasers tend to purchase entire
policies. Prior to reserving an interest, purchasers mail or wire
funds for acquisition of the policies to an escrow agent and mail or
electronically deliver a policy funding agreement to us. The policy
funding agreement identifies the policy or policies to be purchased, the
acquisition price, the administrative services provided, and the escrow
arrangements for receipt and disbursement of funds.
For the
protection of the seller’s ownership interest and the purchaser’s monetary
interest, all transactions are closed through an outside escrow
agent. The escrow agent will close a purchase when it receives from
each purchaser executed policy funding agreements and the acquisition price for
a policy, verifies that the policy is in full force and effect and that no
security interest has attached to the policy, and receives a transfer of policy
ownership form acknowledged by the insurance company. The escrow
agent then pays the seller the offer price (net of fees and
costs). We send confirmation of the transaction to the purchaser as
well as a copy of the assignment documents.
After
closing the transaction, we generally hold title to the policy as nominee for
the purchaser. Responsibility for policy premium costs passes to the
purchaser, who typically funds the premium costs from the deposits with the
escrow agent. We strictly maintain the confidentiality of an
insured’s personal information in accordance with regulations promulgated by the
Texas Department of Insurance and other applicable state laws. A
purchaser will receive evidence of the transfer of ownership of the policy
(which identifies the insured), but will not receive contact information for the
insured, which is available only to licensed life settlement companies like
us. We perform certain ministerial functions, such as monitoring the
insured’s health status and notifying the escrow agent upon the insured’s
death. We also notify purchasers in instances in which the premium
escrow account has been exhausted so that the purchaser can replenish the
account to keep the policy from lapsing.
Conflicts of
Interest. Our business model can pose conflicts of interest,
which may arise when we purchase policies for our own account while purchasing
policies for others. Conflicts could arise between retail and
institutional purchasers if we were to favor one over the other. A
financial incentive to favor one over the other could exist if the compensation
that we earn is higher with one type of purchaser than the other or, in the case
of institutional purchasers, if we have a financial interest in the
institutional purchaser. We have pursued the sponsorship of funds
that would acquire policies. If we were to close a sponsored fund,
the fund would purchase interests in policies alongside with and on similar
terms as our retail clients and would not have a conflict of
interest. However, it is possible that retail clients and funds might
compete with institutional purchasers for policies and would pose conflicts of
interest.
We
believe that several factors mitigate the conflicts. We work to
ensure the neutral pricing of policies, that is, that policies are priced
according to the value and risk presented. If pricing is neutral,
there is no financial reason for favoring one policy over
another. One factor in policy pricing is assessing life expectancy,
which is determined in our model by an independent medical
doctor. Once we have the life expectancy, we apply a pricing formula
to determine the purchase price. Further, most sellers are
represented by experienced brokers, who know the market for
settlements. Another factor that reduces the impact of conflicts is
that policies are typically sold in pieces rather than in
whole. Thus, several purchasers participate side-by-side in a single
policy, which diminishes the risk that one purchaser might be favored over
another purchaser. The methods by which purchasers select policies
also reduce the potential for conflicts. Retail purchasers choose the
policies in which they wish to participate from the available policies posted on
our website. Institutional purchasers will typically set the
parameters of policies that they wish to acquire.
5
We also
avoid conflicts since we rarely compete against our retail or institutional
purchasers in acquiring policies. We purchased the bulk of the
policies for our own account as part of settlement agreements or tertiary
purchases, in which we acquired previously purchased policies because they were
no longer suitable for the purchasers. These were not opportunities
offered to our retail or institutional purchasers and thus we were not competing
with our purchasers. In the fiscal years 2010, 2009 and 2008, we
acquired 974 interests in policies for our own account, all but one of which was
a part of a settlement or a tertiary purchase. In the fiscal years
2010, 2009 and 2008, we also invested in one institutional fund, for which we
served as a purchasing agent. The fund has completed its acquisitions
of policies and is no longer purchasing. We supplied approximately
39% of the policies purchased by the fund, and its purchases from us were never
more than 8% of our revenues in any one year. Our compensation from
the fund was less than the compensation we typically earned on retail
purchases.
The Life Settlement Market and
Competition. Life settlements provide a secondary market for
existing life insurance policies that the owner no longer needs or wants and
that insure a person whose life expectancy can be reasonably
estimated. From the early 2000s through 2007, the market for life
settlements grew substantially from both the demand and the supply sides of the
transaction with an increase in the average face amount of policies presented
for sale. The larger amount of capital required to meet the higher
acquisition costs of the average life settlement led us to seek relationships
with institutional purchasers in addition to expanding our base of retail
clients and increasing the minimum investment amount. We have devoted
substantial marketing and client development resources to attracting both
individual and institutional purchasers, both directly and through their
advisors. The number of retail purchasers and the amount of their
average investment has increased over the last three fiscal years, providing us
with a significant market advantage by enabling us to reach the diversification
goals of our clients as well as giving us greater flexibility in purchasing
policies. Institutional purchasers have played a less significant
role in our business. In the fiscal years 2010, 2009 and 2008, we had
one institutional purchaser that accounted for 1%, 8%, and 7% of our revenues,
respectively. We believe that this market segment has potential,
however, and continue to seek institutional opportunities.
In a 2009
report, the insurance research group, Conning & Co. (the “Conning report”), estimated
that the life settlement industry completed $12 billion in face value of
transactions in 2007 and $11.8 billion in 2008. Based on our own
research from other providers, publicly reported data and estimates based on
historical data, we estimate the total amount of face value of transactions
completed by the life settlement industry in 2009 was $7.3
billion. The Conning report attributed the decline in market size
from 2007 to 2008 to the disruption of the credit markets in 2008. As
noted in the Conning report, estimates of market size are only approximations,
since precise market data is not available publicly. We are the only
publicly held company operating exclusively in this market. Some
competitors file publicly available transaction activity with state insurance
commissions. However, not every company may report its transactions
and the accuracy of the information relies on the veracity of the filings made
by each company.
Based on
our estimate of a $7.3 billion market in 2009, our market share is approximately
7%. Although the overall life settlement market contracted, which may
be attributable to the distress of the credit markets, our business model does
not use leverage and thus our market share grew from 6% in 2008 to 7% in 2009 as
there was less competition for quality policies. We believe the life
settlement market is highly diversified among market participants. We
estimate that our largest industry competitor currently has about 19% of the
total market share. Excluding ourselves and this large competitor,
the remaining 74% of the market is divided among approximately 30 other market
participants, of which only five have between 5 and 10% each of the total market
share. Unlike some of our competitors, which rely on the credit
markets and may have more restrictive purchasing parameters or a single provider
of investment capital, our retail oriented model has a broad base of over 25,000
clients. We believe this diversified model makes us more competitive
in the market and provides us with greater funding flexibility. We
also believe that this model provides a stronger platform for our sustainable
growth as a company. Markets are segmented by length of life
expectancy and policy face value. The amount of competition in these
markets varies according to the demand for such policies.
6
While we
believe the life settlement market overall will remain flat or increase slightly
during the next year, we believe our market share will continue to increase due
to a number of factors. First, market demand from our purchaser base
remains strong for these transactions. Unlike much of our
competition, we are not adversely affected by any restraint on
credit. The continued general economic uncertainty has led many
purchasers to seek alternative investment strategies that diversify their
portfolios and avoid economically sensitive investments. Life
settlements provide diversification and produce returns that are not correlated
to stock and bond market fluctuations, depressed real estate markets or the
currently uncertain credit market. We believe that interest from
retail and institutional purchasers will grow throughout the next fiscal
year.
A second
contributing factor as to why we believe our share of the life settlement market
may continue to increase is the solid supply of higher face value
policies. Because of increased education among financial
professionals and advisors, there is a growing awareness among policy owners of
the value that can be realized from life settlements. The growing
awareness has expanded the supply of eligible policies, especially policies with
higher face values. We believe much of our increased business over
the last three years is due to the steady supply of higher face value policies,
and we believe this trend will continue. We intend to increase our
market share by growing our client base and utilizing our substantial
intellectual capital and infrastructure to provide superior value to both
policyholders and our clients. Among our core competencies is the
ability to process and close transactions quickly and more efficiently than our
competitors. We believe our ability to deploy our assets into the
market in this manner will enable us to continue to increase our market
share.
Limited
access to capital, the insurance industry’s addition of pre-death cash benefits,
law enforcement pressure on companies operating illegally, and increasing
government regulation have contributed to a stabilization in the number and
sophistication of life settlement companies, both those purchasing for their own
accounts and those, like us, who act as agents for our clients. We
estimate the number of life settlement companies that are consistently active in
purchasing for their own account or as agents for purchasers has declined to
seven. We believe this reduction in the number of competitors results
from the withdrawal of companies that relied heavily on leverage and a single or
preferred client model in the face of tightened credit markets. In
contrast, our business model uses no leverage and is a multi-client
model. As credit markets tightened in 2008 and 2009, the number of
companies remaining in the market allowed us to see more policies and to be more
selective in the policies we chose. As a result, we were able to
realize higher revenues per settlement (policy) in each of fiscal 2008, 2009,
and 2010.
Although
we are one of the larger life settlement companies (based on face value of
policies settled), competition within the life settlement market is active among
the few companies in this sector and we will continue to experience competition
for qualified policies to purchase. This competition will have an
effect on the prices we pay for policies, the amount of brokerage and referral
fees we pay, and the prices we set for the acquisition of
policies. We believe the overall market for life settlements will
increase as more seniors become aware of their option to liquidate an unwanted
policy through a life settlement. In light of our experience in the
market and our estimates concerning competition and supply and demand for
policies, we believe our total business volume for life settlements will
increase in fiscal 2011.
The
following table shows the number of life settlement contracts (policies) we have
transacted, the aggregate face values and purchase prices of those contracts,
and the revenues we derived, for our last three fiscal years:
7
|
Fiscal 2010
|
Fiscal 2009
|
Fiscal 2008
|
||||||||||
|
Number
of settlements (policies)
|
201 | 196 | 200 | |||||||||
|
Face
value of policies
|
$ | 590,189,000 | $ | 693,715,000 | $ | 415,293,000 | ||||||
|
Average
revenue per settlement
|
$ | 562,171 | $ | 528,645 | $ | 363,046 | ||||||
|
Total
net revenues derived (1)
|
$ | 62,019,160 | $ | 54,420,577 | $ | 36,822,734 | ||||||
(1) The
revenues derived are exclusive of brokerage and referral
fees.
Industry
Regulation and Taxation
General. When the
life settlement market was first established, it was sparsely
regulated. Due in part to well-publicized abuses within the industry,
the federal government and various states moved to regulate the market in the
mid-1990s. These regulations generally took two forms. One
sought to apply consumer protection-type regulations to the
market. This application was designed to protect policyholders and
purchasers. Another sought to apply securities regulations to the
market, in an effort to protect purchasers. Various states have also
used their insurance regulations to guard against insurance fraud within the
industry.
Consumer Protection
Licensing. The consumer protection-type regulations arose
largely from the draft of a model law and regulations promulgated by the
National Association of Insurance Commissioners (“NAIC”). At least
40 states have now adopted some version of this model law or another form of
regulation governing life settlement companies in some way. These
laws generally require the licensing of providers and brokers, require the
filing and approval of settlement agreements and disclosure statements, describe
the content of disclosures that must be made to insureds and sellers, describe
various periodic reporting requirements for settlement companies and prohibit
certain business practices deemed to be abusive. Some of these laws
fix minimum payment levels that a purchaser must pay a selling insured based on
the insured’s life expectancy. The minimum payment requirements
generally apply when the insured is terminally ill or has a short life
expectancy (42 months or less). In our settlement transactions, we
typically deal with policies having life expectancies of 48 months or longer and
thus these requirements do not usually affect our settlement
transactions.
Licensing. Many
states require the licensing of life settlement brokers and providers, mandate
disclosures to sellers or purchasers or both, require periodic reporting
requirements, and set forth prohibited business practices. We are
licensed as a viatical and life settlement company by the Texas Department of
Insurance. Under the Texas requirements, we must file our transaction
documents with the state for approval, make certain disclosures to insureds and
sellers, offer a 15-day right of rescission to the seller, file certain annual
reports with the state, and abstain from unfair business
practices. Because all of our transactions are completed in Texas,
the Department of Insurance has jurisdiction to investigate complaints from any
insured or seller, regardless of the state in which that insured or seller
lives. Consequently, we believe Texas offers protection to all
insureds or policyholders that we transact business with (including those living
in states that have no licensing requirement). However, other states
have their own licensing requirements in order to purchase policies from policy
owners in those states and we comply with those requirements as
well. In addition to Texas, we are licensed to engage in life
settlement transactions with policy owners residing in the following states:
Arkansas, Connecticut, Illinois, Maryland, Mississippi, Nevada, New Jersey,
North Carolina, Oklahoma, Pennsylvania, Tennessee and Virginia. We
also have a license application pending in the state of New
York. Many other states have clearly identified exemptions from
licensing requirements, which permit us to purchase from policy owners in those
states according to those exemptions. Information about us is
available through the Texas Department of Insurance or on its website
at: https://apps.tdi.state.tx.us/pcci/pcci
_show_profile.jsp?tdiNum=8967842&company
Name=Life%20Partners,%20Inc.&sysTypeCode=PA.
8
Securities
Regulations. Some states and the Securities and Exchange
Commission have attempted to treat life settlements as securities under federal
or state securities laws. We have structured our settlement
transactions to reduce the risk that they would be treated as securities under
state or Federal securities law, and the Federal Circuit Court for the District
of Columbia has ruled that our settlement transactions are not securities under
the Federal securities laws. Many state securities laws have
exceptions or registration exemptions that may enable our settlement
transactions in those states. Nonetheless, we have encountered claims
from some states asserting that our transactions are securities under state
law. We have amicably settled these claims and have worked with
regulators to establish clear guidelines for accepting clients from these
states.
We
believe that a combination of consumer protection-type laws and existing
insurance regulations provide an appropriate framework for regulation of the
industry. As a practical matter, the widespread application of
securities laws would burden us and senior Americans attempting to sell their
policies with little or no benefit to purchasers. Each of our
purchasers has represented themselves to be financially sophisticated, high net
worth individuals or institutions, which have considerably less need for the
protections afforded by the securities laws. At this point, due to
the manner in which we structure our settlements and the availability, in some
instances, of exceptions and exemptions under securities laws, such laws have
not limited our business model to a significant extent. But we cannot
give assurance that our business would not be materially and adversely impacted
by securities-based regulation.
Insurance
Regulation. As a life settlement company, we facilitate the
transfer of ownership in life insurance policies, but do not participate in the
issuance of policies. Further, we do not issue any type of
contemporaneous agreement to purchase a policy at the time the policy is
issued. As such, we are not required to be licensed as an insurance
company or insurance broker. We do deal, however, with insurance
companies and professionals in our business and are affected indirectly by the
regulations covering them. The insurance industry is highly
regulated, and these regulations affect us in numerous ways. We must
understand the regulations as they apply to policy terms and provisions and the
entitlement to, and collectability of, policy benefits. We rely upon
the protections against fraudulent conduct that these regulations offer, and we
rely upon the licensing of companies and individuals with whom we do
business.
Employees
As of
February 28, 2010, we had 62 direct employees, none of whom are represented
by a labor union, as well as 6,392 licensees who act as independent contractors
and refer clients to us for the purchase of life settlements. We
continuously review benefits and other matters of interest to our employees and
consider our employee relations to be satisfactory.
More
about Life Partners
Our
executive offices are located at 204 Woodhew Drive, Waco, Texas 76712 and our
telephone number is 254-751-7797. Our corporate information website
is www.lphi.com. We make available without charge our annual report
on Form 10-K, our quarterly reports on Form 10-Q, current reports on
Form 8-K, and amendments to these reports shortly after we file these
reports with the SEC. Our informational website for potential sellers
and purchasers is www.lifepartnersinc.com.
Item
1A. Risk Factors
In
addition to other information in this annual report on Form 10-K, the
following risk factors should be carefully considered in evaluating us and our
business. Such factors significantly affect or could significantly
affect our business, operating results or financial condition. This
annual report on Form 10-K contains forward-looking statements that have
been made pursuant to the provisions of the Private Securities Litigation Reform
Act of 1995. Actual results could differ materially from those
projected in the forward-looking statements as a result of the risk factors set
forth below and elsewhere in this annual report on
Form 10-K.
9
Growth
in the life settlement market may be affected by several factors
Growth of
the life settlement market and our expansion within the market may be affected
by a variety of factors, including:
|
|
·
|
The
inability to identify sufficient numbers of qualified policies to meet
demand;
|
|
|
·
|
The
inability to convince potential sellers of the benefits of life
settlements;
|
|
|
·
|
The
inability to attract sufficient qualified
purchasers;
|
|
|
·
|
Competition
from other life settlement
companies;
|
|
|
·
|
The
occurrence of illegal or abusive business practices resulting in negative
publicity about the market; and
|
|
|
·
|
The
adoption of overly burdensome governmental
regulation.
|
In
addition, the life settlement market may evolve in ways we have not anticipated
and we may be unable to respond in a timely or cost-effective
manner. If the life settlement market fails to grow as quickly as or
in the directions we have anticipated, our business, financial condition and
results of operations would be materially adversely affected as it relates to
our large-scale growth.
Our
success depends on maintaining relationships within our referral
networks
We rely
primarily upon brokers to refer potential sellers of policies to us and upon
financial professionals, known as licensees, to refer retail purchasers to
us. These relationships are essential to our operations and we must
maintain these relationships to be successful. We do not have fixed
contractual arrangements with life settlement brokers and they are free to do
business with our competitors. Our network of licensees is much
broader, but no less important. Our ability to build and maintain
relationships with our licensees will depend upon our closing rates, the value
we bring to our retail clients and the level of compensation we pay to the
referring professional. The compensation paid to the referring
professional will affect the offer price to the seller and the compensation we
receive. We must balance these interests successfully to build our referring
network and attain greater profitability.
Our
purchasers depend on our ability to predict life expectancies and set
appropriate prices; if our investment returns are not competitive, we may lose
purchasers
A
purchaser’s investment return from a life settlement depends on three factors:
the difference between the policy face amount and purchaser’s cost basis
(consisting of the acquisition cost and premiums paid to maintain the policy),
the length of the holding period, and the demise of the insured. We
price settlements based on the policy face amount, the anticipated life
expectancy of an insured and policy maintenance costs. Life
expectancies are estimated generally from standard medical and actuarial data
based on the historical experiences of similarly situated
persons. The data is based necessarily on averages involving
mortality and morbidity statistics. The outcome of a single
settlement may vary significantly from the statistical average. It is
impossible to predict any one insured’s life expectancy exactly. To
mitigate the risk that an insured will outlive his or her predicted life
expectancy, we price life settlements to yield competitive returns even if this
life expectancy prediction is exceeded by several years. In addition,
life settlement purchasers must be able to bear a non-liquid investment for an
indeterminate period.
10
If we
underestimate the average life expectancies and price our transactions too high,
our purchasers will realize smaller returns, demand may fall, and purchasers may
invest their funds elsewhere. In addition, amounts escrowed for
premiums may be insufficient to keep the policy in force, requiring purchasers
to invest further proceeds to pay these additional premiums. If we
overestimate the average life expectancies, the settlement prices we offer will
fall below market levels, supply will decrease, and sellers may engage in
business with our competitors or pursue other alternatives. Our
ability to accurately predict life expectancies and price accordingly is
affected by a number of factors, including:
|
|
·
|
The
accuracy of our life expectancy estimations, which must sufficiently
account for factors including an insured’s age, medical condition, life
habits (such as smoking), and geographic
location;
|
|
|
·
|
Our
ability to anticipate and adjust for trends, such as advances in medical
treatments, that affect life expectancy data;
and
|
|
|
·
|
Our
ability to balance competing interests when pricing settlements, such as
the amounts paid to policy sellers, the acquisition costs paid by
purchasers, and the compensation paid to ourselves and our referral
networks.
|
To
support our pricing systems, we use both in-house and outside specialists,
including medical doctors and published actuarial data. We cannot
assure purchasers that, despite our experience in settlement pricing, we will
not err by underestimating or overestimating average life expectancies or
miscalculating reserve amounts for future premiums. If we do so, we
could lose purchasers or policy sellers, and those losses could have a material
adverse effect on our business, financial condition, and results of
operations.
Government
regulation could negatively impact our business
We are
licensed and regulated by the Texas Department of Insurance as a viatical and
life settlement company and hold licenses as a life settlement provider in other
states as well. State laws requiring the licensing of life settlement
providers govern many aspects of our conduct, operations, advertising and
disclosures. The laws may vary from state to state, however, and our
activities and those of brokers with whom we do business can be affected by
changes in these laws or different interpretations of these laws. In
addition, some states and the Securities and Exchange Commission treat certain
life settlements as securities under state and federal securities
laws. We have legal precedent holding that our settlements are not
securities under the Federal securities laws. Possible exceptions or
registration exemptions may be available to us under many state securities
laws. As a result, we do not believe that the application of state or
Federal securities laws will have a material adverse effect on our
operations. Nonetheless, we have encountered claims from states that
our transactions are securities under state law and subject to
registration. We have settled all of these claims amicably and with
clear direction as to how we may accept clients from these
states. However, we cannot assure you that other securities
regulators or private individuals will not attempt to apply the securities laws
to our settlements or that defending such attempts would not have a material
adverse effect on our business. Further, changes in laws or
governmental regulation could affect our brokers or clients, which could have a
material adverse effect on our business.
Our
Chairman and Chief Executive Officer beneficially owns 50% of our common stock
and, as a result, can exercise significant influence over us
Under SEC
regulations, Mr. Brian D. Pardo, our Chairman and Chief Executive Officer, is
considered the beneficial owner of approximately 50% of our common stock,
largely as the result of exercising voting power by proxy over shares held by
The Pardo Family Trust. He will be able to control most matters
requiring approval by our shareholders, including the election of directors and
approval of significant corporate transactions. His voting control
affects indirectly the process for nominating directors, since theoretically he
could nominate and elect directors without board involvement. This
concentration of ownership may also have the effect of delaying or preventing a
change in control of Life Partners, which in turn could have a material adverse
effect on the market price of our common stock or prevent our shareholders from
realizing a premium over the market price for their shares of common stock.
11
Item
1B. Unresolved Staff Comments
We have
not received within 180 days before February 28, 2010, written comments from the
Securities and Exchange Commission regarding our periodic or current reports
under the Securities and Exchange Act of 1934, as amended, that remain
unresolved.
Item
2. Properties
Our
corporate offices are located at 204 Woodhew Drive in Waco, Texas. We
own two buildings on adjacent lots at this location and our offices occupy both
buildings, which together total 24,000 square feet. One building was
built in 1985 and the other in 1986.
Item
3. Legal Proceedings
During
the fiscal years ended February 28, 2010, 2009, and February 29, 2008,
we incurred settlement expenses of $3,615,726, $1,382,140 and $173,954,
respectively, for the resolution of litigation or potential
litigation. In fiscal 2010, the biggest settlements were for the
Maxim and State of Texas cases discussed below. We also settled a
case in Florida for $770,000. In some instances, we have repurchased
interests in policies to settle claims. In these cases, only the
excess (if any) of the settlement payment over the investment cost of the
repurchased policy interest is charged to settlement expense. The
balance is recorded on our balance sheet as an asset under “Investments in
policies” and the cash expenditure is recorded on our cash flow statement under
“Purchase of policies for investment purposes and capitalized
premiums”.
On April
12, 2010, we entered into a settlement agreement with Maxim Group, LLC, an
investment firm, to settle all claims in a civil action filed in
2007. Under the settlement, we agreed to deliver to Maxim 56,230
shares of our common stock, which were held in treasury, and which were valued
for settlement purposes at $1.25 million ($22.23 per share). The
fairness of this share delivery was affirmed by the court in a fairness hearing,
which was conducted on April 13, 2010. The court’s affirmation
enabled the shares to qualify for exemption from registration under Section
3(a)(10) of the Securities Act of 1933, as amended. The cost of
settlement was accrued in our consolidated financial statements as of February
28, 2010. The settlement cost had no effect on our cash position as
of February 28, 2010. The delivered treasury shares will be
shown as issued and outstanding in the fiscal quarter ending May 31,
2010.
On April
24, 2001, the state of Texas initiated a suit against LPI for alleged violations
of the Texas Deceptive Trade Practices Act (“DTPA”). The State
claimed that the contracts LPI used with purchasers before 1998 did not clearly
state that the purchasers were responsible for paying premiums to keep life
insurance policies purchased in force and that LPI had violated the DTPA by
requesting premiums from purchasers. LPI contended that the
purchasers of the policy interests were responsible to pay premiums, as they
were the owners of the policies. The trial court issued a summary
judgment in favor of LPI, which was appealed by the State. After a
lengthy appeals process, the matter was remanded back to the trial court and the
LPI and the State agreed to settle the matter by entering into an Assurance of
Voluntary Compliance (“AVC”) agreement, which was
filed with the court on April 1, 2010. Under the AVC, both parties
stipulate that the action relates only to certain contracts used with Texas
purchasers before 1998. The AVC further stipulates that the Attorney
General did not allege that LPI miscalculated escrow accounts or that it
committed any crime, fraud, misappropriation or malfeasance regarding escrow
accounts. Under the terms of the AVC, LPI agrees not to request any
further premium payments from the Texas purchasers identified in the AVC, to pay
future premiums on their behalf, estimated at $32,162 annually, and to pay
settlement costs totaling $300,000. By entering into the AVC, both
parties agree to release and discharge each other from any and all claims for
damages or other relief arising out of the action and we consider this matter to
be completely resolved and settled.
12
On May 6,
2010, we settled an administrative case with the Virginia State Corporation
Commission, which provides for a “safe harbor” of procedures and disclosures
that will permit us to accept Virginia residents as purchasers within a clearly
defined regulatory structure. The estimated cost of this settlement
of $170,000 was accrued in our consolidated financial statements as of February
28, 2010.
We are
subject to other legal proceedings in the ordinary course of
business. When we determine that an unfavorable outcome is probable
and the amount of the loss can be reasonably estimated, we reserve for such
losses. Except as discussed above: (i) management
has not concluded that it is probable that a loss has been incurred in any of
our pending litigation; (ii) management is unable to estimate the possible
loss or range of loss that could result from an unfavorable outcome of any
pending litigation; and (iii) accordingly, management has not provided any
amounts in the consolidated financial statements for unfavorable outcomes, if
any.
It is
possible that our consolidated results of operations, cash flows or financial
position could be materially affected in a particular fiscal quarter or fiscal
year by an unfavorable outcome or settlement of any pending
litigation. Nevertheless, although litigation is subject to
uncertainty, management believes and we have been so advised by counsel handling
the respective cases, that we have a number of valid claims and defenses in all
pending litigation to which we are a party, as well as valid bases for appeal of
adverse verdicts against us. All such cases are, and will continue to
be, vigorously defended and all valid counterclaims pursued. However,
we may enter into settlement discussions in particular cases if we believe it is
in the best interests of our shareholders to do so.
Market
Information
Our
common stock is traded on the Nasdaq Global Select Market under the symbol
LPHI. On April 30, 2010, there were approximately 93 shareholders of
record of our Common Stock. Most of our common stock is held
beneficially in “street name” through various securities brokers, dealers and
registered clearing agencies. We believe that there are approximately
8,920 beneficial owners of shares of our common stock who hold in street
name.
The
following table reflects the high and low sales prices of our common stock for
each quarterly period during the last two fiscal years (adjusted for February 6,
2009 stock split):
13
|
High
|
Low
|
Cash
Dividends
|
||||||||||
|
Year
Ended 2/28/09
|
||||||||||||
|
First
Quarter
|
$ | 17.56 | $ | 9.66 | $ | .0700 | ||||||
|
Second
Quarter
|
$ | 23.33 | $ | 14.69 | $ | .0700 | ||||||
|
Third
Quarter
|
$ | 33.81 | $ | 17.06 | $ | .0800 | ||||||
|
Fourth
Quarter
|
$ | 36.06 | $ | 14.89 | $ | .0700 | ||||||
|
Year
Ended 2/28/10
|
||||||||||||
|
First
Quarter
|
$ | 20.33 | $ | 13.92 | $ | .3200 | ||||||
|
Second
Quarter
|
$ | 21.77 | $ | 13.61 | $ | .2500 | ||||||
|
Third
Quarter
|
$ | 19.50 | $ | 15.65 | $ | .2500 | ||||||
|
Fourth
Quarter
|
$ | 22.58 | $ | 18.59 | $ | .2500 | ||||||
On May 3,
2010, the last reported sale price of our common stock on The Nasdaq Global
Select Market was $23.39 per share. Our total share volume for April
2010 was 2,398,200 shares compared to 3,968,900 shares for the same period last
year.
Dividends
We paid
common stock dividends of $1.07 per share in fiscal 2010 and $0.29 per share in
fiscal 2009. The dividend declared by the Board of Directors has been
at least $0.05 per share in each quarter since March 1, 2005.
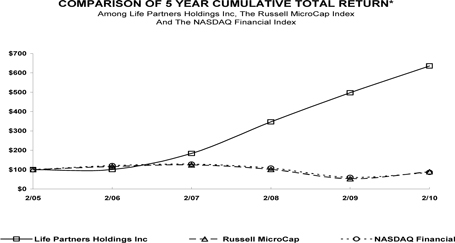
Performance
Graph
The line
graph below compares the cumulative total shareholder return on our Common Stock
for the last five fiscal years with cumulative total return on the Russell
MicroCap Index and the Nasdaq Financial Index. This graph assumes a
$100 investment in each of Life Partners Holdings, Inc., the Russell Microcap
Index and the Nasdaq Financial Index at the close of trading on
February 28, 2005, and also assumes the reinvestment of all
dividends. The points represent fiscal year-end levels based on the
last trading day in each fiscal year. Return information is
historical and not necessarily indicative of future performance.
14
|
As of February 28/29,
|
||||||||||||||||||||||||
|
2005
|
2006
|
2007
|
2008
|
2009
|
2010
|
|||||||||||||||||||
|
Life
Partners
|
$ | 100 | $ | 101 | $ | 184 | $ | 347 | $ | 497 | $ | 635 | ||||||||||||
|
Russell
Microcap Index
|
$ | 100 | $ | 116 | $ | 124 | $ | 101 | $ | 53 | $ | 89 | ||||||||||||
|
Nasdaq
Financial Index
|
$ | 100 | $ | 121 | $ | 128 | $ | 108 | $ | 60 | $ | 86 | ||||||||||||
We
selected these indices because they include companies with similar market
capitalizations to ours. We believe these are the most appropriate
comparisons since we are the only publicly traded company operating exclusively
in the life settlement industry and have no comparable industry “peer”
group.
The
performance graph above is being furnished solely to accompany this Annual
Report on Form 10-K pursuant to Item 201(e) of Regulation S-K, is not being
filed for purposes of Section 18 of the Securities Exchange Act of 1934, as
amended, and is not to be incorporated by reference into any of our filings,
whether made before or after the date hereof, regardless of any general
incorporation language in such filing.
Recent
Sales of Unregistered Securities
In April
2007, we issued 78,125 shares upon exercise of a stock option at $3.84 per share
($300,000 total). The shares were issued to a single individual in
reliance on the exemption afforded by Section 4(2) under the Securities Act
and under a similar private offering exemption under the applicable state
securities laws.
Securities
Authorized for Issuance under Equity Compensation Plans
We have
no outstanding options or shares subject to options or other purchase rights
authorized, but not outstanding.
Our
Purchases of Our Equity Securities
We made
no purchases of our equity securities during our fiscal year ended
February 28, 2010.
The
following table sets forth certain information concerning our consolidated
financial condition, operating results, and key operating ratios for the dates
and periods indicated. This information does not purport to be
complete, and should be read in conjunction with “Management's Discussion and
Analysis of Financial Condition and Results of Operations” and our Consolidated
Financial Statements and Notes thereto.
|
Year
Ended February 28/29,
(millions, except per share
information)
|
||||||||||||||||||||
|
2010
|
2009
|
2008
|
2007
|
2006
|
||||||||||||||||
|
Operating
Results
|
||||||||||||||||||||
|
Revenues
|
$ | 113.0 | $ | 103.6 | $ | 72.6 | $ | 29.8 | $ | 20.1 | ||||||||||
|
Income
from Operations
|
$ | 47.4 | $ | 40.5 | $ | 27.3 | $ | 4.1 | $ | 1.2 | ||||||||||
|
Pre-tax
Income
|
$ | 47.7 | $ | 42.2 | $ | 28.8 | $ | 4.9 | $ | 2.2 | ||||||||||
|
Net
Income
|
$ | 29.4 | $ | 27.2 | $ | 18.8 | $ | 3.4 | $ | 1.1 | ||||||||||
15
|
Year
Ended February 28/29,
(millions, except per share
information)
|
||||||||||||||||||||
|
2010
|
2009
|
2008
|
2007
|
2006
|
||||||||||||||||
|
Balance
Sheet Data at Fiscal Year End
|
||||||||||||||||||||
|
Current
Assets
|
$ | 37.9 | $ | 29.2 | $ | 20.9 | $ | 8.7 | $ | 4.3 | ||||||||||
|
Current
Liabilities
|
$ | 12.3 | $ | 7.6 | $ | 8.0 | $ | 8.5 | $ | 6.0 | ||||||||||
|
Working
Capital
|
$ | 25.6 | $ | 21.6 | $ | 12.9 | $ | .2 | $ | (1.7 | ) | |||||||||
|
Total
Assets
|
$ | 72.7 | $ | 52.4 | $ | 31.9 | $ | 16.6 | $ | 12.0 | ||||||||||
|
Total
Liabilities
|
$ | 12.9 | $ | 8.4 | $ | 9.1 | $ | 8.9 | $ | 6.8 | ||||||||||
|
Shareholders’
Equity
|
$ | 59.8 | $ | 44.0 | $ | 22.8 | $ | 7.7 | $ | 5.2 | ||||||||||
|
Return
on Assets
|
47.0 | % | 64.5 | % | 77.4 | % | 23.5 | % | 10.3 | % | ||||||||||
|
Return
on Equity
|
56.7 | % | 81.3 | % | 123.1 | % | 51.9 | % | 19.9 | % | ||||||||||
|
Per
Share Data(1)
|
||||||||||||||||||||
|
Earnings
Per Share
|
$ | 1.98 | $ | 1.83 | $ | 1.25 | $ | 0.23 | $ | 0.08 | ||||||||||
|
Dividends
Per Share
|
$ | 1.07 | $ | 0.29 | $ | 0.25 | $ | 0.21 | $ | 0.20 | ||||||||||
|
Financial
Ratios
|
||||||||||||||||||||
|
Current
Ratio
|
3.1
: 1
|
3.8
: 1
|
2.6
: 1
|
1.0
: 1
|
0.7
: 1
|
|||||||||||||||
|
Quick
Ratio
|
3.1
: 1
|
3.8
: 1
|
2.6
: 1
|
1.0
: 1
|
0.7
: 1
|
|||||||||||||||
(1)
Earnings per share data is restated for the fiscal 2008 and 2009 stock
splits.
Item
7. Management’s Discussion and Analysis of Financial Condition and
Results of Operations
Special
Note: Certain statements set forth below under this caption constitute
“forward-looking statements” within the meaning of the Private Securities
Litigation Reform Act of 1995. See Special Note Regarding
Forward-Looking Statements for additional factors relating to such
statements.
We
provide the following discussion to assist in understanding our financial
position as of February 28, 2010, and results of operations for the years
ended February 28, 2010, 2009, and February 29, 2008. As
you read this discussion, refer to our Consolidated Financial Statements and
Notes thereto. We analyze and explain the differences between periods
in the material line items of these statements.
Critical
Accounting Estimates, Assumptions and Policies
Our
discussion and analysis of financial condition and results of operations are
based on our Consolidated Financial Statements that were prepared in accordance
with accounting principles generally accepted in the United States of
America. To guide our preparation, we follow accounting policies,
some of which represent critical accounting policies as defined by the
SEC. The SEC defines critical accounting policies as those that are
both most important to the portrayal of a company’s financial condition and
results and require management’s most difficult, subjective, or complex
judgment, often as a result of the need to make estimates about the effect of
matters that are inherently uncertain and may change in subsequent
periods. Certain accounting estimates involve significant judgments,
assumptions and estimates by management that may have a material impact on the
carrying value of certain assets and liabilities, disclosures of contingent
liabilities, and the reported amounts of income and expenses during the
reporting period that management considers to be critical accounting
estimates. The judgments, assumptions and estimates used by
management are based on historical experience, management’s experience,
knowledge of the accounts and other factors that are believed to be
reasonable. Because of the nature of the judgments and assumptions
made by management, actual results may differ materially from these judgments
and estimates, which could have a material impact on the carrying values of our
assets and liabilities and the results of our operations. Areas
affected by our estimates and assumptions are identified below.
16
We
recognize income at the time a settlement closes and the purchaser has obligated
itself to make the purchase. We defer $100 per life settlement to
cover minor monitoring services provided subsequent to the settlement
date. We amortize this deferred cost over the anticipated life
expectancy of the insureds.
We
sometimes make short-term advances to facilitate a life settlement
transaction. These amounts are included in “Accounts
receivable – trade”, and are collected as the life settlement transactions
close. All amounts are considered collectible as we are repaid the
advance before any of the other parties involved in the transaction receive
funds.
We follow
the guidance contained in ASC 325-30, Investments in Insurance
Contracts, to account for our investments in life settlement
contracts. ASC 325-30 states that a purchaser may elect to account
for its investments in life settlement contracts using either the investment
method or the fair value method. The election is made on an
instrument-by instrument basis and is irrevocable. Under the
investment method, a purchaser recognizes the initial investment at the purchase
price plus all initial direct costs. Continuing costs (e.g., policy
premiums and direct external costs, if any) to keep the policy in force are
capitalized. Under the fair value method, a purchaser recognizes the
initial investment at the purchase price. In subsequent periods, the
purchaser re-measures the investment at fair value in its entirety at each
reporting period and recognizes changes in fair value earnings (or other
performance indicators for entities that do not report earnings) in the period
in which the changes occur. We elected to value our investments in
life settlement contracts using the investment method. As of
February 28, 2010, our investments in life settlements held for our own
account were carried at $16,460,353.
We
establish litigation and policy analysis loss accruals based on our best
estimates as to the ultimate outcome of contingent liabilities. This
loss analysis is necessary to properly match current expenses to currently
recognized revenues and to recognize that there is a certain amount of liability
associated with litigation and policy losses. Through these accruals,
we recognize the estimated cost to settle pending litigation as an
expense. These estimates are reviewed on a quarterly basis and
adjusted to management’s best estimate of the anticipated liability on a
case-by-case basis. A high degree of judgment is required in
determining these estimated accrual amounts since the outcomes are affected by
numerous factors, many of which are beyond our control. As a result,
there is a risk that the estimates of future litigation and policy analysis loss
costs could differ from our currently estimated amounts. Any
difference between estimates and actual final outcomes could have a material
impact on our financial statements.
We must
make estimates of the collectability of accounts and notes receivable and
premium advances. The accounts associated with these areas are
critical to recognizing the correct amount of revenue and expenses in the proper
period. Within the last quarter of fiscal 2010, issues have been
resolved which have enabled us to better estimate the collectability of premium
advances. The agreement with the State of Texas allowed us to
specifically identify a class of investors for whom we made premium advances,
and which, under the terms of the agreement, will be
uncollectible. Our historical success of collecting premium advances
has enabled us to build a body of evidence by which we can demonstrate full
collectability of the remaining balance of advanced premiums.
17
We review
the carrying value of our property and equipment for impairment whenever events
and circumstances indicate that the carrying value of an asset may not be
recoverable from the estimated future cash flows expected to result from its use
and eventual disposition. In cases where undiscounted expected future
cash flows are less than the carrying value, an impairment loss is recognized
equal to an amount by which the carrying value exceeds the fair value of
assets. The factors considered by management in performing this
assessment includes current operating results, trends and prospects, the manner
in which the property is used, and the effects of obsolescence, demand,
competition and other economic factors. Based on this assessment,
there was no impairment during fiscal years 2010, 2009 and 2008.
We must
evaluate the useful lives of our property and equipment to assure that an
adequate amount of depreciation is being charged to
operations. Useful lives are based generally on specific knowledge of
an asset’s life in combination with the Internal Revenue Service rules and
guidelines for depreciable lives for specific types of assets.
We are
required to estimate our income taxes. This process involves
estimating our current tax exposure together with assessing temporary
differences resulting from differing treatment of items for tax and accounting
purposes. These differences result in deferred tax assets and
liabilities. We must then assess the likelihood that our deferred tax
assets will be recovered from future taxable income, and, to the extent we
believe that recovery is not likely, we must establish a valuation
allowance. To the extent we establish a valuation allowance or
increase this allowance in a period, we must include a tax provision or reduce
our tax benefit in the statements of income. We use our judgment to
determine our provision or benefit for income taxes, deferred tax assets and
liabilities and any valuation allowance recorded against our net deferred tax
assets.
We cannot
predict what future laws and regulations might be passed that could have a
material effect on our results of operations. We assess the impact of
significant changes in laws and regulations on a regular basis and update the
assumptions and estimates used to prepare our financial statements when we deem
it necessary.
We have
not made any material changes to our critical accounting estimates or
assumptions or the judgments affecting the application of those estimates or
assumptions. We discuss our significant accounting policies,
including those policies that are not critical, in Note 2 of our
Consolidated Financial Statements.
New
Accounting Pronouncements
Recent
accounting pronouncements have been issued including ASC 320, 810, 815, 820,
825, 855, 958-320 and ASC 946-10-15-2 (ASU 2009-12). For a discussion
of these pronouncements, refer to Footnote 3 of our Consolidated Financial
Statements.
Life
Partners
We are
the world’s oldest and only publicly traded company operating exclusively in the
life settlement industry. Our revenues are primarily derived from
fees associated with facilitating life settlement transactions.
18
Comparison
of Years Ended February 28, 2010, 2009, and February 29,
2008
We had
net income of $29,426,278 for the year ended February 28, 2010 (“fiscal 2010”), compared to
net income of $27,159,116 for the year ended February 28, 2009 (“fiscal 2009”), and
$18,756,271 for the year ended February 29, 2008 (“fiscal 2008”). The
8.3% increase in net income in fiscal 2010 is attributable primarily to a 9.1%
increase in revenues and our ability to increase our operating margins by
remaining highly selective in our purchasing strategies, resulting in a 14.0%
increase in revenues net of brokerage and licensee fees. The increase
in revenues, net of brokerage fees, together with the large decrease in the
allowance account for premium advances, resulted in an increase in income from
operations of 17.1%. The 44.8% increase in net income in fiscal 2009
was attributable to a 42.7% increase in revenues and a 47.8% increase in
revenues net of brokerage and licensee fees. The large increase in
revenues, net of brokerage fees, resulted in an increase in income from
operations of 48.6%. Legal and professional costs were $1,311,637,
$1,839,782 and $1,660,176 in fiscal 2010, 2009 and 2008, respectively, and after
executive and employee bonuses and payroll, comprised the largest single general
and administrative expense. The legal and professional costs were
attributable primarily to legal costs associated with the administrative case by
the state of Virginia, our audit and tax preparation fees, our SEC filings, the
lawsuit with the state of Texas, defending ourselves in the arbitration against
a former investment banking firm, and other legal matters as they
arise. See Item 3,
Legal Proceedings.
Revenues – Revenues increased
by $9,381,843, or 9.1%, from $103,614,440 in fiscal 2009 to $112,996,283 in
fiscal 2010. This increase was due primarily to the increased number
of settlements, from 196 in fiscal 2009 to 201 in fiscal 2010. There
was also a 6.3% increase in the average revenue per settlement, increasing from
$528,645 in fiscal 2009 to $562,171 in fiscal 2010, as we continued our trend of
brokering larger face value policies at higher margins. Our revenues
increased at a slower rate than in previous years as institutional sales
declined, leaving retail sales as our primary source of
revenue. Revenues increased $31,005,185, or 42.7%, from $72,609,255
in fiscal 2008 to $103,614,440 in fiscal 2009. While the number
of settlements we transacted in fiscal 2009 decreased by 2.0% from fiscal 2008,
from 200 to 196, our average revenue per settlement increased 45.6%, from
$363,046 in fiscal 2008 to $528,645 in fiscal 2009. The increase in
revenue per settlement resulted from brokering larger face value
policies.
During
the periods, despite the global economic recession, demand for our services
remained strong and the number of policies presented to us and meeting our
purchasing qualifications remained constant. We continue to see a
supply of policies with higher face values that meet our purchasing parameters
and we anticipate this supply trend to continue for the foreseeable
future. Most of our competitors have adopted a single or preferred
client business model, which relies on a relatively narrow purchaser
base. In contrast, we employ a broad based, multi-client business
model and our purchaser base is much broader. While a single
purchaser may account for a substantial share of revenues during a particular
quarterly period, we do not intend to become reliant upon any single purchaser
and expect that no single purchaser will account for a substantial share of
revenues during the long-term. We believe this business model will
permit us to achieve sustainable growth for the foreseeable future, without the
risks associated with a single or limited number of clients.
We
believe the increasing demand for our services results from several factors, one
of which is an investment trend toward diversifying investment portfolios and
avoiding economically sensitive investments. Returns on life
settlements are linked to the lives of the insureds. As such,
settlements function independently from, and are not correlated to, traditional
equity and debt markets and commodity investments. We benefit from
the investment community searching for returns higher than what is currently
available in the traditional marketplace. Although we serve both
domestic and foreign purchasers, domestic purchasers accounted for approximately
99% of our business in fiscal 2010. In fiscal years 2009 and 2008,
the ratio was approximately 80% domestic and 20% foreign. This
decline is due to a large foreign institution reducing its purchases of life
settlements.
Another
contributing factor has been the greater supply of higher face value
policies. We believe there is a growing awareness of the secondary
market for insurance policies among potential sellers, especially for those with
higher face value policies. This growing awareness has resulted in an
expansion of the supply of eligible policies, in particular higher face value
policies. We believe much of our increased business is due to the
greater supply of higher face value policies, and we believe this trend will
continue.
19
Brokerage and Referral Fees –
Brokerage and referral fees increased 3.6%, or $1,783,260, from $49,193,863 in
fiscal 2009 to $50,977,123 in fiscal 2010. Brokerage and referral
fees increased 37.5%, or $13,407,342, from $35,786,521 in fiscal 2008 to
$49,193,863 in fiscal 2009. Brokerage and referral fees constituted
45.1% of revenues in fiscal 2010 compared to 47.5% in fiscal 2009 and 49.3% in
fiscal 2008. Due to an increase in the number of brokers in the
market that are presenting policies to us, we have noted a substantial reduction
in the concentration of brokers that provide policies. In fiscal
2010, 2009 and 2008, broker referrals accounted for 99% of the total face value
of policies transacted. Policies presented from one broker
represented more than 10% of all completed transactions in fiscal 2010, at
15%. In fiscal 2009, policies presented from three brokers who
each represented more than 10% of all completed transactions totaled 44% of the
total face value. In fiscal 2008, policies presented from three
brokers who each represented more than 10% of all completed transactions totaled
69% of the total face value.
Brokerage
and referral fees generally increase or decrease with revenues, face values of
policies transacted and the volume of transactions, although the exact ratio may
vary according to a number of factors. Brokers may adjust their fees
with the individual policyholders whom they represent. In some
instances, several brokers may compete for representation of the same seller,
which will result in lower broker fees. Referral fees also vary
depending on factors such as varying contractual obligations, market demand for
a particular kind of policy or life expectancy category and individual
agreements between clients and their referring financial planners. No
broker fees are paid when a policy owner is not represented by a broker and
presents a policy to us directly.
Many
states now license life settlement brokerage activity, which may result in the
capping of fees or the increased disclosure of fees, either of which would tend
to lower the fees.
Operating Expense – General
and administrative expenses increased by 15.1%, or $1,620,401, from $10,747,398
in fiscal 2009 to $12,367,799 in fiscal 2010. General and
administrative expenses increased 32.8%, or $2,656,577, from $8,090,821 in
fiscal 2008 to $10,747,398 in fiscal 2009. Premium advances in fiscal
2010 were a negative $1,715,265 as the allowance account for premium advances
was reduced. Premium advances, net of reimbursements, were $1,444,476
and $978,767 in fiscal years 2009 and 2008, respectively. Executive
and employee bonuses increased $865,815 from $2,287,955 in fiscal 2009 to
$3,153,770 in fiscal 2010. Executive and employee bonuses increased
$966,715 from $1,321,240 in fiscal 2008 to $2,287,955 in fiscal
2009. Increased payments in both years are a direct result of our
increased profitability, which is linked to executive compensation plans and
bonuses given to all employees.
Also
included in fiscal 2010 general and administrative expenses are legal and
professional expenses of $1,311,637 primarily associated with legal actions with
the states of Colorado, Virginia, Florida and Texas, and in defending ourselves
in the M. Smith and Maxim cases. This compares favorably with legal
and professional expenses $1,839,782 in fiscal 2009 and $1,660,176 in fiscal
2008. We have settled all material actions and believe our legal and
professional expenses will further decline in fiscal 2011. See Item 3, Legal
Proceedings.
For
various legal actions or claims in which we believe we might incur liability, we
paid non-recurring settlement expenses of $3,615,726 in fiscal 2010 compared to
$1,382,140 in fiscal 2009 and $173,954 in fiscal 2008. A significant
portion of the settlement expense was the result of settlements with Maxim for
$1,250,000 of treasury stock and the state of Florida for $770,000.
We make
advances on policy premiums to maintain certain policies. In the
typical life settlement, policy premiums for the insured’s projected life
expectancy are added to the purchase price and those future premium amounts are
set aside in an escrow account to pay future premiums. When the
future premium amounts are exhausted, purchasers are contractually obligated to
pay the additional policy premiums. In some instances, purchasers
have failed to pay the premiums and we have repurchased the policy or advanced
the premiums to maintain the policies. While we have no contractual
or other legal obligation to do so, and do not do so in every instance, we have
made premium advances as an accommodation to certain purchasers based on our
assumptions that we will ultimately recoup the advances. While some
purchasers repay the advances directly, reimbursements of these premiums will
come most likely as a priority payment from the policy proceeds when an insured
dies.
20
We must
make estimates of the collectability of these premium advances. We
recorded an allowance against the premium advances at the time of the advance
and treated reimbursements as a reduction of the allowance. Until
fiscal 2010, due to the uncertainty of the outcome of a relevant court case, we
were unable to estimate the amount of any future advances we may elect to make
or the timing of the amount of reimbursements we were likely to
receive. Within fiscal 2010, issues were resolved which enabled us to
better estimate the collectability of premium advances. The agreement
with the State of Texas allowed us to specifically identify a class of investors
for whom we made premium advances, and which, under the terms of the agreement,
will be uncollectible. Our historical success of collecting premium
advances has enabled us to build a body of evidence by which we can demonstrate
full collectability of the remaining balance of advanced premiums. To
date, we have ultimately been fully reimbursed when we have made an advance and
the policy has matured. As a result, we eliminated $6.4 million of
the allowance on the advanced premiums account in the fourth quarter of fiscal
2010.
During
fiscal 2010, 2009 and 2008, we made premium advances of $2,518,316, $1,916,693
and $1,195,018, respectively, and were reimbursed $683,669, $472,217 and
$216,251, respectively. The advances less the reimbursements for
periods before fiscal 2010 are included as a net expense within operating
expenses.
Interest Income and Expense –
Net interest income and expense increased from $1,493,696 in fiscal 2008 to
$1,743,108 in fiscal 2009 and decreased to $1,446,476 in fiscal
2010. The increase in interest income in fiscal 2009 corresponded to
higher investment balances, as well as maturities on owned
policies. The decrease in net interest income in 2010 was a result of
lower market interest rates on investments. There were several
maturities on policies, gains and distributions from our investment in the life
settlements trust in fiscal 2010. The gain from our investment in
fiscal 2010 was $648,969. Interest expense declined from $162,508 in
fiscal 2008 to $61,182 in fiscal 2009 to $46,988 in fiscal
2010. Interest expense related primarily to the long-term debt
financing on our property, which was retired on April 28, 2009.
Realized Loss on Investments
– We realized a loss of $1,823,364 on investment securities in fiscal 2010,
compared to none in fiscal 2009 and $39,523 in fiscal 2008. The tax
effect for the year ended February 28, 2010, was calculated assuming that
the long-term capital loss deduction for tax purposes would be reduced by any
long-term capital gains we are able to net against by carrying back or carrying
forward the loss to past and future tax returns. As of February 28,
2010, we have no certain future capital gains; therefore, the net tax effect for
the year ended February 28, 2010, is only what we will be able to carry
back, or $26,879. The loss in fiscal 2010 was a result of our
conclusion that the unrealized loss in fair value of our investment securities
was no longer temporary. The decline in fair value of securities in
previous periods was not recognized for financial reporting purposes, as the
loss was considered temporary in nature. The unrealized loss in
previous periods was included in Other Comprehensive Loss within the equity
section of the balance sheet.
Income Taxes – Income tax
expense increased by $3,256,115, or 21.7%, from $15,027,538 in fiscal 2009 to
$18,283,653 in fiscal 2010. Income tax expense in fiscal 2010
increased significantly due to increased pre-tax earnings, taxed at 35%, and the
accrual of $831,233 of Texas Margin Tax; $402,104 for an estimated assessment
due to non-deductibility of certain payments in past and current periods,
included in our calculation of the Texas Margin, and $429,129 for the current
year ended February 28, 2010, due in May of 2011. Income tax expense
was also affected by the impact of establishing a $611,298 allowance within the
deferred income tax asset account. This allowance was established to
recognize the uncertainty of netting future capital gains against a current
capital loss. Income tax expense increased $4,996,677, or 49.8%, from
$10,030,861 in fiscal 2008 to $15,027,538 in fiscal 2009. Increased
income tax in fiscal 2009 is a direct result of the increase in pre-tax
earnings.
21
Operating Activities – Net
cash flows provided by operating activities declined by 3.1%, decreasing
$905,323, from $28,445,291 in fiscal 2009 to $27,539,968 in fiscal
2010. Net cash flows provided by operating activities increased by
135%, or $16,360,571, from $12,084,720 in fiscal 2008 to $28,445,291 in fiscal
2009. Net cash flows provided by operating activities in all years
resulted primarily from net income. Fiscal 2010’s cash flow was
decreased primarily by a decrease in the advanced premiums allowance account and
an increase in accounts receivable, and increased primarily by an increase in
accrued liabilities. Fiscal 2009’s cash flow was increased primarily
by a decrease in accounts receivable and decreased by a decline in accounts
payable. Fiscal 2008’s cash flow was decreased primarily by an
increase in accounts receivable and increased by an increase in accounts
payable.
Investing and Financing Activities
– We used cash of $5,988,772 in investing activities in fiscal 2010
versus $15,878,496 in fiscal 2009 and $4,867,162 in fiscal 2008. As
our net income has increased and our financial condition has strengthened, we
have used some of these earnings to purchase policy interests for our own
account. We purchased policies of $7,863,520 in fiscal 2010 compared
to $8,013,324 in fiscal 2009 and $464,212 in fiscal 2008. Of the
policies purchased in fiscal 2010 and 2009, $6,441,625 and $6,318,665,
respectively, represented policies that we acquired in connection with a
settlement with the state of Colorado. The terms of the settlement afforded us
the opportunity to purchase a large number of policy interests from existing
clients on terms that provided value to us as well as our clients. We completed
the purchase of these policies in our first quarter of fiscal 2010, which ended
May 31, 2009. We have continued to acquire policy interests on a
discretionary basis as those opportunities are presented to us by existing
clients and on terms that are agreeable to both parties. We believe
that we will profit from the investment in these policies when they
mature.
In fiscal
2010, we invested $1,227,484 in a life settlements trust, which acquired life
settlement interests. Our investment followed an earlier investment
of $5,000,000 in the life settlements trust in fiscal 2009. In
addition to investing, we acted as a non-exclusive purchasing agent for the
trust and its predecessor partnership. The trust is no longer
acquiring life settlements and we do not anticipate further
investments. The trust owns a portfolio of life insurance settlements
with an initial face value of $706 million, which we anticipate will mature over
the next few years. The trust has experienced some maturities during
the course of fiscal 2010 and we have been paid from these maturities. Cash
proceeds from the maturities were $420,743.
In fiscal
2010, we made purchases of property and equipment of $382,567, while in fiscal
2009 we made purchases of $413,734, and in fiscal 2008 purchases of
$2,380,558. The purchases of property and equipment in 2008 were
primarily the purchase of land and building adjacent to our corporate
headquarters and an airplane, which was also sold in fiscal
2008. Investments in certificates of deposit were zero in fiscal
2010, $1,948,651 in fiscal 2009 and $1,084,952 in fiscal
2008. Maturities of certificates of deposit were $2,933,069 in fiscal
2010, while it was zero in both fiscal years 2009 and
2008. Investment purchases in marketable securities were zero in
2010, $502,787 in fiscal 2009 and $1,727,440 in fiscal 2008.
We used
$14,003,685 in financing activities in fiscal 2010 versus $4,418,125 in fiscal
2009 and $3,626,032 in fiscal 2008. We paid dividends of $13,224,612
in fiscal 2010, $3,331,675 in fiscal 2009 and $2,445,218 in fiscal
2008. We paid off our long-term debt in fiscal 2010 at a cost of
$779,073. Payments on the line of credit and long-term debt in fiscal
2009 and 2008 were $2,387,399 and $3,206,168, respectively. We
received proceeds from loans of zero in fiscal 2010, $2,000,000 in fiscal 2009
and $2,289,226 in fiscal 2008. We made no treasury share purchases in
fiscal 2010. We purchased shares on the open market (treasury shares)
for $699,051 in fiscal 2009 and $563,872 in fiscal 2008.
22
Working Capital and Capital
Availability – As of February 28, 2010, we had working capital of
$25,529,667. Our cash during fiscal 2010 increased by $7,547,511
compared with an increase of $8,148,670 in fiscal 2009 and an increase of
$3,591,526 in fiscal 2008. In the event we required credit to
facilitate our short-term cash flow management and operating capital
requirements, we maintained two credit lines. One credit line
was secured by cash and securities on deposit. As of
February 28, 2010, it carried an interest rate at the Wall Street Journal
Prime Rate of 3.25% and had a borrowing base of
$2.9 million. There was no outstanding balance on this line of
credit as of February 28, 2010 and 2009. This line of credit was
discontinued in March 2010. The other line of credit was secured by a
certificate of deposit. This line of credit carried an interest rate
of 5.55% and had a borrowing base of $1 million. There was no
outstanding balance on this line as of February 28, 2010 or
2009. This line was no longer available when the collateralized
certificate of deposit matured in fiscal 2010.
We
believe future income from operating activities will generate sufficient profits
and cash flows to meet our anticipated working capital needs in both the long
and short-term. In addition, we continue to explore the formation of
life settlement investment funds, whether sponsored externally or internally,
and other types of financing opportunities, which will provide more funds for
life settlement transactions. We pursue these opportunities believing
that the funds will expand our retail efforts by affording purchasers an
alternative to the current retail model in which purchasers acquire direct
interests in policies. We believe that securities brokers are
accustomed to seeing investment products in a fund structure and their
familiarity with fund structures may increase broker interest. We
also believe the fund structure will aid market penetration by enabling us to
sell in states that treat life settlements as securities, which limits or blocks
our ability to sell in those states.
Our
financial strategy is to increase cash flows generated from operations by
increasing revenues while controlling brokerage and general and administrative
expenses. We believe that demand for life settlements will continue
to grow during the next year as the prospects for economic conditions remain
uncertain, as the popularity of non-correlated assets continues to grow, and as
we gain competitive advantage in a growing market. In addition to our
traditional retail base, we have expanded our services to accommodate
institutional purchasers.
Off-Balance
Sheet Arrangements
We do not
engage in any off-balance sheet arrangements or transactions.
Contractual
Obligations and Commitments
Our
outstanding contractual obligations and commitments as of February 28, 2010
were:
|
Total
|
Due in less
than 1 year
|
Due in
1 to 3 years
|
Due in
4 to 5 years
|
Due after
5 years
|
||||||||||||||||
|
Operating
leases
|
$ | 137,319 | $ | 61,751 | $ | 55,055 | $ | 20,513 | $ | - | ||||||||||
|
Total
obligations
|
$ | 137,319 | $ | 61,751 | $ | 55,055 | $ | 20,513 | $ | - | ||||||||||
None.
23
Our
audited Consolidated Financial Statements, together with the report of auditors
and the notes to the Consolidated Financial Statements, are included in this
Annual Report beginning on page 30.
The
following tables set forth our unaudited consolidated financial data regarding
operations for each quarter of fiscal 2010, 2009 and 2008. This
information, in the opinion of management, includes all adjustments necessary,
consisting only of normal and recurring adjustments, to state fairly the
information set forth therein. Certain amounts previously reported
have been reclassified to conform to the current presentation. These
reclassifications had no net impact on the results of operations.
|
Fiscal 2010
|
||||||||||||||||
|
1st Quarter
|
2nd Quarter
|
3rd Quarter
|
4th Quarter
|
|||||||||||||
|
Revenues
|
$ | 27,443,604 | $ | 29,055,566 | $ | 30,967,256 | $ | 25,529,857 | ||||||||
|
Income
from Operations
|
$ | 11,060,992 | $ | 11,222,809 | $ | 12,690,816 | $ | 12,463,233 | ||||||||
|
Pre-tax
Income
|
$ | 11,763,199 | $ | 11,759,761 | $ | 13,155,123 | $ | 11,031,848 | ||||||||
|
Net
Income
|
$ | 7,445,469 | $ | 7,625,015 | $ | 8,431,924 | $ | 5,923,870 | ||||||||
|
Net
Income Per Share
|
$ | 0.50 | $ | 0.51 | $ | 0.57 | $ | 0.40 | ||||||||
|
Fiscal 2009
|
||||||||||||||||
|
1st Quarter
|
2nd Quarter
|
3rd Quarter
|
4th Quarter
|
|||||||||||||
|
Revenues
|
$ | 24,438,146 | $ | 24,788,725 | $ | 28,103,930 | $ | 26,283,639 | ||||||||
|
Income
from Operations
|
$ | 9,500,348 | $ | 9,588,093 | $ | 10,669,663 | $ | 10,749,567 | ||||||||
|
Pre-tax
Income
|
$ | 9,867,631 | $ | 10,071,429 | $ | 11,306,583 | $ | 10,941,011 | ||||||||
|
Net
Income
|
$ | 6,248,575 | $ | 6,603,491 | $ | 7,282,878 | $ | 7,024,172 | ||||||||
|
Net
Income Per Share
|
$ | 0.42 | $ | 0.45 | $ | 0.48 | $ | 0.48 | ||||||||
|
Fiscal 2008
|
||||||||||||||||
|
1st Quarter
|
2nd Quarter
|
3rd Quarter
|
4th Quarter
|
|||||||||||||
|
Revenues
|
$ | 17,578,976 | $ | 17,646,109 | $ | 19,298,726 | $ | 18,085,444 | ||||||||
|
Income
from Operations
|
$ | 6,713,326 | $ | 6,157,526 | $ | 7,513,238 | $ | 6,869,823 | ||||||||
|
Pre-tax
Income
|
$ | 7,047,449 | $ | 6,588,621 | $ | 7,983,069 | $ | 7,167,993 | ||||||||
|
Net
Income
|
$ | 4,723,946 | $ | 4,341,111 | $ | 5,215,695 | $ | 4,475,519 | ||||||||
|
Net
Income Per Share
|
$ | 0.31 | $ | 0.29 | $ | 0.35 | $ | 0.30 | ||||||||
Item
9. Changes in and Disagreements with Accountants on Accounting and
Financial Disclosure
We
changed independent registered public accounting firms in fiscal
2010. The decision to change auditors was not the result of any
disagreements between us and the former auditor, Eide Bailly LLP, on any matter
of accounting principles or practices, financial statement disclosures, or
auditing scope or procedure. On March 2, 2010, we announced the
engagement of Ernst & Young LLP, as our new independent registered public
accounting firm.
There
have been no disagreements with accountants on accounting and financial
disclosures.
24
Attached
as exhibits to this Annual Report are certifications of the CEO and the CFO,
which are required in accordance with Rule 13a-14 of the Securities
Exchange Act of 1934, as amended (the “Exchange
Act”). This Controls and Procedures section includes the
information concerning the controls evaluation referred to in the
certifications, and it should be read in conjunction with the certifications for
a more complete understanding of the topics presented.
Evaluation
of Disclosure Controls and Procedures
We
maintain disclosure controls and procedures that are designed to ensure that
information required to be disclosed in our reports under the Exchange Act is
recorded, processed, summarized and reported within the time periods specified
in the SEC’s rules and forms, and that such information is accumulated and
communicated to management, including our Chief Executive Officer and Chief
Financial Officer, as appropriate, to allow timely decisions regarding required
disclosure. Our management, with participation of our Chief Executive
Officer and Chief Financial Officer, conducted an evaluation of the
effectiveness of our internal controls over financial reporting based on the
framework in Internal Control
– Integrated Framework issued by the Committee of Sponsoring
Organizations (“COSO”)
of the Treadway Commission. Based on our evaluation under the
framework, our management concluded that our internal controls over financial
reporting were effective as of February 28, 2010.
The
effectiveness of our internal controls over financial reporting as of
February 28, 2010, has been audited by Ernst & Young LLP, an
independent registered public accounting firm, as stated in their report, which
is included herein.
Report
of Management on Internal Control over Financial Reporting
Our
management is responsible for establishing and maintaining adequate internal
control over financial reporting as defined in Rules 13a-15(f) and
15d-15(f) under the Exchange Act. Our internal control system has
been designed to provide reasonable, not absolute, assurance to our management
and Board of Directors that the objectives of our control system with respect to
the integrity, reliability and fair presentation of published financial
statements are met. A control system, no matter how well designed and
operated, can provide only reasonable, not absolute, assurance that the control
system’s objectives will be met. Further, the design of a control
system must reflect the fact that there are resource
constraints. Because of the inherent limitations in all control
systems, no evaluation of controls can provide absolute assurance that all
control issues and instances of fraud, if any, within our company have been
detected. Under the supervision and with the participation of our
management, including our Chief Executive Officer and Chief Financial Officer,
we assessed the effectiveness of our internal control over financial reporting
as of February 28, 2010. In making this assessment, we used the
criteria established in the framework on Internal Control – Integrated
Framework issued by COSO of the Treadway Commission. Based on
our assessment, which was conducted according to the COSO criteria, we have
concluded that our internal control over financial reporting was effective in
achieving its objectives as of February 28, 2010.
For the
year ended February 28, 2009, our disclosure controls and procedures (as defined
in Rules 13a-15(e) and 15d-15(e) under the Exchange Act) were not effective
as a result of reported material weaknesses. We took the following
steps that addressed the issues associated with our material weaknesses over
financial footnote disclosures, which involved implementing process-focused
changes to improve the design and operation of the controls.
|
|
·
|
Developed
and improved maintenance of internal controls regarding the accounting for
investments in policies and in an outside
venture;
|
|
|
·
|
Improved
and updated the review of internal control documents, revising and
supplementing as needed, and documenting the
review;
|
25
|
|
·
|
Instituted
oversight and monitoring of accounting procedures and review of our
financial statements and footnote disclosures by an outside consulting
firm; and,
|
|
|
·
|
Incorporated
the use of standardized SEC and GAAP disclosure checklists during the
preparation and review of financial
statements.
|
We
implemented these changes during the quarter ended May 31,
2009. Testing of our internal controls and review of our financial
statements determined that the enhanced controls are operating
effectively. Internal controls other than the reporting areas
reported as material weaknesses have not changed and are still in place and
functioning effectively.
Subsequent
to the evaluation and through the date of this filing of this report, other than
the material weaknesses noted in the Form 10-K for the fiscal year ended
February 28, 2009, there were no changes in our internal control over financial
reporting that have materially affected, or are reasonable likely to materially
affect, our internal control over financial reporting.
Changes
in Internal Control over Financial Reporting During the Fiscal Quarter Ended
February 28, 2010
There
were no changes in our internal control over financial reporting that occurred
during our last fiscal quarter that have materially affected, or are reasonable
likely to materially affect, our internal control over financial
reporting.
26
Report
of Ernst & Young LLP, Independent Registered Public Accounting
Firm
The Board
of Directors and Shareholders of Life Partners Holdings,
Inc.:
We have
audited Life Partners Holdings, Inc.’s internal control over financial reporting
as of February 28, 2010, based on criteria established in Internal
Control—Integrated Framework issued by the Committee of Sponsoring Organizations
of the Treadway Commission (the COSO criteria). Life Partners Holdings, Inc.’s
management is responsible for maintaining effective internal control over
financial reporting, and for its assessment of the effectiveness of internal
control over financial reporting included in the accompanying Management Report
on Internal Control over Financial Reporting under Item 9A of the Index. Our
responsibility is to express an opinion on the Company’s internal control over
financial reporting based on our audit.
We
conducted our audit in accordance with the standards of the Public Company
Accounting Oversight Board (United States). Those standards require that we plan
and perform the audit to obtain reasonable assurance about whether effective
internal control over financial reporting was maintained in all material
respects. Our audit included obtaining an understanding of internal control over
financial reporting, assessing the risk that a material weakness exists, testing
and evaluating the design and operating effectiveness of internal control based
on the assessed risk, and performing such other procedures as we considered
necessary in the circumstances. We believe that our audit provides a reasonable
basis for our opinion.
A
company’s internal control over financial reporting is a process designed to
provide reasonable assurance regarding the reliability of financial reporting
and the preparation of financial statements for external purposes in accordance
with generally accepted accounting principles. A company’s internal control over
financial reporting includes those policies and procedures that (1) pertain to
the maintenance of records that, in reasonable detail, accurately and fairly
reflect the transactions and dispositions of the assets of the company; (2)
provide reasonable assurance that transactions are recorded as necessary to
permit preparation of financial statements in accordance with generally accepted
accounting principles, and that receipts and expenditures of the company are
being made only in accordance with authorizations of management and directors of
the company; and (3) provide reasonable assurance regarding prevention or timely
detection of unauthorized acquisition, use, or disposition of the company’s
assets that could have a material effect on the financial
statements.
Because
of its inherent limitations, internal control over financial reporting may not
prevent or detect misstatements. Also, projections of any evaluation
of effectiveness to future periods are subject to the risk that controls may
become inadequate because of changes in conditions, or that the degree of
compliance with the policies or procedures may deteriorate.
In our
opinion, Life Partners Holdings, Inc. maintained, in all material respects,
effective internal control over financial reporting as of February 28, 2010,
based on the COSO
criteria.
We also
have audited, in accordance with the standards of the Public Company Accounting
Oversight Board (United States), the consolidated balance sheet as of February
28, 2010, and the related consolidated statements of income, shareholders’
equity, and cash flows for the year then ended of Life Partners Holdings, Inc.
and subsidiaries and our report dated May 12, 2010 expressed an unqualified
opinion thereon.
|
/s/
Ernst & Young LLP
|
Fort
Worth, Texas
May 12,
2010
27
Item
9B. Other Information
None.
PART
III
The
information required in response to this Item is incorporated herein by
reference to our proxy statement to be filed with the Securities and Exchange
Commission pursuant to Regulation 14A, not later than 120 days after the end of
the fiscal year covered by this report.
The
information required in response to this Item is incorporated herein by
reference to our proxy statement to be filed with the Securities and Exchange
Commission pursuant to Regulation 14A, not later than 120 days after the end of
the fiscal year covered by this report.
The
information required in response to this Item is incorporated herein by
reference to our proxy statement to be filed with the Securities and Exchange
Commission pursuant to Regulation 14A, not later than 120 days after the end of
the fiscal year covered by this report.
The
information required in response to this Item is incorporated herein by
reference to our proxy statement to be filed with the Securities and Exchange
Commission pursuant to Regulation 14A, not later than 120 days after the end of
the fiscal year covered by this report.
Item
14. Principal Accountant Fees and Services
The
information required in response to this Item is incorporated herein by
reference to our proxy statement to be filed with the Securities and Exchange
Commission pursuant to Regulation 14A, not later than 120 days after the end of
the fiscal year covered by this report.
Financial
Statements. The Consolidated Financial Statements for the
fiscal years ended February 28, 2010 and 2009, and February 29, 2008,
are included in this Annual Report beginning on page 30.
Financial Statement
Schedules. All schedules have been omitted because the
information is not required, not applicable, not present in amounts sufficient
to require submission of the schedule, or is included in the financial
statements or notes thereto.
Exhibits. The
exhibit list and accompanying footnote disclosures in the Index to Exhibits
immediately following the Notes to our Consolidated Financial Statements are
incorporated herein by reference in response to the requirements of this part of
the Annual Report.
28
SIGNATURES
In
accordance with Section 13 or 15(d) of the Exchange Act, the registrant caused
this report to be signed on its behalf by the undersigned, thereunto duly
authorized.
|
May
12, 2010
|
Life
Partners Holdings, Inc.
|
|
|
By:
|
/s/ Brian D. Pardo
|
|
|
Brian
D. Pardo
|
||
|
President
and Chief Executive
Officer
|
||
In
accordance with the Exchange Act, this report has been signed below by the
following persons on behalf of the registrant and in the capacities and on the
dates indicated.
|
Name
|
Title
|
Date
|
||
|
/s/ Brian D. Pardo
|
President,
Principal Executive
|
May
12, 2010
|
||
|
Brian D. Pardo
|
Officer,
and Director
|
|||
|
/s/ David M. Martin
|
Chief
Financial Officer and
|
May
12, 2010
|
||
|
David M. Martin
|
Principal
Financial and
|
|||
|
Accounting
Officer
|
||||
|
/s/ R. Scott Peden
|
Secretary,
Director
|
May
12, 2010
|
||
|
R. Scott Peden
|
||||
|
/s/Tad
Ballantyne
|
Director
|
May
12, 2010
|
||
|
Tad Ballantyne
|
||||
|
/s/ Harold Rafuse
|
Director
|
May
12, 2010
|
||
|
Harold Rafuse
|
||||
|
/s/ Fred Dewald
|
Director
|
May
12, 2010
|
||
|
Fred Dewald
|
29
LIFE
PARTNERS HOLDINGS, INC.
CONSOLIDATED
FINANCIAL STATEMENTS
FEBRUARY
28, 2010 AND 2009, AND FEBRUARY 29, 2008
Contents
|
Reports
of Independent Registered Public Accounting Firms
|
31-33
|
|
Audited
Consolidated Financial Statements:
|
|
|
Consolidated
Balance Sheets
|
34
|
|
Consolidated
Statements of Income
|
36
|
|
Consolidated
Statements of Shareholders’ Equity
|
37
|
|
Consolidated
Statements of Cash Flows
|
38
|
|
Notes
to Consolidated Financial Statements
|
39
|
30
Report of Ernst & Young
LLP, Independent
Registered Public Accounting Firm
To the
Board of Directors and Shareholders of Life Partners Holdings,
Inc.:
We have
audited the accompanying consolidated balance sheet of Life Partners Holdings,
Inc. and subsidiaries as of February 28, 2010, and the related consolidated
statements of income, shareholders’ equity, and cash flows for the year then
ended. These financial statements are the responsibility of the
Company’s management. Our responsibility is to express an opinion on
these financial statements based on our audit.
We
conducted our audit in accordance with the standards of the Public Company
Accounting Oversight Board (United States). Those standards require that we plan
and perform the audit to obtain reasonable assurance about whether the financial
statements are free of material misstatement. An audit includes examining, on a
test basis, evidence supporting the amounts and disclosures in the financial
statements. An audit also includes assessing the accounting principles used and
significant estimates made by management, as well as evaluating the overall
financial statement presentation. We believe that our audit provides a
reasonable basis for our opinion.
In our
opinion, the consolidated financial statements referred to above present
fairly, in all material respects, the consolidated financial position of Life
Partners Holdings, Inc. and subsidiaries at February 28, 2010, and the
consolidated results of their operations and their cash flows for the year then
ended, in conformity with U.S. generally accepted accounting
principles.
We also
have audited, in accordance with the standards of the Public Company Accounting
Oversight Board (United States), Life Partners Holdings, Inc.’s internal control
over financial reporting as of February 28, 2010, based on criteria established
in Internal Control-Integrated
Framework issued by the Committee of Sponsoring Organizations of the
Treadway Commission and our report dated May 12, 2010 expressed an unqualified
opinion thereon.
|
/s/
Ernst & Young LLP
|
|
|
Fort
Worth, Texas
|
|
|
May
12, 2010
|
|
31
Report
of Independent Registered Public Accounting Firm
To the
Board of Directors and Stockholders of Life Partners Holdings,
Inc.:
We have
audited the accompanying consolidated balance sheet of Life Partners Holdings,
Inc. as of February 28, 2009, and the related consolidated statements of income,
shareholders’ equity, and cash flows for the year ended February 28,
2009. Life Partners Holdings, Inc.’s management is responsible for
these consolidated financial statements. Our responsibility is to
express an opinion on these financial statements based on our
audit.
We
conducted our audit in accordance with the standards of the Public Company
Accounting Oversight Board (United States). Those standards require that we plan
and perform the audits to obtain reasonable assurance about whether the
consolidated financial statements are free of material
misstatement. Our audit of the consolidated financial statements
included examining, on a test basis, evidence supporting the amounts and
disclosures in the consolidated financial statements, assessing the accounting
principles used and significant estimates made by management. We believe that
our audit provides a reasonable basis for our opinion.
In our
opinion, the consolidated financial statements referred to above present fairly,
in all material respects, the financial position of Life Partners Holdings, Inc.
as of February 28, 2009, and the results of its operations and its cash flows
for the year ended February 28, 2009, in conformity with accounting principles
generally accepted in the United States of America.
We have
also audited, in accordance with the standards of the Public Company Accounting
Oversight Board (United States), Life Partners Holdings, Inc.’s internal control
over financial reporting as of February 28, 2009, based on criteria established
in Internal Control—Integrated Framework issued by the Committee of Sponsoring
Organizations of the Treadway Commission (COSO), and our report dated May 29,
2009, expressed an adverse opinion on the Company’s internal control over
financial reporting.
/s/Eide
Bailly LLP
Oklahoma
City, OK
May 29,
2009
32
REPORT
OF INDEPENDENT REGISTERED PUBLIC ACCOUNTING
FIRM
ON CONSOLIDATED FINANCIAL STATEMENTS
To the
Board of Directors and Stockholders Life Partners Holdings, Inc.
We have
audited the accompanying consolidated statements of income, cash flows and
shareholders’ equity of Life Partners Holdings, Inc. and subsidiaries for the
year ended February 29, 2008. These consolidated financial statements are the
responsibility of the Life Partners Holdings, Inc.’s management. Our
responsibility is to express an opinion on these consolidated financial
statements based on our audit.
We
conducted our audit in accordance with the standards of the Public Company
Accounting Oversight Board (United States). Those standards require that we plan
and perform the audit to obtain reasonable assurance about whether the
consolidated financial statements are free of material misstatement. An audit
includes examining, on a test basis, evidence supporting the amounts and
disclosures in the consolidated financial statements. An audit also includes
assessing the accounting principles used and significant estimates made by
management, as well as evaluating the overall financial statement presentation.
We believe that our audit provides a reasonable basis for our
opinion.
In our
opinion the consolidated financial statements referred to above present fairly,
in all material respects, the consolidated results of operations, cash flows and
shareholders’ equity of Life Partners Holdings, Inc. and subsidiaries for the
year ended February 29, 2008 in conformity with U.S. generally accepted
accounting principles.
We also
have audited, in accordance with the standards of the Public Company Accounting
Oversight Board (United States), Life Partners Holdings, Inc. and subsidiaries’
internal control over financial reporting as of February 29, 2008, based on
criteria established in Internal Control — Integrated Framework issued by the
Committee of Sponsoring Organizations of the Treadway Commission (COSO), and our
report dated May 14, 2008 expressed an unqualified opinion on the effectiveness
of the Company’s internal control over financial reporting.
/s/
Murrell, Hall, McIntosh & Co. PLLP
Oklahoma
City, Oklahoma
May 14,
2008
33
LIFE
PARTNERS HOLDINGS, INC.
CONSOLIDATED
BALANCE SHEETS
FEBRUARY
28, 2010 AND 2009
Page
1 of 2
ASSETS
|
Feb. 28, 2010
|
Feb. 28, 2009
|
|||||||
|
CURRENT
ASSETS:
|
||||||||
|
Cash
and cash equivalents
|
$ | 22,808,728 | $ | 15,261,217 | ||||
|
Certificates
of deposit
|
100,534 | 3,033,603 | ||||||
|
Accounts
receivable – trade
|
12,494,404 | 10,057,386 | ||||||
|
Accounts
receivable – other
|
595,025 | 157,148 | ||||||
|
Note
receivable
|
581,096 | 554,918 | ||||||
|
Income
tax receivable
|
152,125 | - | ||||||
|
Deferred
income taxes
|
745,788 | - | ||||||
|
Prepaid
expenses
|
375,587 | 141,286 | ||||||
|
Total
current assets
|
37,853,287 | 29,205,558 | ||||||
|
PROPERTY
AND EQUIPMENT:
|
||||||||
|
Land
and building
|
2,274,895 | 2,131,285 | ||||||
|
Proprietary
software
|
511,405 | 499,046 | ||||||
|
Furniture,
fixtures and equipment
|
1,525,197 | 1,298,599 | ||||||
|
Transportation
equipment
|
9,800 | 9,800 | ||||||
| 4,321,297 | 3,938,730 | |||||||
|
Accumulated
depreciation
|
(1,657,293 | ) | (1,344,243 | ) | ||||
| 2,664,004 | 2,594,487 | |||||||
|
OTHER
ASSETS:
|
||||||||
|
Premium
advances, net of allowance of $3,299,624 in 2010 and $5,416,621 in
2009
|
3,549,912 | - | ||||||
|
Investment
in securities
|
4,529,169 | 2,704,063 | ||||||
|
Investment
in policies
|
16,460,353 | 8,878,715 | ||||||
|
Investment
in life settlements trust
|
6,456,155 | 4,935,875 | ||||||
|
Artifacts
and other
|
834,700 | 831,700 | ||||||
|
Deferred
income taxes
|
379,592 | 3,227,427 | ||||||
|
Total
other assets
|
32,209,881 | 20,577,780 | ||||||
|
Total
assets
|
$ | 72,727,172 | $ | 52,377,825 | ||||
See the
accompanying summary of accounting policies and notes to the consolidated
financial statements.
34
LIFE
PARTNERS HOLDINGS, INC.
CONSOLIDATED
BALANCE SHEETS
FEBRUARY
28, 2010 AND 2009
Page
2 of 2
LIABILITIES
AND SHAREHOLDERS' EQUITY
|
Feb. 28, 2010
|
Feb. 28, 2009
|
|||||||
|
CURRENT
LIABILITIES:
|
||||||||
|
Accounts
payable
|
$ | 5,514,270 | $ | 5,068,961 | ||||
|
Accrued
liabilities
|
2,345,276 | 527,126 | ||||||
|
Dividends
payable
|
3,719,341 | 1,043,316 | ||||||
|
Accrued
settlement expense
|
503,783 | 462,341 | ||||||
|
Current
portion of long-term debt
|
- | 42,717 | ||||||
|
Deferred
revenue
|
240,950 | 227,300 | ||||||
|
Income
taxes payable
|
- | 244,333 | ||||||
|
Total
current liabilities
|
12,323,620 | 7,616,094 | ||||||
|
LONG-TERM
LIABILITIES:
|
||||||||
|
Long-term
debt, net of current portion
|
- | 736,356 | ||||||
|
Income
taxes payable
|
553,896 | - | ||||||
|
Total
long-term liabilities
|
553,896 | 736,356 | ||||||
|
Total
liabilities
|
12,877,516 | 8,352,450 | ||||||
|
SHAREHOLDERS’
EQUITY:
|
||||||||
|
Common
stock, $0.01 par value; 18,750,000 shares authorized; 15,024,354 shares
issued and outstanding
|
150,243 | 150,243 | ||||||
|
Additional
paid-in capital
|
11,460,311 | 11,460,311 | ||||||
|
Retained
earnings
|
49,874,166 | 36,348,525 | ||||||
|
Accumulated
other comprehensive loss, net of taxes
|
- | (2,298,640 | ) | |||||
|
Less:
Treasury stock – 165,338 shares
|
(1,635,064 | ) | (1,635,064 | ) | ||||
|
Total
shareholders’ equity
|
59,849,656 | 44,025,375 | ||||||
|
Total
liabilities and shareholders’ equity
|
$ | 72,727,172 | $ | 52,377,825 | ||||
See the
accompanying summary of accounting policies and notes to the consolidated
financial statements.
35
LIFE
PARTNERS HOLDINGS, INC.
CONSOLIDATED
STATEMENTS OF INCOME
FOR
THE YEARS ENDED FEBRUARY 28, 2010 AND 2009, AND FEBRUARY 29, 2008
|
2010
|
2009
|
2008
|
||||||||||
|
REVENUES
|
$ | 112,996,283 | $ | 103,614,440 | $ | 72,609,255 | ||||||
|
BROKERAGE
FEES
|
50,977,123 | 49,193,863 | 35,786,521 | |||||||||
|
REVENUES,
NET OF BROKERAGE FEES
|
62,019,160 | 54,420,577 | 36,822,734 | |||||||||
|
OPERATING
AND ADMINISTRATIVE EXPENSES:
|
||||||||||||
|
General
and administrative
|
12,367,799 | 10,747,398 | 8,090,821 | |||||||||
|
Premium
advances, net
|
(1,715,265 | ) | 1,444,476 | 978,767 | ||||||||
|
Settlement
costs
|
3,615,726 | 1,382,140 | 173,954 | |||||||||
|
Depreciation
and amortization
|
313,050 | 338,892 | 325,279 | |||||||||
| 14,581,310 | 13,912,906 | 9,568,821 | ||||||||||
|
INCOME
FROM OPERATIONS
|
47,437,850 | 40,507,671 | 27,253,913 | |||||||||
|
Interest
and other income
|
1,493,464 | 1,804,290 | 1,656,204 | |||||||||
|
Interest
expense
|
(46,988 | ) | (61,182 | ) | (162,508 | ) | ||||||
|
Gain/(loss)
on investment in life settlements trust
|
648,969 | (64,125 | ) | - | ||||||||
|
Realized
(loss)/gain on investments
|
(1,823,364 | ) | - | 39,523 | ||||||||
| 272,081 | 1,678,983 | 1,533,219 | ||||||||||
|
INCOME
BEFORE INCOME TAXES
|
47,709,931 | 42,186,654 | 28,787,132 | |||||||||
|
INCOME
TAXES
|
18,283,653 | 15,027,538 | 10,030,861 | |||||||||
|
NET
INCOME
|
$ | 29,426,278 | $ | 27,159,116 | $ | 18,756,271 | ||||||
|
EARNINGS:
|
||||||||||||
|
Per
share – Basic and Diluted
|
$ | 1.98 | $ | 1.83 | $ | 1.25 | ||||||
|
AVERAGE
COMMON AND COMMON EQUIVALENT SHARES OUTSTANDING:
|
||||||||||||
|
Basic
|
14,859,016 | 14,866,167 | 14,993,434 | |||||||||
|
Diluted
|
14,859,016 | 14,866,167 | 14,993,910 | |||||||||
|
THE
COMPONENTS OF COMPREHENSIVE INCOME:
|
||||||||||||
|
Net
income
|
$ | 29,426,278 | $ | 27,159,116 | $ | 18,756,271 | ||||||
|
Gain
(loss) on investment securities, net of taxes
|
2,298,640 | (1,535,812 | ) | (729,902 | ) | |||||||
|
COMPREHENSIVE
INCOME
|
$ | 31,724,918 | $ | 25,623,304 | $ | 18,026,369 | ||||||
See the
accompanying summary of accounting policies and notes to the consolidated
financial statements.
36
LIFE
PARTNERS HOLDINGS, INC.
CONSOLIDATED
STATEMENTS OF SHAREHOLDERS' EQUITY
FOR
THE YEARS ENDED FEBRUARY 28, 2010 AND 2009, AND FEBRUARY 29, 2008
|
Number
of
Common
Shares
|
Common
Stock
|
Additional
Paid-In
Capital
|
Retained
Earnings
(Accumulated
Deficit)
|
Accumulated
Other
Comprehensive
Gain
(Loss)
|
Note
Receivable
|
Number
of
Treasury
Shares
|
Treasury
Stock
|
Total
Shareholders’
Equity
|
||||||||||||||||||||||||||||
|
Balance,
February 28, 2007
|
15,024,354 | $ | 150,243 | $ | 11,160,311 | $ | (3,199,964 | ) | $ | (32,926 | ) | $ | (372,141 | ) | 136,614 | $ | - | $ | 7,705,523 | |||||||||||||||||
|
Dividends
declared
|
- | - | - | (2,690,575 | ) | - | - | - | (2,690,575 | ) | ||||||||||||||||||||||||||
|
Change
in unrealized losses on investment securities
|
- | - | - | - | (729,902 | ) | - | - | (729,902 | ) | ||||||||||||||||||||||||||
|
Options
exercised
|
- | - | 300,000 | - | - | (78,125 | ) | - | 300,000 | |||||||||||||||||||||||||||
|
Foreclosure
on Texas 50 note for stock
|
- | - | - | 372,141 | 16,010 | (372,141 | ) | - | ||||||||||||||||||||||||||||
|
Purchase
of treasury stock
|
- | - | - | - | - | - | 39,930 | (563,872 | ) | (563,872 | ) | |||||||||||||||||||||||||
|
Shares
issued to IGE shareholder
|
- | - | - | - | - | - | (15 | ) | - | - | ||||||||||||||||||||||||||
|
Net
income
|
- | - | - | 18,756,271 | - | - | - | - | 18,756,271 | |||||||||||||||||||||||||||
|
Balance,
February 29, 2008
|
15,024,354 | 150,243 | 11,460,311 | 12,865,732 | (762,828 | ) | - | 114,414 | (936,013 | ) | 22,777,445 | |||||||||||||||||||||||||
|
Dividends
declared
|
- | - | - | (3,676,323 | ) | - | - | - | (3,676,323 | ) | ||||||||||||||||||||||||||
|
Change
in unrealized losses on investment securities
|
- | - | - | - | (1,535,812 | ) | - | - | - | (1,535,812 | ) | |||||||||||||||||||||||||
|
Purchase
of treasury stock
|
- | - | - | - | - | 50,924 | (699,051 | ) | (699,051 | ) | ||||||||||||||||||||||||||
|
Net
income
|
- | - | - | 27,159,116 | - | - | - | - | 27,159,116 | |||||||||||||||||||||||||||
|
Balance, February
28, 2009
|
15,024,354 | 150,243 | 11,460,311 | 36,348,525 | (2,298,640 | ) | 165,338 | (1,635,064 | ) | 44,025,375 | ||||||||||||||||||||||||||
|
Dividends
declared
|
- | - | - | (15,900,637 | ) | - | - | - | (15,900,637 | ) | ||||||||||||||||||||||||||
|
Change
in unrealized gains on investment securities
|
- | - | - | - | 2,298,640 | - | - | 2,298,640 | ||||||||||||||||||||||||||||
|
Net
income
|
- | - | - | 29,426,278 | - | - | - | - | 29,426,278 | |||||||||||||||||||||||||||
|
Balance, February
28, 2010
|
15,024,354 | $ | 150,243 | $ | 11,460,311 | $ | 49,874,166 | $ | - | $ | - | 165,338 | $ | (1,635,064 | ) | $ | 59,849,656 | |||||||||||||||||||
See the
accompanying summary of accounting policies and notes to the consolidated
financial statements.
37
LIFE
PARTNERS HOLDINGS, INC.
CONSOLIDATED
STATEMENTS OF CASH FLOWS
FOR
THE YEARS ENDED FEBRUARY 28, 2010 AND 2009, AND FEBRUARY 29, 2008
|
2010
|
2009
|
2008
|
||||||||||
|
CASH
FLOWS FROM OPERATING ACTIVITIES:
|
||||||||||||
|
Net
income
|
$ | 29,426,278 | $ | 27,159,116 | $ | 18,756,271 | ||||||
|
Adjustments
to reconcile net income to operating activities:
|
||||||||||||
|
Depreciation
|
313,050 | 338,892 | 325,279 | |||||||||
|
Impairment
on investment in securities
|
1,711,368 | - | - | |||||||||
|
Gain
on asset disposals
|
- | - | (61,538 | ) | ||||||||
|
Impairment
of investment in policies
|
281,882 | 151,810 | - | |||||||||
|
(Earnings)/loss
on investment in life settlements trust
|
(847,526 | ) | 64,125 | - | ||||||||
|
Decrease
in advanced premiums allowance
|
(3,549,912 | ) | - | - | ||||||||
|
Deferred
income taxes
|
864,213 | (385,594 | ) | (284,583 | ) | |||||||
|
Change
in operating assets and liabilities:
|
||||||||||||
|
Accounts
receivable
|
(2,874,895 | )) | 1,481,812 | (6,704,623 | ) | |||||||
|
Note
receivable
|
(26,178 | ) | (29,918 | ) | (425,000 | ) | ||||||
|
Income
taxes receivable/payable
|
157,438 | 66,263 | (520,128 | ) | ||||||||
|
Prepaid
expenses
|
(234,301 | ) | 354,359 | (383,928 | ) | |||||||
|
Accounts
payable
|
445,309 | (759,191 | ) | 1,568,755 | ||||||||
|
Accrued
liabilities
|
1,818,150 | 65,618 | 134,359 | |||||||||
|
Accrued
settlement expense
|
41,442 | (20,451 | ) | (332,594 | ) | |||||||
|
Deferred
revenue
|
13,650 | (41,550 | ) | 12,450 | ||||||||
|
Net
cash provided by operating activities
|
27,539,968 | 28,445,291 | 12,084,720 | |||||||||
|
CASH
FLOWS FROM INVESTING ACTIVITIES:
|
||||||||||||
|
Investment
in certificates of deposit
|
- | (1,948,651 | ) | (1,084,952 | ) | |||||||
|
Certificate
of deposit maturities
|
2,933,069 | - | - | |||||||||
|
Investment
in marketable securities
|
- | (502,787 | ) | (1,727,440 | ) | |||||||
|
Purchases
of property and equipment
|
(382,567 | ) | (413,734 | ) | (2,380,558 | ) | ||||||
|
Proceeds
from sale of property and equipment
|
- | - | 900,000 | |||||||||
|
Purchase
of policies for investment purposes and capitalized
premiums
|
(7,863,520 | ) | (8,013,324 | ) | (464,212 | ) | ||||||
|
Investment
in life settlements trust
|
(1,227,484 | ) | (5,000,000 | ) | - | |||||||
|
Proceeds
from maturities within life settlements trust
|
420,743 | - | - | |||||||||
|
Return
of investment in trust
|
133,987 | - | - | |||||||||
|
Increase
in other assets
|
(3,000 | ) | (110,000 | ) | ||||||||
|
Net
cash used in investing activities
|
(5,988,772 | ) | (15,878,496 | ) | (4,867,162 | ) | ||||||
|
CASH
FLOWS FROM FINANCING ACTIVITIES:
|
||||||||||||
|
Proceeds
from notes payable
|
- | 2,000,000 | 2,289,226 | |||||||||
|
Payments
on notes payable
|
(779,073 | ) | (2,387,399 | ) | (3,206,168 | ) | ||||||
|
Stock
options exercised
|
- | - | 300,000 | |||||||||
|
Purchases
of treasury shares
|
- | (699,051 | ) | (563,872 | ) | |||||||
|
Dividends
paid
|
(13,224,612 | ) | (3,331,675 | ) | (2,445,218 | ) | ||||||
|
Net
cash used in financing activities
|
(14,003,685 | ) | (4,418,125 | ) | (3,626,032 | ) | ||||||
|
NET
INCREASE IN CASH AND CASH EQUIVALENTS
|
7,547,511 | 8,148,670 | 3,591,526 | |||||||||
|
CASH
AND CASH EQUIVALENTS, BEGINNING OF PERIOD
|
15,261,217 | 7,112,547 | 3,521,021 | |||||||||
|
CASH
AND CASH EQUIVALENTS, END OF PERIOD
|
$ | 22,808,728 | $ | 15,261,217 | $ | 7,112,547 | ||||||
|
SUPPLEMENTAL
DISCLOSURES OF CASH FLOW INFORMATION:
|
||||||||||||
|
Interest
paid, net of capitalized amounts
|
$ | 46,988 | $ | 61,182 | $ | 162,508 | ||||||
|
Premium
advances paid
|
$ | 2,518,316 | $ | 1,916,693 | $ | 1,195,018 | ||||||
|
Income
taxes paid
|
$ | 17,262,000 | $ | 15,078,000 | $ | 10,024,198 | ||||||
See
accompanying summary of accounting policies and notes to consolidated financial
statements.
38
LIFE
PARTNERS HOLDINGS, INC.
NOTES
TO CONSOLDIATED FINANCIAL STATEMENTS
February
28, 2010
(1)
DESCRIPTION OF BUSINESS
Life
Partners Holdings, Inc. (“we” or “Life Partners”) is a
specialty financial services company and the parent company of Life Partners,
Inc. (“LPI”). LPI is the
oldest and one of the most active companies in the United States engaged in the
secondary market for life insurance known generally as “life
settlements”. These financial transactions involve the purchase of
life insurance policies at a discount to their face value for investment
purposes.
(2)
SUMMARY OF SIGNIFICANT ACCOUNTING POLICIES
Basis of
Presentation. The accompanying consolidated financial
statements include the accounts of Life Partners and its wholly owned
subsidiary, LPI. All significant intercompany balances and transactions have
been eliminated in consolidation. The consolidated financial
statements have been prepared in accordance with accounting principles generally
accepted in the United States (“GAAP”). The preparation of
financial statements in accordance with GAAP requires management to make
estimates and assumptions that affect the reported amounts of assets and
liabilities and disclosure of contingent assets and liabilities at the date of
the financial statements and the reported amounts of revenues and expenses
during the reported period. Actual results inevitably will differ from those
estimates and such differences may be material to the financial
statements.
Reclassifications. Certain
prior year amounts have been reclassified to conform to the current year’s
presentation. State income tax expense is shown on the statements of
income in all periods as deducted from pre-tax earnings to arrive at net
income. State income tax expense in previous periods was part of
general and administrative expense. This reclassification had no
impact on our results of operation or financial condition.
Cash and Cash
Equivalents. For purposes of the balance sheet and statement
of cash flows, we consider all highly liquid investments available for current
use with an original maturity of three months or less to be cash
equivalents. The average balance of our general checking account
balance is generally in excess of $250,000. The Federal Deposit
Insurance Corporation (“FDIC”) currently insures all
bank accounts up to $250,000, with unlimited coverage on non-interest bearing
accounts. The amount of our cash accounts in excess of the FDIC
insurance limit at February 28, 2010 and 2009, was $17,866,367 and $13,289,475,
respectively. Amounts in interest bearing accounts in excess of
$250,000 are at risk to the extent that their balances exceed FDIC
coverage. Money market investments do not have FDIC
protection. We believe we have mitigated our exposure to loss with
deposits in a combination of two smaller, community banks and three of the
largest national financial institutions.
Certificates of
Deposit. Certificates of deposit are held in several banking
institutions. Their original maturities are greater than three months
but do not exceed a year. The FDIC currently insures all bank
accounts up to $250,000, with unlimited coverage on non-interest bearing
accounts. The amount of our certificate of deposit accounts in excess
of the FDIC insurance limit at February 28, 2010 and 2009, was zero and
$1,933,244, respectively.
39
Accounts Receivable –
Trade. The amounts shown on the balance sheet termed Accounts
Receivable – Trade are amounts reflecting settlement transactions that have
closed, and revenue has been recognized, before the final funds are received to
settle the transactions. We also sometimes make non-interest bearing
advances to facilitate a settlement transaction. We collect the
advances generally within 30 days after the transactions close, and we receive
payment before any of the parties involved in the transaction receive
funds. Our business model does not use leverage, so there are no
issues of collectability or adverse effects due to the current credit
environment. The receivable amounts at February 28, 2010 and 2009,
were $12,494,404 and $10,057,386, respectively.
Accounts Receivable –
Other. The amounts shown on the balance sheet at February 28,
2010, termed Accounts Receivable – Other is composed of $574,288 from maturities
of policies we will be paid, loans of $18,115 to various employees and $2,622
for an equipment financing loan for a total of $595,025. The amount for February
28, 2009, is composed of $94,969 of miscellaneous receivables, loans of $51,731
for various employees, and $10,448 for an equipment financing loan for a total
of $157,148. We consider all receivables to be current and
collectible.
Note
Receivable. The amounts shown on the balance sheet termed
Notes Receivable represent a note, including interest at 5%, with a non-related
partnership originally dated January 8, 2008, and renewed with a guaranty and
security agreement on January 23, 2009. The due date was February 28,
2009. This note is substantially collateralized and we instituted
collection proceedings, which resulted in an agreed final judgment being entered
against the debtor on April 7, 2010, for the full amount of the note plus
accrued interest on that date, attorney’s fees, costs, all taxable costs of
court and post judgment interest at the highest rate allowable by
law. Our counsel in this matter is seeking collection of this
judgment and is investigating the available collateral to foreclose upon to
satisfy the judgment. We believe we will collect the full amount,
including accrued interest, before the end of our next fiscal
period. The amounts, including accrued interest, at February 28, 2010
and 2009, were $581,096 and $554,918, respectively.
Property and
Equipment. Our property and equipment are depreciated over
their estimated useful lives using the straight-line
method. Depreciation expense for the years ended February 28, 2010
and 2009, and February 29, 2008, were $313,050, $338,892 and $325,279,
respectively. The useful lives of property and equipment for purposes
of computing depreciation are:
|
Building
and components
|
7
to 39 years
|
|
Machinery
and equipment
|
5
to 7 years
|
|
Software
|
3
to 7 years
|
|
Transportation
equipment
|
5
years
|
Premium
Advances. We make advances on policy premiums to maintain
certain policies. In the typical life settlement, policy premiums for
the insured’s projected life expectancy are added to the purchase price and
those future premium amounts are set aside in an escrow account to pay future
premiums. When the future premium amounts are exhausted, purchasers
are contractually obligated to pay the additional policy premiums. In
some instances, purchasers have failed to pay the premiums and we have
repurchased the policy or advanced the premiums to maintain the
policies. While we have no contractual or other legal obligation to
do so, and do not do so in every instance, we have made premium advances as an
accommodation to certain purchasers based on our assumptions that we will
ultimately recoup the advances. While some purchasers repay the
advances directly, reimbursements of these premiums will come most likely as a
priority payment from the policy proceeds when an insured dies.
40
We must
make estimates of the collectability of these premium advances. We
recorded an allowance against the premium advances at the time of the advance
and treated reimbursements as a reduction of the allowance. Until
fiscal 2010, due to the uncertainty of the outcome of a relevant court case, we
were unable to estimate the amount of any future advances we may elect to make
or the timing of the amount of reimbursements we were likely to
receive. Within fiscal 2010, issues were resolved which enabled us to
better estimate the collectability of premium advances. The agreement
with the State of Texas allowed us to specifically identify a class of investors
for whom we made premium advances, and which, under the terms of the agreement,
will be uncollectible. Our historical success of collecting premium
advances has enabled us to build a body of evidence by which we can demonstrate
full collectability of the remaining balance of advanced premiums. To
date, we have ultimately been fully reimbursed when we have made an advance and
the policy has matured. As a result, we eliminated $3.5 million of
the allowance on the advanced premiums account in the fourth quarter of fiscal
2010.
During
the years ended February 28, 2010 and 2009 and February 29, 2008, we made
premium advances of $2,518,316, $1,916,693 and $1,195,018, respectively, and
were reimbursed $683,669, $472,217 and $216,251, respectively. The
change in valuation allowance less the reimbursements are included as a net
expense within operating expenses.
Investment in
Policies. From time to time, we purchase interests in policies
to hold for investment purposes. ASC 325-30, Accounting for Insurance
Contracts, states that a purchaser may elect to account for its
investments in life settlement contracts based on the initial investment at the
purchase price plus all initial direct costs or at fair value. We
have chosen to use the cost method and continuing costs (e.g., policy premiums
and direct external costs, if any) to keep the policy in force are
capitalized.
Artifacts and
Other. The artifacts and other assets are stated at
cost. We have evaluated these assets and believe there is no
impairment in their value as of February 28, 2010 and 2009.
Impairment of Long-Lived
Assets. We account for the impairment and disposition of
long-lived assets in accordance with ASC 360-10, Accounting for the Impairment or
Disposal of Long-Lived Assets. We review the carrying value of
property and equipment for impairment whenever events and circumstances indicate
that the carrying value of an asset may not be recoverable from the estimated
future cash flows expected to result from its use and eventual
disposition. In cases where undiscounted expected future cash flows
are less than the carrying value, an impairment loss would be recognized equal
to an amount by which the carrying value exceeds the fair value of
assets. The factors considered by management in performing this
assessment include current operating results, trends and prospects, the manner
in which the property is used, and the effects of obsolescence, demand,
competition and other economic factors. During fiscal 2010, 2009 and
2008, we recorded impairments of $281,882, $151,810, and zero,
respectively.
Revenue
Recognition. We recognize income at the time a settlement has
been closed and the purchaser has obligated itself to make the
purchase. We defer $100 per life settlement to cover minor monitoring
services provided subsequent to the settlement date and amortize this deferred
cost over the anticipated life expectancy of the insureds.
Income Taxes. We
recognize deferred tax assets and liabilities for the expected future tax
consequences of transactions and events. Under this method, deferred
tax assets and liabilities are determined based on the difference between the
financial statement and tax bases of assets and liabilities using enacted tax
rates in effect for the year in which the differences are expected to
reverse. Timing differences between the reporting of income and
expenses for financial statement and income tax reporting purposes are reported
as deferred tax assets, net of valuation allowances, or as deferred tax
liabilities depending on the cumulative effect of all timing differences,
recorded at amounts expected to be more likely than not
recoverable.
Earnings Per
Share. Basic earnings per share computations are calculated on
the weighted-average of common shares and common share equivalents outstanding
during the year, reduced by the treasury stock. Common stock options
and warrants are considered to be common share equivalents and are used to
calculate diluted earnings per common and common share equivalents except when
they are anti-dilutive.
41
Concentrations of Credit Risk and
Major Customers. In fiscal 2010, 2009, and 2008 compensation
to a single licensee organization represented 5.3%, 20%, and 20%, respectively,
of all brokerage and referral fees. In fiscal 2010, 2009 and 2008,
compensation to one broker represented 3.2%, 20%, and 39% respectively, of all
brokerage and referral fees.
(3)
NEW ACCOUNTING PRONOUNCEMENTS
We follow
accounting standards set by the Financial Accounting Standards Board (the “FASB”). The FASB
sets the GAAP that we follow to ensure we consistently report our financial
condition, results of operations and cash flows. References to GAAP
issued by the FASB in these footnotes are to the FASB Accounting Standards
Codification Topic 105 (the “ASC”). In June
2009, the FASB approved the FASB ASC, which, as of July 1, 2009, became the
single source of authoritative, nongovernmental GAAP. The ASC was not
intended to change GAAP. Rather, the ASC reorganizes all previous
GAAP pronouncements into accounting topics, and displays all topics using a
consistent structure. All existing standards that were used to create
the ASC are now superseded, aside from those issued by the U.S. Securities and
Exchange Commission, replacing the previous references to specific Statements of
Financial Accounting Standards with numbers used in the ASC’s structural
organization. All guidance in the ASC has an equal level of
authority. The ASC is effective for financial statements that cover
interim and annual periods ended after September 15, 2009. There was
no impact on our financial position, results of operations or cash flows as a
result of the adoption of ASC.
ASC 320,
Investments – Debt and Equity
Securities, and ASC 958-320, Investments – Debt and Equity
Securities, amends the other-than-temporary impairment guidance in GAAP
for debt securities to make the guidance more operational and to improve the
presentation and disclosure of the other-than-temporary impairments on debt and
equity securities in the financial statements. Adoption of ASC 320
during our fiscal 2010 had no impact on our financial condition, results of
operations or cash flows.
ASC 810,
Consolidation, among
other things, provides guidance and establishes amended accounting and reporting
standards for a parent company’s non-controlling interest in a
subsidiary. ASC 810 was adopted on March 1, 2009, and had no impact
on our financial condition, results of operations or cash flows.
ASC
815, Derivatives and Hedging, expands the
disclosure requirements about an entity’s derivative instruments and hedging
activities. We currently have no derivatives and hedging
activities. As such, the adoption of ASC 815 on March 1, 2009,
had no impact on our financial condition, results of operations or cash
flows.
ASC 820,
Fair Value Measurements and
Disclosures, addresses how companies should measure fair value when they
are required to use a fair value measure for recognition or disclosure purposes
under GAAP. ASC 820 defines fair value, establishes a framework for
measuring fair value and expands disclosures about fair value
measurements. Effective March 1, 2008, management adopted ASC 820 with the
exception of certain non-financial assets and non-financial liabilities that
were specifically deferred. In April 2009, the FASB issued ASC
820-10, which provides additional guidance for estimating fair value in
accordance with ASC 820, when the volume and level of activity for the asset or
liability have significantly decreased. In August 2009, the FASB
further clarified ASC 820-10, Measuring Liabilities at Fair Value,
which applies to all entities that measure liabilities at fair value
within the scope of Topic 820 and provides clarification that in circumstances
in which a quoted price in an active market for the identical liability is not
available, a reporting entity is required to measure fair value using one or
more other valuation techniques. We have no liabilities that are
traded or exchanged, requiring measurement at fair value. ASC 820
also includes guidance on identifying circumstances that indicate a transaction
is not orderly. In such circumstances, the ASC specifies that a
valuation technique should be applied that uses either the quote of the
liability when traded as an asset, the quoted prices for similar liabilities or
similar liabilities when traded as assets, or another valuation technique
consistent with existing fair value measurement guidance. Adoption of
ASC 820 during our fiscal 2010 had no impact on our financial condition, results
of operations or cash flows.
42
ASC 825,
Financial Instruments,
directs that entities include disclosures about the fair value of financial
instruments whenever it issues summarized financial information for interim
reporting periods. Entities shall disclose in the body or in the
accompanying notes of their summarized financial information the fair value of
all financial instruments for which it is practicable to estimate that value,
whether recognized or not recognized in the statement of financial
position. Adopted on March 1, 2009, ASC 825 had no impact on our
financial condition, results of operations or cash flows.
ASC 855,
Subsequent Events,
establishes general standards of accounting for, and disclosures of, events that
occur after the balance sheet date but before financial statements are issued or
available to be issued. ASC Topic 855 is effective for interim and annual
periods ended after June 15, 2009. The adoption of ASC 855 during our fiscal
2010 did not have a material impact on our financial condition, results of
operations or cash flows.
ASC
946-10-15-2 (ASU 2009-12) – Investments in Certain Entities That
Calculate Net Asset Value per Share (or Its Equivalent), provides
amendments to Subtopic 820-10 for the measurement of investments in certain
entities that calculate net asset value per share or its
equivalent. The amendments permit, as a practical expedient, a
reporting entity to measure the fair value of an investment that is within the
scope of ASU 2009-12 using the net asset value per share, or its equivalent, of
the investment. Adoption of ASU 2009-12 during our fiscal 2010 had no
impact on our financial condition, results of operations or cash
flows.
(4)
INVESTMENTS IN SECURITIES
Securities
investments not classified as either held-to-maturity or trading securities are
classified as available-for-sale securities. Our securities
investments are income and equity mutual funds and are classified as
available-for-sale securities. They are recorded at fair value in
Investment in Securities on the balance sheet, with the change in fair value
during the periods included in equity.
As of
February 28, 2010, the unrealized loss in Investment in Securities was
$1,823,364. Based on our latest analysis of these securities, we have
concluded that, based on the length of time the securities were in a loss
position, some reductions in dividend rates, and the fact that we intended to
sell the securities after year end, the unrealized losses are no longer
temporary in nature and an impairment in the amount of the unrealized losses was
recorded in earnings during the year ended February 28, 2010. The
basis on which the amount reclassified out of other comprehensive income into
earnings was determined using specific identification. Subsequent to
the recording of the impairment, we had no unrealized losses on securities at
February 28, 2010. Our securities investments had unrealized losses
of $3,536,667 at February 28, 2009. The tax effect of these
unrealized losses was $831,600. In previous periods, we considered
this unrealized loss to be temporary in nature and recorded the amount, net of
tax, as a component of other comprehensive income and included in
equity.
The cost
and estimated fair value of the investment securities classified as
available-for-sale as of February 28, 2010 and 2009, are as
follows:
|
Cost
Basis
|
Gross
Unrealized
Gains
|
Gross
Unrealized
Losses
|
Fair Value
|
|||||||||||||
|
Market
income funds as of 2/28/2010
|
$ | 4,529,169 | $ | - | $ | - | $ | 4,529,169 | ||||||||
|
Market
income funds as of 2/28/2009
|
$ | 6,240,730 | $ | - | $ | 3,536,667 | $ | 2,704,063 | ||||||||
There
were no investment securities in an unrealized loss position at February 28,
2010. The following table shows our investments’ gross unrealized
gains/losses and fair value, aggregated by investment category and length of
time that individual securities have been in a continuous unrealized loss
position, at February 28, 2009:
43
|
Less than 12 Months
|
12 Months or More
|
Total
|
||||||||||||||||||||||
|
Description of Securities
|
Fair
Value
|
Unrealized
Losses
|
Fair
Value
|
Unrealized
Losses
|
Fair
Value
|
Unrealized
Losses
|
||||||||||||||||||
|
Market
income funds
|
$ | 355,715 | $ | 147,267 | $ | 2,348,348 | $ | 3,389,400 | $ | 2,704,063 | $ | 3,536,667 | ||||||||||||
(5)
INVESTMENT IN POLICIES
From time
to time, we purchase interests in policies to hold for investment
purposes. ASC 325-30, Investments in Insurance Contracts,
provides that a purchaser may elect to account for its investments in
life settlement contracts based on the initial investment at the purchase price
plus all initial direct costs. Continuing costs (e.g., policy
premiums, statutory interest, and direct external costs, if any) to keep the
policy in force are capitalized.
The table
below describes the Investment in Policies account at February 28,
2010.
|
Remaining
Life Expectancy
(in years)
|
Number
of Life
Settlement Contracts
|
Carrying
Value
|
Face
Value
|
|||||||||
|
0-1
|
186 | $ | 4,473,238 | $ | 7,181,959 | |||||||
|
1-2
|
389 | 4,360,930 | 6,810,132 | |||||||||
|
2-3
|
176 | 2,158,459 | 3,903,265 | |||||||||
|
3-4
|
272 | 4,909,727 | 7,720,555 | |||||||||
|
4-5
|
33 | 557,999 | 972,879 | |||||||||
|
Thereafter
|
1 | - | 50,000 | |||||||||
|
Total
|
1,057 | $ | 16,460,353 | $ | 26,638,790 | |||||||
Remaining
life expectancy for year 0-1 includes all policies that have exceeded their
original life expectancy plus those policies that are scheduled to reach their
original life expectancy during the next 12 months. Remaining life
expectancy is based on original life expectancy estimates and is not an
indication of expected maturity. Actual maturity dates in any
category may vary significantly (either earlier or later) from the remaining
life expectancies reported above.
Premiums
to be paid for each of the five succeeding fiscal years to keep the life
settlement contracts in force as of February 28, 2010, are as
follows.
|
Year
1
|
$ | 523,440 | ||
|
Year
2
|
305,403 | |||
|
Year
3
|
233,626 | |||
|
Year
4
|
191,740 | |||
|
Year
5
|
17,988 | |||
|
Thereafter
|
12,000 | |||
|
Total
estimated premiums
|
$ | 1,284,197 |
44
We
evaluate the carrying value of our investment in owned policies on a regular
basis, and adjust our total basis in the policies using new or updated
information that affects our assumptions about remaining life expectancy, credit
worthiness of the policy issuer, funds needed to maintain the asset until
maturity, capitalization rates and potential return. We recognize an
impairment on individual policies if the expected undiscounted cash flows are
less than the carrying amount of the investment, plus anticipated undiscounted
future premiums and capitalizable direct external costs, if
any. Impairment of policies is generally caused by the insured
significantly exceeding the estimate of the original life expectancy, which
causes the original policy costs and projected future premiums to exceed the
estimated maturity value. We recorded an impairment of investments in
policies of $281,882 and $151,810 for the years ended February 28, 2010 and
2009, respectively. The fair value of the impaired policies at
February 28, 2010 and 2009, was $576,148 and $253,748,
respectively. There was no impairment of investments in policies for
fiscal 2008.
Our
investment in policies increased significantly during the last quarter of fiscal
2009 and in the first quarter of fiscal 2010, primarily as the result of the
settlement of a lawsuit with the state of Colorado. The Securities
Commissioner for the State of Colorado had filed an action alleging violations
of the Colorado Securities Act in connection with certain life settlements
transacted through our subsidiary, LPI. Under the terms of the
settlement agreement, LPI agreed to offer to purchase the life settlements from
the Colorado purchasers alleged in the complaint, and all purchasers that
accepted the purchase offer received additional compensation for the purchase
equal to statutory interest. As of February 28, 2009, we had
purchased interests in 260 policies and paid $6,318,665, including $1,286,833 of
statutory interest related to the Colorado settlement. In the first
quarter of fiscal 2010, we purchased interests in an additional 264 policies
related to the Colorado settlement and paid $6,441,625, including $1,413,908 of
statutory interest. LPI completed this purchase offer by May 31,
2009. In total, we purchased interests in 524 policies and paid to
the selling purchasers $12,760,290, of which $2,700,741 represented the payment
of statutory interest. Statutory interest was considered part of the
purchase price and is included in the stated carrying value. In the
second, third and fourth fiscal quarters of fiscal 2010 (after the Colorado
settlement was completed), we purchased additional unrelated policies of
$298,395, $269,322, and $407,452, respectively.
The
majority of our Investment in Policies was purchased as part of settlement
agreements and tertiary purchases from existing clients. We do not
currently have a strategy of buying large amounts of policies for investment
purposes, but we expect to continue to make tertiary purchases as they may be
presented to us and if the purchases can be made with benefit to both
parties. Since the purchases for our own account are motivated by
settlements and tertiary purchases, the supply of available policies in the
secondary market does not affect our purchases. The risks that we
might experience as a result of investing in policies are unknown remaining life
expectancy, a change in credit worthiness of the policy issuer, funds needed to
maintain the asset until maturity and changes in capitalization
rates.
(6)
INVESTMENT IN LIFE SETTLEMENTS TRUST
The
amount shown on the balance sheet termed “Investment in Life Settlements Trust”
is an investment in an unaffiliated corporation, Life Assets Trust, S.A. (the
“Trust”), created for
the acquisition of life settlements. On August 26, 2008, we entered
into a contractual agreement to purchase an interest in a limited partnership,
sponsored by SR Assets I, LLC, at a total cost of $5 million. LPI
performed policy-purchasing services for this partnership on a non-exclusive
basis and earned fees from it as LPI would from any other institutional
client. On May 31, 2009, the limited partnership was converted into
the trust, Life Assets Trust, S.A., and our interest in the partnership was
converted from an equity method investment in a partnership to an equity method
investment in a life settlements trust, with three individual directors and JD
Equity, L.P., the majority equity owner. After the conversion, we
invested an additional $1.5 million in the Trust. As of February 28,
2010, we owned 19.9% of the trust, carried at $6.5 million. The Trust
has completed the purchasing phase of its operations and, at February 28, 2010,
owned a portfolio of life insurance settlements with a face value of $706
million, of which LPI supplied settlements with a face value of approximately
$278 million. We anticipate the policies will mature over the next
few years, although we cannot determine the exact time of the policy maturities
and the distribution of the underlying assets. The Trust has
experienced some maturities during the course of this year and we have been paid
from these maturities. Our accounting policy is to show these
maturities in their three components on the statements of cash flows; return of
investment, the cash inflows and the net gain on the investment. Fair
market value for this asset is not readily determinable. We have
considered any potential impairment to the investment and believe no adjustment
to the investment value is warranted.
45
(7)
LEASES
We lease
office equipment under non-cancelable operating leases expiring in various years
through 2012.
Minimum
future rental payments under non-cancelable operating leases having remaining
terms in excess of one year as of February 28, 2010, for each of the next five
years and in the aggregate are as follows:
|
2011
|
$ | 61,751 | ||
|
2012
|
40,036 | |||
|
2013
|
15,019 | |||
|
2014
|
13,974 | |||
|
2015
|
6,539 | |||
|
Total
minimum future rental payments
|
$ | 137,319 |
Rental
expense was $71,921, $54,556 and $53,232 for the years ended February 28, 2010
and 2009, and February 29, 2008, respectively.
Certain
operating leases provide for renewal and/or purchase
options. Generally, purchase options are at prices representing the
expected market value of the property at the expiration of the lease
term. Renewal options are for periods of one year at the rental rate
specified in the lease.
(8)
CREDIT LINES
To
facilitate our short-term cash flow management and operating capital
requirements, we maintained two credit lines. One credit line
was secured by cash and securities on deposit. As of February 28,
2010, the credit line carried an interest rate at the Wall Street Journal Prime
Rate of 3.25% and had a borrowing base of $2.9 million. There
was no outstanding balance as of February 28, 2010 and 2009. We
discontinued this line of credit in March 2010. The other line of
credit was secured by a certificate of deposit. This line of credit
carried an interest rate of 5.55% and had a borrowing base of $1
million. There was no outstanding balance on this line as of February
28, 2010 or 2009. This line of credit terminated when the
collateralized certificate of deposit matured in fiscal 2010.
(9)
LONG-TERM DEBT
We
retired all of our outstanding debt on April 28, 2009. As a result,
there was no long-term debt as of February 28, 2010. As of February
28, 2009, we had $779,073 of current and long-term debt, secured by our land and
office building with a net book value of $895,366.
(10)
INCOME TAXES
Total
income tax expense was allocated for the years ended February 28, 2010 and 2009,
and February 29, 2008, as follows:
|
2010
|
2009
|
2008
|
||||||||||
|
Income
tax expense from continuing operations
|
$ | 18,283,653 | $ | 15,027,538 | $ | 10,030,861 | ||||||
46
Income
tax expense was made up of the following components at February 28, 2010 and
2009, and February 29, 2008:
|
2010
|
2009
|
2008
|
||||||||||
|
Federal
income taxes
|
$ | 16,193,776 | $ | 15,144,333 | $ | 10,220,069 | ||||||
|
Deferred
tax expense (benefit)
|
864,215 | (385,594 | ) | (284,583 | ) | |||||||
|
State
income taxes
|
1,225,662 | 268,799 | 95,375 | |||||||||
|
Total
income tax expense
|
$ | 18,283,653 | $ | 15,027,538 | $ | 10,030,861 | ||||||
Income
tax expense differed from amounts computed by applying the Federal income tax
rate to pre-tax earnings for the years ended February 28, 2010 and 2009, and
February 29, 2008, as a result of the following:
|
2010
|
2009
|
2008
|
||||||||||
|
United
States statutory rate
|
35.0 | % | 35.0 | % | 35.0 | % | ||||||
|
Valuation
allowance
|
1.3 | % | - | - | ||||||||
|
State
income taxes
|
1.1 | % | 0.4 | % | 0.2 | % | ||||||
|
Provision
for uncertainty in income taxes
|
0.6 | % | - | - | ||||||||
|
Permanent
differences
|
0.3 | % | 0.2 | % | ( 0.4 | )% | ||||||
|
Combined
effective tax rate
|
38.3 | % | 35.6 | % | 34.8 | % | ||||||
The tax
effects of temporary differences that gave rise to significant portions of the
deferred tax assets and deferred tax liabilities were as follows:
|
Feb. 28, 2010
|
Feb. 28, 2009
|
|||||||
|
Deferred
tax assets:
|
||||||||
|
Premium
advances
|
$ | 1,154,865 | $ | 1,895,817 | ||||
|
Investment
in securities
|
638,177 | 1,237,834 | ||||||
|
Contingency
costs
|
569,129 | 117,124 | ||||||
|
State
taxes
|
286,150 | - | ||||||
|
Policy
impairments
|
196,487 | 97,829 | ||||||
|
Compensated
absences
|
34,098 | 31,555 | ||||||
|
Loss
on investment in trust
|
22,444 | - | ||||||
| 2,901,350 | 3,380,159 | |||||||
|
Valuation
allowance
|
(611,298 | ) | - | |||||
|
Net
deferred tax assets
|
2,290,052 | 3,380,159 | ||||||
|
Deferred
tax liabilities:
|
||||||||
|
Settlement
costs
|
(945,258 | ) | - | |||||
|
Depreciation
|
(207,456 | ) | (152,732 | ) | ||||
|
Prepaid
expenses
|
(11,958 | ) | - | |||||
|
Net
deferred tax liabilities
|
(1,164,672 | ) | (152,732 | ) | ||||
|
Total
deferred tax asset, net
|
$ | 1,125,380 | $ | 3,227,427 | ||||
In fiscal
2010, we recorded a valuation allowance of $611,298 for capital losses resulting
from other-than-temporary impairments.
47
For the
fiscal periods ended February 28, 2010 and 2009, and February 29,
2008, the amount of non-deductible penalties paid, primarily due to underpayment
of estimated Federal and state income taxes, was $10,438, $63,941, and $4,351,
respectively. These penalties are included in general and
administrative expenses.
With few
exceptions, we are no longer subject to U.S. federal, state or local
examinations by tax authorities for fiscal years 2006 and
prior.
Accounting for Uncertainty in Income
Taxes. In
June 2006, the FASB issued ASC 740, Income Taxes (formerly
FIN 48). ASC 740 is intended to clarify the accounting for
uncertainty in income taxes recognized in a company’s financial statements and
prescribes the recognition and measurement of a tax position taken or expected
to be taken in a tax return. ASC 740 also provides guidance on
de-recognition, classification, interest and penalties, accounting in interim
periods, disclosure and transition.
Under ASC
740, evaluation of a tax position is a two-step process. The first step is
to determine whether it is more likely than not that a tax
position will be sustained upon examination, including the resolution of any
related appeals or litigation based on the technical merits of that position.
The second step is to measure a tax position that meets the
more-likely-than-not threshold to determine the amount of benefit to be
recognized in the financial statements. A tax position is measured at the
largest amount of benefit that is greater than 50% likely of being realized upon
ultimate settlement.
We
adopted ASC 740 at March 1, 2007. At February 28, 2010 we determined
that it is more likely than not that we will be assessed additional Texas Margin
Tax for non-deductibility of certain payments in past and current periods
included in our calculation of the Texas Margin. The amount accrued
for this uncertain tax position at February 28, 2010, including estimated
interest and penalties of $21,932, was $402,104.
The most
current period is the first period with such a tax position. A
reconciliation of the beginning and ending amount of unrecognized tax expense
for the current period is as follows.
|
Balance
at March 1, 2009
|
$ | - | ||
|
Additions
based on tax positions related to the current year
|
402,104 | |||
|
Balance
at February 28, 2010
|
$ | 402,104 |
|
(11)
|
COMPREHENSIVE
INCOME, SHAREHOLDERS’ EQUITY, STOCK TRANSACTIONS AND COMMON STOCK
OPTIONS
|
Comprehensive
income for the years ended February 28, 2010 and 2009, and February 29, 2008,
was $31,724,918, $25,623,304 and $18,026,369, respectively. Basic and
diluted earnings per share for comprehensive income for the years ended February
28, 2010 and 2009, and February 29, 2008, net of tax, were $2.14, $1.72 and
$1.20, respectively.
Dividends. There
are no formal restrictions that materially limit, or are reasonably expected to
materially limit, our ability to pay dividends. We declared and paid
dividends on a quarterly basis and in the amounts as set forth in the following
table:
|
Date Declared
|
Date Paid
|
Dividend Amount
|
||||
|
02/19/07
|
03/15/07
|
$ | 0.0500 | |||
|
05/10/07
|
06/18/07
|
$ | 0.0625 | |||
|
08/13/07
|
09/14/07
|
$ | 0.0600 | |||
|
11/13/07
|
12/15/07
|
$ | 0.0700 | |||
|
02/08/08
|
03/14/08
|
$ | 0.0600 | |||
|
05/21/08
|
06/16/08
|
$ | 0.0700 | |||
|
08/07/08
|
09/15/08
|
$ | 0.0700 | |||
|
10/22/08
|
12/15/08
|
$ | 0.0800 | |||
|
02/24/09
|
03/16/09
|
$ | 0.0700 | |||
|
05/07/09
|
06/15/09
|
$ | 0.0700 | |||
|
05/14/09
|
06/15/09
|
$ | 0.2500 | |||
|
07/27/09
|
09/15/09
|
$ | 0.2500 | |||
|
10/26/09
|
12/15/09
|
$ | 0.2500 | |||
|
01/25/10
|
03/15/10
|
$ | 0.2500 | |||
48
Stock Options. ASC
718-20, Compensation – Stock
Compensation, Awards Classified as Equity (formerly SFAF 123 (R)),
requires the measurement and recognition of compensation expense for all
share-based payment awards made to employees, directors and service providers
based on estimated fair values.
ASC
718-20 requires companies to estimate the fair value of share-based payment
awards on the date of grant using an option-pricing model. The value
of the portion of the award that is ultimately expected to vest is recognized as
expense over the requisite service period (if any) in our financial
statements. ASC 718-20 requires forfeitures to be estimated at the
time of grant and revised, if necessary, in subsequent periods if actual
forfeitures differ from those estimates.
We had no
share based awards that were granted, modified or outstanding for the years
ended February 28, 2010 and 2009, and February 29, 2008, and as a result, we had
no share based compensation expense in any year.
Information
with respect to stock options and warrants outstanding to certain service
providers are as follows:
|
2008
|
||||||||
|
Shares
|
Average Exercise Price
|
|||||||
|
Outstanding
at beginning of year
|
78,125 | $ | 3.84 | |||||
|
Exercised
|
(78,125 | ) | $ | 3.84 | ||||
|
Issued
|
- | - | ||||||
|
Expired
|
- | - | ||||||
|
Outstanding
at end of year
|
- | - | ||||||
Stock Splits. On
August 14, 2007, our board of directors authorized a five-for-four split of the
common stock effected in the form of a stock dividend to be distributed on or
about September 28, 2007, to holders of record on September 14,
2007. On January 6, 2009, our board of directors authorized a
five-for-four split of the common stock, effected in the form of a stock
dividend to be distributed on or about February 16, 2009, to holders of record
on February 6, 2009. The par value of the additional shares of common
stock issued in connection with the stock splits was credited to “Common stock”
and a like amount charged to “Additional paid-in-capital” in the period the
shares were distributed. Accordingly, all references to numbers of
common shares and per share data in the accompanying financial statements have
been adjusted to reflect the stock splits on a retroactive basis. To
accommodate these splits, on August 16, 2007, we increased our authorized common
stock from 10,000,000 shares to 18,750,000 shares. The following
table represents the number of common shares and per share data before and after
the stock splits.
49
|
For
the Year Ended February 28/29,
|
||||||||||||||||||||||||
|
2010
|
2009
|
2008
|
||||||||||||||||||||||
|
Before
Stock
Splits
|
After
Stock
Splits
|
Before
Stock
Splits
|
After
Stock
Splits
|
Before
Stock
Splits
|
After
Stock
Splits
|
|||||||||||||||||||
|
Shares
Outstanding:
Common
Stock issued and outstanding
|
14,859,016 | 14,859,016 | 11,887,213 | 14,859,016 | 9,542,361 | 14,909,940 | ||||||||||||||||||
|
Treasury
Stock
|
165,338 | 165,338 | 132,270 | 165,338 | 73,225 | 114,414 | ||||||||||||||||||
| Average Common and Common Equivalent Shares Outstanding: | ||||||||||||||||||||||||
|
Basic
and Diluted
|
14,859,016 | 14,859,016 | 11,892,934 | 14,886,167 | 9,595,798 | 14,993,434 | ||||||||||||||||||
|
Basic
and Diluted Earnings per Share
|
||||||||||||||||||||||||
|
Net
Income
|
1.98 | 1.98 | 2.28 | 1.83 | 1.95 | 1.25 | ||||||||||||||||||
|
Basic
and Diluted Earnings per Share
|
||||||||||||||||||||||||
|
Comprehensive
Income
|
2.14 | 2.14 | 2.15 | 1.72 | 1.88 | 1.20 | ||||||||||||||||||
Treasury Stock. On January 22, 2008, we
began buying shares on the open market to hold for treasury stock
purposes. We purchased a total of 39,930 shares (split adjusted) in
fiscal 2008 at a total cost of $563,872. We purchased a total of
50,924 shares in fiscal 2009 at a total cost of $699,051. No share
purchases were made in fiscal 2010. These treasury shares are
reflected on the Statements of Shareholders’ Equity and are considered in the
non-affiliated market value calculation.
(12)
FAIR VALUE MEASUREMENTS
ASC 820,
Fair Value
Measurements and
Disclosures, addresses how companies should measure fair value when they
are required to use a fair value measure for recognition or disclosure purposes
under GAAP. ASC 820 defines fair value, establishes a framework for
measuring fair value and expands disclosures about fair value
measurements. Effective March 1, 2008, we adopted ASC 820 with the
exception of certain non-financial assets and non-financial
liabilities. Adoption of ASC 820-10, did not have an impact on our
financial condition, results of operations or cash flows.
In
February 2008, the FASB agreed to defer the effective date of ASC 820 for one
year for certain nonfinancial assets and liabilities, except those that are
recognized or disclosed at fair value in the financial statements on a recurring
basis (at least annually). We adopted ASC 820 as to these items
effective March 1, 2009. Examples of these items
include:
|
|
·
|
Nonfinancial
assets and nonfinancial liabilities that initially are measured at fair
value in a business combination or other new basis event, but are not
measured at fair value in subsequent
periods;
|
|
|
·
|
Asset
retirement obligations that are measured at fair value at initial
recognition, but are not measured at fair value in subsequent
periods; or
|
Nonfinancial
liabilities for exit or disposal activities that are measured at fair value at
initial recognition, but are not measured at fair value in subsequent
periods. We determined the fair values of our financial instruments based
on the fair value hierarchy established in ASC 820, which requires an entity to
maximize the use of observable inputs and minimize the use of unobservable
inputs when measuring fair value. The standard defines fair value,
describes three levels of inputs that may be used to measure fair value, and
expands disclosures about fair value measurements.
50
The term
inputs refers to the
assumptions that market participants use in pricing the asset or
liability. ASC 820 distinguishes between observable inputs and unobservable
inputs. Observable inputs reflect the assumptions market
participants would use in pricing the asset or liability based on market data
obtained from independent sources. Unobservable inputs reflect an
entity’s own assumptions about the assumptions market participants would use in
pricing the asset or liability. ASC 820 indicates that valuation
techniques should maximize the use of observable inputs and minimize the use of
unobservable inputs. ASC 820 establishes a fair value hierarchy that
prioritizes the inputs used in valuation techniques and creates the following
three broad levels, with Level 1 being the highest priority:
|
|
·
|
Level
1 inputs: Level 1 inputs are quoted market prices in active markets for
identical assets or liabilities that are accessible at the measurement
date (e.g., equity securities traded on the New York Stock
Exchange).
|
|
|
·
|
Level
2 inputs: Level 2 inputs are from other than quoted market prices included
in Level 1 that are observable for the asset or liability, either directly
or indirectly (e.g., quoted market prices of similar assets or liabilities
in active markets, or quoted market prices for identical or similar assets
or liabilities in markets that are not
active).
|
|
|
·
|
Level
3 inputs: Level 3 inputs are unobservable (e.g., a company’s own data) and
should be used to measure fair value to the extent that observable inputs
are not available.
|
Following
is a table of Investment in Securities measured at fair value on a recurring
basis as of and February 28, 2010 and 2009, using quoted prices in
active markets for identical assets (Level 1); significant other observable
inputs (Level 2); and significant unobservable inputs (Level 3).
|
Description
|
Level
1:
Quoted Prices
in
Active
Markets for
Identical Assets
|
Level
2:
Significant
Other
Observable Inputs
|
Level
3:
Significant
Unobservable Inputs
|
Total
|
||||||||||||
|
February
28, 2010
|
$ | 4,529,169 | - | - | $ | 4,529,169 | ||||||||||
|
February
28, 2009
|
$ | 2,704,063 | - | - | $ | 2,704,063 | ||||||||||
Our
financial assets and liabilities are cash and cash equivalents, certificates of
deposit, accounts receivable, a note receivable, investments in securities,
investments in policies, investment in a life settlements trust, accounts
payable and accrued liabilities. The recorded values of cash and cash
equivalents, certificates of deposit, accounts receivable, accounts payable, and
accrued liabilities approximate their fair values based on their short-term
nature and are discussed in Notes 2 through 6. The recorded value of
the note receivable is the original note amount plus accrued
interest. Fair value is not readily determinable; the note is
discussed in Note 2. The recorded value of investments in securities
is based on fair value and is discussed in Note 4. The carrying value
of our investment in policies totaled $16,460,353, which includes $319,197 of
capitalized premiums, and has an estimated fair value of
$18,866,580. Fair value of the investment in policies was determined
using Level 2 inputs and was calculated by performing a net present value
calculation of the face amount of the life policies less premiums for the total
portfolio. The investment in policies is discussed in Note
5. The recorded value of the investment in the trust is our
investment account balance. Fair value is not readily
determinable. The investment is discussed in Note 6.
In April
2009, the FASB issued ASC 820-10, Fair Value Measurements and
Disclosures, that provides additional guidance for estimating fair value
in accordance with ASC 820, when the volume and level of activity for the asset
or liability have significantly decreased. ASC 820-10 also includes
guidance on identifying circumstances that indicate a transaction is not
orderly. ASC 820-10 has had no impact on our financial condition,
results of operations or cash flows.
51
(13)
RELATED PARTY TRANSACTIONS
We
currently operate under an agreement with ESP Communications, Inc. (“ESP”), which is owned by the
spouse of our Chief Executive Officer. Under the agreement, ESP
performs certain post-settlement services for us, which include periodic contact
with insureds and their health care providers, monthly record checks to
determine an insured’s status, and working with the outside escrow agent in the
filing of death claims. Either party may cancel the agreement with a
30-day written notice. We currently pay ESP $7,500 on a semi-monthly
basis for its services. We recorded management services expense
concerning this agreement with ESP of $180,000 in each of the years ended
February 28, 2010 and 2009 and February 29, 2008.
We
periodically use an aircraft owned by our Chairman and CEO, and reimburse him
for the incremental costs of our use, as described in applicable Federal
Aviation Administration regulations (FAA Part 91, subpart F). We
believe the reimbursed cost is well below the fair rental value for such
use. In the years ended February 28, 2010 and 2009, we reimbursed
costs of $271,361 and $101,288, respectively, for such use. There
were no payments in fiscal 2008.
(14)
CONTINGENCIES
LPI is
aware of certain instances wherein the insurance companies denied payment on
policies in which it arranged the settlement with purchasers. Most of
these denials are related to unforeseeable reduction in face
value. Face value of the policies in question total $859,206 and are
recorded in accrued settlement expense at February 28, 2010. During
the year ended February 28, 2010, we accrued an additional $335,822 for future
claims that might arise in relation to these policies and paid $294,380 of
settlements during the year, which had been accrued in previous
periods.
We record
provisions in the Consolidated Financial Statements for pending litigation when
we determine that an unfavorable outcome is probable and the amount of the loss
can be reasonably estimated. Except as discussed elsewhere in this
note: (i) management
has not concluded that it is probable that a loss has been incurred in any
pending litigation; or (ii) management is unable to estimate the possible loss
or range of loss that could result from an unfavorable outcome of any pending
litigation; and (iii) accordingly, management has not provided any amounts in
the Consolidated Financial Statements for unfavorable outcomes, if
any.
On April
12, 2010, we entered into a settlement agreement with Maxim Group, LLC, an
investment firm, to settle all claims in a civil action filed in
2007. Under the settlement, we agreed to deliver to Maxim 56,230
shares of our common stock, which were held in treasury, and which were valued
for settlement purposes at $1.25 million ($22.23 per share). The
fairness of this share delivery was affirmed by the court in a fairness hearing,
which was conducted on April 13, 2010. The court’s affirmation
enabled the shares to qualify for exemption from registration under Section
3(a)(10) of the Securities Act of 1933, as amended. The cost of
settlement was accrued in our consolidated financial statements as of February
28, 2010. The settlement cost had no effect on our cash position as
of February 28, 2010. The delivered treasury shares will be shown as issued and
outstanding in the fiscal quarter ending May 31, 2010.
52
On April
24, 2001, the state of Texas initiated a suit against LPI for alleged violations
of the Texas Deceptive Trade Practices Act (“DTPA”). The State
claimed that the contracts LPI used with purchasers before 1998 did not clearly
state that the purchasers were responsible for paying premiums to keep life
insurance policies purchased in force and that LPI had violated the DTPA by
requesting premiums from purchasers. LPI contended that the
purchasers of the policy interests were responsible to pay premiums, as they
were the owners of the policies. The trial court issued a summary
judgment in favor of LPI, which was appealed by the State. After a
lengthy appeals process, the matter was remanded back to the trial court and the
LPI and the State agreed to settle the matter by entering into an Assurance of
Voluntary Compliance (“AVC”) agreement, which was
filed with the court on April 1, 2010. Under the AVC, both parties
stipulate that the action relates only to certain contracts used with Texas
purchasers before 1998. The AVC further stipulates that the Attorney
General did not allege that LPI miscalculated escrow accounts or that it
committed any crime, fraud, misappropriation or malfeasance regarding escrow
accounts. Under the terms of the AVC, LPI agrees not to request any
further premium payments from the Texas purchasers identified in the AVC, to pay
future premiums on their behalf, estimated at $32,162 annually, and to pay
settlement costs totaling $300,000. By entering into the AVC, both
parties agree to release and discharge each other from any and all claims for
damages or other relief arising out of the action and we consider this matter to
be completely resolved and settled.
On May 6,
we settled an administrative case with the Virginia State Corporation
Commission, which provides for a “safe harbor” of procedures and disclosures
that will permit us to accept Virginia residents as purchasers within a clearly
defined regulatory structure. The cost of this settlement of $170,000
was accrued in our consolidated financial statements as of February 28,
2010.
It is
possible that our consolidated results of operations, cash flows or financial
position could be materially affected in a particular fiscal quarter or fiscal
year by an unfavorable outcome or settlement of certain pending
litigation. Nevertheless, although litigation is subject to
uncertainty, management believes and we have been so advised by counsel handling
the respective cases that we have a number of valid claims and defenses in all
pending litigation to which we are a party, as well as valid bases for appeal of
adverse verdicts against us. All such cases are, and will continue to
be, vigorously defended and all valid counterclaims pursued. However,
we may enter into settlement discussions in particular cases if we believe it is
in the best interests of our shareholders to do so.
We have
elected to advance premiums on certain older polices on which the initial
premium payment reserves have been fully utilized. In the typical
life settlement, policy premiums for the insured’s projected life expectancy are
added to the purchase price and those future premium amounts are set aside in an
escrow account to pay future premiums. When the future premium
amounts are exhausted, purchasers are contractually obligated to pay the
additional policy premiums. In some instances, purchasers have failed
to pay the premiums and we have repurchased the policy or advanced the premiums
to maintain the policies. While we have no contractual or other legal
obligation to do so, and do not do so in every instance, we have made premium
advances as an accommodation to certain purchasers based on our assumptions that
we will ultimately recoup the advances. While some purchasers repay
the advances directly, reimbursements of these premiums will come most likely as
a priority payment from the policy proceeds when an insured dies. We
record an allowance against the premium advances at the time of the advance and
treat reimbursements as a reduction of the allowance. We are unable
to estimate the amount of any future advances we may elect to make or the timing
of the amount of reimbursements we are likely to receive. Since
advances precede reimbursements, we expect the amount of advances will exceed
reimbursements as our purchaser base increases. During fiscal years
2010, 2009 and 2008, we advanced premiums totaling $2,518,316, $1,916,693 and
$1,195,018, respectively, and received repayments of advances of $683,669,
$472,217 and $216,251, respectively.
(15)
DEFINED CONTRIBUTION PLAN
We
established a 401(k) retirement plan on March 1, 2007. All employees
were eligible to participate effective January 1, 2008, if they met specified
employment requirements. The 401(k) has a match feature whereby we
will make an annual matching contribution to each participant’s plan account
equal to 100% of the lesser of the participant’s contribution to the plan for
the year or 4% of the participant’s eligible compensation for that
year. The contribution expense for our matching contributions to the
401(k) plan for the years ended February 28, 2010 and 2009, and February
29, 2008 were
$166,949, $69,902 and $8,615, respectively.
53
(16)
QUARTERLY FINANCIAL DATA
The
following tables set forth our unaudited consolidated financial data regarding
operations for each quarter of fiscal 2010, 2009 and 2008. This
information, in the opinion of management, includes all adjustments necessary,
consisting only of normal and recurring adjustments, to state fairly the
information set forth therein. Certain amounts previously reported
have been reclassified to conform to the current presentation. These
reclassifications had no net impact on the results of operations.
|
Fiscal 2010
|
||||||||||||||||
|
1st Quarter
|
2nd Quarter
|
3rd Quarter
|
4th Quarter
|
|||||||||||||
|
Revenues
|
$ | 27,443,604 | $ | 29,055,566 | $ | 30,967,256 | $ | 25,529,857 | ||||||||
|
Income
from Operations
|
$ | 11,060,992 | $ | 11,222,809 | $ | 12,690,816 | $ | 12,463,233 | ||||||||
|
Pre-tax
Income
|
$ | 11,763,199 | $ | 11,759,761 | $ | 13,155,123 | $ | 11,031,848 | ||||||||
|
Net
Income
|
$ | 7,445,469 | $ | 7,625,015 | $ | 8,431,924 | $ | 5,923,870 | ||||||||
|
Net
Income Per Share
|
$ | 0.50 | $ | 0.51 | $ | 0.57 | $ | 0.40 | ||||||||
|
Fiscal 2009
|
||||||||||||||||
|
1st Quarter
|
2nd Quarter
|
3rd Quarter
|
4th Quarter
|
|||||||||||||
|
Revenues
|
$ | 24,438,146 | $ | 24,788,725 | $ | 28,103,930 | $ | 26,283,639 | ||||||||
|
Income
from Operations
|
$ | 9,500,348 | $ | 9,588,093 | $ | 10,669,663 | $ | 10,749,567 | ||||||||
|
Pre-tax
Income
|
$ | 9,867,631 | $ | 10,071,429 | $ | 11,306,583 | $ | 10,941,011 | ||||||||
|
Net
Income
|
$ | 6,248,575 | $ | 6,603,491 | $ | 7,282,878 | $ | 7,024,172 | ||||||||
|
Net
Income Per Share
|
$ | 0.42 | $ | 0.45 | $ | 0.48 | $ | 0.48 | ||||||||
|
Fiscal 2008
|
||||||||||||||||
|
1st Quarter
|
2nd Quarter
|
3rd Quarter
|
4th Quarter
|
|||||||||||||
|
Revenues
|
$ | 17,578,976 | $ | 17,646,109 | $ | 19,298,726 | $ | 18,085,444 | ||||||||
|
Income
from Operations
|
$ | 6,713,326 | $ | 6,157,526 | $ | 7,513,238 | $ | 6,869,823 | ||||||||
|
Pre-tax
Income
|
$ | 7,047,449 | $ | 6,588,621 | $ | 7,983,069 | $ | 7,167,993 | ||||||||
|
Net
Income
|
$ | 4,723,946 | $ | 4,341,111 | $ | 5,215,695 | $ | 4,475,519 | ||||||||
|
Net
Income Per Share
|
$ | 0.31 | $ | 0.29 | $ | 0.35 | $ | 0.30 | ||||||||
54
EXHIBIT
INDEX
DESCRIPTION
OF EXHIBIT
|
Number
|
Description
|
Page
|
||
|
3.1
|
Articles
of Incorporation, dated August 16, 2002
|
56
|
||
|
3.2
|
Amended
Articles of Incorporation, dated April 24, 2003
|
60
|
||
|
3.3
|
Amended
Articles of Incorporation, dated August 16, 2007 (as
corrected)
|
61
|
||
|
3.4
|
Amended
and Restated Bylaws
|
62
|
||
|
4.1
|
Form
of stock certificate for our common stock
|
82
|
||
|
14
|
Code
of Ethics for Directors and Executive Officers (1)
|
|||
|
21
|
Subsidiaries
of the Registrant
|
84
|
||
|
31
|
Rule
13a-14(a) Certifications
|
85
|
||
|
32
|
Section
1350 Certification
|
87
|
|
|
(1)
|
This
exhibit was filed with our Annual Report on Form 10-KSB for the year ended
February 29, 2004, and is incorporated by reference
herein.
|
55