Attached files
Table of Contents
UNITED STATES
SECURITIES AND EXCHANGE COMMISSION
Washington, D.C. 20549
Form 10-K
(Mark One)
| þ | ANNUAL REPORT PURSUANT TO SECTION 13 OR 15(d) OF THE SECURITIES EXCHANGE ACT OF 1934 |
For the fiscal year ended March 31, 2010
OR
| ¨ | TRANSITION REPORT PURSUANT TO SECTION 13 OR 15(d) OF THE SECURITIES EXCHANGE ACT OF 1934 |
For the transition period from to .
Commission file number: 000-23193
APPLIED MICRO CIRCUITS CORPORATION
(Exact name of registrant as specified in its charter)
| Delaware | 94-2586591 | |
| (State or other jurisdiction of incorporation or organization) |
(I.R.S. Employer Identification No.) |
| 215 Moffett Park Drive, Sunnyvale, CA | 94089 | |
| (Address of principal executive offices) | (zip code) |
Registrant’s telephone number, including area code:
(408) 542-8600
Securities registered pursuant to Section 12(b) of the Act:
| Title of Each Class |
Name of Exchange on Which Registered | |
| Common Stock, $0.01 par value |
The Nasdaq Global Select Market |
Securities registered pursuant to Section 12(g) of the Act:
None
Indicate by check mark if the registrant is a well-known seasoned issuer, as defined in Rule 405 of the Securities Act. Yes ¨ No þ
Indicate by check mark if the registrant is not required to file reports pursuant to Section 13 or Section 15(d) of the Act. Yes ¨ No þ
Indicate by check mark whether the registrant: (1) has filed all reports required to be filed by Section 13 or 15(d) of the Securities Exchange Act of 1934 during the preceding 12 months (or for such shorter period that the registrant was required to file such reports), and (2) has been subject to such filing requirements for the past 90 days. Yes þ No ¨
Indicate by check mark whether the registrant has submitted electronically and posted on its corporate Web site, if any, every Interactive Data File required to be submitted and posted pursuant to Rule 405 of Regulation S-T during the preceding 12 months (or for such shorter period that the registrant was required to submit and post such files). Yes ¨ No ¨
Indicate by check mark if disclosure of delinquent filers pursuant to Item 405 of Regulation S-K is not contained herein, and will not be contained, to the best of registrant’s knowledge, in definitive proxy or information statements incorporated by reference in Part III of this Form 10-K or any amendment to this Form 10-K. þ
Indicate by check mark whether the registrant is a large accelerated filer, an accelerated filer, a non-accelerated filer, or a smaller reporting company. See the definitions of “large accelerated filer,” “accelerated filer” and “smaller reporting company” in Rule 12b-2 of the Exchange Act:
| Large accelerated filer ¨ | Accelerated filer | þ | ||||
| Non-accelerated filer ¨ | (Do not check if a smaller reporting company) | Smaller reporting company | ¨ |
Indicate by check mark whether the registrant is a shell company (as defined in Exchange Act Rule 12b-2). Yes ¨ No þ
The aggregate market value of the voting common stock held by non-affiliates of the registrant, based upon the closing sale price of the registrant’s common stock on September 30, 2009 (the last day of the registrant’s second quarter of fiscal 2010) as reported on the Nasdaq Global Select Market, was approximately $579,738,000. Shares of common stock held by each officer and director and by each person who then owned 10% or more of the outstanding common stock have been excluded in that such persons may be deemed to be affiliates. This determination of affiliate status is not necessarily a conclusive determination for other purposes. The registrant has no non-voting common stock.
There were 65,459,898 shares of the registrant’s common stock issued and outstanding as of April 30, 2010.
Documents Incorporated by Reference
The following document is incorporated by reference in Part III (Items 10, 11, 12, 13 and 14) of this Annual Report on Form 10-K: portions of registrant’s definitive proxy statement for its annual meeting of stockholders to be held on August 17, 2010 which will be filed with the Securities and Exchange Commission within 120 days of March 31, 2010.
Table of Contents
APPLIED MICRO CIRCUITS CORPORATION
ANNUAL REPORT ON FORM 10-K
FOR THE FISCAL YEAR ENDED
MARCH 31, 2010
| Page | ||||
| PART I | ||||
| Item 1. |
1 | |||
| Item 1A. |
11 | |||
| Item 1B. |
30 | |||
| Item 2. |
30 | |||
| Item 3. |
30 | |||
| Item 4. |
30 | |||
| PART II | ||||
| Item 5. |
31 | |||
| Item 6. |
33 | |||
| Item 7. |
Management’s Discussion and Analysis of Financial Condition and Results of Operations |
34 | ||
| Item 7A. |
51 | |||
| Item 8. |
52 | |||
| Item 9. |
Changes in and Disagreements With Accountants on Accounting and Financial Disclosure |
52 | ||
| Item 9A. |
52 | |||
| Item 9B. |
53 | |||
| PART III | ||||
| Item 10. |
53 | |||
| Item 11. |
53 | |||
| Item 12. |
Security Ownership of Certain Beneficial Owners and Management and Related Stockholder Matters |
53 | ||
| Item 13. |
Certain Relationships and Related Transactions and Director Independence |
54 | ||
| Item 14. |
54 | |||
| PART IV | ||||
| Item 15. |
54 | |||
| 57 | ||||
| F-1 | ||||
i
Table of Contents
CAUTIONARY STATEMENT ABOUT FORWARD-LOOKING STATEMENTS
All statements included or incorporated by reference in this report, other than statements or characterizations of historical fact, are forward-looking statements. These forward-looking statements are made as of the date of this Annual Report on Form 10-K for the fiscal year ended March 31, 2010 (this “Annual Report”). Any statement that refers to an expectation, projection or other characterization of future events or circumstances, including the underlying assumptions, is a forward-looking statement. We use certain words and their derivatives such as “anticipate”, “believe”, “plan”, “expect”, “estimate”, “predict”, “intend”, “may”, “will”, “should”, “could”, “future”, “potential”, and similar expressions in many of the forward-looking statements. The forward-looking statements are based on our current expectations, estimates and projections about our industry, management’s beliefs, and other assumptions made by us. These statements and the expectations, estimates, projections, beliefs and other assumptions on which they are based are subject to many risks and uncertainties and are inherently subject to change. We describe many of the risks and uncertainties that we face in Part 1. Item 1A, Risk Factors and elsewhere in this Annual Report. Our actual results and actual events could differ materially from those anticipated in any forward-looking statement. Readers should not place undue reliance on any forward-looking statement.
In this Annual Report, “Applied Micro Circuits Corporation”, “AMCC”, “APM”, “AppliedMicro”, the “Company”, “we”, “us” and “our” refer to Applied Micro Circuits Corporation and all of our consolidated subsidiaries.
PART I
| Item 1. | Business. |
Applied Micro Circuits Corporation was incorporated and commenced operations in California in 1979. AppliedMicro was reincorporated in Delaware in 1987. Our principal executive offices are located at 215 Moffett Park Drive, Sunnyvale, California 94089 and our phone number is 408-542-8600. Our common stock trades on the Nasdaq Global Select Market under the symbol “AMCC”.
Overview
AppliedMicro provides semiconductor solutions for the enterprise, telecom and consumer/small medium business (“SMB”) markets. We design, develop, market and support high-performance low power integrated circuits (“ICs”), which are essential for the processing, transporting and storing of information worldwide. In the telecom and enterprise markets, we utilize a combination of design expertise coupled with system-level knowledge and multiple technologies to offer IC products for wireline and wireless communications equipment such as wireless access points, wireless base stations, multi-function printers, enterprise and edge switches, blade servers, storage systems, gateways, core switches, routers, metro, long-haul, and ultra-long-haul transport platforms. In the consumer/SMB markets, we combine optimized software and system-level expertise with highly integrated semiconductors to deliver comprehensive reference designs and stand-alone semiconductor solutions for wireline and wireless communications equipment such as wireless access points, network attached storage, and residential and smart energy gateways. Our corporate headquarters are located in Sunnyvale, California. Sales and engineering offices are located throughout the world.
As part of our re-branding effort launched in 2009, we now commonly refer to ourselves as AppliedMicro. However our Nasdaq Global Select Market Symbol remains unchanged as AMCC.
On April 21, 2009, we sold our 3ware storage adapter business to LSI Corporation. See “Sale of the 3ware Storage Adapter Business to LSI Corporation” in Part II, Item 7, Management’s Discussion and Analysis of Financial Condition and Results of Operations for more information.
Available Information
We maintain a web site to which we regularly post copies of our press releases as well as additional information about us. Our filings with the Securities and Exchange Commission (“SEC”), including our annual
1
Table of Contents
reports on Form 10-K, quarterly reports on Form 10-Q, current reports on Form 8-K and any amendments to those reports filed or furnished pursuant to Section 13(a) or 15(d) of the Securities Exchange Act of 1934, as amended (the “Exchange Act”) are available free of charge through the Investor Relations section of our web site at www.appliedmicro.com and are accessible as soon as reasonably practicable after being electronically filed with or furnished to the SEC. Interested persons can subscribe on our web site to email alerts that are sent automatically when we issue press releases, file our reports with the SEC or post certain other information to our web site. Information accessible through our web site does not constitute a part of this Annual Report.
Copies of this Annual Report are also available free of charge, upon request to our Investor Relations Department, 215 Moffett Park Drive, Sunnyvale, California 94089. In addition, our Board Guidelines, Code of Business Conduct and Ethics and written charters for the various committees of our Board of Directors are accessible through the Corporate Governance tab in the Investor Relations section of our web site and are available in print free of charge to any shareholder who requests a copy.
You may read and copy materials that we file with the SEC at the SEC’s Public Reference Room at 100 F Street, NE, Washington DC 20549. Information on the operation of the Public Reference Room is available by calling the SEC at 1-800-SEC-0330. The SEC maintains a web site that contains reports, proxy statements and other information we file with the SEC. The address of the SEC’s web site is www.sec.gov.
Industry Background
The Communications Industry
Communications technology has evolved considerably over the last decade due to the substantial growth in the Internet and wireless communications. The emergence of new applications, such as wireless web devices, Voice over Internet Protocol (“VoIP”), video traffic in general, the emergence of smart meters and other similar devices, third and fourth generation (“3G” & “4G”) wireless services and feature rich smartphones are all fueling a significant increase in demand for higher speed, higher bandwidth and ubiquitous remote network access. These in turn, have increased network complexity and the bandwidth requirements between home and data center. The continuing adoption of broadband technology, such as streaming media, instant messaging, social networking and e-commerce, combined with the increasing availability of next-generation wireless devices that incorporate features such as high speed Internet browsing, high definition cameras, video recorders and video displays is expected to drive significant additional data traffic through the network infrastructure in the future. The different types of data transmitted at various speeds over the Internet require service providers and enterprises to invest in efficient multi-service equipment that can securely and efficiently process and transport the varied types of network traffic, regardless of whether it is voice, media or data traffic. Furthermore, the solution providers are under tremendous pressure to improve performance while lowering overall power consumption. To achieve the performance and functionality required by such systems, Original Equipment Manufacturers (“OEMs”) must utilize more complex ICs to address cost, power and functionality of a system. As a result of the pace of new product introductions, the proliferation of standards to be accommodated and the costs and difficulty of designing and producing the required ICs, equipment suppliers have increasingly outsourced these ICs to semiconductor firms with specialized expertise. These trends have created a significant opportunity for IC suppliers that can design cost-effective solutions for the processing and transport of data. OEMs require IC suppliers that possess system-level expertise and can quickly bring to market high-performance, highly reliable, power-efficient ICs.
The increase in volume and complexity of network traffic has led to the development of new technologies for more efficient networks. These technologies provide substantially greater transmission capacity, are less error prone and are easier to maintain than traditional networks. These more efficient networks carry high-speed traffic in the form of optical signals that are transmitted and received by complex networking equipment. To ensure that this equipment and the various networks can communicate with each other, OEMs and makers of semiconductors have developed numerous communications standards and protocols for the industry. For example, the
2
Table of Contents
synchronous optical network (“SONET”) standard in North America and Japan and the synchronous data hierarchy (“SDH”) standard in the rest of the world became the standards for the transmission of signals over optical fiber. The SONET/SDH standards facilitate high data integrity and improved network reliability, while reducing maintenance and other operation costs by standardizing interoperability among equipment from different vendors. Unfortunately this technology and the standards were designed around optimizing voice traffic which until three years ago was the majority of the traffic on the networks. With exponential increases in data and video traffic and very modest increases in voice traffic, data has become the dominant traffic over all networks today. As a result, networking infrastructure equipment increasingly emphasizes efficient transporting packet-encapsulated data protocols such as internet protocol (“IP”). Wave Division Multiplexing (“WDM”) and Optical Transport Network (“OTN”) have emerged as transmission technologies that provide improved bandwidth utilization at a lower incremental infrastructure cost while being backwards compatible with existing SONET/SDH networks. The increasing volume of network traffic across the long distance optical networks places additional demands on service provider and enterprise datacenter connectivity, resulting in increased numbers of high speed copper and optical links such as 10 Gigabit Ethernet.
AppliedMicro Strategy
AppliedMicro is a global leader in providing energy efficient sustainable solutions to process and transport information for current and next generation networks. Being a leader in mixed-signal design, high speed signal processing, IP and Ethernet packet processing and embedded processors gives AppliedMicro the foundation to compete and excel in the next several generations of solutions. Our patented innovations provide high value, low power solutions in telecom (wireline and wireless), enterprise and consumer applications. Our products enable the development of converged IP-based networks offering high-speed secure data, high-definition video and high-quality voice for service provider (metropolitan, access, home), datacenter, and enterprise applications.
AppliedMicro is a semiconductor company that possesses fundamental and differentiated intellectual property for mixed-signal design, high speed signal processing, packet based communications processors and telecommunications transport protocols. This intellectual property enables us to be a key player in the consumer, enterprise, datacenter and telecommunications applications.
Overall, as part of the evolution of our growth and execution strategy, and to remain competitive, we expect to continue to transition our products to silicon fabrication processes that utilize increasingly smaller feature geometries and to increasingly integrate more functions into our silicon solutions. To accomplish this, we will need to utilize very complex deep submicron technologies. This continuing transition to increased integration of additional functions combined with smaller geometry process technologies may result in reduced manufacturing yields, delays in product deliveries and increased expenses which may adversely impact our business, financial condition and operating results. For more information see our risk factor titled “We may experience difficulties in transitioning to smaller geometry process technologies or in achieving higher levels of design integration and that may result in reduced manufacturing yields, delays in product deliveries and increased expenses” in Part I, Item 1A, Risk Factors, below.
We have focused our product development efforts on high growth opportunities for processing and transporting information. Our strategy for each of these areas is as follows:
Processing
We are continuing to develop products based on the Power Architecture. This standard processor architecture, developed by IBM, is the leading architecture within the communications market for high-performance embedded systems. Many of our customers’ products require embedded processing solutions for managing control plane and data plane functionality. Our products combine the embedded central processing unit (“CPU”) core with peripheral functionality to create optimum solutions for applications such as wireless access points, residential gateways, wireless base-stations, storage controllers, network attached storage, network switches and routing products. We also have substantial expertise in special purpose network processing
3
Table of Contents
architectures for control plane processing. Products based on these architectures are broadly deployed and continue to be designed into major telecommunications, consumer, and networking equipment. We are developing integrated products that leverage the general purpose embedded processing capabilities of the Power Architecture in combination with technologies derived from our portfolio of traffic management and packet processing products to create solutions that are ideally suited for converged IP-based networks. Additionally, due to the general-purpose nature of our processors many of our processing products find their way into auxiliary markets such as printers, storage devices, video surveillance and other consumer electronic devices.
Transporting
Our transport technology product’s historical focus has been on the SONET/SDH optical telecommunications infrastructure where we are a leading vendor. Currently, our transport products sell into both the telecom and datacom markets. In the telecom market, emerging metro Ethernet and residential triple play applications such as internet protocol television (“IPTV”) and OTN deployments are driving substantial investments in optical infrastructure. These new deployments are increasingly based on metro or carrier class Ethernet with high performance signal processing to address the requirements of lower cost, lower power consumption and reduced equipment footprints for metro access, metro edge, metro core and long haul networks. Our Forward Error Correction (“FEC”) and Physical layer (“PHY”) devices play a critical role in providing cost and power optimized solutions for the leading edge platforms in the Wide Area Network.
In the datacom segment, the amount of data being created and consumed in the emerging cloud computing, data center and enterprise networks as they continue to deploy virtualization technologies for computing and storage is continuing unabated. To address the rapidly increasing volume of information, the data center networks are migrating from gigabit Ethernet to ten gigabit Ethernet (“10GE”) connectivity for server to server, intra-blade server and access to datacenter speeds. AppliedMicro’s datacenter 10G PHY portfolio which consists of optical, backplane and short reach copper solutions is specifically targeted to provide high speed connectivity and increased density at lower power and cost points to enable penetration of the present and future datacenter/enterprise server/switch platforms.
We are continuing to focus our current transport investments on these high growth 10G and beyond, datacenter, OTN and enterprise market opportunities while continuing to service the SONET/SDH market with a broad portfolio of PHY, clock and data recovery (“CDR”), FEC and SONET/SDH mapper devices.
Products and Customers
We develop products for processing and for transporting data as well as providing high speed connectivity solutions. These products are used in a wide variety of communications and other networking applications such as the infrastructure for wide area networks, carrier access networks, and enterprise networks.
Most of our products can be grouped into the functional categories listed below.
Physical Layer Products: Our mixed-signal Telecom PHY ICs transmit and receive signals in a very high-speed serial format. Our products are able to correctly receive these signals in challenging environments through the inclusion of highly efficient dispersion compensation methodologies. This low noise capability permits the transmission of signals over greater distances with fewer errors. Our PHY ICs also convert high-speed serial formats to low-speed parallel formats and vice versa. These products set a new benchmark for performance and power consumption in the industry. Our customers include virtually all of the leading OEMs for both wide area and access network equipment: Cisco, Juniper Networks, Fujitsu, Huawei, Nokia-Siemens Networks, Alcatel-Lucent, ZTE and many others.
AppliedMicro also designs and markets competitive mixed-signal datacom 10GE optical PHYs. These products, such as the QT2025 and the QT2225, are targeted at the higher volume datacenter switching and server markets served by system vendors such as Cisco, Force-10, Extreme Networks, Juniper Networks, Hewlett-Packard, Dell, IBM, Fujitsu and others.
4
Table of Contents
Framer and Mapper Products: Our framing layer ICs transmit and receive signals to and from the physical layer in a parallel format and are used in high-speed optical network infrastructure equipment. For OTN applications, AppliedMicro’s framer products incorporate our industry-leading FEC Technology to dramatically improve performance. We are experiencing extended design win growth and shipments for the Rubicon OTN device. In particular, the 10GE mapping techniques in the Rubicon chip have made it one of the leading solution choices in the marketplace for OTN transport. Our Pemaquid device, a mixed-signal Ethernet optimized OTN mapper and FEC device, was built on the success of the Rubicon chip and has garnered a lot of industry wide attention, resulting in major design wins across most of the Tier-1 platforms and was named Electronic Products Magazine’s Product of the Year in 2008. Pemaquid integrates the PHY, MAC and Mapper functionality while reducing power and size footprint by nearly 60% compared to the Rubicon based solution. This has a very positive impact on the customers’ bill of materials. Our current customers for framers and mappers include Adva, Alcatel-Lucent, Ciena, Cisco, ECI, Ericsson, NEC, Nortel, Tellabs, Fujitsu, Huawei, Juniper and ZTE.
Embedded Processor Products: We are one of the leading suppliers of embedded processors. Our embedded processors are widely deployed in a variety of critical applications in target markets such as Wireless Infrastructure, Wireless LAN (“WLAN”), Residential, Datacenters and Enterprise. In Wireless Infrastructure, our embedded processors are used in base station controllers by leading suppliers of WCDMA and GSM equipment. In networking equipment such as edge, core and enterprise routers, our embedded processors handle overall system maintenance and management functions. In WLAN applications, our embedded processors are installed in a significant share of all Enterprise class access points shipped worldwide. Our products utilize IBM’s PowerPC 4xx processor cores in various speed grades. These cores are integrated with various peripheral functionality to create specialized system on a chip (“SoC”) product solutions. As carrier and metro networks transition to Ethernet and IP-based networks, the need for high performance general purpose embedded processing increases. Versions of our processors are also targeted at large opportunities in RAID storage processing, multi-function printers and a variety of other embedded applications. In fiscal 2010, we introduced the APM83K family of products. Based on the Titan core, this solution family featured the first internally developed core by AppliedMicro and an SoC that enabled us to offer multi-core solutions to our customers. The first part in the APM83K family provides support for Gigabit Ethernet, PCI Express, USB and integrated security processing acceleration which will offer performance of up to 1.5 GHz (Gigahertz) at very competitive power dissipation compared to devices fabricated in the same or largely similar technology node. Our current Embedded Processor customers include Cisco, Nokia-Siemens Networks, Brocade, Hewlett-Packard, Apple, Fujitsu, Panasonic and Ericsson.
Packet Processing Products: Our packet processor ICs are programmable processors that receive and transmit signals to and from the framing layer and perform the processing of packet and cell headers. Our current customers for packet processors include Alcatel-Lucent, Cisco, Fujitsu, Nortel, Huawei and Juniper.
Cell Switching Products: Our switch fabric ICs switch information in the proper priority and to the proper destinations. Our switch fabric product portfolio includes our packet routing switch (“PRS”) fabric devices such as the PRS 80G, Q-80G and queuing managers like C48X and C192X. Our current customers for switching layer products include Alcatel-Lucent, Fujitsu, Huawei, Ericsson, Nortel and Tellabs.
Technology
We utilize our technological and design competencies to solve the problems of high-speed analog, digital and mixed-signal circuit designs, high performance processors that combine to provide many essential products for the transporting and processing of information worldwide. We blend systems and software expertise with a high-level of silicon integration to deliver communications ICs and software for global communication networks. Our embedded processor product lines deliver performance and a rich mix of features for Internet datacenters, communication networks, data storage, consumer and imaging applications.
5
Table of Contents
Our systems architects, design engineers, technical marketing and applications engineers have a deep understanding of the copper and fiber optic communications systems for which we design and build application specific standard products. Using this systems expertise, we develop semiconductor connectivity devices to meet the OEMs’ high-bandwidth requirements. By understanding the systems into which our products are designed, the end application of our products among carriers and service providers and the requirements driven by their service level agreements, we believe that we are better able to anticipate and develop solutions optimized for the various cost, power and performance trade-offs faced by our customers. We believe that our systems knowledge also enables us to develop more comprehensive, interoperable solutions.
We have developed multiple generations of products that integrate both analog and digital elements on the same IC, while balancing the difficult trade-offs of speed, power and timing inherent in very dense high-speed applications. The mixing of digital and analog signals poses difficult challenges for IC designers, particularly at high frequencies. We have gained significant expertise in mixed-signal IC designs through the development of multiple product generations. We were one of the first companies to embed analog phase locked loops in bipolar chips with digital logic for high-speed data transmission and reception applications. Since the introduction of our first on-chip clock recovery and clock synthesis products in 1993, we have refined these products and have successfully integrated multiple analog functions and multiple channels on the same IC. We will continue to apply these competencies in the development of more complex products in the future.
Although we completed the sale of our 3ware storage adapter business to LSI Corporation on April 21, 2009, as discussed in “Sale of the 3ware Storage Adapter Business to LSI Corporation” in Part II, Item 7, Management’s Discussion and Analysis of Financial Conditions and Results of Operations, we remain active in the storage industry with our design and sale of embedded storage processor chips and 10 gigabit connectivity solutions with our Embedded Process products. We intend to continue working closely with leaders in the storage, networking and computing industries to design and develop new and enhanced storage connectivity products. We believe that establishing strategic relationships with technology partners is essential to ensure that we continue to design and develop competitive products that integrate well with solutions from other leading participants in the storage markets.
Research and Development
Our research and development expertise and efforts are focused on the development of high-performance analog, digital and mixed-signal ICs and on the development of highly integrated embedded processing SoC ICs for the communications market. We also develop high-performance libraries and design methodologies that are optimized for each of these applications. Our primary research and development facilities are located in Sunnyvale and San Diego, California, Austin, Texas and Andover, Massachusetts in the United States, Ottawa in Canada, Ho Chi Minh City in Vietnam and Pune in India. During the fiscal years ended March 31, 2010, 2009 and 2008, we expended $88.1 million, $84.7 million and $86.1 million, respectively, on research and development activities.
Our IC product development is focused on building high-performance, high-complexity digital and analog-intensive designs that are incorporated into well-documented blocks that can be reused for multiple products. We have made and will continue to make significant investments in advanced design tools to leverage the efforts of our engineering staff. Our product development is driven by the imperatives of reducing design cycle time, increasing first-time design correctness, adhering to disciplined, well documented design processes and continuing to be responsive to customer needs. We are also developing high-performance final assembly packages for our products in collaboration with our packaging suppliers and our customers.
Our PCBA development efforts are focused on building advanced telecom computing architecture (“ATCA”) evaluation boards and software for our switch fabric, network processors and embedded PowerPC processors for the communications market. Before a new product is developed, our research and development engineers work with marketing managers and customers to develop a comprehensive requirements specification. After the product is designed and commercially released, our engineers continue to work with customers on early design-in efforts to understand requirements for future generations and upgrades.
6
Table of Contents
On May 17, 2009, we entered into agreements with Veloce Technologies, Inc. (“Veloce”), pursuant to which Veloce has agreed to perform product development work for us on an exclusive basis for up to five years for cash and other consideration, including a warrant to purchase shares of our common stock, which will vest upon the achievement of both, certain performance and time-based milestones. Under the merger agreement, we agreed to acquire Veloce if certain performance milestones and delivery schedules set forth under the agreements are achieved. We also have the unilateral option to acquire Veloce in the event Veloce fails to meet the milestones and delivery schedules. If we acquire Veloce pursuant to the merger agreement, the purchase price is estimated to be in the range of approximately $5 million up to approximately $100 million, subject to adjustments. The final price would be based upon the achievement and timing of achieving multiple performance milestones. Our chief executive officer has been appointed to Veloce’s Board of Directors. In addition, we have provided Veloce a promissory note of $1.5 million to be forgiven over eight quarters starting on March 31, 2011. If Veloce commits a material breach of the merger agreement, the outstanding principal amount of the note and accrued interest will become due. If we commit a material breach of the merger agreement, the outstanding principal amount of the note and accrued interest is to be forgiven by us. We agreed to pay Veloce $1.5 million per quarter for up to twelve consecutive quarters in order to assist Veloce in meeting its expenses to perform its obligations under the agreement. Through March 31, 2010, no milestones have been met. For a more detailed discussion, see Note 12 of the Notes to Consolidated Financial Statements included in Part IV, Item 15, Exhibits, Financial Statement Schedules, of this Annual Report.
Manufacturing
Manufacturing of Integrated Circuits
The manufacturing of ICs requires a combination of competencies in advanced silicon technologies, package design and manufacturing and high speed test and characterization. We have obtained access to advanced complementary metal-oxide semiconductor (“CMOS”) and silicon germanium processes through foundry relationships. We have substantial experience in the development and use of plastic and ceramic packages for high-performance applications. The selection of the optimal package solution is a vital element of the delivery of high-performance products and involves balancing cost, size, thermal management and technical performance. We purchase our ceramic and plastic packages from several vendors including Advanced Semiconductor Engineering (“ASE”), AMKOR, ASAT, IBM, Kyocera, and NTK.
Wafer Fabrication
We do not own or operate foundries for the production of silicon wafers from which our products are made. We use external foundries such as IBM, Taiwan Semiconductor Manufacturing Corporation (“TSMC”) and United Microelectronics Corporation (“UMC”) for the majority of our production of silicon wafers. Subcontracting our manufacturing requirements eliminates the high fixed cost of owning and operating a semiconductor wafer fabrication facility and enables us to focus our resources on design of ICs and applications where we believe we have greater core competencies and competitive advantages.
Assembly and Testing
Our wafer probe and other product testing are conducted at independent test subcontractors. After wafer testing is complete, the majority of our products are sent to multiple subcontractors for assembly, predominately located in Asia. Following assembly, the devices are tested at subcontractors and returned to us ready for shipment to our customers. Certain of these services are available from a limited number of sources and lead times are occasionally extended.
Sales and Marketing
Our sales and marketing strategy is to develop strong, engineering-intensive relationships with the customer design teams for the creation of market leading platforms. We maintain close working relationships with these customers so our marketing team can focus on identifying and developing new products that will meet their needs in the future, involving us in the early stages of our customers’ plans to design new equipment. We sell our products both directly and through a network of independent manufacturers’ representatives and distributors. Our
7
Table of Contents
direct sales force is technically trained. Expert technical support is critical to our customers’ success and we provide such support through our field applications engineers, technical marketing team and engineering staff, as well as through our extranet technical support web site.
We augment this strategic account sales approach with domestic and foreign distributors that service some of our accounts purchasing standard ICs. Typically, these distributors handle a wide variety of products, including those that compete with our products and fill orders for many customers. We use marketing programs to augment the distribution effort to reach many of our customers. Most of our sales to distributors are made under agreements allowing for price protection and stock rotation of unsold merchandise. Our sales headquarters is located in Sunnyvale, California. We maintain sales offices throughout the world. Net revenues generated from each category of our products as well as information regarding net revenue generated from each of our significant customers and a geographic breakdown of our net revenues is summarized in Part II, Item 7, Management’s Discussion and Analysis of Financial Condition and Results of Operations.
Backlog
Our sales are made primarily pursuant to standard purchase orders for the delivery of products. Quantities of our products to be delivered and delivery schedules are frequently revised to reflect changes in customers’ needs; customer orders generally can be cancelled or rescheduled without significant penalty to the customer. For these reasons, our backlog as of any particular date is not representative of actual sales for any succeeding period and therefore, we believe that backlog is not necessarily a good indicator of future revenue trends.
Competition
In the transport communications IC markets, we compete primarily against companies such as Broadcom, PMC-Sierra, Cortina, Netlogic and Vitesse. In the embedded processor communications IC market, we compete with technology companies such as Freescale Semiconductor, Cavium and Intel. In addition, some of our customers and potential customers have internal IC designs or manufacturing capabilities with which we compete.
The communications IC market is highly competitive and is subject to rapid technological change. The nature of the communications IC market is that design cycles are often measured in years. As such, an IC supplier’s timing of delivery to market is critical as once an IC supplier’s product is designed into a customer’s products, the IC supplier can often enjoy sales of the product for several years. Conversely, if a supplier misses a design cycle or develops an uncompetitive product, the supplier may never generate significant revenues from the product. We typically face competition at the design stage when our customers are selecting which components to use in their next generation equipment. We believe that the principal factors of competition for the markets we serve include: product performance, quality, reliability, integration, price and time-to-market, as well as our reputation and level of customer support. Our ability to successfully compete in these markets depends on our ability to design and subcontract the manufacture of new products that implement new technologies and gain end-market acceptance in a time-efficient and cost-effective manner.
Proprietary Rights
We rely in part on patents to protect our intellectual property. We have been issued approximately 292 patents, which principally cover certain aspects of the design and architecture of our IC and enterprise storage products. In addition, we have over 115 inventions in various stages of the patenting process in the United States and abroad. There can be no assurance that any of our pending patent applications or any future applications will be approved, or that any issued patents will provide us with competitive advantages or will not be challenged by third parties or that if challenged, will be found to be valid or enforceable, or that the patents of others will not have an adverse effect on our ability to do business. There can be no assurance that others will not independently develop similar products or processes, duplicate our products or processes or design around any patents that may be issued to us.
To protect our intellectual property, we also rely on a combination of mask work protection under the Federal Semiconductor Chip Protection Act of 1984, trademarks, copyrights, trade secret laws, employee and third-party nondisclosure agreements and licensing arrangements.
8
Table of Contents
As a general matter, the semiconductor and enterprise storage industries are characterized by substantial litigation regarding patent and other intellectual property rights. In the past we have been, and in the future may be, notified that we may be infringing on the intellectual property rights of third parties. We have certain indemnification obligations to customers with respect to the infringement of third party intellectual property rights by our products. There can be no assurance that infringement claims by third parties or claims for indemnification by customers or end users of our products resulting from infringement claims will not be asserted in the future or that such assertions, if proven to be true, will not have a materially adverse affect on our business, financial condition or operating results. In the event of any adverse ruling in any such matter, we could be required to pay substantial damages, which could include treble damages, cease the manufacture, use and sale of infringing products, discontinue the use of certain processes or obtain a license under the intellectual property rights of the third party claiming infringement. There can be no assurance that a license would be available on reasonable terms or at all. Any limitations on our ability to market our products, any delays and costs associated with redesigning our products or payments of license fees to third parties or any failure by us to develop or license a substitute technology on commercially reasonable terms could have a material adverse effect on our business, financial condition and operating results.
Environmental Matters
We are subject to a variety of federal, state and local governmental regulations related to the use, storage, discharge and disposal of toxic, volatile or otherwise hazardous chemicals that were used in our manufacturing process. Any failure to comply with present or future regulations could result in the imposition of fines, the suspension of production or a cessation of operations. Such regulations could require us to acquire costly equipment or incur other significant expenses to comply with environmental regulations or clean up prior discharges. Since 1993, we have been named as a potentially responsible party (“PRP”) along with a large number of other companies that used Omega Chemical Corporation in Whittier, California to handle and dispose of certain hazardous waste material. We are a member of a large group of PRPs that has agreed to fund certain remediation efforts at the Omega Chemical Corporation site, which efforts are ongoing. For more information see our risk factor titled “We could incur substantial fines or litigation costs associated with our storage, use and disposal of hazardous materials” in Part I, Item 1A, Risk Factors, below and refer to footnote 10 “Legal Proceedings” to the financial statements.
Employees
As of March 31, 2010, we had 562 full-time employees: 61 in administration, 380 in research and development, 60 in operations, and 61 in marketing and sales. Our ability, as the economy recovers, to attract and retain qualified personnel is essential to our continued success. None of our employees are covered by a collective bargaining agreement, nor have we ever experienced any work stoppage.
Executive Officers of the Registrant
Our current executive officers and their ages as of March 31, 2010, are as follows:
| Name |
Age | Position(s) | ||
| Paramesh Gopi |
41 | President and Chief Executive Officer, Member of the Board of Directors | ||
| Robert G. Gargus |
58 | Senior Vice President and Chief Financial Officer | ||
| Shiva K. Natarajan |
44 | Vice President, Corporate Controller and Chief Accounting Officer | ||
| Hector Berardi |
45 | Vice President, Operations | ||
| Michael Major |
53 | Vice President, Human Resources |
Dr. Paramesh Gopi joined us as Senior Vice President and Chief Operating Officer in June 2008 and was promoted to President and Chief Executive Officer in May 2009. On April 29, 2009, Dr. Gopi became a member of our Board of Directors. From September 2002 to June 2008, he was with Marvell Semiconductor, a provider of mixed-signal and digital signal processing integrated circuits to broadband digital data networking markets, where he most recently served as Vice President and General Manager of the Embedded and Emerging Business
9
Table of Contents
Unit. At Marvell, Dr. Gopi held several executive-level positions including Chief Technology Officer of Embedded and Emerging Business Unit and Director of Technology Strategy. From June 2001 to August 2002, Dr. Gopi was Executive Director of Strategic Marketing and Applications at Conexant Systems, Inc., a mixed-signal processing company. He joined Conexant Systems, Inc. as part of its acquisition of Entridia Corporation in 2001. Dr. Gopi founded Entridia, a provider of Network Processing ASICs for Optical Networks, in 1999. Prior to Entridia, Dr. Gopi held principal engineering positions at Western Digital and Texas Instruments where he was responsible for the development of key mixed signal networking products. Dr. Gopi holds a PhD in Electrical and Computing Engineering and a Masters and Bachelor of Science degree in Electrical Engineering from the University of California, Irvine.
Robert G. Gargus joined us in October 2005 as Senior Vice President and Chief Financial Officer. From May 2005 to October 2005, he was Chief Financial Officer of Open-Silicon, a privately held fabless ASIC company. From October 2001 to April 2005, he was Chief Financial Officer of Silicon Image, a public semiconductor company specializing in high-speed serial communications technology, where the company experienced significant growth, a return to solid profitability, and a ten-fold improvement in their market cap. Mr. Gargus served as President and Chief Executive Officer of Telcom Semiconductor, a supplier of semiconductor products for the wireless market, from April 2000 to April 2001 and as Chief Financial Officer from May 1998 to April 2000. Under his leadership, Telcom Semiconductor was selected by Forbes Magazine in October 2000 as one of the “200 Best Small Companies.” Prior to Telcom Semiconductor, Mr. Gargus held various financial and general management positions with Tandem Computers, Atalla Corporation, and Unisys Corporation. Mr. Gargus holds a Master of Business Administration degree in Finance and a Bachelor of Science degree in Accounting from the University of Detroit.
Shiva K. Natarajan joined us in December 2006 as Senior Director of Accounting and was promoted to Vice President, Corporate Controller and Chief Accounting Officer in January 2008. From September 2005 to December 2006, he was Corporate Controller of Open-Silicon, a privately held fabless ASIC company. From May 2003 to August 2005, he was Director of Accounting of Silicon Image, a public semiconductor company specializing in high-speed serial communications technology. From October 1997 to April 2003, he was with Ernst & Young LLP, a public accounting firm, where he was most recently a Senior Manager of Assurance and Advisory Business Services. Mr. Natarajan is a Certified Public Accountant and holds a Bachelors of Science degree from the University of Calcutta.
Hector Berardi joined us as Vice President of Operations in July 2008. From August 2002 to July 2008, he was with PLX Technology, Inc., a semiconductor device company, as Vice President of Operations. From April 1999 to July 2002, Mr. Berardi was with Ubicom, Inc., a developer of wireless network processors and software platforms, as Vice President of Operations. From June 1998 to April 1999, he was with STMicroelectronics, a semiconductor company, as a Design and Program Manager for the advanced RISC core development group. From July 1987 to May 1998, he was with National Semiconductor Corporation, a semiconductor company, where he was most recently Senior Product Engineering Manager for microcontroller technologies. Mr. Berardi holds a Masters in Business Administration and Bachelors of Science in Electrical Engineering from Santa Clara University.
Michael Major joined us in February 2006 as Senior Director of Human Resources. Mr. Major was promoted to Vice President of Human Resources in April 2008. Mr. Major has 30 years of experience with Human Resources and related activities. Prior to joining us, Mr. Major was Senior Director of Human Resources at Silicon Image, a public semiconductor company specializing in high-speed serial communications technology, from September 2002 to January 2006. Prior to Silicon Image, Mr. Major also served as Vice President of Human Resources for MedChannel, a technology startup. Before his role at MedChannel, Mr. Major was Director of HR Operations at Netscape Communications. In addition to his experience within Human Resources, Mr. Major spent almost 20 years consulting with companies in the areas of employee benefits and compensation. Mr. Major is a graduate of the University of Michigan’s Advanced Human Resources Executive Program and holds a Bachelor of Arts Degree from Stanford University.
10
Table of Contents
| Item 1A. | Risk Factors. |
RISK FACTORS
Before deciding to invest in us or to maintain or increase your investment, you should carefully consider the risks described below, in addition to the other information contained in this Annual Report and in our other filings with the SEC. We update our descriptions of the risks and uncertainties facing us in our periodic reports filed with the SEC. The risks and uncertainties described below and in our other filings are not the only ones facing us. Additional risks and uncertainties not presently known to us or that we currently deem immaterial may also affect our business. If any of these known or unknown risks or uncertainties actually occurs, our business, financial condition and results of operations could be seriously harmed. In that event, the market price for our common stock could decline and you may lose your investment.
If we are unable to timely develop new products or new generations and versions of our existing products to replace our current products, our operating results and competitive position will be materially harmed.
Our industry is characterized by intense competition, rapidly evolving technology and continually changing customer requirements. These factors could render our existing products obsolete. Accordingly, our ability to compete in the future will depend in large part on our ability to identify and develop new products or new generations and versions of our existing products that achieve market acceptance on a timely and cost-effective basis, and to respond to changing requirements. If we are unable to do so, our business, operating results and financial condition will be negatively affected.
The successful development and market acceptance of our products depend on a number of factors, including, but not limited to:
| • | our accurate prediction of changing customer requirements; |
| • | timely development of new designs; |
| • | timely qualification and certification of our products for use in electronic systems; |
| • | commercial acceptance and production of the electronic systems into which our products are incorporated; |
| • | availability, quality, price, performance, and size of our products relative to competing products and technologies; |
| • | our customer service and support capabilities and responsiveness; |
| • | successful development of relationships with existing and potential new customers; |
| • | successful development of relationships with key developers of advanced digital semiconductors; and |
| • | changes in technology, industry standards or consumer preferences. |
In addition, on May 17, 2009, we entered into agreements with Veloce for them to perform product development work for us on an exclusive basis for up to five years for cash and other consideration, including a warrant to purchase shares of our common stock, which will vest upon the achievement of both performance and/or time-based milestones. Under the merger agreement with Veloce, we agreed to acquire Veloce if certain performance milestones and delivery schedules set forth under the merger and other agreements are achieved. We also have the unilateral option to acquire Veloce in the event Veloce fails to meet the milestones and delivery schedules. Should we acquire Veloce pursuant to the merger agreement, the purchase price is estimated to be in the range of approximately $5 million up to approximately $100 million, subject to adjustments. The final price would be based upon the achievement and timing of achieving multiple performance milestones and currently is not determinable. We also provided Veloce a promissory note of $1.5 million to be forgiven over eight quarters
11
Table of Contents
starting on March 31, 2011. We will also pay Veloce $1.5 million per quarter for up to twelve consecutive quarters in order to assist Veloce in meeting its expenses to perform its obligations under the agreement.
Our arrangement with Veloce may not result in the development of any new technologies or products. Moreover, products we have recently developed and which we are currently developing may not achieve market acceptance. If these products fail to achieve market acceptance, or if we fail to timely develop new products that achieve market acceptance, our business, financial condition and operating results will be materially harmed.
Our dependence on third-party manufacturing and supply relationships increases the risk that we will not have an adequate supply of products to meet demand or that our cost of materials will be higher than expected.
We depend upon third parties to manufacture, assemble, package or test certain of our products. As a result, we are subject to risks associated with these third parties, including:
| • | reduced control over delivery schedules and quality; |
| • | inadequate manufacturing yields and excessive costs; |
| • | difficulties selecting and integrating new subcontractors; |
| • | potential lack of adequate capacity during periods of excess demand; |
| • | limited warranties on products supplied to us; |
| • | potential increases in prices; |
| • | potential instability in countries where third-party manufacturers are located; and |
| • | potential misappropriation of our intellectual property. |
Our outside foundries generally manufacture our products on a purchase order basis, and we have few long-term supply arrangements with these suppliers. We have less control over delivery schedules, manufacturing yields and costs than competitors with their own fabrication facilities. A manufacturing disruption experienced by one or more of our outside foundries or a disruption of our relationship with an outside foundry, including discontinuance of our products by that foundry, would negatively impact the production of certain of our products for a substantial period of time.
Our IC products are generally only qualified for production at a single foundry. These suppliers can allocate, and in the past have allocated, capacity to the production of other companies’ products while reducing deliveries to us on short notice. There is also the potential that they may discontinue manufacturing our products or go out of business. Because establishing relationships, designing or redesigning ICs, and ramping production with new outside foundries may take over a year, there is no readily available alternative source of supply for these products.
Difficulties associated with adapting our technology and product design to the proprietary process technology and design rules of outside foundries can lead to reduced yields of our IC products. The process technology of an outside foundry is typically proprietary to the manufacturer. Since low yields may result from either design or process technology failures, yield problems may not be effectively determined or resolved until an actual product exists that can be analyzed and tested to identify process sensitivities relating to the design rules that are used. As a result, yield problems may not be identified until well into the production process, and resolution of yield problems may require cooperation between us and our manufacturer. This risk could be compounded by the offshore location of certain of our manufacturers, increasing the effort and time required to identify, communicate and resolve manufacturing yield problems. Manufacturing defects that we do not discover during the manufacturing or testing process may lead to costly product recalls. These risks may lead to increased costs or delayed product delivery, which would harm our profitability and customer relationships.
12
Table of Contents
If the foundries or subcontractors we use to manufacture our products discontinue the manufacturing processes needed to meet our demands, or fail to upgrade their technologies needed to manufacture our products, we may be unable to deliver products to our customers, which could materially adversely affect our operating results. The transition to the next generation of manufacturing technologies at one or more of our outside foundries could be unsuccessful or delayed.
Our requirements typically represent a very small portion of the total production of the third-party foundries. As a result, we are subject to the risk that a producer will cease production of an older or lower-volume process that it uses to produce our parts. We cannot assure you that our external foundries will continue to devote resources to the production of parts for our products or continue to advance the process design technologies on which the manufacturing of our products are based. Each of these events could increase our costs, lower our gross margin, cause us to hold more inventories or materially impact our ability to deliver our products on time. As our volumes decrease with any third-party foundry, the likelihood of unfavorable pricing increases.
Some companies that supply our customers are similarly dependent on a limited number of suppliers to produce their products. These other companies’ products may be designed into the same networking equipment into which our products are designed. Our order levels could be reduced materially if these companies are unable to access sufficient production capacity to produce in volumes demanded by our customers because our customers may be forced to slow down or halt production on the equipment into which our products are designed.
We may experience difficulties in transitioning to smaller geometry process technologies or in achieving higher levels of design integration and that may result in reduced manufacturing yields, delays in product deliveries and increased expenses.
As smaller line width geometry processes become more prevalent, we expect to integrate greater levels of functionality into our IC products and to transition our IC products to increasingly smaller geometries. This transition will require us to redesign certain products and will require us and our foundries to migrate to new manufacturing processes for our products.
We may not be able to achieve higher levels of design integration or deliver new integrated products on a timely basis. We periodically evaluate the benefits, on a product-by-product basis, of migrating to smaller geometry process technologies to reduce our costs and increase performance, and we have designed IC products to be manufactured at as little as .09 micron geometry processes. We have experienced some difficulties in shifting to smaller geometry process technologies and new manufacturing processes. These difficulties resulted in reduced manufacturing yields, delays in product deliveries and increased expenses. The transition to smaller geometries is inherently more expensive and as we manufacture more products using smaller geometries, the incremental costs could have an adverse impact on our earnings. We may face similar difficulties, delays and expenses as we continue to transition our IC products to smaller geometry processes. We are dependent on our relationships with our foundries to transition to smaller geometry processes successfully. We cannot assure you that our foundries will be able to effectively manage the transition or that we will be able to maintain our relationships with our foundries. If we or our foundries experience significant delays in this transition or fail to implement this transition, our business, financial condition and results of operations could be materially and adversely affected.
The gross margins for our products could decrease rapidly or not increase as forecasted, which will negatively impact our operating results.
The gross margins for our solutions have historically declined over time. Factors that we expect to cause downward pressure on the gross margins for our products include competitive pricing pressures, the cost sensitivity of our customers, particularly in the higher-volume markets, new product introductions by us or our competitors, and other factors. From time to time, for strategic reasons, we may accept orders at less than optimal gross margins in order to facilitate the introduction of, or, market penetration of our new or existing products. To maintain acceptable operating results, we will need to offset any reduction in gross margins of our products by reducing costs, increasing sales volume, developing and introducing new products and developing new
13
Table of Contents
generations and versions of existing products on a timely basis. If the gross margins for our products decline or not increase as forecasted and we are unable to offset those reductions, our business, financial condition and operating results will be materially harmed.
The current economic circumstances and uncertain political conditions could harm our revenues, operating results and financial condition.
The economies of the United States and other developed countries are currently coming out of a recession. We cannot predict either if this economic recovery will continue or retreat back into a recession.
The recent recession has caused a decline in our near term revenues and it will take some time to return to our previous levels. Our current operating plans are based on assumptions concerning levels of consumer and corporate spending. If global and domestic economic and market conditions persist or deteriorate, we may experience further material impacts on our business, operating results and financial condition which could result in a decline in the price of our common stock. If economic conditions worsen, we may have to implement additional cost reduction measures or delay certain research and development spending.
We maintain an investment portfolio of various holdings, types of instruments and maturities. These securities are generally classified as available-for-sale and, consequently, are recorded on our consolidated balance sheets at fair value with unrealized gains or losses reported as a separate component of accumulated other comprehensive income. Our portfolio primarily includes fixed income securities, mutual funds and preferred stocks, the values of which are subject to market price volatility. The deterioration of these market prices has had an unfavorable impact on our portfolio and has caused us to record impairment charges to our earnings. During the fiscal years’ ended March 31, 2010, 2009 and 2008, we recorded other-than-temporary impairment charge of $4.1 million, $17.1 million and $1.7 million, respectively. If the market prices continue to decline or securities continue to be in a loss position over time, we may recognize additional impairments in the fair value of our investments.
Adverse economic and market conditions could also harm our business by negatively affecting the parties with whom we do business, including our business partners, our customers and our suppliers. These conditions could impair the ability of our customers to pay for products they have purchased from us. As a result, allowances for doubtful accounts and write-offs of accounts receivable from our customers may increase. In addition, our suppliers may experience financial difficulties that could negatively affect their operations and their ability to supply us with the parts we need to manufacture our products.
We have invested in privately-held companies, many of which can still be considered in startup or developmental stages. These investments are inherently risky as the market for the technologies or products they have under development are typically in the early stages and may never materialize. We could lose all or substantially all of the value of our investments in these companies and, in some cases, we have lost all or substantially all of the value of our investment in such entities.
Our operating results may fluctuate because of a number of factors, many of which are beyond our control.
If our operating results are below the expectations of public market analysts or investors, then the market price of our common stock could decline. Some of the factors that affect our quarterly and annual results, but which are difficult to control or predict, are:
| • | communications, information technology and semiconductor industry conditions; |
| • | fluctuations in the timing and amount of customer requests for product shipments; |
| • | the reduction, rescheduling or cancellation of orders by customers, including as a result of slowing demand for our products or our customers’ products or over-ordering of our products or our customers’ products; |
| • | changes in the mix of products that our customers buy; |
14
Table of Contents
| • | the gain or loss of one or more key customers or their key customers, or significant changes in the financial condition of one or more of our key customers or their key customers; |
| • | our ability to introduce, certify and deliver new products and technologies on a timely basis; |
| • | the announcement or introduction of products and technologies by our competitors; |
| • | competitive pressures on selling prices; |
| • | the ability of our customers to obtain components from their other suppliers; |
| • | market acceptance of our products and our customers’ products; |
| • | fluctuations in manufacturing output, yields or other problems or delays in the fabrication, assembly, testing or delivery of our products or our customers’ products; |
| • | increases in the costs of products or discontinuance of products by suppliers; |
| • | the availability of external foundry capacity, contract manufacturing services, purchased parts and raw materials including packaging substrates; |
| • | the availability of package and test vendor capacity; |
| • | problems or delays that we and our foundries may face in shifting the design and manufacture of our future generations of IC products to smaller geometry process technologies and in achieving higher levels of design and device integration; |
| • | the timing of meeting the specifications and expense recovery on non-recurring engineering projects; |
| • | the amounts and timing of costs associated with warranties and product returns; |
| • | the amounts and timing of investments in research and development; |
| • | the product lifecycle and recoverability of capitalized architectural licenses, technology access fees and mask sets; |
| • | the amounts and timing of the costs associated with payroll taxes related to stock option exercises or settlement of restricted stock units; |
| • | costs associated with acquisitions and the integration of acquired companies, products and technologies; |
| • | the impact of potential one-time charges related to purchased intangibles; |
| • | our ability to successfully integrate acquired companies, products and technologies; |
| • | the impact on interest income of a significant use of our cash for an acquisition, stock repurchase or other purpose; |
| • | the effects of changes in interest rates or credit worthiness on the value and yield of our short-term investment portfolio; |
| • | costs associated with compliance with applicable environmental, other governmental or industry regulations including costs to redesign products to comply with those regulations or lost revenue due to failure to comply in a timely manner; |
| • | the effects of changes in accounting standards; |
| • | costs associated with litigation, including without limitation, attorney fees, litigation judgments or settlements, relating to the use or ownership of intellectual property or other claims arising out of our operations; |
| • | our ability to identify, hire and retain senior management and other key personnel; |
| • | the effects of war, acts of terrorism or global threats, such as disruptions in general economic activity and changes in logistics and security arrangements; and |
15
Table of Contents
| • | global economic and industry conditions. |
Our business, financial condition and operating results would be harmed if we do not achieve anticipated revenues.
We can have revenue shortfalls for a variety of reasons, including:
| • | the reduction, rescheduling or cancellation of customer orders; |
| • | declines in the average selling prices of our products; |
| • | delays when our customers are transitioning from old products to new products; |
| • | a decrease in demand for our products or our customers’ products; |
| • | a decline in the financial condition or liquidity of our customers or their customers; |
| • | delays in the availability of our products or our customers’ products; |
| • | the failure of our products to be qualified in our customers’ systems or certified by our customers; |
| • | excess inventory of our products held by our customers, resulting in a reduction in their order patterns as they work through the excess inventory of our products; |
| • | fabrication, test, product yield, or assembly constraints for our products that adversely affect our ability to meet our production obligations; |
| • | the failure of one of our subcontract manufacturers to perform its obligations to us; |
| • | our failure to successfully integrate acquired companies, products and technologies; |
| • | shortages of raw materials or production capacity constraints that lead our suppliers to allocate available supplies or capacity to other customers, which may disrupt our ability to meet our production obligations; and |
| • | global economic and industry conditions. |
Our business is characterized by short-term orders and shipment schedules. Customer orders typically can be cancelled or rescheduled without significant penalty to the customer. Because we do not have substantial non-cancellable backlog, we typically plan our production and inventory levels based on internal forecasts of customer demand, which is highly unpredictable and can fluctuate substantially. Customer orders for our products typically have non-standard lead times, which make it difficult for us to predict revenues and plan inventory levels and production schedules. If we are unable to plan inventory levels and production schedules effectively, our business, financial condition and operating results could be materially harmed.
From time to time, in response to anticipated long lead times to obtain inventory and materials from our outside contract manufacturers, suppliers and foundries, we may order materials in advance of anticipated customer demand. This advance ordering has in the past and may in the future result in excess inventory levels or unanticipated inventory write-downs if expected orders fail to materialize, or other factors render our products less marketable. If we are forced to hold excess inventory or we incur unanticipated inventory write-downs, our financial condition and operating results could be materially harmed.
Our expense levels are relatively fixed in the short-term and are based on our expectations of future revenues. We have limited ability to reduce expenses quickly in response to any revenue shortfalls. Changes to production volumes and impact of overhead absorption may result in a decline in our financial condition or liquidity.
Our business substantially depends upon the continued growth of the technology sector and the Internet.
The technology equipment industry is cyclical and has in the past experienced significant and extended downturns. The recent downturn was significant and we cannot predict if the current improvement is sustainable
16
Table of Contents
in the near future. A substantial portion of our business and revenue depends on the continued growth of the technology sector and the Internet. We sell our communications IC products primarily to communications equipment manufacturers that in turn sell their equipment to customers that depend on the growth of the Internet. The past downturn has caused a reduction in capital spending on information technology. While we are beginning to see indications of improvement, there are no guarantees that this growth will sustain, resulting in potential volatility. If there is another downturn, our business, operating results and financial condition may be materially harmed.
The loss of one or more key customers, the diminished demand for our products from a key customer, or the failure to obtain certifications from a key customer or its distribution channel could significantly reduce our revenues and profits.
A relatively small number of customers have accounted for a significant portion of our revenues in any particular period. We have no long-term volume purchase commitments from our key customers. One or more of our key customers may discontinue operations as a result of consolidation, liquidation or otherwise. Reductions, delays and cancellation of orders from our key customers or the loss of one or more key customers could significantly reduce our revenues and profits. We cannot assure you that our current customers will continue to place orders with us, that orders by existing customers will continue at current or historical levels or that we will be able to obtain orders from new customers.
Our ability to maintain or increase sales to key customers and attract significant new customers is subject to a variety of factors, including:
| • | customers may stop incorporating our products into their own products with limited notice to us and may suffer little or no penalty as a result of such action; |
| • | customers or prospective customers may not incorporate our products into their future product designs; |
| • | design wins (as explained below) with customers or prospective customers may not result in sales to such customers; |
| • | the introduction of new products by customers may occur later or be less successful in the market than planned; |
| • | we may successfully design a product to customer specifications but the customer may not be successful in the market; |
| • | sales of customer product lines incorporating our products may rapidly decline or such product lines may be phased out; |
| • | our agreements with customers typically are non-exclusive and do not require them to purchase a minimum quantity of our products; |
| • | many of our customers have pre-existing relationships with our current or potential competitors that may cause our customers to switch from using our products to using competing products; |
| • | some of our OEM customers may develop products internally that would replace our products; |
| • | we may not be able to successfully develop relationships with additional network equipment vendors; |
| • | our relationships with some of our larger customers may deter other potential customers (who compete with these customers) from buying our products; |
| • | the impact of terminating certain sales representatives or sales personnel as a result of a Company workforce reduction or otherwise; and |
| • | some of our customers and prospective customers may become less viable or fail. |
The occurrence of any one of the factors above could have a material adverse effect on our business, financial condition and results of operations.
17
Table of Contents
There is no guarantee that design wins will become actual orders and sales.
A “design win” occurs when a customer or prospective customer notifies us that our product has been selected to be integrated with the customer’s product. There can be delays of several months or more between the design win and when a customer initiates actual orders of our product. Following a design win, we will commit significant resources to the integration of our product into the customer’s product before receiving the initial order. Receipt of an initial order from a customer following a design win, however, is dependent on a number of factors, including the success of the customer’s product, and cannot be guaranteed. The design win may never result in an actual order or sale.
Any significant order cancellations or order deferrals could cause unplanned inventory growth resulting in excess inventory which may adversely affect our operating results.
Our customers may increase orders during periods of product shortages or cancel orders if their inventories are too high. Major inventory corrections by our customers are not uncommon and can last for significant periods of time and affect demand for our products. Customers may also cancel or delay orders in anticipation of new products or for other reasons. Cancellations or deferrals could cause us to hold excess inventory, which could reduce our profit margins by reducing sales prices, incurring inventory write-downs or writing off additional obsolete products.
The increasing lead times from our suppliers cause us to make commitments for inventory purchases earlier in our production cycle which in turn increases our risk of excess inventory. In addition, some of our suppliers are delivering based on allocations which in turn causes us to increase our inventory levels. We must balance our inventory levels between the risk of losing a significant customer to a competitor because we cannot meet our customer’s requirements and the risk of having excess inventory if a significant order is cancelled.
Inventory fluctuations could affect our results of operations and restrict our ability to fund our operations. Inventory management remains an area of focus as we balance the need to maintain strategic inventory levels to ensure competitive lead times, meet customer expectations and guard against the risk of inventory obsolescence because of changing technology and customer requirements.
We generally recognize revenue upon shipment of products to a customer. If a customer refuses to accept shipped products or does not pay for these products, we could miss future revenue projections or incur significant charges against our income, which could materially and adversely affect our operating results.
Our customers’ products typically have lengthy design cycles. A customer may decide to cancel or change its product plans, which could cause us to lose anticipated sales.
After we have developed and delivered a product to a customer, the customer will usually test and evaluate our product prior to designing its own equipment to incorporate our product. Our customers may need more than six months to test, evaluate and adopt our product and an additional nine months or more to begin volume production of equipment that incorporates our product. Due to this lengthy design cycle, we may experience significant delays from the time we increase our operating expenses and make investments in inventory until the time that we generate revenue from these products. It is possible that we may never generate any revenue from these products after incurring such expenditures. Even if a customer selects our product to incorporate into its equipment, we cannot guarantee that the customer will ultimately market and sell its equipment or that such efforts by our customer will be successful. The delays inherent in this lengthy design cycle increases the risk that a customer will decide to cancel or change its product plans. Such a cancellation or change in plans by a customer could cause us to lose sales that we had anticipated. While our customers’ design cycles are typically long, some of our product life cycles tend to be short as a result of the rapidly changing technology environment in which we operate. As a result, the resources devoted to product sales and marketing may not generate material revenue for us, and from time to time, we may need to write off excess and obsolete inventory. If we incur significant marketing expenses and investments in inventory in the future that we are not able to recover, and we
18
Table of Contents
are not able to mitigate those expenses, our operating results could be adversely affected. In addition, if we sell our products at reduced prices in anticipation of cost reductions but still hold higher cost products in inventory, our operating results would be harmed.
An important part of our strategy is to focus on the markets for communications equipment. If we change strategy or are unable to further expand our share of these markets or react timely or properly to emerging trends, our revenues may not grow and could decline.
Our markets frequently undergo transitions in which products rapidly incorporate new features and performance standards on an industry-wide basis. If our products are unable to support the new features or performance levels required by OEMs in these markets, or if our products fail to be certified by OEMs, we would lose business from an existing or potential customer and may not have the opportunity to compete for new design wins or certification until the next product transition occurs. If we fail to develop products with required features or performance standards, or if we experience a delay as short as a few months in certifying or bringing a new product to market, or if our customers fail to achieve market acceptance of their products, our revenues could be significantly reduced for a substantial period.
We expect a significant portion of our revenues to continue to be derived from sales of products based on current, widely accepted transmission standards. If the communications market evolves to new standards, we may not be able to successfully design and manufacture new products that address the needs of our customers or gain substantial market acceptance.
The sale of our 3ware storage adaptor business to LSI Corporation marks a change in our strategy. This change, or any further changes we might make, could have a significant impact on our business, financial condition and results of operations while we are implementing our new strategy.
If we do not identify and pursue the correct emerging trends and align ourselves with the correct market leaders, we may not be successful and our business, financial condition and results of operations could be materially and adversely affected.
Customers for our products generally have substantial technological capabilities and financial resources. Some customers have traditionally used these resources to internally develop their own products. The future prospects for our products in these markets are dependent upon our customers’ acceptance of our products as an alternative to their internally developed products. Future prospects also are dependent upon acceptance of third-party sourcing for products as an alternative to in-house development. Network equipment vendors may in the future continue to use internally developed components. They also may decide to develop or acquire components, technologies or products that are similar to, or that may be substituted for, our products.
If our network equipment vendor customers fail to accept our products as an alternative, if they develop or acquire the technology to develop such components internally rather than purchase our products, or if we are otherwise unable to develop or maintain strong relationships with them, our business, financial condition and results of operations would be materially and adversely affected.
Our business strategy contemplates the acquisition of other companies, products and technologies. Merger and acquisition activities involve numerous risks and we may not be able to address these risks successfully without substantial expense, delay or other operational or financial problems.
Acquiring products, technologies or businesses from third parties is part of our long-term business strategy. The risks involved with merger and acquisition activities include:
| • | potential dilution to our stockholders; |
| • | use of a significant portion of our cash reserves; |
| • | diversion of management’s attention; |
19
Table of Contents
| • | failure to retain or integrate key personnel; |
| • | difficulty in completing an acquired company’s in-process research or development projects; |
| • | amortization of acquired intangible assets and deferred compensation; |
| • | customer dissatisfaction or performance problems with an acquired company’s products or services; |
| • | costs associated with acquisitions or mergers; |
| • | difficulties associated with the integration of acquired companies, products or technologies; |
| • | difficulties competing in markets that are unfamiliar to us; |
| • | ability of the acquired companies to meet their financial projections; and |
| • | assumption of unknown liabilities, or other unanticipated events or circumstances. |
Any of these risks could materially harm our business, financial condition and results of operations.
As with past acquisitions, future acquisitions could adversely affect operating results. In particular, acquisitions may materially and adversely affect our results of operations because they may require large one-time charges or could result in increased debt or contingent liabilities, adverse tax consequences, substantial additional depreciation or deferred compensation charges. Our past purchase acquisitions required us to capitalize significant amounts of goodwill and purchased intangible assets. As a result of the slowdown in our industry and reduction of our market capitalization, we have been required to record significant impairment charges against these assets as noted in our financial statements. In the fiscal year ended March 31, 2009 we recorded a goodwill impairment charge of $223.0 million to continuing operations. The goodwill impaired was previously assigned to the Process and Transport reporting units in the amounts of $101.5 million, $121.5 million, respectively. In the fiscal years ended March 31, 2009 and 2008, we recorded goodwill impairment charges to discontinued operations of $41.1 million and $71.5 million, respectively, for the Store reporting unit. These market conditions continuously change and it is difficult to project how long these current uncertain economic conditions may last. These conditions have caused a decline in our near term revenues and it will take some time to ramp back up to our previous levels. Additionally, market values had deteriorated which has had an unfavorable impact on our valuations which are part of the goodwill and purchased intangible asset impairment tests. There can be no assurances that market conditions will not deteriorate further or that our market capitalization will not decline further. At March 31, 2010, we had $16.9 million of purchased intangible assets. We cannot assure you that we will not be required to take significant charges as a result of impairment to the carrying value of the purchased intangible assets, due to further adverse changes in market conditions.
Our industry and markets are subject to consolidation, which may result in stronger competitors, fewer customers and reduced demand.
There has been industry consolidation among communications IC companies, network equipment companies and telecommunications companies in the past. We expect this consolidation to continue as companies attempt to strengthen or hold their positions in evolving markets. Consolidation may result in stronger competitors, fewer customers and reduced demand, which in turn could have a material adverse effect on our business, operating results, and financial condition.
Our operating results are subject to fluctuations because we rely heavily on international sales.
International sales account for a significant part of our revenues and may account for an increasing portion of our future revenues. The revenues we derive from international sales may be subject to certain risks, including:
| • | foreign currency exchange fluctuations; |
| • | changes in regulatory requirements; |
20
Table of Contents
| • | tariffs, rising protectionism and other barriers; |
| • | timing and availability of export licenses; |
| • | political and economic instability; |
| • | difficulties in staffing and managing foreign operations; |
| • | difficulties in managing distributors; |
| • | difficulties in obtaining governmental and export approvals for communications, processors and other products; |
| • | reduced or uncertain protection for intellectual property rights in some countries; |
| • | longer payment cycles and difficulties to collect accounts receivable in some countries; |
| • | burdens of complying with a wide variety of complex foreign laws and treaties; |
| • | potentially adverse tax consequences; and |
| • | a worsening economic condition that may trail any improvements in the United States. |
We are subject to risks associated with the imposition of legislation and regulations relating to the import or export of high technology products. We cannot predict whether quotas, duties, taxes or other charges or restrictions upon the importation or exportation of our products will be implemented by the United States or other countries. Because sales of our products have been denominated to date primarily in United States dollars, increases in the value of the United States dollar could increase the price of our products so that they become relatively more expensive to customers in the local currency of a particular country, leading to a reduction in sales and profitability in that country. Future international activity may result in increased foreign currency denominated sales. Gains and losses on the conversion to United States dollars of accounts payable and other monetary assets and liabilities arising from international operations may contribute to fluctuations in our results of operations.
Some of our customer purchase orders and agreements are governed by foreign laws, which may differ significantly from laws in the United States. As a result, our ability to enforce our rights under such agreements may be limited compared with our ability to enforce our rights under agreements governed by laws in the United States.
Our portfolio of short-term investments are exposed to certain market risks.
We maintain an investment portfolio of various holdings, types of instruments and maturities. These securities are recorded on our consolidated balance sheets at fair value with unrealized gains or losses reported as a separate component of accumulated other comprehensive income (loss), net of tax. Our investment portfolio is exposed to market risks related to changes in interest rates and credit ratings of the issuers, as well as to the risks of default by the issuers and lack of overall market liquidity. Substantially all of these securities are subject to interest rate and credit rating risk and will decline in value if interest rates increase or one of the issuers’ credit ratings is reduced. Increases in interest rates or decreases in the credit worthiness of one or more of the issuers in our investment portfolio could have a material adverse impact on our financial condition or results of operations. During the fiscal years’ ended March 31, 2010, 2009 and 2008, we recorded $4.1 million, $17.1 million and $1.7 million, respectively, in write-downs in the carrying value of certain securities as we determined the decline in the fair value of these securities to be other-than-temporary. If there is a further deterioration in market conditions or there are additional losses incurred, we may be required to record a further decline in the carrying value of these securities resulting in further charges. At March 31, 2010, the unrealized losses on these securities, that were not written down as an other-than-temporary impairment charge, were approximately $0.2 million. If the fair value of any of these securities does not recover to at least the amortized cost of such security or we are unable to hold these securities until they recover, we may be required to record a decline in the carrying value of these securities.
21
Table of Contents
Our restructuring activities could result in management distractions, operational disruptions and other difficulties.
Over the past several years, we have initiated several restructuring activities in an effort to reduce operating costs, including new restructuring initiatives announced in October 2008, February 2009 and January 2010. Employees whose positions were eliminated in connection with these restructuring activities may seek employment with our customers or competitors. Although each of our employees is required to sign a confidentiality agreement with us at the time of hire, we cannot guarantee that the confidential nature of our proprietary information will be maintained in the course of such future employment. Any additional restructuring efforts could divert the attention of our management away from our operations, harm our reputation and increase our expenses. We cannot guarantee that we will not undertake additional restructuring activities, that any of our restructuring efforts will be successful, or that we will be able to realize the cost savings and other anticipated benefits from our previous or future restructuring plans. In addition, if we continue to reduce our workforce, it may adversely impact our ability to respond rapidly to new growth opportunities.
Our markets are subject to rapid technological change, so our success depends heavily on our ability to develop and introduce new products.
The markets for our products are characterized by:
| • | rapidly changing technologies; |
| • | evolving and competing industry standards; |
| • | changing customer needs; |
| • | frequent introductions of new products and enhancements; |
| • | increased integration with other functions; |
| • | long design and sales cycles; |
| • | short product life cycles; and |
| • | intense competition. |
To develop new products for the communications or other technology markets, we must develop, gain access to and use leading technologies in a cost-effective and timely manner and continue to develop technical and design expertise. We must have our products designed into our customers’ future products and maintain close working relationships with key customers in order to develop new products that meet customers’ changing needs. We must respond to changing industry standards, trends towards increased integration and other technological changes on a timely and cost-effective basis. Our pursuit of technological advances may require substantial time and expense and may ultimately prove unsuccessful. If we are not successful in adopting such advances, we may be unable to timely bring to market new products and our revenues will suffer.
Many of our products are based on industry standards that are continually evolving. Our ability to compete in the future will depend on our ability to identify and ensure compliance with these evolving industry standards. The emergence of new industry standards could render our products incompatible with products developed by major systems manufacturers. As a result, we could be required to invest significant time and effort and to incur significant expense to redesign our products to ensure compliance with relevant standards. If our products are not in compliance with prevailing industry standards or requirements, we could miss opportunities to achieve crucial design wins which in turn could have a material adverse effect on our business, operating results and financial condition.
The markets in which we compete are highly competitive, and we expect competition to increase in these markets in the future.
The markets in which we compete are highly competitive, and we expect that domestic and international competition will increase in these markets, due in part to deregulation, rapid technological advances, price
22
Table of Contents
erosion, changing customer preferences and evolving industry standards. Increased competition could result in significant price competition, reduced revenues, lower profit margins or loss of market share. Our ability to compete successfully in our markets depends on a number of factors, including:
| • | our ability to partner with OEM and channel partners who are successful in the market; |
| • | success in designing and subcontracting the manufacture of new products that implement new technologies; |
| • | product quality, interoperability, reliability, performance and certification; |
| • | customer support; |
| • | time-to-market; |
| • | price; |
| • | production efficiency; |
| • | design wins; |
| • | expansion of production of our products for particular systems manufacturers; |
| • | end-user acceptance of the systems manufacturers’ products; |
| • | market acceptance of competitors’ products; and |
| • | general economic conditions. |
Our competitors may offer enhancements to existing products, or offer new products based on new technologies, industry standards or customer requirements that are available to customers on a more timely basis than comparable products from us or that have the potential to replace or provide lower cost alternatives to our products. The introduction of enhancements or new products by our competitors could render our existing and future products obsolete or unmarketable. We expect that certain of our competitors and other semiconductor companies may seek to develop and introduce products that integrate the functions performed by our IC products on a single chip, thus eliminating the need for our products. Each of these factors could have a material adverse effect on our business, financial condition and results of operations.
In the transport communications IC markets, we compete primarily against companies such as Broadcom, Cortina, Netlogic, PMC-Sierra and Vitesse. In the embedded processor communications IC market, we compete with technology companies such as Freescale Semiconductor, Cavium and Intel. Many of these companies may have substantially greater financial, marketing and distribution resources than we have. Certain of our customers or potential customers have internal IC design or manufacturing capabilities with which we compete. We may also face competition from new entrants to our target markets, including larger technology companies that may develop or acquire differentiating technology and then apply their resources to our detriment. Any failure by us to compete successfully in these target markets would have a material adverse effect on our business, financial condition and results of operations.
Our operating results depend on manufacturing output and yields of our ICs and printed circuit board assemblies, which may not meet expectations.
The yields on wafers we have manufactured decline whenever a substantial percentage of wafers must be rejected or a significant number of die on each wafer are nonfunctional. Such declines can be caused by many factors, including minute levels of contaminants in the manufacturing environment, design issues, defects in masks used to print circuits on a wafer and difficulties in the fabrication process. Design iterations and process changes by our suppliers can cause a risk of defects. Many of these problems are difficult to diagnose, are time consuming and expensive to remedy and can result in shipment delays.
We estimate yields per wafer and final packaged parts in order to estimate the value of inventory. If yields are materially different than projected, work-in-process inventory may need to be re-valued. We may have to
23
Table of Contents
take inventory write-downs as a result of decreases in manufacturing yields. We may suffer periodic yield problems in connection with new or existing products or in connection with the commencement of production at a new manufacturing facility.
We must develop or otherwise gain access to improved IC process technologies.
Our future success will depend upon our ability to access new IC process technologies. In the future, we may be required to transition one or more of our IC products to process technologies with smaller geometries, other materials or higher speeds in order to reduce costs or improve product performance. We may not be able to gain access to new process technologies in a timely or affordable manner or products based on these new technologies may not achieve market acceptance.
The complexity of our products may lead to errors, defects and bugs, which could negatively impact our reputation with customers and result in liability.
Products as complex as ours may contain errors, defects and bugs when first introduced or as new versions are released. Our products have in the past experienced such errors, defects and bugs. Delivery of products with production defects or reliability, quality or compatibility problems could significantly delay or hinder market acceptance of the products or result in a costly recall and could damage our reputation and adversely affect our ability to retain existing customers and to attract new customers. Errors, defects or bugs could cause problems with device functionality, resulting in interruptions, delays or cessation of sales to our customers.
We may also be required to make significant expenditures of capital and resources to resolve such problems. We cannot assure you that problems will not be found in new products after commencement of commercial production, despite testing by us, our suppliers or our customers. Any problem could result in:
| • | additional development costs; |
| • | loss of, or delays in, market acceptance; |
| • | diversion of technical and other resources from our other development efforts; |
| • | claims by our customers or others against us; and |
| • | loss of credibility with our current and prospective customers. |
Any such event could have a material adverse effect on our business, financial condition and results of operations.
If our internal control over financial reporting is not considered effective, our business and stock price could be adversely affected.
Section 404 of the Sarbanes-Oxley Act of 2002 requires us to evaluate the effectiveness of our internal control over financial reporting as of the end of each fiscal year, and to include a management report assessing the effectiveness of our internal control over financial reporting in our annual report on Form 10-K for that fiscal year. Section 404 also requires our independent registered public accounting firm to attest to and report on the effectiveness of our internal control over financial reporting.
Our management, including our chief executive officer and chief financial officer, does not expect that our internal control over financial reporting will prevent all errors and all fraud. A control system, no matter how well designed and operated, can provide only reasonable, not absolute, assurance that the control system’s objectives will be met. Further, the design of a control system must reflect the fact that there are resource constraints, and the benefits of control must be considered relative to their costs. Because of the inherent limitations in all control systems, no evaluation of internal control can provide absolute assurance that all control
24
Table of Contents
issues and instances of fraud involving a company have been, or will be, detected. The design of any system of controls is based in part on certain assumptions about the likelihood of future events, and we cannot assure you that any design will succeed in achieving its stated goals under all potential future conditions. Over time, our internal control over financial reporting may become inadequate because of changes in conditions or deterioration in the degree of compliance with policies or procedures. Because of the inherent limitations in a cost-effective control system, misstatements due to error or fraud may occur and not be detected.
Our management has concluded, and our independent registered public accounting firm has attested, that our internal control over financial reporting was effective as of March 31, 2010. We cannot assure you that we or our independent registered public accounting firm will not identify a material weakness in our internal control in the future. A material weakness in our internal control over financial reporting would require management and our independent registered public accounting firm to report our internal control as ineffective. If our internal control over financial reporting is not considered effective, we may experience a restatement like we have in the past of our financial statements and/or a loss of public confidence, either of which could have an adverse effect on our business and on the market price of our common stock.
Our leadership transition may not go smoothly and could adversely impact our future operations.
As previously announced, we changed our Chief Executive Officer in May 2009. Any significant leadership or executive management change is inherently risky and we may be unable to manage this transition smoothly which could adversely impact our future strategy and ability to function or execute and could materially and adversely affect our business, financial condition and results of operations.
Our future success depends in part on the continued service of our key senior management, design engineering, sales, marketing, and manufacturing personnel, our ability to identify, hire and retain additional, qualified personnel and successful succession planning.
Our future success depends to a significant extent upon the continued service of our senior management personnel and successful succession planning. The loss of key senior executives could have a material adverse effect on our business. There is intense competition for qualified personnel in the semiconductor industry; in particular design, product and test engineers, and we may not be able to continue to attract and retain engineers or other qualified personnel necessary for the development of our business, or to replace engineers or other qualified personnel who may leave our employment in the future. There may be significant costs associated with recruiting, hiring and retaining personnel. Periods of contraction in our business may inhibit our ability to attract and retain our personnel. Loss of the services of, or failure to recruit, key design engineers or other technical and management personnel could be significantly detrimental to our product development or other aspects of our business.
To manage operations effectively, we will be required to continue to improve our operational, financial and management systems and to successfully hire, train, motivate, and manage our employees. The integration of future acquisitions would require significant additional management, technical and administrative resources. We cannot guarantee that we would be able to manage our expanded operations effectively.
Our ability to supply a sufficient number of products to meet demand could be severely hampered by a shortage of water, electricity or other supplies, or by natural disasters or other catastrophes.
The manufacture of our products requires significant amounts of water. Previous droughts have resulted in restrictions being placed on water use by manufacturers. In the event of a future drought, reductions in water use may be mandated generally and our external foundries’ ability to manufacture our products could be impaired.
Several of our facilities, including our principal executive offices, are located in California. California has experienced prolonged energy alerts and blackouts caused by disruption in energy supplies. As a consequence, businesses and other energy consumers in California continue to experience substantially increased costs of electricity and natural gas. We are unsure whether energy alerts and blackouts will reoccur or how severe they
25
Table of Contents
may become in the future. Many of our customers and suppliers are also headquartered or have substantial operations in California. If we or any of our major customers or suppliers located in California experience a sustained disruption in energy supplies, our results of operations could be materially and adversely affected.
A significant portion of our manufacturing operations are located in Asia. These areas are subject to natural disasters such as earthquakes or floods. We do not have earthquake or business interruption insurance for these facilities, because adequate coverage is not offered at economically justifiable rates. A significant natural disaster or other catastrophic event could have a material adverse impact on our business, financial condition and operating results.
The effects of war, acts of terrorism or global threats, including, but not limited to, the outbreak of epidemic disease, could have a material adverse effect on our business, operating results and financial condition. The continued threat of terrorism and heightened security and military action in response to this threat, or any future acts of terrorism, may cause further disruptions to local and global economies and create further uncertainties. To the extent that such disruptions or uncertainties result in delays or cancellations of customer orders, or the manufacture or shipment of our products, our business, operating results and financial condition could be materially and adversely affected.
We could incur substantial fines or litigation costs associated with our storage, use and disposal of hazardous materials.
We are subject to a variety of federal, state and local governmental regulations related to the use, storage, discharge and disposal of toxic, volatile or otherwise hazardous chemicals used in our manufacturing process. Any failure to comply with present or future regulations could result in the imposition of fines, the suspension of production or a cessation of operations. These regulations could require us to acquire costly equipment or incur other significant expenses to comply with environmental regulations or clean up prior discharges. Since 1993, we have been named as a PRP along with more than 100 other companies that used Omega Chemical Corporation waste treatment facility in Whittier, California. The U.S. Environmental Protection Agency (“EPA”) has alleged that Omega failed to properly treat and dispose of certain hazardous waste material. We are a member of a large group of PRPs that has agreed to fund certain on-going remediation efforts at the Omega Chemical Corporation site. To date, our payment obligations with respect to these funding efforts have not been material, and although we believe that our future obligations to fund these efforts will not have a material adverse effect on our business, financial condition or operating results, we cannot guarantee this result. In 2007, the PRPs were sued by a downstream chemical company; that action has been stayed since March 2008 to allow for further delineation of the regional groundwater. In 2009, the U.S. Supreme Court decided U.S. v. Burlington Northern & Santa Fe Railway Co., 129 S.Ct. 1870, which determined that hazardous substance cleanup liability need not be joint and several in all cases. As a result of this decision, the liability is potentially divisible among the PRP at an earlier stage in superfund cases such as Omega. At this point we do not know and can not predict the full impact of this decision on our liability, however, to protect against an unfavorable impact, we have joined the recently formed Omega Allocation Committee in order to limit such exposure. Although we believe that we have been and currently are in material compliance with applicable environmental laws and regulations, we cannot guarantee that we are or will be in material compliance with these laws or regulations or that our future obligations to fund any remediation efforts, including those at the Omega Chemical Corporation site, will not have a material adverse effect on our business.
Environmental laws and regulations could cause a disruption in our business and operations.
We are subject to various state, federal and international laws and regulations governing the environment, including those restricting the presence of certain substances in electronic products and making manufacturers of those products financially responsible for the collection, treatment, recycling and disposal of certain products. Such laws and regulations have been passed in several jurisdictions in which we operate, including various European Union (“EU”) member countries. For example, the EU has enacted the Restriction of the Use of Certain Hazardous Substances in Electrical and Electronic Equipment (“RoHS”) and the Waste Electrical and
26
Table of Contents
Electronic Equipment (“WEEE”) directives. RoHS prohibits the use of lead and other substances in semiconductors and other products put on the market after July 1, 2006. The WEEE directive obligates parties that place electrical and electronic equipment on the market in the EU to put a clearly identifiable mark on the equipment, register with and report to EU member countries regarding distribution of the equipment, and provide a mechanism to take back and properly dispose of the equipment. There can be no assurance that similar programs will not be implemented in other jurisdictions resulting in additional costs, possible delays in delivering products, and even the discontinuance of existing and planned future product replacements if the cost were to become prohibitive.
Any acquisitions we make could disrupt our business and harm our results of operations and financial condition.
We may make additional investments in or acquire other companies, products or technologies. These acquisitions may involve numerous risks, including:
| • | problems combining or integrating the purchased operations, technologies or products; |
| • | unanticipated costs; |
| • | diversion of management’s attention from our core business; |
| • | adverse effects on existing business relationships with suppliers and customers; |
| • | risks associated with entering markets in which we have limited or no prior experience; and |
| • | potential loss of key employees, particularly those of the acquired organizations. |
In addition, in the event of any such investments or acquisitions, we could
| • | issue stock that would dilute our current stockholders’ percentage ownership; |
| • | incur debt; |
| • | assume liabilities; |
| • | incur amortization or impairment expenses related to goodwill and other intangible assets; or |
| • | incur large and immediate write-offs. |
We cannot assure you that we will be able to successfully integrate any businesses, products, technologies or personnel that we might acquire.
Any dispositions we make could disrupt our business and harm our results of operations and financial condition.
We may dispose of assets or businesses that represent a significant portion of our business. We completed the sale of our 3ware storage adapter business, a significant portion of our storage business, to LSI Corporation on April 21, 2009. As a result, we now expect to generate all of our sales from our remaining business, which we would be required to grow in order to achieve profitability. Economic and other factors may prevent us from growing our remaining business. If we fail to grow our remaining business, it could have a material adverse impact on our business, financial condition and operating results. Future dispositions may involve numerous risks, including:
| • | problems carving out or disposing of assets, operations, technologies and products; |
| • | the disposal of such assets or businesses could have an unanticipated adverse effect on the remaining business; |
| • | unanticipated costs; |
27
Table of Contents
| • | diversion of management’s attention from core ongoing operations; |
| • | potential adverse effects on existing business relationships with suppliers and customers; and |
| • | if we do not structure the disposition properly and scale expenses according to the size of the remaining business, we could continue to incur expenses that could be unsustainable given the scope of the remaining business. |
We may not be able to protect our intellectual property adequately.
We rely in part on patents to protect our intellectual property. We cannot assure you that our pending patent applications or any future applications will be approved, or that any issued patents will adequately protect the intellectual property in our products and processes, will provide us with competitive advantages or will not be challenged by third parties, or that if challenged, any such patent will be found to be valid or enforceable. Others may independently develop similar products or processes, duplicate our products or processes or design around any patents that may be issued to us.
To protect our intellectual property, we also rely on the combination of mask work protection under the Federal Semiconductor Chip Protection Act of 1984, trademarks, copyrights, trade secret laws, employee and third-party nondisclosure agreements, and licensing arrangements. Despite these efforts, we cannot assure you that others will not independently develop substantially equivalent intellectual property or otherwise gain access to our trade secrets or intellectual property, or disclose such intellectual property or trade secrets, or that we can meaningfully protect our intellectual property. A failure by us to meaningfully protect our intellectual property could have a material adverse effect on our business, financial condition and operating results.
We generally enter into confidentiality agreements with our employees, consultants and strategic partners. We also try to control access to and distribution of our technologies, documentation and other proprietary information. Despite these efforts, parties may attempt to copy, disclose, obtain or use our products, services or technology without our authorization. Also, former employees may seek employment with our business partners, customers or competitors and we cannot assure you that the confidential nature of our proprietary information will be maintained in the course of such future employment. Additionally, former employees or third parties could attempt to penetrate our network to misappropriate our proprietary information or interrupt our business. Because the techniques used by computer hackers to access or sabotage networks change frequently and generally are not recognized until launched against a target, we may be unable to anticipate these techniques. As a result, our technologies and processes may be misappropriated, particularly in foreign countries where laws may not protect our proprietary rights as fully as in the United States.
We could be harmed by litigation involving patents, proprietary rights or other claims.
Litigation may be necessary to enforce our intellectual property rights, to determine the validity and scope of the proprietary rights of others or to defend against claims of infringement or misappropriation. The semiconductor industry is characterized by substantial litigation regarding patent and other intellectual property rights. Such litigation could result in substantial costs and diversion of resources, including the attention of our management and technical personnel, and could have a material adverse effect on our business, financial condition and results of operations. We may be accused of infringing on the intellectual property rights of third parties. We have certain indemnification obligations to customers with respect to the infringement of third-party intellectual property rights by our products. We cannot assure you that infringement claims by third parties or claims for indemnification by customers or end users resulting from infringement claims will not be asserted in the future, or that such assertions will not harm our business.
Any litigation relating to the intellectual property rights of third parties would at a minimum be costly and could divert the efforts and attention of our management and technical personnel. In the event of any adverse ruling in any such litigation, we could be required to pay substantial damages, cease the manufacturing, use and sale of infringing products, discontinue the use of certain processes or obtain a license under the intellectual property rights of the third party claiming infringement. A license might not be available on reasonable terms or at all.
28
Table of Contents
From time to time, we may be involved in litigation relating to other claims arising out of our operations in the normal course of business. We cannot assure you that the ultimate outcome of any such matters will not have a material, adverse effect on our business, financial condition or operating results.
Our stock price is volatile.
The market price of our common stock has fluctuated significantly. In the future, the market price of our common stock could be subject to significant fluctuations due to general economic and market conditions and in response to quarter-to-quarter variations in:
| • | our anticipated or actual operating results; |
| • | announcements or introductions of new products by us or our competitors; |
| • | anticipated or actual operating results of our customers, peers or competitors; |
| • | technological innovations or setbacks by us or our competitors; |
| • | conditions in the semiconductor, communications or information technology markets; |
| • | the commencement or outcome of litigation or governmental investigations; |
| • | changes in ratings and estimates of our performance by securities analysts; |
| • | announcements of merger or acquisition transactions; |
| • | management changes; |
| • | our inclusion in certain stock indices; and |
| • | other events or factors. |
The stock market in recent years has experienced extreme price and volume fluctuations that have affected the market prices of many high technology companies, particularly semiconductor companies. In some instances, these fluctuations appear to have been unrelated or disproportionate to the operating performance of the affected companies. Any such fluctuation could harm the market price of our common stock. In addition, the current decline of the financial markets and related factors beyond our control, including the credit and mortgage crisis in both the U.S. and worldwide, may cause our stock price to decline rapidly and unexpectedly.
The anti-takeover provisions of our certificate of incorporation and of the Delaware general corporation law may delay, defer or prevent a change of control.
Our board of directors has the authority to issue up to 2.0 million shares of preferred stock and to determine the price, rights, preferences and privileges and restrictions, including voting rights, of those shares without any further vote or action by our stockholders. The rights of the holders of common stock will be subject to, and may be harmed by, the rights of the holders of any shares of preferred stock that may be issued in the future. The issuance of preferred stock may delay, defer or prevent a change in control, as the terms of the preferred stock that might be issued could potentially prohibit our consummation of any merger, reorganization, sale of substantially all of our assets, liquidation or other extraordinary corporate transaction without the approval of the holders of the outstanding shares of preferred stock. The issuance of preferred stock could have a dilutive effect on our stockholders.
If we issue additional shares of stock in the future, it may have a dilutive effect on our stockholders.
We have a significant number of authorized and unissued shares of our common stock available. These shares will provide us with the flexibility to issue our common stock for proper corporate purposes, which may include making acquisitions through the use of stock, adopting additional equity incentive plans and raising equity capital. Any issuance of our common stock may result in immediate dilution of our stockholders.
29
Table of Contents
| Item 1B. | Unresolved Staff Comments. |
Not applicable.
| Item 2. | Properties. |
Our corporate headquarters are located in an approximately 150,000 square foot building in Sunnyvale, California that we own. The facility contains administration, sales and marketing, research and development and operations functions. We also lease a 62,000 square foot facility in San Diego, California for administration, sales, research and development and operations functions. In addition to these facilities, we lease additional domestic facilities in Andover, Massachusetts, Austin, Texas and Cary, North Carolina.
Our foreign leased locations consist of the following: Ottawa, Canada; Manchester and Cheshire, United Kingdom; Munich, Germany; Tokyo, Japan; Beijing, Shenzhen and Shanghai, the People’s Republic of China; Taipei, Taiwan; Ho Chi Minh City, Vietnam; and Pune, India.
The domestic and international leased facilities comprise an aggregate of approximately 200,000 square feet. These facilities have lease terms expiring between 2010 and 2013. We believe that the facilities under lease by us will be adequate for at least the next 12 months.
For additional information regarding our obligations under property leases, see Note 7 of the Notes to Consolidated Financial Statements, included in Part IV, Item 15, Exhibits, Financial Statement Schedules, of this Annual Report.
| Item 3. | Legal Proceedings. |
The information set forth under Note 10 of Notes to Consolidated Financial Statements, included in Part IV, Item 15, Exhibits, Financial Statement Schedules, of this Annual Report, is incorporated herein by reference.
| Item 4. | (Removed and Reserved) |
30
Table of Contents
PART II
| Item 5. | Market for Registrant’s Common Equity, Related Stockholder Matters and Issuer Purchases of Equity Securities. |
Our common stock is traded on the Nasdaq Global Select Market under the symbol AMCC. The following table sets forth the high and low sales prices of our common stock as reported by Nasdaq for the periods indicated.
| Fiscal Year Ended March 31, 2010 |
High | Low | ||||
| First Quarter |
$ | 8.19 | $ | 4.80 | ||
| Second Quarter |
$ | 10.45 | $ | 7.38 | ||
| Third Quarter |
$ | 9.83 | $ | 6.76 | ||
| Fourth Quarter |
$ | 9.32 | $ | 7.31 | ||
| Fiscal Year Ended March 31, 2009 |
High | Low | ||||
| First Quarter |
$ | 9.86 | $ | 7.55 | ||
| Second Quarter |
$ | 8.72 | $ | 5.77 | ||
| Third Quarter |
$ | 5.74 | $ | 3.17 | ||
| Fourth Quarter |
$ | 5.39 | $ | 3.25 | ||
At April 30, 2010, there were approximately 162 holders of record of our common stock.
Dividend Policy
We have never declared or paid cash dividends on shares of our common stock. We currently intend to retain all of our earnings, if any, for use in our business, for the purchases of our common stock or for the acquisitions of other businesses, assets, products or technologies. We do not anticipate paying any cash dividends in the foreseeable future.
Recent Sales of Unregistered Securities
There were no sales of equity securities by us that were not registered under the Securities Act of 1933, as amended (the “Securities Act”), during fiscal year ended March 31, 2010, that have not been previously reported in a Quarterly Report on Form 10-Q or in a Current Report on Form 8-K.
Securities Authorized for Issuance under Equity Compensation Plans
The information included in Part III, Item 12, Security Ownership of Certain Beneficial Owners and Management and Related Stockholder Matters, of this Annual Report is hereby incorporated herein by reference. For additional information on our stock incentive plans and activity, see Note 4 of the Notes to Consolidated Financial Statements included in Part IV, Item 15, Exhibits, Financial Statement Schedules, of this Annual Report.
Issuer Purchases of Equity Securities
Below is a summary of stock repurchases for the three months ended March 31, 2010 (in thousands, except average price per share).
| Period |
Total Number of Shares Purchased |
Average Price Paid per Share |
Total Number of Shares Purchased as Part of Publicly Announced Plans or Programs |
Maximum Amount that May Yet Be Purchased Under the Plans or Programs | ||||||
| January 1 — January 31, 2010 |
689 | $ | 7.25 | 689 | $ | 92,441 | ||||
| February 1 — February 28, 2010 |
— | — | — | 92,441 | ||||||
| March 1 — March 31, 2010 |
— | — | — | 92,441 | ||||||
| Total shares repurchased |
689 | $ | 7.25 | 689 | ||||||
31
Table of Contents
In August 2004, we announced that our Board of Directors authorized a stock repurchase program for the repurchase of up to $200.0 million of our common stock and in October 2008, our Board of Directors increased the stock repurchase program by $100.0 million to a total of $300.0 million.
The following graph compares the cumulative five-year total return to shareholders on our common stock relative to the cumulative total returns of the S&P 500 index, the NASDAQ Telecommunications index, the NASDAQ Composite index, and the NASDAQ Electronic Components index. An investment of $100 (with reinvestment of all dividends) is assumed to have been made in our common stock and in each index on March 31, 2005 and its relative performance is tracked through March 31, 2010.
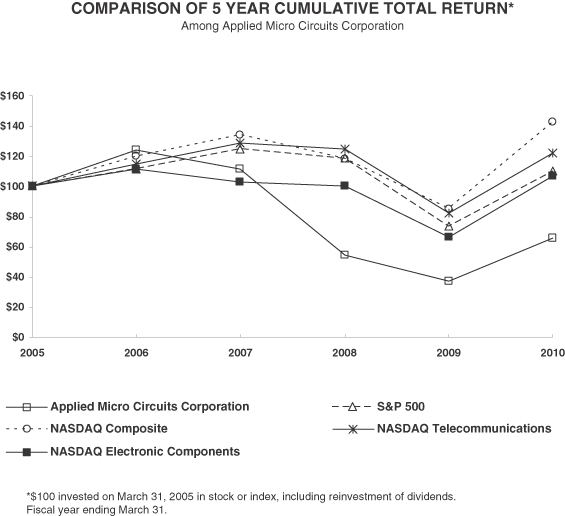
| Fiscal Years Ended March 31, | ||||||||||||
| 2005 | 2006 | 2007 | 2008 | 2009 | 2010 | |||||||
| Applied Micro Circuits Corporation |
100.00 | 124.09 | 111.28 | 54.73 | 37.04 | 65.78 | ||||||
| S&P 500 |
100.00 | 111.73 | 124.95 | 118.60 | 73.43 | 109.97 | ||||||
| NASDAQ Composite |
100.00 | 119.97 | 134.27 | 118.46 | 85.30 | 142.80 | ||||||
| NASDAQ Telecommunications |
100.00 | 114.55 | 128.92 | 124.54 | 82.46 | 121.90 | ||||||
| NASDAQ Electronic Components |
100.00 | 111.52 | 103.15 | 100.10 | 66.59 | 107.00 | ||||||
32
Table of Contents
The stock price performance included in this graph is not necessarily indicative of future stock price performance.
The material in this section is not “soliciting material” and is not deemed “filed” with the SEC and is not to be incorporated by reference into any filing of Applied Micro Circuits Corporation made under the Securities Act or the Exchange Act whether made before or after the date hereof and irrespective of any general incorporation language in any such filing except to the extent we specifically incorporate this section by reference.
| Item 6. | Selected Financial Data. |
The following table sets forth selected financial data for each of our last five fiscal years ended March 31, 2010. You should read the selected financial data set forth in the table below, together with the Consolidated Financial Statements and related Notes to Consolidated Financial Statements, included in Part IV, Item 15, Exhibits, Financial Statement Schedules, of this Annual Report, as well as Part II, Item 7, Management’s Discussion and Analysis of Financial Condition and Results of Operations, of this Annual Report.
| Fiscal Years Ended March 31, | ||||||||||||||||||||
| 2010 | 2009 | 2008 | 2007 | 2006 | ||||||||||||||||
| (In thousands, except per share amounts) | ||||||||||||||||||||
| Consolidated Statement of Operations Data: |
||||||||||||||||||||
| Net revenues |
$ | 205,598 | $ | 214,216 | $ | 194,115 | $ | 242,478 | $ | 214,621 | ||||||||||
| Cost of revenues |
92,931 | 101,070 | 98,756 | 115,794 | 94,720 | |||||||||||||||
| Gross profit |
112,667 | 113,146 | 95,359 | 126,684 | 119,901 | |||||||||||||||
| Operating expenses: |
||||||||||||||||||||
| Research and development |
88,096 | 84,687 | 86,117 | 81,266 | 78,442 | |||||||||||||||
| Selling, general and administrative |
45,901 | 50,097 | 52,037 | 58,418 | 53,503 | |||||||||||||||
| Acquired in-process research and development |
— | — | — | 13,300 | — | |||||||||||||||
| Amortization of purchased intangible assets |
4,020 | 4,020 | 4,061 | 3,735 | 3,328 | |||||||||||||||
| Restructuring charges, net |
746 | 8,623 | 2,958 | 1,291 | 12,602 | |||||||||||||||
| Option investigation, net |
— | 80 | 1,072 | 5,344 | — | |||||||||||||||
| Goodwill impairment charges |
— | 222,972 | — | — | 49,723 | |||||||||||||||
| Litigation settlement, net |
— | 130 | 1,125 | — | — | |||||||||||||||
| Total operating expenses |
138,763 | 370,609 | 147,370 | 163,354 | 197,598 | |||||||||||||||
| Operating loss |
(26,096 | ) | (257,463 | ) | (52,011 | ) | (36,670 | ) | (77,697 | ) | ||||||||||
| Interest income (expense), net and other-than-temporary impairment |
3,440 | (8,073 | ) | 8,635 | 13,125 | 15,617 | ||||||||||||||
| Other income (expense), net |
(1,551 | ) | 492 | 1,944 | 250 | 256 | ||||||||||||||
| Loss from continuing operations before income taxes |
(24,207 | ) | (265,044 | ) | (41,432 | ) | (23,295 | ) | (61,824 | ) | ||||||||||
| Income tax expense (benefit) |
(10,610 | ) | (3,946 | ) | 3,773 | 333 | (521 | ) | ||||||||||||
| Loss from continuing operations |
(13,597 | ) | (261,098 | ) | (45,205 | ) | (23,628 | ) | (61,303 | ) | ||||||||||
| Income (loss) from discontinued operations, net of taxes |
6,112 | (48,235 | ) | (69,916 | ) | (580 | ) | (87,069 | ) | |||||||||||
| Net loss |
$ | (7,485 | ) | $ | (309,333 | ) | $ | (115,121 | ) | $ | (24,208 | ) | $ | (148,372 | ) | |||||
| Basic and diluted net income (loss) per share: |
||||||||||||||||||||
| Net loss from continuing operations per share |
$ | (0.21 | ) | $ | (4.00 | ) | $ | (0.67 | ) | $ | (0.33 | ) | $ | (0.82 | ) | |||||
| Net income (loss) from discontinued operations per share |
0.10 | (0.74 | ) | (1.03 | ) | (0.01 | ) | (1.15 | ) | |||||||||||
| Net loss per share |
$ | (0.11 | ) | $ | (4.74 | ) | $ | (1.70 | ) | $ | (0.34 | ) | $ | (1.97 | ) | |||||
| Shares used in calculating basic and diluted net income (loss) per share |
66,006 | 65,271 | 67,775 | 71,076 | 75,210 | |||||||||||||||
| March 31, | ||||||||||||||||||||
| 2010 | 2009 | 2008 | 2007 | 2006 | ||||||||||||||||
| Consolidated Balance Sheet Data: |
||||||||||||||||||||
| Working capital |
$ | 227,850 | $ | 207,396 | $ | 176,112 | $ | 310,344 | $ | 340,200 | ||||||||||
| Goodwill and intangible assets, net |
16,850 | 32,965 | 320,155 | 415,644 | 381,066 | |||||||||||||||
| Total assets |
316,044 | 324,610 | 632,847 | 816,512 | 825,426 | |||||||||||||||
| Total stockholders’ equity |
$ | 280,874 | $ | 283,970 | $ | 580,712 | $ | 760,822 | $ | 762,808 | ||||||||||
33
Table of Contents
| Item 7. | Management’s Discussion and Analysis of Financial Condition and Results of Operations. |
This management’s discussion and analysis of financial condition and results of operations (“MD&A”) is provided as a supplement to the accompanying consolidated financial statements and footnotes to help provide an understanding of our financial condition, changes in our financial condition and results of our operations. The MD&A is organized as follows:
| • | Caution concerning forward-looking statements. This section discusses how forward-looking statements made by us in the MD&A and elsewhere in this Annual Report are based on management’s present expectations about future events and are inherently susceptible to uncertainty and changes in circumstances. |
| • | Overview. This section provides an introductory overview and context for the discussion and analysis that follows in the MD&A. |
| • | Critical accounting policies. This section discusses those accounting policies that are both considered important to our financial condition and operating results and require significant judgment and estimates on the part of management in their application. |
| • | Results of operations. This section provides an analysis of our results of operations for the three fiscal years ended March 31, 2010. A brief description is provided of transactions and events that impact the comparability of the results being analyzed. |
| • | Financial condition and liquidity. This section provides an analysis of our cash position and cash flows, as well as a discussion of our financing arrangements and financial commitments. |
CAUTION CONCERNING FORWARD-LOOKING STATEMENTS
The MD&A should be read in conjunction with the consolidated financial statements and notes thereto included in this Annual Report. This discussion contains forward-looking statements. These forward-looking statements are made as of the date of this Annual Report. Any statement that refers to an expectation, projection or other characterization of future events or circumstances, including the underlying assumptions, is a forward-looking statement. We use certain words and their derivatives such as “anticipate”, “believe”, “plan”, “expect”, “estimate”, “predict”, “intend”, “may”, “will”, “should”, “could”, “future”, “potential”, and similar expressions in many of the forward-looking statements. The forward-looking statements are based on our current expectations, estimates and projections about our industry, management’s beliefs, and other assumptions made by us. These statements and the expectations, estimates, projections, beliefs and other assumptions on which they are based are subject to many risks and uncertainties and are inherently subject to change. We describe many of the risks and uncertainties that we face in Part I, Item 1A, Risk Factors, and elsewhere in this Annual Report. Our actual results and actual events could differ materially from those anticipated in any forward-looking statement. Readers should not place undue reliance on any forward-looking statement.
OVERVIEW
Applied Micro Circuits Corporation (“AMCC”, “APM”, “AppliedMicro” or the “Company”) is a leader in semiconductor solutions for the enterprise, telecom and consumer/SMB markets. We design, develop, market and support high-performance low power ICs, which are essential for the processing, transporting and storing of information worldwide. In the telecom and enterprise markets, we utilize a combination of design expertise coupled with system-level knowledge and multiple technologies to offer IC products for wireline and wireless communications equipment such as wireless access points, wireless base stations, multi-function printers, enterprise and edge switches, blade servers, storage systems, gateways, core switches, routers, metro, long-haul, and ultra-long-haul transport platforms. In the consumer/SMB markets, we combine optimized software and system-level expertise with highly integrated semiconductors to deliver comprehensive reference designs and stand-alone semiconductor solutions for wireline and wireless communications equipment such as wireless access points, network attached storage, and residential and smart energy gateways. Our corporate headquarters are located in Sunnyvale, California. Sales and engineering offices are located throughout the world.
34
Table of Contents
Our business had three reporting units, Process, Transport and Store. On April 21, 2009, we completed the sale of our 3ware storage adapter business, which was substantially all of the business of our Store reporting unit, to LSI Corporation to focus on our Process and Transport reporting units. We are a semiconductor company that possesses fundamental and differentiated intellectual property for high speed signal processing, packet based communications processors and telecommunications transport protocols. This intellectual property enables us to be a key player in the datacenter, enterprise and telecommunications applications. Our focus is on the OEMs and telecommunications companies that build and connect to datacenters. As of March 31, 2010, our business had two reporting units, Process and Transport.
Since the start of fiscal 2008, we have invested a total of $258.9 million in the research and development of new products, including higher-speed, lower-power and lower-cost products, products that combine the functions of multiple existing products into single highly integrated products, and other products to complete our portfolio of communications products. These products, and our customers’ products for which they are intended, are highly complex. Due to this complexity, it often takes several years to complete the development and qualification of these products before they enter into volume production. Accordingly, we have not yet generated significant revenues from some of the products developed during this time period. In addition, downturns in the telecommunications market can severely impact our customers’ business and usually results in significantly less demand for our products than was expected when the development work commenced. As a result of restructuring activities associated with these downturns, we have discontinued development of several products that were in process and slowed down development of others as we realized that demand for these products would not materialize as originally anticipated.
Certain amounts have been reclassified to conform to the current year presentation. We classified the financial results of our 3ware storage adapter business as discontinued operations for all periods presented due to the sale of our 3ware storage adapter business to LSI Corporation on April 21, 2009.
The following tables present a summary of our results of operations for the fiscal years ended March 31, 2010 and 2009 (dollars in thousands):
| Fiscal Year Ended March 31, | Increase (Decrease) |
% Change |
|||||||||||||||||||
| 2010 | 2009 | ||||||||||||||||||||
| Amount | % of Net Revenue |
Amount | % of Net Revenue |
||||||||||||||||||
| Net revenues |
$ | 205,598 | 100.0 | % | $ | 214,216 | 100.0 | % | $ | (8,618 | ) | (4.0 | )% | ||||||||
| Cost of revenues |
92,931 | 45.2 | 101,070 | 47.2 | (8,139 | ) | (8.1 | ) | |||||||||||||
| Gross profit |
112,667 | 54.8 | 113,146 | 52.8 | (479 | ) | (0.4 | ) | |||||||||||||
| Total operating expenses |
138,763 | 67.5 | 370,609 | 173.0 | (231,846 | ) | (62.6 | ) | |||||||||||||
| Operating loss |
(26,096 | ) | (12.7 | ) | (257,463 | ) | (120.2 | ) | 231,367 | 89.9 | |||||||||||
| Interest and other income (expense), net |
1,889 | 0.9 | (7,581 | ) | (3.5 | ) | 9,470 | 124.9 | |||||||||||||
| Loss from continuing operations before income taxes |
(24,207 | ) | (11.8 | ) | (265,044 | ) | (123.7 | ) | 240,837 | 90.9 | |||||||||||
| Income tax benefit |
(10,610 | ) | (5.2 | ) | (3,946 | ) | (1.8 | ) | (6,664 | ) | (168.9 | ) | |||||||||
| Loss from continuing operations |
(13,597 | ) | (6.6 | ) | (261,098 | ) | (121.9 | ) | 247,501 | 94.8 | |||||||||||
| Gain (loss) from discontinued operations, net of taxes |
6,112 | 3.0 | (48,235 | ) | (22.5 | ) | 54,347 | 112.7 | |||||||||||||
| Net loss |
$ | (7,485 | ) | (3.6 | )% | $ | (309,333 | ) | (144.4 | )% | $ | 301,848 | 97.6 | % | |||||||
35
Table of Contents
The following tables present a summary of our results of operations for the fiscal years ended March 31, 2009 and 2008 (dollars in thousands):
| Fiscal Year Ended March 31, | Increase (Decrease) |
% Change |
|||||||||||||||||||
| 2009 | 2008 | ||||||||||||||||||||
| Amount | % of Net Revenue |
Amount | % of Net Revenue |
||||||||||||||||||
| Net revenues |
$ | 214,216 | 100.0 | % | $ | 194,115 | 100.0 | % | $ | 20,101 | 10.4 | % | |||||||||
| Cost of revenues |
101,070 | 47.2 | 98,756 | 50.9 | 2,314 | 2.3 | |||||||||||||||
| Gross profit |
113,146 | 52.8 | 95,359 | 49.1 | 17,787 | 18.7 | |||||||||||||||
| Total operating expenses |
370,609 | 173.0 | 147,370 | 75.9 | 223,239 | 151.5 | |||||||||||||||
| Operating loss |
(257,463 | ) | (120.2 | ) | (52,011 | ) | (26.8 | ) | (205,452 | ) | (395.0 | ) | |||||||||
| Interest and other income, net |
(7,581 | ) | (3.5 | ) | 10,579 | 5.4 | (18,160 | ) | (171.7 | ) | |||||||||||
| Loss from continuing operations before income taxes |
(265,044 | ) | (123.7 | ) | (41,432 | ) | (21.4 | ) | (223,612 | ) | (539.7 | ) | |||||||||
| Income tax expense (benefit) |
(3,946 | ) | (1.8 | ) | 3,773 | 2.0 | (7,719 | ) | (204.6 | ) | |||||||||||
| Loss from continuing operations |
(261,098 | ) | (121.9 | ) | (45,205 | ) | (23.4 | ) | (215,893 | ) | (477.6 | ) | |||||||||
| Loss from discontinued operations, net of taxes |
(48,235 | ) | (22.5 | ) | (69,916 | ) | (36.0 | ) | 21,681 | 31.0 | |||||||||||
| Net loss from continuing operations |
$ | (309,333 | ) | (144.4 | )% | $ | (115,121 | ) | (59.4 | )% | $ | (194,212 | ) | (168.7 | )% | ||||||
Net Revenues. We generate revenues primarily through sales of our IC products, embedded processors and printed circuit board assemblies to OEMs, such as Alcatel-Lucent, Ciena, Cisco, Brocade, Fujitsu, Hitachi, Huawei, Juniper, Ericsson, NEC, Nortel, Nokia Siemens Networks and Tellabs, who in turn supply their equipment principally to communications service providers.
In July 2008, we entered into a Patent Purchase Agreement (the “Agreement”) with QUALCOMM Incorporated (“Qualcomm”). Pursuant to the Agreement, we agreed to sell a series of our patents, patent applications and associated rights related to certain technologies which were no longer core to our long-term strategic direction and product road maps for an aggregate purchase price of $33.0 million. The purchase price is being paid over three years in equal quarterly payments of $3.0 million each beginning in the three months ended December 31, 2008 through March 31, 2011. Due to the nature of the payment terms, related revenue is being recorded as the payments are received.
The demand for our products has been affected in the past, and may continue to be affected in the future, by various factors, including, but not limited to, the following:
| • | the timing, rescheduling or cancellation of significant customer orders and our ability, as well as the ability of our customers, to manage inventory corrections; |
| • | the qualification, availability and pricing of competing products and technologies and the resulting effects on sales and pricing of our products; |
| • | our ability to specify, develop or acquire, complete, introduce, and market new products and technologies in a cost effective and timely manner; |
| • | the rate at which our present and future customers and end-users adopt our products and technologies in our target markets; |
| • | general economic and market conditions in the semiconductor industry and communications markets, including the current global economic crisis; |
| • | combinations of companies in our customer base, resulting in the combined company choosing our competitor’s IC standardization other than our supported product platforms; and |
36
Table of Contents
| • | the gain or loss of one or more key customers, or their key customers, or significant changes in the financial condition of one or more of our key customers or their key customers. |
For these and other reasons, our net revenue and results of operations for the fiscal year ended March 31, 2010 and prior periods may not necessarily be indicative of future net revenue and results of operations.
Based on direct shipments, net revenues to customers that was equal to or greater than 10% of total net revenues in any of the three years ended March 31, 2010 were as follows:
| 2010 | 2009 | 2008 | |||||||
| Avnet (distributor) |
30 | % | 25 | % | 26 | % | |||
| Hon Hai (sub-contract manufacturer) |
13 | % | * | 10 | % |
| * | Less than 10% of total net revenues for period indicated. |
We expect that our largest customers will continue to account for a substantial portion of our net revenue for the foreseeable future.
Net revenues by geographic region were as follows (in thousands):
| Fiscal Years Ended March 31, | |||||||||
| 2010 | 2009 | 2008 | |||||||
| United States of America |
$ | 68,817 | $ | 63,619 | $ | 54,842 | |||
| Other North America |
7,355 | 16,678 | 23,443 | ||||||
| Europe |
35,372 | 34,108 | 28,154 | ||||||
| Asia |
92,859 | 98,777 | 86,609 | ||||||
| Other |
1,195 | 1,034 | 1,067 | ||||||
| $ | 205,598 | $ | 214,216 | $ | 194,115 | ||||
All of our revenues have been denominated in U.S. dollars.
Sale of the 3ware storage adapter business to LSI Corporation. We completed the sale of our 3ware storage adapter business (the “Transaction”), a significant portion of our overall storage business and substantially all of our Store reporting unit, to LSI Corporation on April 21, 2009. As a result, we now expect to generate all of our sales from our remaining business, Process and Transport, which will require us to grow our remaining business in order to achieve profitability. Under the Asset Purchase Agreement with LSI Corporation (the “Purchase Agreement”), which we entered on April 5, 2009, we sold substantially all of the operating assets (other than patents) of our 3ware storage adapter business. The assets sold included customer contracts, inventory, fixed assets, certain intellectual property and other assets, as well as rights to the name “3ware.” The purchase price, adjusted for the level of inventory and products in the channel at the closing of the Transaction, was approximately $21.5 million. The net gain recorded from this transaction during the year ended March 31, 2010 was $11.4 million. Unless otherwise specified, all amounts discussed in the Management’s discussion and analysis addresses only continuing operations.
37
Table of Contents
Key non-GAAP measurements. We use certain non-GAAP metrics such as Adjusted Earnings Before Interest, Taxes, Depreciation and Amortization (“Adjusted EBITDA”) to measure our performance. We define Adjusted EBITDA as net loss less interest income, income taxes, depreciation and amortization, stock-based compensation, amortization of intangibles and other one-time and/or non-cash items. The following table reconciles Adjusted EBITDA to the accompanying financial statements:
| Fiscal Years Ended March 31, | ||||||||||||
| 2010 | 2009 | 2008 | ||||||||||
| Net loss |
$ | (7,485 | ) | $ | (309,333 | ) | $ | (115,121 | ) | |||
| Interest and other income |
(6,816 | ) | (9,563 | ) | (10,612 | ) | ||||||
| Stock-based compensation expense |
13,682 | 9,241 | 10,056 | |||||||||
| Amortization of intangibles |
16,117 | 18,900 | 19,601 | |||||||||
| Restructuring charges |
746 | 8,623 | 2,958 | |||||||||
| Litigation settlement |
— | 130 | 1,125 | |||||||||
| Goodwill impairment charges |
— | 222,972 | — | |||||||||
| Impairment of marketable securities |
2,927 | 17,144 | 1,682 | |||||||||
| Depreciation and amortization |
8,301 | 7,347 | 6,581 | |||||||||
| Option investigation |
— | 80 | 1,072 | |||||||||
| (Gain) loss strategic investment |
2,000 | — | (1,649 | ) | ||||||||
| Gain on renegotiated EDA agreement |
— | — | (749 | ) | ||||||||
| Other and income tax adjustment |
(10,610 | ) | (3,946 | ) | 3,773 | |||||||
| (Gain) loss from discontinued operations |
(6,112 | ) | 48,235 | 69,916 | ||||||||
| Adjusted EBITDA |
$ | 12,750 | $ | 9,830 | $ | (11,367 | ) | |||||
Adjusted EBITDA for the year ended March 31, 2010 was primarily impacted by non-cash charges. Adjusted EBITDA for the year ended March 31, 2009 was primarily impacted by a the goodwill impairment charge. Adjusted EBITDA for the year ended March 31, 2008 was primarily impacted by discontinued operations.
We believe that Adjusted EBITDA is a useful supplemental measure of our operation’s performance because it helps investors evaluate and compare the results of operations from period to period by removing the accounting impact of the company’s financing strategies, tax provisions, depreciation and amortization, restructuring charges, stock based compensation expense, goodwill impairment charges, discontinued operations and other operating items that are outside the Company’s ordinary course of business. We adjust for these excluded items because we believe that, in general, these items possess one or more of the following characteristics: their magnitude and timing is largely outside of the company’s control; they are unrelated to the ongoing operation of the business in the ordinary course; they are unusual or infrequent and the company does not expect them to occur in the ordinary course of business; or they are non-operational, or non-cash expenses involving stock option grants.
Adjusted EBITDA is not a measure determined in accordance with generally accepted accounting principles in the United States, or GAAP, and should not be considered a substitute for operating income, net income or any other measure determined in accordance with GAAP. Adjusted EBITDA should not be considered in isolation or as a substitute for measures of performance prepared in accordance with GAAP. Adjusted EBITDA is used by our management as a measure of operating efficiency and overall financial performance for benchmarking against our peers and competitors and in the fiscal year ended March 31, 2010 will be used as a metric to determine the performance vesting of our three-year restricted stock unit grants issued in May 2009 (the “EBITDA Grants”). Management believes Adjusted EBITDA provides meaningful supplemental information regarding the underlying operating performance of our business. Management also believes that Adjusted EBITDA is useful to investors because it is frequently used by securities analysts, investors and other interested parties to evaluate the company.
38
Table of Contents
The book-to-bill ratio is another ratio commonly used by investors to compare and evaluate technology and semiconductor companies. The book-to-bill ratio is a demand-to-supply ratio compares the total amount of orders received to the total amount of orders filled. This ratio tells whether the company has more orders than it can deliver (if greater than 1), has the same amount of orders that it can deliver (equals 1), or has less orders than it can deliver (under 1). The ratio provides a very sensitive indicator of whether orders are rising or falling and at what pace. Our book-to-bill ratio at March 31, 2010, 2009 and 2008 was 1.3, 1.5 and 1.1, respectively.
CRITICAL ACCOUNTING POLICIES
The preparation of financial statements in accordance with accounting principles generally accepted in the United States requires us to make estimates and assumptions that affect the reported amounts of assets and liabilities at the date of the financial statements and the reported amounts of net revenue and expenses in the reporting period. We regularly evaluate our estimates and assumptions related to: inventory valuation and warranty liabilities, which affect our cost of sales and gross margin; the valuation of purchased intangibles, which has in the past affected, and could in the future affect, our impairment charges to write down the carrying value of purchased intangibles and the amount of related periodic amortization expense recorded for definite-lived intangibles; the valuation of restructuring liabilities, which affects the amount and timing of restructuring charges; and an evaluation of other-than-temporary impairment of our investments, which affects the amount and timing of write-down charges. We also have other key accounting policies, such as our policies for stock-based compensation and revenue recognition, including the deferral of a portion of revenues on sales to distributors. The methods, estimates and judgments we use in applying these critical accounting policies have a significant impact on the results we report in our financial statements. We base our estimates and assumptions on historical experience and on various other factors that we believe to be reasonable under the circumstances, the results of which form the basis for making judgments about the carrying values of assets and liabilities that are not readily apparent from other sources. The actual results experienced by us may differ materially and adversely from management’s estimates. To the extent there are material differences between our estimates and the actual results, our future results of operations will be affected.
We believe the following critical accounting policies require us to make significant judgments and estimates in the preparation of our consolidated financial statements.
Inventory Valuation
Our policy is to value inventories at the lower of cost or market on a part-by-part basis. This policy requires us to make estimates regarding the market value of our inventories, including an assessment of excess or obsolete inventories. We determine excess and obsolete inventories based on an estimate of the future demand for our products within a specified time horizon, generally 12 months. The estimates we use for future demand are also used for near-term capacity planning and inventory purchasing and are consistent with our revenue forecasts. If our demand forecast is greater than our actual demand we may be required to take additional excess inventory charges, which would decrease gross margin and net operating results. For example, as of March 31, 2010, reducing our future demand estimate to six months could decrease our current inventory valuation by approximately $4.1 million or increasing our future demand forecast to 18 months could increase our current inventory valuation by approximately $0.7 million.
Intangible Asset Valuation
We evaluate our long-lived assets such as property, plant and equipment and purchased intangible assets with finite lives, for impairment whenever events or changes in circumstances indicate the carrying value of an asset or asset group may not be recoverable. The carrying value of an asset or asset group is not recoverable if the amount of undiscounted future cash flows the assets are expected to generate (including any net proceeds expected from the disposal of the asset) are less than its carrying value. When we identify an impairment has
39
Table of Contents
occurred, we reduce the carrying value of the assets to its comparable market value (if available and appropriate) or to its estimated fair value based on a discounted cash flow approach.
Intangible assets, such as purchased technology, are generally recorded in connection with a business acquisition. The value assigned to intangible assets is usually based on estimates and judgments regarding expectations for the success and life cycle of products and technology acquired. We evaluate the useful lives of our intangible assets each reporting period to determine whether events and circumstances require revising the remaining period of amortization.
Investments
We hold a variety of securities that have varied underlying investments. We review our investment portfolio periodically to assess for other-than-temporary impairment. We assess the existence of impairment of our investments in order to determine the classification of the impairment as “temporary” or “other-than-temporary”. The factors used to determine whether an impairment is temporary or other-than-temporary involve considerable judgment. The recent economic climate and volatile financial markets have created an environment in which it may be difficult to make accurate estimates and assumptions on which we base our judgments. The factors we consider in determining whether any individual impairment is temporary or other-than-temporary are primarily the length of the time and the extent to which the market value has been less than amortized cost, the nature of underlying assets (including the degree of collateralization), the financial condition, credit rating, market liquidity conditions and near-term prospects of the issuer. If the fair value of a debt security is less than its amortized cost basis at the balance sheet date, an assessment would have to be made as to whether the impairment is other-than-temporary. If we decided to sell the security, an other-than-temporary impairment shall be considered to have occurred. However, if we do not intend to sell the debt security, we shall consider available evidence to assess whether it more likely than not will be required to sell the security before the recovery of its amortized cost basis due to cash, working capital requirements, contractual or regulatory obligations indicate that the security will be required to be sold before a forecasted recovery occurs. If it is more likely than not that we are required to sell the security before recovery of its amortized cost basis, an other-than-temporary impairment is considered to have occurred. If we do not expect to recover the entire amortized cost basis of the security, we would not be able to assert that it will recover its amortized cost basis even if we do not intend to sell the security. Therefore, in those situations, an other-than-temporary impairment shall be considered to have occurred. Use of present value cash flow models to determine whether the entire amortized cost basis of the security will be recovered is expected. We will compare the present value of cash flows expected to be collected from the security with the amortized cost basis of the security. An other-than-temporary impairment is said to have occurred if the present value of cash flows expected to be collected is less than the amortized cost basis of the security. In the fiscal year ended March 31, 2010, we recorded other-than-temporary impairment charges of $4.1 million to current earnings. For the fiscal year ended March 31, 2010, we did not record an impairment charge in connection with other securities in a continuous loss position (fair value less than carrying value) with unrealized losses of $0.2 million as we believe that such unrealized losses are temporary. As of March 31, 2010, we also had $9.0 million in unrealized gains. For the fiscal years ended March 31, 2009 and 2008, we recorded other-than-temporary impairment charges of $17.1 million and $1.7 million, respectively, to current earnings.
Restructuring Charges
Over the last several years we have undertaken significant restructuring initiatives, which have required us to develop formalized plans for exiting certain business activities and reducing spending levels. We have had to record estimated expenses for employee severance, long-term asset write downs, lease cancellations, facilities consolidation costs, and other restructuring costs. Given the significance, and the timing of the execution, of such activities, this process is complex and involves periodic reassessments of estimates made at the time the original decisions were made. Our assumptions for exiting certain facilities, such as estimating sublease incomes, may differ from actual outcomes, which could result in the need to record additional costs or reduce estimated amounts previously charged to restructuring expense. Our policies require us to periodically evaluate the adequacy of the remaining liabilities under our restructuring initiatives. In the fiscal year ended March 31, 2010,
40
Table of Contents
we recorded net restructuring charges of approximately $0.8 million associated with our restructuring actions to continuing operations. In the fiscal year ended March 31, 2009, we recorded net charges of $8.7 million for our restructuring activities, of which $0.1 million has been reclassified to discontinued operations. In the fiscal year ended March 31, 2008, we recorded restructuring charges of approximately $3.0 million associated with our restructuring actions to continuing operations. For a full description of our restructuring activities, refer to our discussion of restructuring charges in Note 6 to the Notes to Consolidated Financial Statements, included in Part IV, Item 15, Exhibits, Financial Statement Schedules, of this Annual Report.
Stock-Based Compensation Expense
All share-based payments, including grants of stock options, restricted stock units and employee stock purchase rights, are required to be recognized in our financial statements based on their respective grant date fair values. The fair value of each employee stock option and employee stock purchase right is estimated on the date of grant using an option pricing model that meets certain requirements. We currently use the Black-Scholes option pricing model to estimate the fair value of our share-based payments. The fair values generated by the Black-Scholes model may not be indicative of the actual fair values of our stock-based awards as it does not consider certain factors important to stock-based awards, such as continued employment, periodic vesting requirements and limited transferability. The determination of the fair value of share-based payment awards utilizing the Black-Scholes model is affected by our stock price and a number of assumptions, including expected volatility, expected life, risk-free interest rate and expected dividends. We estimate the expected volatility of our stock options at grant date by equally weighting the historical volatility and the implied volatility of our stock over specific periods of time as the expected volatility assumption required in the Black-Scholes model. The expected life of the stock options is based on historical and other data including life of the option and vesting period. The risk-free interest rate assumption is the implied yield currently available on zero-coupon government issues with a remaining term equal to the expected term. The dividend yield assumption is based on our history and expectation of dividend payouts. The fair value of our restricted stock units is based on the fair market value of our common stock on the date of grant. Forfeitures are required to be estimated at the time of grant and revised, if necessary, in subsequent periods if actual forfeitures differ significantly from those estimated. We evaluate the assumptions used to value stock-based awards on a quarterly basis. If factors change and we employ different assumptions, stock-based compensation expense may differ significantly from what we have recorded in the past. If there are any modifications or cancellations of the underlying unvested securities, we may be required to accelerate, increase or cancel any remaining unearned stock-based compensation expense. We currently estimate when and if performance-based options will be earned. If the awards are not considered probable of achievement, no amount of stock-based compensation is recognized. If we consider the award to be probable, expense is recorded over the estimated service period. To the extent that our assumptions are incorrect, the amount of stock-based compensation recorded will be increased or decreased. To the extent that we grant additional equity securities to employees or we assume unvested securities in connection with any acquisitions, our stock-based compensation expense will be increased by the additional unearned compensation resulting from those additional grants or acquisitions.
Revenue Recognition
We recognize revenue based on four basic criteria: 1) there is evidence that an arrangement exists; 2) delivery has occurred; 3) the fee is fixed or determinable; and 4) collectability is reasonably assured. We recognize revenue upon determination that all criteria for revenue recognition have been met. In addition, we do not recognize revenue until the applicable customer’s acceptance criteria have been met. The criteria are usually met at the time of product shipment, except for shipments to distributors with rights of return. The portion of revenue from shipments to distributors subject to rights of return is deferred until the agreed upon percentage of return or cancellation privileges lapse. Revenue from shipments to distributors without return rights is recognized upon shipment. In addition, we record reductions to revenue for estimated allowances such as returns not pursuant to contractual rights, competitive pricing programs and rebates. These estimates are based on our experience with product returns and the contractual terms of the competitive pricing and rebate programs.
41
Table of Contents
Shipping terms are generally FCA (Free Carrier) shipping point. If actual returns or pricing adjustments exceed our estimates, we would record additional reductions to revenue.
From time to time we generate revenue from the sale of our internally developed IP. We generally recognize revenue from the sale of IP when all basic criteria outlined above are met.
RESULTS OF OPERATIONS
Comparison of the Fiscal Year Ended March 31, 2010 to the Fiscal Year Ended March 31, 2009
Net Revenues. Net revenues for the fiscal year ended March 31, 2010 were $205.6 million, representing a decrease of 4.0% from the net revenues of $214.2 million for the fiscal year ended March 31, 2009. We classify our revenues into two categories based on the markets that the underlying products serve. The categories are Process and Transport. We use this information to analyze our performance and success in these markets. See the following tables (dollars in thousands):
| Fiscal Years Ended March 31, | Increase (Decrease) |
% Change |
|||||||||||||||||
| 2010 | 2009 | ||||||||||||||||||
| Amount | % of Net Revenue |
Amount | % of Net Revenue |
||||||||||||||||
| Process |
$ | 106,374 | 51.7 | % | $ | 121,125 | 56.5 | % | $ | (14,751 | ) | (12.2 | )% | ||||||
| Transport |
99,224 | 48.3 | 93,091 | 43.5 | 6,133 | 6.6 | |||||||||||||
| $ | 205,598 | 100.0 | % | $ | 214,216 | 100.0 | % | $ | (8,618 | ) | (4.0 | )% | |||||||
During the fiscal year ended March 31, 2010, revenues, as anticipated, partially recovered from the prior fiscal year’s economic recession and overall softness in demand reflected in the lower volumes that resulted in lower revenues. In addition, during the fiscal years ended March 31, 2010 and 2009, we also recorded $12.8 million and $9.0 million in licensing revenues, respectively, under Transport from the sale of certain non-core patents and associated rights. The decline in the Process revenues was consistent with the overall decline in market conditions while the Transport revenues improved marginally and which were further supplemented by the incremental licensing revenues, as discussed above. The geographical mix of our revenues depends on the location of our end customers or distributors and may change from time to time. The lower revenues attributable to Other North America in fiscal 2010 compared to fiscal 2009 is primarily due to the drop in revenues relating to a customer in Canada. We expect revenues from continuing operations to increase by 4.0% to 4.5% in the three months ending June 30, 2010, compared to the three months ended March 31, 2010.
Gross Profit. The following table presents net revenues, cost of revenues and gross profit for the fiscal years ended March 31, 2010 and 2009 (dollars in thousands):
| Fiscal Years Ended March 31, | Decrease | % Change |
|||||||||||||||||
| 2010 | 2009 | ||||||||||||||||||
| Amount | % of Net Revenue |
Amount | % of Net Revenue |
||||||||||||||||
| Net revenues |
$ | 205,598 | 100.0 | % | $ | 214,216 | 100.0 | % | $ | (8,618 | ) | (4.0 | )% | ||||||
| Cost of revenues |
92,931 | 45.2 | 101,070 | 47.2 | (8,139 | ) | (8.1 | ) | |||||||||||
| Gross profit |
$ | 112,667 | 54.8 | % | $ | 113,146 | 52.8 | % | $ | (479 | ) | (0.4 | )% | ||||||
The gross profit percentage for the fiscal year ended March 31, 2010 increased to 54.8%, compared to 52.8% for the fiscal year ended March 31, 2009. The increase in our gross profit percentage was primarily due to lower overhead costs, a favorable product mix, the sale of inventory for which the cost basis has been previously reduced and an increase of $3.8 million in revenue from the sale of our non-core patents and associated rights to Qualcomm, offset by a decrease in product revenues.
42
Table of Contents
The amortization of purchased intangible assets included in cost of revenues during the fiscal year ended March 31, 2010 was $12.1 million, compared to $14.9 million for the fiscal year ended March 31, 2009. Based on the amount of capitalized purchased intangibles on the balance sheet as of March 31, 2010, we expect amortization expense for purchased intangibles charged to cost of revenues to be $10.5 million in fiscal 2011 and $0.9 million for fiscal 2012. Future acquisitions of businesses may result in substantial additional charges, which would impact the gross profit percentage in future periods.
Research and Development and Selling, General and Administrative Expenses. The following table presents research and development and selling, general and administrative expenses for the fiscal years ended March 31, 2010 and 2009 (dollars in thousands):
| Fiscal Years Ended March 31, | Increase (Decrease) |
% Change |
|||||||||||||||||
| 2010 | 2009 | ||||||||||||||||||
| Amount | % of Net Revenue |
Amount | % of Net Revenue |
||||||||||||||||
| Research and development |
$ | 88,096 | 42.8 | % | $ | 84,687 | 39.5 | % | $ | 3,409 | 4.0 | % | |||||||
| Selling, general and administrative |
$ | 45,901 | 22.3 | % | $ | 50,097 | 23.4 | % | $ | (4,196 | ) | (8.4 | )% | ||||||
Research and Development. Research and development (“R&D”) expenses consist primarily of salaries and related costs (including stock-based compensation) of employees engaged in research, design and development activities, costs related to engineering design tools, subcontracting costs and facilities expenses. The increase in R&D expenses of 4.0% for the fiscal year ended March 31, 2010 compared to the fiscal year ended March 31, 2009, was primarily due to an increase of $2.8 million in consumable equipment and software cost, $2.4 million in stock-based compensation charges, $1.4 million in printed circuit board costs, $1.3 million in third party foundry cost and a decrease of $1.6 million in customer funded non-recurring engineering payments offset by a decrease of $4.7 million in development costs of a new processor core and $1.0 million in contractor costs. The total R&D expenses for fiscal 2010 also includes $6.2 million related to Veloce, our Variable Interest Entity. We believe that a continued commitment to R&D is vital to our goal of maintaining a leadership position with innovative products. In addition to our internal R&D programs, our business strategy includes acquiring products, technologies or businesses from third parties. Future acquisitions of products, technologies or businesses may result in substantial additional on-going R&D costs.
Selling, General and Administrative. Selling, general and administrative (“SG&A”) expenses consist primarily of personnel-related expenses, professional and legal fees, corporate branding and facilities expenses. The decrease in SG&A expenses of 8.4% for the fiscal year ended March 31, 2010 compared to the fiscal year ended March 31, 2009, was primarily due to a decrease of $3.3 million in personnel costs, $1.3 million in contractor costs, $0.6 million in marketing communications, $0.5 million in consumable equipment and software costs, $0.4 million in facilities costs offset by an increase of $1.9 million in stock-based compensation charges. Future acquisitions of products, technologies or businesses may result in substantial additional on-going SG&A costs.
Stock-Based Compensation. The following table presents stock-based compensation expense for the fiscal years ended March 31, 2010 and 2009, which was included in the tables above (dollars in thousands):
| Fiscal Years Ended March 31, | Increase | % Change |
||||||||||||||||
| 2010 | 2009 | |||||||||||||||||
| Amount | % of Net Revenue |
Amount | % of Net Revenue |
|||||||||||||||
| Costs of revenues |
$ | 587 | 0.3 | % | $ | 442 | 0.2 | % | $ | 145 | 32.8 | % | ||||||
| Research and development |
6,268 | 3.0 | 3,845 | 1.8 | 2,423 | 63.0 | ||||||||||||
| Selling, general and administrative |
6,827 | 3.3 | 4,954 | 2.3 | 1,873 | 37.8 | ||||||||||||
| $ | 13,682 | 6.6 | % | $ | 9,241 | 4.3 | % | $ | 4,441 | 48.1 | % | |||||||
43
Table of Contents
The amount of unearned stock-based compensation currently estimated to be expensed from now through fiscal 2014 related to unvested share-based payment awards at March 31, 2010 is $26.0 million. This expense relates to equity instruments already issued and will not be affected by our future stock price. The increase in stock-based compensation for the fiscal year ended March 31, 2010 compared to the fiscal year ended March 31, 2010 is primarily due to the EBITDA Grants issued during the fiscal year ended March 31, 2010 and the reversal of $1.3 million of stock-based compensation expense for performance based options during the fiscal year ended March 31, 2009. Vesting of the EBITDA Grants is subject to (i) the Company’s performance as measured by earnings before interest, taxes, depreciation and amortization (“EBITDA”), and (ii) individual performance as measured by the accomplishment of goals and objectives. The weighted-average period over which the unearned stock-based compensation is expected to be recognized is approximately 2.3 years. If there are any modifications or cancellations of the underlying unvested securities, we may be required to accelerate, increase or cancel any remaining unearned stock-based compensation expense. Future stock-based compensation expense will increase to the extent that we grant additional equity awards. The value of these grants cannot be predicted at this time because it will depend on the number of share-based payments granted and the then current fair values.
Goodwill Impairment Charges. During the fiscal year ended March 31, 2009, we assessed goodwill for impairment since we observed there were indicators of impairment. Based upon an analysis performed in the fiscal year months ended March 31, 2009, which included a discounted cash flow analysis, we recorded an impairment of goodwill of $223.0 million to continuing operations in the consolidated statements of operations. The reporting units impaired were Process and Transport in the amounts of $101.5 million and $121.5 million, respectively. In addition, we recorded an impairment of goodwill of $41.2 million to discontinued operations for the Store reporting unit in the consolidated statements of operations.
Restructuring Charges, net. During the fiscal year ended March 31, 2010, we moved some of our functions offshore, which will allow us to be much closer to our third party subcontract manufacturers, thus reducing costs by taking advantage of our global cost structure and improve efficiencies by eliminating the delays inherent in working in different time zones and to better align our global operations to achieve greater efficiencies. During the fiscal year ended March 31, 2009, we implemented a restructuring program to reduce expenses and excess capacity in response to the worsening economic conditions. For additional information on our restructuring activities, see Note 6 of the Notes to Consolidated Financial Statements, included in Part IV, Item 15, Exhibits, Financial Statement Schedules, of this Annual Report.
Interest and Other Income, net. The following table presents interest income (expense) and other income, net for the fiscal years ended March 31, 2010 and 2009 (dollars in thousands):
| Fiscal Years Ended March 31, | Increase (Decrease) |
% Change |
|||||||||||||||||||
| 2010 | 2009 | ||||||||||||||||||||
| Amount | % of Net Revenue |
Amount | % of Net Revenue |
||||||||||||||||||
| Interest income (expense), net and other-than-temporary impairment |
$ | 3,440 | 1.7 | % | $ | (8,073 | ) | (3.8 | )% | $ | 11,513 | 142.6 | % | ||||||||
| Other income (expense), net |
$ | (1,551 | ) | (0.8 | )% | $ | 492 | 0.2 | % | $ | (2,043 | ) | (415.2 | )% | |||||||
Interest Income (Expense) and Other-Than-Temporary Impairment, net. Interest income (expense) and other-than-temporary impairment, net of management fees and other-than-temporary impairment, reflects interest earned on cash and cash equivalents, short-term investments and marketable securities as well as realized gains and losses from the sale of short-term investments and impairment charges on investments, less interest expense. The increase in interest income (expense) and other-than-temporary impairment, net for the fiscal year ended March 31, 2010, compared to the fiscal year ended March 31, 2009 was primarily due to a $13.0 million decrease in other-than-temporary impairment charges offset by a decrease in interest income from lower interest rates.
Other Income, net. The decrease in other income (expense), net for the fiscal year ended March 31, 2010, compared to the fiscal year ended March 31, 2009 was primarily due to a $2.0 million impairment charge for a strategic investment which we determined to be impaired during the fiscal year ended March 31, 2010.
44
Table of Contents
Income Taxes. The federal statutory income tax rate was 35% for the fiscal years ended March 31, 2010 and 2009. The increase in the income tax benefit recorded for the fiscal year ended March 31, 2010 compared to the fiscal year ended March 31, 2009, was primarily related to discontinued operations, other comprehensive income and an increase in refundable tax credits. The allocation of the current year tax provision included recognizing $10.4 million tax benefit arising from the loss from continuing operations and the offsetting tax expense was allocated on a pro rata basis to income from discontinued operations and other comprehensive income of $4.2 million and $6.2 million, respectively, for the fiscal year ended March 31, 2010.
Discontinued Operations. We completed the sale of our 3ware storage adapter business (“Storage Business”) to LSI Corporation on April 21, 2009. Under the Purchase Agreement, we substantially sold all of the operating assets (other than patents) of our Storage Business. The assets sold included customer contracts, inventory, fixed assets, certain intellectual property and other assets, as well as rights to the name “3ware.” The purchase price for the Transaction was approximately $20.0 million, subject to adjustments based on the level of inventory and products in the channel at the closing of the Transaction. After adjustments for the level of inventory of $0.7 million and products in the channel of $0.8 million, the final adjusted price of the Transaction was approximately $21.5 million. During the fiscal year ended March 31, 2010, we reached an agreement with LSI Corporation to end the warranty support portion of the Purchase Agreement. We recorded a net gain of $11.4 million from the sale during the fiscal year ended March 31, 2010. During the fiscal year ended March 31, 2010, we recognized a tax charge of approximately $4.2 million to discontinued operations in connection with the sale of our 3ware storage adapter business and concurrently recorded the same amount as an income tax benefit to continuing operations.
The following table presents the operating results of the discontinued operations of our 3ware storage adapter business for the fiscal years ended March 31, 2010 and 2009 (dollars in thousands):
3WARE STORAGE ADAPTER BUSINESS
CONSOLIDATED STATEMENTS OF OPERATIONS
| Fiscal Years Ended March 31, | ||||||||
| 2010 | 2009 | |||||||
| (In thousands, except per share data) |
||||||||
| Net revenues |
$ | 3,690 | $ | 39,849 | ||||
| Cost of revenues |
3,268 | 24,437 | ||||||
| Gross profit |
422 | 15,412 | ||||||
| Operating expenses: |
||||||||
| Research and development |
687 | 11,470 | ||||||
| Selling, general and administrative |
807 | 9,561 | ||||||
| Amortization of purchased intangible assets |
— | 1,260 | ||||||
| Restructuring charges, net |
— | 126 | ||||||
| Goodwill impairment charges |
— | 41,158 | ||||||
| Total operating expenses |
1,494 | 63,575 | ||||||
| Operating loss |
(1,072 | ) | (48,163 | ) | ||||
| Gain on sale of Storage Business |
11,366 | — | ||||||
| Income (loss) from discontinued operations before income taxes |
10,294 | (48,163 | ) | |||||
| Income tax expense (benefit) |
4,182 | 72 | ||||||
| Net income (loss) from discontinued operations |
$ | 6,112 | $ | (48,235 | ) | |||
45
Table of Contents
Comparison of the Fiscal Year Ended March 31, 2009 to the Fiscal Year Ended March 31, 2008
Net Revenues. Net revenues for the fiscal year ended March 31, 2009 were $214.2 million, representing an increase of 10.4% from the net revenues of $194.1 million for the fiscal year ended March 31, 2008. We classify our revenues into two categories based on the markets that the underlying products serve, Process and Transport. See the following tables (dollars in thousands):
| Fiscal Years Ended March 31, | ||||||||||||||||||
| 2009 | 2008 | |||||||||||||||||
| Amount | % of Net Revenue |
Amount | % of Net Revenue |
Increase | % Change |
|||||||||||||
| Process |
$ | 121,125 | 56.5 | % | $ | 106,665 | 54.9 | % | $ | 14,460 | 13.6 | % | ||||||
| Transport |
93,091 | 43.5 | 87,450 | 45.1 | 5,641 | 6.5 | ||||||||||||
| $ | 214,216 | 100.0 | % | $ | 194,115 | 100.0 | % | $ | 20,101 | 10.4 | % | |||||||
During the fiscal year ended March 31, 2009, revenues gradually recovered from the prior year’s downward inventory corrections at our customers, delayed product transitions and overall softness in demand. In addition during fiscal 2009, we recorded $9.0 million in licensing revenues from the sale of certain non-core patents and associated rights.
Gross Profit. The following table presents net revenues, cost of revenues and gross profit for the fiscal years ended March 31, 2009 and 2008 (dollars in thousands):
| Fiscal Years Ended March 31, | ||||||||||||||||||
| 2009 | 2008 | |||||||||||||||||
| Amount | % of Net Revenue |
Amount | % of Net Revenue |
Increase | % Change |
|||||||||||||
| Net revenues |
$ | 214,216 | 100.0 | % | $ | 194,115 | 100.0 | % | $ | 20,101 | 10.4 | % | ||||||
| Cost of revenues |
101,070 | 47.2 | 98,756 | 50.9 | 2,314 | 2.3 | ||||||||||||
| Gross profit |
$ | 113,146 | 52.8 | % | $ | 95,359 | 49.1 | % | $ | 17,787 | 18.7 | % | ||||||
The gross profit percentage for the fiscal year ended March 31, 2009 increased to 52.8%, compared to 49.1% for the fiscal year ended March 31, 2008. The increase in our gross profit percentage was primarily due to favorable product mix, cost improvements, the sale of previously written off inventory, $9.0 million revenue from the sale of our non-core patents and associated rights to Qualcomm and an overall increase in net revenues.
The amortization of purchased intangible assets included in cost of revenues during the fiscal year ended March 31, 2009 was $14.9 million compared to $15.5 million for the fiscal year ended March 31, 2008.
Research and Development and Selling, General and Administrative Expenses. The following table presents R&D and SG&A expenses for the fiscal years ended March 31, 2009 and 2008 (dollars in thousands):
| Fiscal Years Ended March 31, | |||||||||||||||||||
| 2009 | 2008 | ||||||||||||||||||
| Amount | % of Net Revenue |
Amount | % of Net Revenue |
Decrease | % Change |
||||||||||||||
| Research and development |
$ | 84,687 | 39.5 | % | $ | 86,117 | 44.4 | % | $ | (1,430 | ) | (1.7 | )% | ||||||
| Selling, general and administrative |
$ | 50,097 | 23.4 | % | $ | 52,037 | 26.8 | % | $ | (1,940 | ) | (3.7 | )% | ||||||
Research and Development. The decrease in R&D expenses of 1.7% for the fiscal year ended March 31, 2009, compared to the fiscal year ended March 31, 2008, was primarily due to a decrease of $5.0 million in third party foundry cost and $1.5 million in technology access fees offset by an increase of $1.3 million in personnel costs and $3.5 million in development costs of a new processor core.
46
Table of Contents
Selling, General and Administrative. The decrease in SG&A expenses of 3.7% for the fiscal year ended March 31, 2009, compared to the fiscal year ended March 31, 2008, was primarily due to a decrease of $1.5 million in personnel costs.
Stock-Based Compensation. The following table presents stock-based compensation expense for the fiscal years ended March 31, 2009 and 2008, which was included in the tables above (dollars in thousands):
| Fiscal Years Ended March 31, | |||||||||||||||||||
| 2009 | 2008 | ||||||||||||||||||
| Amount | % of Net Revenue |
Amount | % of Net Revenue |
Decrease | % Change |
||||||||||||||
| Costs of revenues |
$ | 442 | 0.2 | % | $ | 550 | 0.3 | % | $ | (108 | ) | (19.6 | )% | ||||||
| Research and development |
3,845 | 1.8 | 4,035 | 2.1 | (190 | ) | (4.7 | ) | |||||||||||
| Selling, general and administrative |
4,954 | 2.3 | 5,471 | 2.8 | (517 | ) | (9.4 | ) | |||||||||||
| $ | 9,241 | 4.3 | % | $ | 10,056 | 5.2 | % | $ | (815 | ) | (8.1 | )% | |||||||
The decrease in stock-based compensation expense for the fiscal year ended March 31, 2009, compared to the fiscal year ended March 31, 2008, was primarily due to the reversal of stock-based compensation expense for performance option grants in December 2008 because the performance criteria was not achieved, offset by new option grants in fiscal 2009.
Goodwill Impairment Charges. During the fiscal year ended March 31, 2009, we assessed goodwill for impairment since we observed there were indicators of impairment. Based upon an analysis performed in the fiscal year ended March 31, 2009, which included a discounted cash flow analysis, we recorded an impairment of goodwill of $223.0 million to continuing operations in the consolidated statements of operations. The reporting units impaired were Process and Transport in the amounts of $101.5 million and $121.5 million, respectively. In addition, we recorded an impairment of goodwill of $41.1 million to discontinued operations for the Store reporting unit in the consolidated statements of operations. Based upon an analysis performed in the fiscal year ended March 31, 2008, we recorded a charge for the impairment of goodwill of $71.5 million, which had been reclassified to discontinued operations.
Restructuring Charges, net. These include charges for restructuring that we recorded under various restructuring programs. The increase in the fiscal year ended March 31, 2009, compared to the fiscal year ended March 31, 2008, resulted from our efforts to realign and focus on our core competencies, eliminate redundancies and reduce operating expenses in response to the slowdown experienced during the fiscal year ended March 31, 2009. For additional information on our restructuring activities, see Note 6 of the Notes to Consolidated Financial Statements, included in Part IV, Item 15, Exhibits, Financial Statement Schedules, of this Annual Report.
Option Investigation, net. During the first quarter of fiscal 2007, we initiated a review of our historical stock option granting policies. We incurred professional and legal fees as a result of our self-initiated review. Although we concluded our investigation during the fourth quarter of fiscal 2007, we continued to incur expenses for the related ongoing legal and regulatory proceedings as a result of the option investigation. These expenses were offset by our insurance proceeds of $1.0 million from our insurance provider during fiscal 2008. During fiscal 2009, we incurred additional expenses, offset by insurance proceeds for the related ongoing legal and regulatory proceedings which were concluded during fiscal 2009.
Litigation Settlement, net. During the fiscal year ended March 31, 2008, we recorded an accrual of $1.1 million, net, related to a potential litigation settlement with Spirent. We acquired Quake in August 2006 and in November 2002, Spirent filed suit in the Ontario (Canada) Superior Court of Justice against Quake. Spirent’s claim was for alleged rent owed by Quake pursuant to an offer to sublease. On appeal, Spirent was granted judgment against Quake plus legal costs. During the fiscal year ended March 31, 2009, we recorded an additional $0.1 million when the settlement was finalized.
47
Table of Contents
Interest and Other Income, net. The following table presents interest income (expense) and other income, net for the fiscal years ended March 31, 2009 and 2008 (dollars in thousands):
| Fiscal Years Ended March 31, | ||||||||||||||||||||
| 2009 | 2008 | |||||||||||||||||||
| Amount | % of Net Revenue |
Amount | % of Net Revenue |
Decrease | % Change |
|||||||||||||||
| Interest income (expense), net and other-than-temporary impairment |
$ | (8,073 | ) | 3.8 | % | $ | 8,635 | 4.4 | % | $ | (16,708 | ) | (193.5 | )% | ||||||
| Other income, net |
$ | 492 | 0.2 | % | $ | 1,944 | 1.0 | % | $ | (1,452 | ) | (74.7 | )% | |||||||
Interest Income (Expense), net and Other-Than-Temporary Impairment. The decrease for the fiscal year ended March 31, 2009, compared to the fiscal year ended March 31, 2008 was mainly due to the effect of other-than-temporary impairment charges of $17.1 million for fiscal 2009, compared to $1.7 million for fiscal 2008.
Other Income, net. Other income for the fiscal years ended March 31, 2008 included a $4.6 million gain from the sale of our strategic equity investment in Mellanox Technologies, Ltd., an Israeli company listed on the Nasdaq Stock Market, which was offset by a $3.0 million impairment charge on another strategic investment.
Income Taxes. The federal statutory income tax rate was 35% for the fiscal years ended March 31, 2009 and 2008. The income tax benefit recorded for the fiscal year ended March 31, 2009 was primarily due to the goodwill impairment recorded in the fiscal year ended March 31, 2009, resulting in the elimination of deferred tax liabilities on tax-deductible goodwill which previously had only been amortized for tax purposes in connection with the acquisition of assets and licensed intellectual property related to IBM’s Power PRS Switch Fabric line which we acquired in September 2003. The deferred tax liabilities were no longer required because the associated goodwill was written down to zero for financial reporting during the fiscal year ended March 31, 2009. The income tax expense during fiscal 2008 related primarily to recording the deferred tax liability.
Discontinued Operations. We completed the sale of our 3ware storage adapter business, a significant portion of our business and substantially all of our Store reporting unit, to LSI Corporation on April 21, 2009.
The following table presents the operating results of the discontinued operations of our 3ware storage adapter business for the fiscal years ended March 31, 2009 and 2008 (dollars in thousands):
3WARE STORAGE ADAPTER BUSINESS
CONSOLIDATED STATEMENTS OF OPERATIONS
| Fiscal Years Ended March 31, | ||||||||
| 2009 | 2008 | |||||||
| (In thousands, except per share data) |
||||||||
| Net revenues |
$ | 39,849 | $ | 52,031 | ||||
| Cost of revenues |
24,437 | 27,912 | ||||||
| Gross profit |
15,412 | 24,119 | ||||||
| Operating expenses: |
||||||||
| Research and development |
11,470 | 11,433 | ||||||
| Selling, general and administrative |
9,561 | 9,870 | ||||||
| Amortization of purchased intangible assets |
1,260 | 1,260 | ||||||
| Restructuring charges, net |
126 | 27 | ||||||
| Goodwill impairment charges |
41,158 | 71,494 | ||||||
| Total operating expenses |
63,575 | 94,084 | ||||||
| Loss from discontinued operations before income taxes |
(48,163 | ) | (69,965 | ) | ||||
| Income tax expense (benefit) |
72 | (49 | ) | |||||
| Net loss from discontinued operations |
$ | (48,235 | ) | $ | (69,916 | ) | ||
48
Table of Contents
FINANCIAL CONDITION AND LIQUIDITY
As of March 31, 2010, our principal source of liquidity consisted of $206.6 million in cash, cash equivalents and short-term investments. Working capital as of March 31, 2010 was $227.9 million. Total cash, cash equivalents and short-term investments increased by $22.6 million during the fiscal year ended March 31, 2010, primarily due to the proceeds from the sale of our Storage Business of approximately $21.5 million and $16.9 million from operations, offset by open stock repurchase contracts of $10.0 million and $8.1 million in open market repurchases of our common stock. At March 31, 2010, we had contractual obligations not included on our balance sheet totaling $35.4 million, primarily related to facility leases, engineering design software tool licenses and non-cancelable inventory purchase commitments.
For the fiscal year ended March 31, 2010, we generated $16.9 million in cash from our operations, compared to $12.5 million in the fiscal year ended March 31, 2009. Our net loss of $7.5 million for the fiscal year ended March 31, 2010 included $37.1 million of non-cash charges consisting of $6.8 million of depreciation, $16.1 million of amortization of purchased intangibles, $13.7 million of stock-based compensation, $4.3 million for marketable securities impairment, $2.0 million impairment of a strategic investment and $0.4 million in non-cash restructuring charges, offset by $6.2 million in tax expense primarily attributable to unrealized gains included in other comprehensive income. The remaining change in operating cash flows for the fiscal year ended March 31, 2010 primarily reflected decreases in inventories, accrued payroll and other accrued liabilities and deferred revenue, primarily due to the sale of our 3ware storage adapter business to LSI, offset by increases in accounts receivable, other assets and accounts payable. Our overall days sales outstanding increased to 36 days for the period ended March 31, 2010, compared to 35 days for the period ended March 31, 2009.
We generated $25.5 million in cash from our investing activities during the fiscal year ended March 31, 2010, compared to generating $42.0 million during the fiscal year ended March 31, 2009. During the fiscal year ended March 31, 2010, we generated net proceeds of $12.5 million from short-term investment activities and received $21.5 million for the sale of our 3ware storage adapter business, offset by $7.5 million for the purchase of property, equipment and other assets and $1.0 million for a strategic investment.
We used net cash of $19.1 million for our financing activities during the fiscal year ended March 31, 2010, compared to receiving $2.2 million during the fiscal year ended March 31, 2009. For the fiscal year ended March 31, 2010, the major financing use of cash was the funding of our structured stock repurchase agreements for $41.8 million and $8.1 million in open market repurchases of our common stock, offset by proceeds of $27.8 million from the settlement of structured stock repurchase agreements and $3.0 million from the issuance of our common stock.
In August 2004, our Board of Directors authorized a stock repurchase program for the repurchase of up to $200.0 million of our common stock. Under the program, we are authorized to make purchases in the open market or enter into structured agreements. In October 2008, our Board of Directors increased the stock repurchase program by $100.0 million. During the fiscal year ended March 31, 2010, 1.1 million shares were repurchased on the open market at a weighted average price of $7.54 per share. During the fiscal year ended March 31, 2009, no shares were repurchased on the open market. All repurchased shares are retired upon delivery to us.
We also utilize structured stock repurchase agreements to buy back shares which are prepaid written put options on our common stock. We pay a fixed sum of cash upon execution of each agreement in exchange for the right to receive either a pre-determined amount of cash or stock depending on the closing market price of our common stock on the expiration date of the agreement. Upon expiration of each agreement, if the closing market price of our common stock is above the pre-determined price, we will have our cash investment returned with a premium. If the closing market price is at or below the pre-determined price, we will receive the number of shares specified at the agreement inception. Any cash received, including the premium, is treated as additional paid in capital on the balance sheet.
49
Table of Contents
During the fiscal year ended March 31, 2010, we entered into structured repurchase agreements totaling $41.8 million. For those agreements that settled during the fiscal year ended March 31, 2010, we received $27.8 million in cash and 0.7 million in shares of our common stock at an effective purchase price of $7.25 per share from the settled structured stock repurchase agreements. During the fiscal year ended March 31, 2009, we did not enter into any structured stock repurchase agreements. At March 31, 2010, we had approximately $92.4 million remaining available to repurchase shares under the stock repurchase program and two outstanding structured stock repurchase agreements for $10.0 million, of which one settled with the receipt of $5.1 million in April 2010.
On May 17, 2009, we entered into agreements with Veloce, pursuant to which Veloce has agreed to perform product development work for us on an exclusive basis for up to five years for cash and other consideration, including a warrant to purchase shares of our common stock, which will vest upon the achievement of both certain performance and time-based milestones.
Under the merger agreement between us and Veloce, we agreed to acquire Veloce if certain performance milestones and delivery schedules set forth under the merger and other agreements are achieved. We also have the unilateral option to acquire Veloce in the event Veloce fails to meet the milestones and delivery schedules. Should we acquire Veloce pursuant to the merger agreement, the purchase price is estimated to be in the range of approximately $5 million up to approximately $100 million, subject to adjustments. The final price would be based upon the achievement and timing of achieving multiple performance milestones and currently is not determinable. We will determine the form of consideration used for the merger, cash or our stock, at the time of the merger. The merger agreement contains customary representations, warranties and covenants and may be terminated upon mutual agreement of the parties or unilaterally by us or Veloce if the other party fails to meet certain conditions set forth in the agreement. The agreements permit us to appoint one individual to serve on Veloce’s Board of Directors and Board committees.
In addition, we provided Veloce a promissory note of $1.5 million to be forgiven over eight quarters starting on March 31, 2011. If Veloce commits a material breach of the merger agreement, the outstanding principal amount of the note and accrued interest is due to us. If we commit a material breach of the merger agreement, the outstanding principal amount of the note and accrued interest is to be forgiven by us. The promissory note is eliminated in consolidation. We will pay Veloce $1.5 million per quarter for up to twelve consecutive quarters in order to assist Veloce in meeting its expenses to perform its obligations under the agreement and we will recognize the payments as research and development expenses when incurred.
The following table summarizes our contractual operating leases and other purchase commitments as of March 31, 2010 (in thousands):
| Operating Leases |
Other Purchase Commitments |
Total | |||||||
| Fiscal Years Ending March 31, 2011 |
$ | 9,183 | $ | 21,819 | $ | 31,002 | |||
| 2012 |
2,310 | — | 2,310 | ||||||
| 2013 |
2,080 | — | 2,080 | ||||||
| 2014 |
31 | — | 31 | ||||||
| 2015 and thereafter |
— | — | — | ||||||
| Total minimum payments |
$ | 13,604 | $ | 21,819 | $ | 35,423 | |||
The amount in the table above does not include an estimated $0.5 million as it relates to accounting for uncertainty in income taxes.
Off-Balance Sheet Arrangements
We did not have any off-balance sheet arrangements as at March 31, 2010.
50
Table of Contents
We believe that our available cash, cash equivalents and short-term investments will be sufficient to meet our capital requirements and fund our operations for at least the next 12 months, although we could elect or could be required to raise additional capital during such period. There can be no assurance that such additional debt or equity financing will be available on commercially reasonable terms or at all.
| Item 7A. | Quantitative and Qualitative Disclosure About Market Risk. |
Market risk is the potential loss arising from adverse changes in market rates and prices, such as foreign currency exchange rates, interest rates and a decline in the stock market. The current turbulence in the U.S. and global financial markets has caused a decline in stock values across all industries. We are exposed to market risks related to changes in interest rates and foreign currency exchange rates.
We maintain an investment portfolio of various holdings, types of instruments and maturities. These securities are classified as available-for-sale and, consequently, are recorded on our consolidated balance sheets at fair value with unrealized gains or losses reported as a separate component of accumulated other comprehensive income or loss. We have established guidelines relative to diversification and maturities that attempt to maintain safety and liquidity. These guidelines are periodically reviewed and modified to take advantage of interest rate trends. We invest our excess cash in debt instruments of the U.S. Treasury, corporate bonds, mortgage-backed and asset backed securities and closed-end bond funds, with credit ratings as specified in our investment policy. We also have invested in preferred stocks, which pay quarterly fixed rate dividends. We generally do not utilize derivatives to hedge against increases in interest rates which decrease market values.
We are exposed to market risk as it relates to changes in the market value of our investments. At March 31, 2010, our investment portfolio included short-term securities classified as available-for-sale investments with an aggregate fair market value of $84.1 million and a cost basis of $75.4 million. These securities are subject to interest rate risk, as well as credit risk and liquidity risk, and will decline in value if interest rates increase or an issuer’s credit rating or financial condition is decreased.
The following table presents the hypothetical changes in fair value of our short-term investments held at March 31, 2010 (in thousands):
| Valuation of Securities Given
an Interest Rate Decrease of X Basis Points (“BPS”) |
Fair Value as of March 31, 2010 |
Valuation of Securities Given
an Interest Rate Increase of X Basis Points (“BPS”) | |||||||||||||||||||
| (150 BPS) | (100 BPS) | (50 BPS) | 50 BPS | 100 BPS | 150 BPS | ||||||||||||||||
| Available-for-sale investments |
$ | 88,664 | $ | 87,124 | $ | 85,598 | $ | 84,117 | $ | 82,652 | $ | 81,266 | $ | 79,961 | |||||||
The modeling technique used measures the change in fair market value arising from selected potential changes in interest rates. Market changes reflect immediate hypothetical parallel shifts in the yield curve of plus or minus 50 basis points, 100 basis points, and 150 basis points. While this modeling technique provides a measure of our exposure to market risk, the current economic turbulence could cause interest rates to shift by more than 150 basis points.
We also invest in equity instruments of private companies for business and strategic purposes. These investments are valued based on our historical cost, less any recognized impairments. The estimated fair values are not necessarily representative of the amounts that we could realize in a current transaction.
We generally conduct business, including sales to foreign customers, in U.S. dollars, and as a result, we have limited foreign currency exchange rate risk. However, we have periodically entered into forward currency exchange contracts to hedge our overseas monthly operating expenses when deemed appropriate. We did not enter into any forward currency exchange contract during fiscal 2010. Gains and losses on foreign currency
51
Table of Contents
forward contracts that are designated and effective as hedges of anticipated transactions, for which a firm commitment has been attained, are deferred and included in the basis of the transaction in the same period that the underlying transaction is settled. Gains and losses on any instruments not meeting the above criteria are recognized in income or expenses in the consolidated statements of operations in the current period. The effect of an immediate 10% change in foreign exchange rates would not have a material impact on our financial condition or results of operations.
| Item 8. | Financial Statements and Supplementary Data. |
Refer to the Index to Financial Statements on Page F-l.
| Item 9. | Changes in and Disagreements With Accountants on Accounting and Financial Disclosure. |
We changed our independent registered public accounting firm on September 1, 2009 from Ernst & Young LLP to KPMG LLP. Information regarding the change in the independent registered public accounting firm was disclosed in our Current Report on Form 8-K dated September 1, 2009. There were no disagreements or any reportable events requiring disclosure under Item 304(b) of Regulation S-K.
| Item 9A. | Controls and Procedures. |
Conclusion Regarding the Effectiveness of Disclosure Controls and Procedures
We maintain disclosure controls and procedures that are designed to ensure that information required to be disclosed in the reports we file or submit with the SEC pursuant to the Exchange Act is recorded, processed, summarized and reported within the time periods specified in the SEC’s rules and forms and that such information is accumulated and communicated to our management, including our Chief Executive Officer (“CEO”) and Chief Financial Officer (“CFO”), as appropriate, to allow for timely decisions regarding required disclosure. In designing and evaluating the disclosure controls and procedures, management recognizes that any controls and procedures, no matter how well designed and operated, can provide only reasonable assurance of achieving the desired control objectives, and management is required to apply its judgment in evaluating the cost-benefit relationship of possible controls and procedures. In addition, the design of any system of controls also is based in part upon certain assumptions about the likelihood of future events, and there can be no assurance that any design will succeed in achieving its stated goals under all potential future conditions; over time, a control may become inadequate because of changes in conditions, or the degree of compliance with policies or procedures may deteriorate. Because of the inherent limitations in a cost-effective control system, misstatements due to error or fraud may occur and not be detected.
As required by Exchange Act Rule 13a-15(b), we conducted an evaluation, under the supervision and with the participation of our management, including our CEO and CFO, of the effectiveness of the design and operation of our disclosure controls and procedures as of March 31, 2010. Based on the foregoing, our CEO and CFO concluded that our disclosure controls and procedures were effective at the reasonable assurance level.
Management’s Report on Internal Control Over Financial Reporting
Our management is responsible for establishing and maintaining adequate internal control over financial reporting, as such term is defined in Exchange Act Rule 13a-15(f). All internal control systems, no matter how well designed, have inherent limitations. Therefore, even those systems determined to be effective can provide only reasonable assurance with respect to financial statement preparation and presentation. Under the supervision and with the participation of our management, including our CEO and CFO, we conducted an evaluation of the effectiveness of our internal control over financial reporting using the criteria in Internal Control — Integrated Framework issued by the Committee of Sponsoring Organizations of the Treadway Commission. Based on our evaluation using the criteria in Internal Control — Integrated Framework, our management concluded that our internal control over financial reporting was effective as of March 31, 2010.
52
Table of Contents
The effectiveness of our internal control over financial reporting as of March 31, 2010 has been audited by an independent registered public accounting firm, as stated in its report, which is included herein.
Changes in Internal Control Over Financial Reporting
There was no change in our internal controls over financial reporting that occurred during the most recent quarter that has materially affected, or is reasonably likely to materially affect, our internal control over financial reporting.
| Item 9B. | Other Information. |
None.
PART III
| Item 10. | Directors, Executive Officers and Corporate Governance. |
(a) Executive Officers — See the section entitled “Executive Officers of the Registrant” in Part I, Item 1, Business, of this Annual Report.
(b) Directors — The information required by this Part III, Item 10 is contained in the section entitled “Election of Directors” in our Definitive Proxy Statement to be filed with the SEC in connection with the Annual Meeting of Stockholders to be held on August 17, 2010, which will be filed with the SEC within 120 days of March 31, 2010 (the “Proxy Statement”) and is incorporated herein by reference.
Additional information required by this Part III, Item 10 is incorporated by reference to the section entitled “Section 16(a) Beneficial Ownership Reporting Compliance” in the Proxy Statement and is incorporated herein by reference.
We have adopted a code of business conduct and ethics that all executive officers and management employees must review and abide by (including our principal executive officer, principal financial officer, principal accounting officer and controller, or persons performing similar functions), which we refer to as our Code of Business Conduct and Ethics. The Code of Business Conduct and Ethics is available free of charge on our website at www.appliedmicro.com in the Investor Relations section under the heading “Corporate Governance” under the “Governance Documents” heading. We will promptly disclose on our website (1) the nature of any amendment to the Code of Business Conduct and Ethics that applies to our principal executive officer, principal financial officer, principal accounting officer or controller, or persons performing similar functions, and (2) the nature of any waiver, including an implicit waiver, from a provision of the Code of Business Conduct and Ethics that is granted to one of these specified officers and the name of such person who is granted the waiver.
| Item 11. | Executive Compensation. |
The information required by this Part III, Item 11 is incorporated herein by reference from the section entitled “Executive Compensation” in the Proxy Statement.
| Item 12. | Security Ownership of Certain Beneficial Owners and Management and Related Stockholder Matters. |
The information required by this Part III, Item 12 is incorporated herein by reference from the sections entitled “Security Ownership of Management and Directors” and “Equity Compensation Plan Information” in the Proxy Statement.
53
Table of Contents
| Item 13. | Certain Relationships and Related Transactions, and Director Independence. |
The information required by this Part III, Item 13 is incorporated by reference to the sections entitled “Certain Transactions” and “Corporate Governance” in the Proxy Statement.
| Item 14. | Principal Accountant Fees and Services. |
The information required by this Part III, Item 14 is contained in the section entitled “Audit and Other Fees,” in the Proxy Statement and is incorporated herein by reference.
PART IV
| Item 15. | Exhibits and Financial Statement Schedules. |
(a) The following documents are filed as part of this Annual Report:
(1) Financial Statements
The financial statements of the Company are included herein as required under Part II, Item 8, Financial Statements and Supplementary Data, of this Annual Report. See Index to Financial Statements on page F-l.
(2) Financial Statement Schedule
For the three fiscal years ended March 31, 2010 — Schedule II Valuation and Qualifying Accounts
Schedules not listed above have been omitted because information required to be set forth therein is not applicable or is shown in the financial statements or notes thereto.
(3) Exhibits (numbered in accordance with Item 601 of Regulation S-K)
See Part IV, Item 15(b) below.
(b) The following exhibits are filed or incorporated by reference into this Annual Report:
| 2.1(12)+ |
Agreement and Plan of Merger between the Company, Espresso Acquisition Corporation and Veloce Technologies, Inc., dated May 17, 2009. | |
| 3.1(1) |
Amended and Restated Certificate of Incorporation of the Company. | |
| 3.2(2) |
Amended and Restated Bylaws of the Company. | |
| 3.3(17) |
Certificate of Amendment of Amended and Restated Certificate of Incorporation of the Company. | |
| 4.1(3) |
Specimen Stock Certificate. | |
| 10.1(3)* |
Form of Indemnification Agreement between the Company and each of its officers and directors. | |
| 10.2(16)* |
Form of Restricted Stock Unit Agreement under the 1992 Equity Incentive Plan. | |
| 10.3(16)* |
Form of Option Agreement under the 1992 Equity Incentive Plan. | |
| 10.4(16)* |
1992 Equity Incentive Plan. | |
| 10.5(11)* |
1997 Directors’ Stock Option Plan, as amended, and form of Option Agreement. | |
| 10.6(3)* |
401(k) Plan effective April 1, 1985 and form of Enrollment Agreement. | |
| 10.24(5)* |
1998 Employee Stock Purchase Plan and form of Subscription Agreement. | |
| 10.30(6) |
Lease of Engineering Building by and between Kilroy Realty, L.P. and the Company dated February 17, 1999. | |
54
Table of Contents
| 10.32(9) |
Amendment No. 1 to Lease of Engineering Building by and between Kilroy Realty, L.P. and the Company dated November 30, 1999. | |
| 10.33(4)* |
2000 Equity Incentive Plan, as amended, and form of Option Agreement. | |
| 10.34(16)* |
Form of Restricted Stock Unit Agreement under the 2000 Equity Incentive Plan. | |
| 10.35(7) |
Lease of Facilities in Andover, Massachusetts between 200 Minuteman Limited Partnership and Registrant dated September 13, 2000. | |
| 10.38(4)* |
AMCC Deferred Compensation Plan. | |
| 10.42(10)+ |
Patent License Agreement between the Company and IBM dated September 28, 2003. | |
| 10.43(10)+ |
Intellectual Property Agreement between the Company and IBM dated September 28, 2003. | |
| 10.53(14)* |
Offer of Employment dated September 14, 2005 by and between the Company and Robert Gargus. | |
| 10.58(15)* |
Executive Severance Benefit Plan dated September 19, 2007. | |
| 10.60(18)+ |
Qualcomm Patent Purchase Agreement dated July 11, 2008. | |
| 10.61(18)+ |
Qualcomm Patent Purchase Amendment dated July 11, 2008. | |
| 10.62(19) |
LSI Asset Purchase Agreement dated April 5, 2009 and Amendment No. 1 dated April 20, 2009. | |
| 10.63(13)+* |
Consulting Agreement with Cynthia J. Moreland entered into on October 21, 2009. | |
| 10.64(14)+* |
Letter Agreement with Cynthia J. Moreland entered into on December 18, 2009. | |
| 11.1(8) |
Computation of Per Share Data under ASC Topic 260-10. | |
| 21.1 |
Subsidiaries of the Registrant. | |
| 23.1 |
Consent of Independent Registered Public Accounting Firm – KPMG LLP. | |
| 23.2 |
Consent of Independent Registered Public Accounting Firm – Ernst & Young LLP. | |
| 24.1 |
Power of Attorney. Reference is made to the signature page of this Annual Report. | |
| 31.1 |
Certification of Chief Executive Officer pursuant to Rule 13a-14(a) and Rule 15d-14(a) of the Securities Exchange Act, as amended. | |
| 31.2 |
Certification of Chief Financial Officer pursuant to Rule 13a-14(a) and Rule 15d-14(a) of the Securities Exchange Act, as amended. | |
| 32.1 |
Certification of Chief Executive Officer pursuant to 18 U.S.C. 1350, as adopted pursuant to Section 906 of the Sarbanes-Oxley Act of 2002. | |
| 32.2 |
Certification of Chief Financial Officer pursuant to 18 U.S.C. 1350, as adopted pursuant to Section 906 of the Sarbanes-Oxley Act of 2002. | |
| * | Management contract or compensatory plan. |
| + | The Company has been granted confidential treatment for certain portions of these agreements and certain terms and conditions have been redacted from the exhibits. Omitted portions have been filed separately with the SEC. |
| (1) | Incorporated by reference to Exhibit 3.2 filed with the Company’s Registration Statement (No. 333-37609) filed October 10, 1997, and as amended by Exhibit 3.3 filed with the Company’s Registration Statement (No. 333-45660) filed September 12, 2000 and Exhibit 3.1 filed with the Company’s Current Report on Form 8-K filed on December 11, 2007. |
| (2) | Incorporated by reference to Exhibit 3.1 filed with the Company’s Current Report on Form 8-K filed on May 1, 2009. |
55
Table of Contents
| (3) | Incorporated by reference to identically numbered exhibit filed with the Company’s Registration Statement (No. 333-37609) filed October 10, 1997, or with any amendments thereto, which registration statement became effective November 24, 1997. |
| (4) | Incorporated by reference to identically numbered exhibit filed with the Company’s Quarterly Report on Form 10-Q (No. 000-23193) for the quarter ended June 30, 2002. |
| (5) | Incorporated by reference to identically numbered exhibit filed with the Company’s Annual Report on Form 10-K (No. 000-23193) for the year ended March 31, 2001. |
| (6) | Incorporated by reference to identically numbered exhibit filed with the Company’s Annual Report on Form 10-K (No. 000-23193) for the year ended March 31, 1999. |
| (7) | Incorporated by reference to identically numbered exhibit filed with the Company’s Quarterly Report on Form 10-Q (No. 000-23193) for the quarter ended September 30, 2000. |
| (8) | The Computation of Per Share Data under ASC Topic 260-10 is included in the Notes to the Consolidated Financial Statements included in this Annual Report. |
| (9) | Incorporated by reference to identically numbered exhibit filed with the Company’s Annual Report on Form 10-K (No. 000-23193) for the year ended March 31, 2000. |
| (10) | Incorporated by reference to identically numbered exhibit filed with the Company’s Quarterly Report on Form 10-Q (No. 000-23193) for the quarter ended September 30, 2003. |
| (11) | Effective March 31, 2005, our Board of Directors terminated our 1997 Directors’ Stock Option Plan (the “Directors Plan”). The Directors Plan provided for the automatic grant of stock options to our non-employee directors upon initial election to the Board of Directors and annually thereafter. The termination of the Directors Plan will not affect any stock options previously granted pursuant to the Directors Plan. |
| (12) | Incorporated by reference to identically numbered exhibit filed with the Company’s Quarterly Report on Form 10-Q/A for the quarter ended June 30, 2009. Schedules have been omitted pursuant to Item 601(b)(2) of Regulation S-K. The Company has furnished supplementally to the SEC copies of each of the omitted schedules. |
| (13) | Incorporated by reference as Exhibit 10.1 filed with the Company’s Quarterly Report on Form 10-Q for the quarter ended December 31, 2009. |
| (14) | Incorporated by reference as Exhibit 10.2 filed with the Company’s Quarterly Report on Form 10-Q for the quarter ended December 31, 2009. |
| (15) | Incorporated by reference to Exhibit 99.1 filed with the Company’s Current Report on Form 8-K filed September 24, 2007 |
| (16) | Incorporated by reference to identically numbered exhibit filed with the Company’s Annual Report on Form 10-K for the year ended March 31, 2007. |
| (17) | Incorporated by reference to Exhibit 3.1 filed with the Company’s Current Report on Form 8-K filed on December 11, 2007. |
| (18) | Incorporated by reference to identically numbered exhibit filed with the Company’s Quarterly Report on Form 10-Q for the quarter ended September 30, 2008. |
| (19) | Incorporated by reference to identically numbered exhibit filed with the Company’s Annual Report on Form 10-K for the year ended March 31, 2009. |
56
Table of Contents
Pursuant to the requirements of Section 13 or 15(d) of the Securities Exchange Act of 1934, as amended, the registrant has duly caused this report to be signed on its behalf by the undersigned, thereunto duly authorized.
| APPLIED MICRO CIRCUITS CORPORATION | ||
| By: | /s/ DR. PARAMESH GOPI | |
| Dr. Paramesh Gopi | ||
| President and Chief Executive Officer | ||
Date: May 11, 2010
POWER OF ATTORNEY
KNOW ALL PERSONS BY THESE PRESENTS, that each person whose signature appears below constitutes and appoints Dr. Paramesh Gopi and Robert G. Gargus, jointly and severally, his attorneys-in-fact, each with the power of substitution, for him or her in any and all capacities, to sign any amendments to this Annual Report on Form 10-K, and to file the same, with exhibits thereto and other documents in connection therewith with the Securities and Exchange Commission, hereby ratifying and confirming all that each of said attorneys-in-fact, or his substitute or substitutes, may do or cause to be done by virtue hereof.
Pursuant to the requirements of the Securities Exchange Act of 1934, this report has been signed below by the following persons on behalf of the registrant and in the capacities and on the dates indicated.
| Signature |
Title |
Date | ||||
| /s/ DR. PARAMESH GOPI Dr. Paramesh Gopi |
Chief Executive Officer, President and Director (Principal Executive Officer) |
May 11, 2010 | ||||
| /s/ ROBERT G. GARGUS Robert G. Gargus |
Senior Vice President and Chief Financial Officer (Principal Financial and Accounting Officer) |
May 11, 2010 | ||||
| /s/ CESAR CESARATTO Cesar Cesaratto |
Chairman of the Board | May 11, 2010 | ||||
| /s/ DONALD COLVIN Donald Colvin |
Director | May 11, 2010 | ||||
| /s/ DR. PAUL GRAY Dr. Paul Gray |
Director | May 11, 2010 | ||||
| /s/ FRED SHLAPAK Fred Shlapak |
Director | May 11, 2010 | ||||
| /s/ ARTHUR B. STABENOW Arthur B. Stabenow |
Director | May 11, 2010 | ||||
| /s/ DR. JULIE H. SULLIVAN Dr. Julie H. Sullivan |
Director | May 11, 2010 | ||||
57
Table of Contents
F-1
Table of Contents
Report of Independent Registered Public Accounting Firm
The Board of Directors and Stockholders
Applied Micro Circuits Corporation:
We have audited the accompanying consolidated balance sheet of Applied Micro Circuits Corporation and subsidiaries (the Company) as of March 31, 2010, and the related consolidated statements of operations, stockholders’ equity, and cash flows for the year then ended. In connection with our audit of the consolidated financial statements, we also have audited financial statement schedule II as set forth under Item 15 for the year ended March 31, 2010. We also have audited the Company’s internal control over financial reporting as of March 31, 2010, based on criteria established in Internal Control — Integrated Framework issued by the Committee of Sponsoring Organizations of the Treadway Commission (COSO). The Company’s management is responsible for these consolidated financial statements and financial statement schedule, for maintaining effective internal control over financial reporting, and for its assessment of the effectiveness of internal control over financial reporting, included in the accompanying Management’s Report on Internal Control over Financial Reporting appearing under Item 9A. Our responsibility is to express an opinion on these consolidated financial statements and financial statement schedule and an opinion on the Company’s internal control over financial reporting based on our audit.
We conducted our audit in accordance with the standards of the Public Company Accounting Oversight Board (United States). Those standards require that we plan and perform the audit to obtain reasonable assurance about whether the financial statements are free of material misstatement and whether effective internal control over financial reporting was maintained in all material respects. Our audit of the consolidated financial statements included examining, on a test basis, evidence supporting the amounts and disclosures in the financial statements, assessing the accounting principles used and significant estimates made by management, and evaluating the overall financial statement presentation. Our audit of internal control over financial reporting included obtaining an understanding of internal control over financial reporting, assessing the risk that a material weakness exists, and testing and evaluating the design and operating effectiveness of internal control based on the assessed risk. Our audit also included performing such other procedures as we considered necessary in the circumstances. We believe that our audit provides a reasonable basis for our opinions.
A company’s internal control over financial reporting is a process designed to provide reasonable assurance regarding the reliability of financial reporting and the preparation of financial statements for external purposes in accordance with generally accepted accounting principles. A company’s internal control over financial reporting includes those policies and procedures that (1) pertain to the maintenance of records that, in reasonable detail, accurately and fairly reflect the transactions and dispositions of the assets of the company; (2) provide reasonable assurance that transactions are recorded as necessary to permit preparation of financial statements in accordance with generally accepted accounting principles, and that receipts and expenditures of the company are being made only in accordance with authorizations of management and directors of the company; and (3) provide reasonable assurance regarding prevention or timely detection of unauthorized acquisition, use, or disposition of the company’s assets that could have a material effect on the financial statements.
Because of its inherent limitations, internal control over financial reporting may not prevent or detect misstatements. Also, projections of any evaluation of effectiveness to future periods are subject to the risk that controls may become inadequate because of changes in conditions, or that the degree of compliance with the policies or procedures may deteriorate.
In our opinion, the consolidated financial statements referred to above present fairly, in all material respects, the financial position of Applied Micro Circuits Corporation and subsidiaries as of March 31, 2010, and the results of their operations and their cash flows for the year then ended, in conformity with U.S. generally accepted accounting principles. Also in our opinion, the related financial statement schedule for the year ended March 31, 2010, when considered in relation to the basic consolidated financial statements taken as a whole, presents fairly, in all material respects, the information set forth therein. Also in our opinion, the Company maintained, in all material respects, effective internal control over financial reporting as of March 31, 2010, based on criteria established in Internal Control — Integrated Framework issued by the Committee of Sponsoring Organizations of the Treadway Commission.
As discussed in Note 2 to the consolidated financial statements, the Company changed its method of evaluating other-than-temporary impairment for debt securities during the year ended March 31, 2010, resulting from the adoption of a new accounting pronouncement.
/s/ KPMG LLP
Mountain View, California
May 11, 2010
F-2
Table of Contents
REPORT OF INDEPENDENT REGISTERED PUBLIC ACCOUNTING FIRM
The Board of Directors and Stockholders
Applied Micro Circuits Corporation
We have audited the accompanying consolidated balance sheets of Applied Micro Circuits Corporation as of March 31, 2009 and the related consolidated statements of operations, stockholders’ equity, and cash flows for each of the two years in the period ended March 31, 2009. Our audits also included the financial statement schedule listed in the Index at Part IV at Item 15(a). These financial statements and schedule are the responsibility of Applied Micro Circuits Corporation’s management. Our responsibility is to express an opinion on these financial statements and schedule based on our audits.
We conducted our audits in accordance with the standards of the Public Company Accounting Oversight Board (United States). Those standards require that we plan and perform the audit to obtain reasonable assurance about whether the financial statements are free of material misstatement. An audit includes examining, on a test basis, evidence supporting the amounts and disclosures in the financial statements. An audit also includes assessing the accounting principles used and significant estimates made by management, as well as evaluating the overall financial statement presentation. We believe that our audits provide a reasonable basis for our opinion.
In our opinion, the financial statements referred to above present fairly, in all material respects, the consolidated financial position of Applied Micro Circuits Corporation at March 31, 2009 and the consolidated results of its operations and its cash flows for each of the two years in the period ended March 31, 2009, in conformity with U.S. generally accepted accounting principles. Also, in our opinion, the related financial statement schedule, when considered in relation to the basic financial statements taken as a whole, presents fairly in all material respects the information set forth therein.
/s/ Ernst & Young LLP
San Jose, California
May 8, 2009
F-3
Table of Contents
APPLIED MICRO CIRCUITS CORPORATION
| March 31, | ||||||||
| 2010 | 2009 | |||||||
| (In thousands, except par value) | ||||||||
| ASSETS |
||||||||
| Current assets: |
||||||||
| Cash and cash equivalents |
$ | 122,526 | $ | 99,337 | ||||
| Short-term investments-available-for-sale |
84,117 | 84,672 | ||||||
| Accounts receivable, net |
22,892 | 17,537 | ||||||
| Inventories |
15,387 | 26,598 | ||||||
| Other current assets |
18,098 | 11,334 | ||||||
| Assets of discontinued operations |
— | 8,558 | ||||||
| Total current assets |
263,020 | 248,036 | ||||||
| Property and equipment, net |
25,879 | 25,749 | ||||||
| Purchased intangibles, net |
16,850 | 32,965 | ||||||
| Other assets |
10,295 | 17,860 | ||||||
| Total assets |
$ | 316,044 | $ | 324,610 | ||||
| LIABILITIES AND STOCKHOLDERS’ EQUITY |
||||||||
| Current liabilities: |
||||||||
| Accounts payable |
$ | 20,074 | $ | 16,715 | ||||
| Accrued payroll and related expenses |
4,682 | 5,875 | ||||||
| Other accrued liabilities |
9,606 | 15,466 | ||||||
| Deferred revenue |
808 | 2,584 | ||||||
| Total current liabilities |
35,170 | 40,640 | ||||||
| Commitments and contingencies (Notes 7 and 10) |
||||||||
| Stockholders’ equity: |
||||||||
| Preferred stock, $0.01 par value: |
||||||||
| Authorized shares — 2,000, none issued and outstanding |
— | — | ||||||
| Common stock, $0.01 par value: |
||||||||
| Authorized shares — 375,000 at March 31, 2010 and 2009 |
||||||||
| Issued and outstanding shares — 65,404 at March 31, 2010 and 65,874 at March 31, 2009 |
654 | 659 | ||||||
| Additional paid-in capital |
5,905,050 | 5,910,493 | ||||||
| Accumulated other comprehensive income (loss) |
2,430 | (6,273 | ) | |||||
| Accumulated deficit |
(5,627,260 | ) | (5,620,909 | ) | ||||
| Total stockholders’ equity |
280,874 | 283,970 | ||||||
| Total liabilities and stockholders’ equity |
$ | 316,044 | $ | 324,610 | ||||
See Accompanying Notes to Consolidated Financial Statements
F-4
Table of Contents
APPLIED MICRO CIRCUITS CORPORATION
CONSOLIDATED STATEMENTS OF OPERATIONS
| Fiscal Years Ended March 31, | ||||||||||||
| 2010 | 2009 | 2008 | ||||||||||
| (In thousands, except per share data) | ||||||||||||
| Net revenues |
$ | 205,598 | $ | 214,216 | $ | 194,115 | ||||||
| Cost of revenues |
92,931 | 101,070 | 98,756 | |||||||||
| Gross profit |
112,667 | 113,146 | 95,359 | |||||||||
| Operating expenses: |
||||||||||||
| Research and development |
88,096 | 84,687 | 86,117 | |||||||||
| Selling, general and administrative |
45,901 | 50,097 | 52,037 | |||||||||
| Amortization of purchased intangible assets |
4,020 | 4,020 | 4,061 | |||||||||
| Restructuring charges, net |
746 | 8,623 | 2,958 | |||||||||
| Option investigation, net |
— | 80 | 1,072 | |||||||||
| Goodwill impairment charges |
— | 222,972 | — | |||||||||
| Litigation settlement, net |
— | 130 | 1,125 | |||||||||
| Total operating expenses |
138,763 | 370,609 | 147,370 | |||||||||
| Operating loss |
(26,096 | ) | (257,463 | ) | (52,011 | ) | ||||||
| Interest (expense) income, net and other-than-temporary impairment |
3,440 | (8,073 | ) | 8,635 | ||||||||
| Other income (expense), net |
(1,551 | ) | 492 | 1,944 | ||||||||
| Loss from continuing operations before income taxes |
(24,207 | ) | (265,044 | ) | (41,432 | ) | ||||||
| Income tax (benefit) expense |
(10,610 | ) | (3,946 | ) | 3,773 | |||||||
| Loss from continuing operations |
(13,597 | ) | (261,098 | ) | (45,205 | ) | ||||||
| Income (loss) from discontinued operations, net of taxes |
6,112 | (48,235 | ) | (69,916 | ) | |||||||
| Net loss |
$ | (7,485 | ) | $ | (309,333 | ) | $ | (115,121 | ) | |||
| Basic and diluted net income (loss) per share: |
||||||||||||
| Net loss per share from continuing operations |
$ | (0.21 | ) | $ | (4.00 | ) | $ | (0.67 | ) | |||
| Net income (loss) per share from discontinued operations |
0.10 | (0.74 | ) | (1.03 | ) | |||||||
| Net loss per share |
$ | (0.11 | ) | $ | (4.74 | ) | $ | (1.70 | ) | |||
| Shares used in calculating basic and diluted net income (loss) per share |
66,006 | 65,271 | 67,775 | |||||||||
See Accompanying Notes to Consolidated Financial Statements
F-5
Table of Contents
APPLIED MICRO CIRCUITS CORPORATION
CONSOLIDATED STATEMENTS OF CASH FLOWS
| Fiscal Years Ended March 31, | ||||||||||||
| 2010 | 2009 | 2008 | ||||||||||
| (In thousands) | ||||||||||||
| Operating activities: |
||||||||||||
| Net loss |
$ | (7,485 | ) | $ | (309,333 | ) | $ | (115,121 | ) | |||
| Adjustments to reconcile net loss to net cash provided by (used for) operating activities |
||||||||||||
| Depreciation |
6,778 | 6,862 | 6,542 | |||||||||
| Amortization of purchased intangibles |
16,117 | 23,060 | 23,762 | |||||||||
| Goodwill impairment charges |
— | 264,130 | 71,494 | |||||||||
| Stock-based compensation expense: |
||||||||||||
| Stock options |
4,125 | 5,139 | 9,350 | |||||||||
| Restricted stock units |
9,557 | 5,245 | 1,957 | |||||||||
| Non-cash restructuring charges |
359 | 1,989 | 316 | |||||||||
| Litigation settlement |
— | 130 | 1,125 | |||||||||
| Realized gain on sale of strategic investment |
— | — | (4,649 | ) | ||||||||
| Impairment of strategic investment |
2,000 | — | 3,000 | |||||||||
| Impairment of short term investments and marketable securities |
4,287 | 17,144 | 1,682 | |||||||||
| Tax benefit from other comprehensive income |
(6,204 | ) | — | — | ||||||||
| Net loss on disposals of property |
145 | 48 | 23 | |||||||||
| Net gain on sale of storage business unit |
(11,366 | ) | — | — | ||||||||
| Changes in operating assets and liabilities: |
||||||||||||
| Accounts receivable |
(5,355 | ) | 11,263 | 3,758 | ||||||||
| Inventories |
10,754 | 3,414 | (6,680 | ) | ||||||||
| Other assets |
(237 | ) | (4,939 | ) | 2,282 | |||||||
| Accounts payable |
2,245 | (8,803 | ) | (1,375 | ) | |||||||
| Accrued payroll and other accrued liabilities |
(7,077 | ) | 467 | (7,103 | ) | |||||||
| Deferred tax liability |
— | (3,957 | ) | 3,957 | ||||||||
| Deferred revenue |
(1,776 | ) | 668 | (476 | ) | |||||||
| Net cash provided by (used for) operating activities |
16,867 | 12,527 | (6,156 | ) | ||||||||
| Investing activities: |
||||||||||||
| Proceeds from sales and maturities of short-term investments |
185,724 | 199,577 | 257,508 | |||||||||
| Purchases of short-term investments |
(173,265 | ) | (150,358 | ) | (184,026 | ) | ||||||
| Purchase of property, equipment and other assets |
(7,532 | ) | (7,259 | ) | (7,021 | ) | ||||||
| Proceeds from the sale of strategic equity investments |
— | — | 5,249 | |||||||||
| Purchase of strategic investment |
(1,000 | ) | — | (5,000 | ) | |||||||
| Proceeds from sale of storage business unit |
21,527 | — | — | |||||||||
| Proceeds from sale of property, equipment and other assets |
— | — | 1,646 | |||||||||
| Net cash paid for acquisitions |
— | — | 232 | |||||||||
| Net cash provided by (used for) investing activities |
25,454 | 41,960 | 68,588 | |||||||||
| Financing activities: |
||||||||||||
| Proceeds from issuance of common stock |
2,955 | 2,448 | 6,431 | |||||||||
| Repurchase of common stock |
(8,076 | ) | — | (56,950 | ) | |||||||
| Funding of structured stock repurchase agreements |
(41,797 | ) | — | (41,830 | ) | |||||||
| Funds received from structured stock repurchase agreements including gains |
27,751 | — | 21,112 | |||||||||
| Other |
35 | (287 | ) | (101 | ) | |||||||
| Net cash provided by (used for) financing activities |
(19,132 | ) | 2,161 | (71,338 | ) | |||||||
| Net increase (decrease) in cash and cash equivalents |
23,189 | 56,648 | (8,906 | ) | ||||||||
| Cash and cash equivalents at beginning of year |
99,337 | 42,689 | 51,595 | |||||||||
| Cash and cash equivalents at end of year |
$ | 122,526 | $ | 99,337 | $ | 42,689 | ||||||
| Supplementary cash flow disclosure: |
||||||||||||
| Cash paid for: |
||||||||||||
| Interest |
$ | — | $ | 4 | $ | 17 | ||||||
| Income taxes |
48 | 1,078 | 656 | |||||||||
See Accompanying Notes to Consolidated Financial Statements
F-6
Table of Contents
APPLIED MICRO CIRCUITS CORPORATION
CONSOLIDATED STATEMENTS OF STOCKHOLDERS’ EQUITY
| Common Stock | Additional Paid in Capital |
Deferred Compensation |
Accumulated Other Comprehensive Income (Loss) |
Accumulated Deficit |
Total Stockholders’ Equity |
|||||||||||||||||||||
| Shares | Amount | |||||||||||||||||||||||||
| (In thousands) | ||||||||||||||||||||||||||
| Balance, March 31, 2007 |
70,743 | 709 | 5,956,344 | — | 224 | (5,196,455 | ) | 760,822 | ||||||||||||||||||
| Issuance of common stock |
1,043 | 10 | 6,421 | — | — | — | 6,431 | |||||||||||||||||||
| Repurchase of common stock |
(4,950 | ) | (50 | ) | (56,900 | ) | — | — | — | (56,950 | ) | |||||||||||||||
| Funding of structured stock repurchase agreements |
(2,057 | ) | (21 | ) | (41,809 | ) | — | — | — | (41,830 | ) | |||||||||||||||
| Funds received from structured stock repurchases agreements including gains |
— | — | 21,112 | — | — | — | 21,112 | |||||||||||||||||||
| Stock-based compensation expense |
— | — | 11,448 | — | — | — | 11,448 | |||||||||||||||||||
| Comprehensive loss: |
||||||||||||||||||||||||||
| Net loss |
— | — | — | — | — | (115,121 | ) | (115,121 | ) | |||||||||||||||||
| Foreign currency translation loss |
— | — | — | — | (202 | ) | — | (202 | ) | |||||||||||||||||
| Unrealized loss on short-term investments, net of tax |
— | — | — | — | (4,998 | ) | — | (4,998 | ) | |||||||||||||||||
| Total comprehensive loss |
— | — | — | — | — | — | (120,321 | ) | ||||||||||||||||||
| Balance, March 31, 2008 |
64,779 | $ | 648 | $ | 5,896,616 | $ | — | $ | (4,976 | ) | $ | (5,311,576 | ) | $ | 580,712 | |||||||||||
| Issuance of common stock |
1,095 | 11 | 2,437 | — | — | — | 2,448 | |||||||||||||||||||
| Stock-based compensation expense (including discontinued operations) |
— | — | 11,440 | — | — | — | 11,440 | |||||||||||||||||||
| Comprehensive loss: |
||||||||||||||||||||||||||
| Net loss |
— | — | — | — | — | (309,333 | ) | (309,333 | ) | |||||||||||||||||
| Foreign currency translation loss |
— | — | — | — | (240 | ) | — | (240 | ) | |||||||||||||||||
| Unrealized loss on short-term investments, net of tax |
— | — | — | — | (1,057 | ) | — | (1,057 | ) | |||||||||||||||||
| Total comprehensive loss |
— | — | — | — | — | — | (310,630 | ) | ||||||||||||||||||
| Balance, March 31, 2009 |
65,874 | $ | 659 | $ | 5,910,493 | $ | — | $ | (6,273 | ) | $ | (5,620,909 | ) | $ | 283,970 | |||||||||||
| Issuance of common stock |
1,291 | 13 | 2,942 | — | — | — | 2,955 | |||||||||||||||||||
| Repurchase of common stock |
(1,072 | ) | (11 | ) | (8,065 | ) | — | — | — | (8,076 | ) | |||||||||||||||
| Funding of structured stock repurchase agreements |
(689 | ) | (7 | ) | (41,790 | ) | — | — | — | (41,797 | ) | |||||||||||||||
| Funds received from structured stock repurchases agreements including gains |
— | — | 27,751 | — | — | — | 27,751 | |||||||||||||||||||
| Stock-based compensation expense |
— | — | 13,719 | — | — | — | 13,719 | |||||||||||||||||||
| FAS 115-2 implementation |
— | — | — | — | (1,134 | ) | 1,134 | — | ||||||||||||||||||
| FAS 115-2 disposition release |
— | — | — | — | 140 | — | 140 | |||||||||||||||||||
| Comprehensive income (loss): |
||||||||||||||||||||||||||
| Net loss |
— | — | — | — | — | (7,485 | ) | (7,485 | ) | |||||||||||||||||
| Foreign currency translation loss |
— | — | — | — | (148 | ) | — | (148 | ) | |||||||||||||||||
| Unrealized gain on short-term investments, net of tax |
— | — | — | — | 9,845 | — | 9,845 | |||||||||||||||||||
| Total comprehensive income |
— | — | — | — | — | — | 2,212 | |||||||||||||||||||
| Balance, March 31, 2010 |
65,404 | $ | 654 | $ | 5,905,050 | $ | — | $ | 2,430 | $ | (5,627,260 | ) | $ | 280,874 | ||||||||||||
See Accompanying Notes to Consolidated Financial Statements
F-7
Table of Contents
APPLIED MICRO CIRCUITS CORPORATION
NOTES TO CONSOLIDATED FINANCIAL STATEMENTS
1. Summary of Significant Accounting Policies
Business
Applied Micro Circuits Corporation (“AMCC”, “APM”, “AppliedMicro” or the “Company”) is a leader in semiconductor solutions for the enterprise, telecom and consumer/small medium business (“SMB”) markets. The Company designs, develops, markets and supports high-performance low power integrated circuits (“ICs”), which are essential for the processing, transporting and storing of information worldwide. In the telecom and enterprise markets, the Company utilizes a combination of design expertise coupled with system-level knowledge and multiple technologies to offer IC products for wireline and wireless communications equipment such as wireless access points, wireless base stations, multi-function printers, enterprise and edge switches, blade servers, storage systems, gateways, core switches, routers, metro, long-haul, and ultra-long-haul transport platforms. In the consumer/SMB markets, the Company combines optimized software and system-level expertise with highly integrated semiconductors to deliver comprehensive reference designs and stand-alone semiconductor solutions for wireline and wireless communications equipment such as wireless access points, network attached storage, and residential and smart energy gateways. The Company’s corporate headquarters are located in Sunnyvale, California. Sales and engineering offices are located throughout the world.
Basis of Presentation
The consolidated financial statements include all the accounts of AppliedMicro, its wholly-owned subsidiaries and entities which are variable interest entities (“VIE”) of which the Company is the primary beneficiary. A VIE is required to be consolidated by its primary beneficiary. The primary beneficiary is the party that absorbs a majority of the VIE’s anticipated losses and/or a majority of the expected returns. The Company has evaluated its strategic alliances for potential classification as variable interest entities by evaluating the sufficiency of each entity’s equity investment at risk to absorb losses and the Company’s share of the respective expected losses. The Company determined that it is the primary beneficiary of one variable interest entity and has included the accounts of this entity in the consolidated financial statements (see Note 12). All significant intercompany balances and transactions have been eliminated in consolidation.
Certain amounts in the consolidated financial statements have been reclassified to conform to the current year presentation. As described in Note 11, the Company has classified the financial results of its 3ware storage adapter business as discontinued operations for all periods presented due to the sale of its 3ware storage adapter business to LSI Corporation on April 21, 2009. The assets sold to LSI Corporation are classified as assets of discontinued operations on the balance sheet. These notes to the Company’s consolidated financial statements relate to continuing operations only, unless otherwise indicated. In addition, the executive deferred compensation investments have been reclassified from Other Assets to Other Current Assets and proceeds from sales and maturities and purchases of short-term investments have been adjusted to exclude activity from cash equivalents.
Use of Estimates
The preparation of financial statements in accordance with U.S. generally accepted accounting principles requires management to make estimates and assumptions that affect the reported amounts of assets and liabilities at the date of the financial statements and the reported amounts of net revenue and expenses in the reporting period. The Company regularly evaluates estimates and assumptions related to inventory valuation, warranty liabilities and revenue reserves, which affects its revenues, cost of sales and gross margin; allowance for doubtful accounts, which affects its operating expenses; the unrealized losses or other-than-temporary impairments of its short-term marketable securities, which affects its interest income (expense), net; the valuation of purchased intangibles, which affects its amortization and impairments of purchased intangibles; the valuation of
restructuring liabilities, which affects the amount and timing of restructuring charges; the potential costs
F-8
Table of Contents
APPLIED MICRO CIRCUITS CORPORATION
NOTES TO CONSOLIDATED FINANCIAL STATEMENTS—(Continued)
of litigation, which affects its operating expenses; the valuation of deferred income taxes, which affects its income tax expense (benefit); and stock-based compensation, which affects its gross margin and operating expenses. The Company bases its estimates and assumptions on historical experience and on various other factors that it believes to be reasonable under the circumstances, the results of which form the basis for making judgments about the carrying values of assets and liabilities that are not readily apparent from other sources. The actual results experienced by the Company may differ materially and adversely from management’s estimates. To the extent there are material differences between the estimates and the actual results, future results of operations will be affected.
Revenue Recognition
The Company recognizes revenue based on four basic criteria: 1) there is evidence that an arrangement exists; 2) delivery has occurred; 3) the fee is fixed or determinable; and 4) collectability is reasonably assured. The Company recognizes revenue upon determination that all criteria for revenue recognition have been met. In addition, the Company do not recognize revenue until the applicable customer’s acceptance criteria have been met. The criteria are usually met at the time of product shipment, except for shipments to distributors with rights of return. The portion of revenue from shipments to distributors subject to rights of return is deferred until the agreed upon percentage of return or cancellation privileges lapse. Revenue from shipments to distributors without return rights is recognized upon shipment. In addition, the Company records reductions to revenue for estimated allowances such as returns not pursuant to contractual rights, competitive pricing programs and rebates. These estimates are based on its experience with product returns and the contractual terms of the competitive pricing and rebate programs. Shipping terms are generally FCA (Free Carrier) shipping point. If actual returns or pricing adjustments exceed its estimates, the Company would record additional reductions to revenue.
From time to time the Company generates revenue from the sale of its internally developed intellectual property (“IP”). The Company generally recognizes revenue from the sale of IP when all basic criteria outlined above are met.
Cash and Cash Equivalents
The Company considers all highly liquid investments with an original maturity from the date of purchase of 90 days or less to be cash equivalents.
Investments
The Company holds a variety of securities that have varied underlying investments. The Company reviews its investment portfolio periodically to assess for other-than-temporary impairment. The Company assesses the existence of impairment of its investments in order to determine the classification of the impairment as “temporary” or “other-than-temporary”. The factors used to determine whether an impairment is temporary or other-than-temporary involve considerable judgment. The recent economic climate and volatile financial markets have created an environment in which it is difficult to make accurate estimates and assumptions on which the Company bases its judgments. The factors the Company considers in determining whether any individual impairment is temporary or other-than-temporary are primarily the length of the time and the extent to which the market value has been less than amortized cost, the nature of underlying assets (including the degree of collateralization), the financial condition, credit rating, market liquidity conditions and near-term prospects of the issuer. If the fair value of a debt security is less than its amortized cost basis at the balance sheet date, an assessment would have to be made as to whether the impairment is other-than-temporary. If the Company
F-9
Table of Contents
APPLIED MICRO CIRCUITS CORPORATION
NOTES TO CONSOLIDATED FINANCIAL STATEMENTS—(Continued)
decides to sell the security, an other-than-temporary impairment shall be considered to have occurred. However, if the Company does not intend to sell the debt security, it shall consider available evidence to assess whether it is more likely than not will be required to sell the security before the recovery of its amortized cost basis due to cash, working capital requirements, contractual or regulatory obligations indicate that the security will be required to be sold before a forecasted recovery occurs. If more likely than not, the Company is required to sell the security before recovery of its amortized cost basis, an other-than-temporary impairment is considered to have occurred. If the Company does not expect to recover the entire amortized cost basis of the security, it would not be able to assert that it will recover its amortized cost basis even if the Company does not intend to sell the security. Therefore, in those situations, an other-than-temporary impairment shall be considered to have occurred. Use of present value cash flow models to determine whether the entire amortized cost basis of the security will be recovered is expected. The Company will compare the present value of cash flows expected to be collected from the security with the amortized cost basis of the security. An other-than-temporary impairment is said to have occurred if the present value of cash flows expected to be collected is less than the amortized cost basis of the security. In the fiscal year ended March 31, 2010, the Company recorded other-than-temporary impairment charges of $4.1 million to current earnings. For the fiscal year ended March 31, 2010, the Company did not record an impairment charge in connection with other securities in a continuous loss position (fair value less than carrying value) with unrealized losses of $0.2 million as it believes that such unrealized losses are temporary. As of March 31, 2010, the Company also had $9.0 million in unrealized gains, which includes the remaining cumulative implementation adjustment of $1.0 million for prior other-than-temporary impairment charges that were determined to be non-credit related. For the fiscal years ended March 31, 2009 and 2008, the Company recorded other-than-temporary impairment charges of $17.1 million and $1.7 million, respectively, to current earnings.
Strategic Equity Investments
The Company enters into certain equity investments for the promotion of business and strategic objectives. These investments in equity securities of privately held businesses are accounted for under the cost method. Under the cost method, strategic investments in which the Company holds less than a 20% voting interest and on which the Company does not have the ability to exercise significant influence are carried at the lower of cost or cost reduced by other-than-temporary impairments, as appropriate. These investments are included in other assets on the Company’s condensed consolidated balance sheets. These investments are valued using the cost basis-historical cost less any recognized impairments based on the specific identification method. The Company’s policy requires that these investments are periodically reviewed for impairments that are judged to be other-than-temporary. If the Company determines that the investment is impaired, the Company records losses through a charge to earnings which permanently reduces the cost basis of the investments. These losses are included in other income (expense), net on the consolidated statements of operations. During the fiscal year ended March 31, 2010, the Company recorded a loss from the write-down of a strategic investment of $2.0 million that management judged to be other-than-temporarily impaired. During the fiscal year ended March 31, 2008, the Company recorded a loss from the write-down of a strategic investment of $3.0 million that management judged to be other-than-temporarily impaired, and also recorded a gain upon the sale of certain other strategic investment of $4.6 million. No other-than-temporary impairments were recorded for strategic equity investments during the fiscal year ended March 31, 2009. Following the end of the year, an entity where the Company had an equity investment was acquired, and the Company recovered its investment of $5.4 million, with no gain or loss.
Fair Value of Financial Instruments
Beginning April 1, 2008, short term investments are recorded at fair value in the Company’s consolidated balance sheets and are categorized based upon the level of judgment associated with inputs used to measure their
F-10
Table of Contents
APPLIED MICRO CIRCUITS CORPORATION
NOTES TO CONSOLIDATED FINANCIAL STATEMENTS—(Continued)
fair value. In April 2009, the FASB provided additional guidance in determining fair value when the volume and level of activity for the asset or liability have significantly decreased and on identifying transactions that are not orderly for making fair value measurements more consistent and provided guidance in determining whether a market is active or inactive, and whether a transaction is distressed. ASC Subtopic 820-10 defines a three-level valuation hierarchy for disclosure of fair value measurements. The Company classifies inputs to derive fair values for short term investments as Level 1 and 2. Instruments classified as Level 1 include highly liquid government and agency securities, money market funds and publicly traded equity securities in active markets. Instruments classified as Level 2 include corporate notes, asset-backed securities, commercial paper, preferred stock and closed-end bond funds.
Concentration of Credit Risk
Financial instruments, which potentially subject the Company to concentrations of credit risk, consist principally of available-for-sale securities and trade receivables. The Company believes that the credit risk in its trade receivables is mitigated by the Company’s credit evaluation process, relatively short collection terms and dispersion of its customer base. The Company generally does not require collateral and losses on trade receivables have historically been within management’s expectations.
The Company invests its excess cash in debt instruments of the U.S. Treasury, corporate bonds, mortgage-backed securities, asset-backed securities, preferred stocks, and closed-end bond funds primarily with investment grade credit ratings. The Company has established guidelines relative to diversification and maturities that attempt to maintain safety, yield and liquidity. These guidelines are periodically reviewed and modified to take advantage of trends in yields and interest rates.
Inventories
The Company’s policy is to value inventories at the lower of cost or market on a part-by-part basis. This policy requires the Company to make estimates regarding the market value of its inventories, including an assessment of excess or obsolete inventories. The Company determines excess and obsolete inventories based on an estimate of the future demand for its products within a specified time horizon, generally 12 months. The estimates the Company uses for future demand are also used for near-term capacity planning and inventory purchasing and are consistent with our revenue forecasts. If the Company’s demand forecast is greater than its actual demand the Company may be required to take additional excess inventory charges, which would decrease gross margin and net operating results.
Warranty Reserves
The Company’s products typically carry a one year warranty. The Company establishes reserves for estimated product warranty costs at the time revenue is recognized. Although the Company engages in extensive product quality programs and processes, its warranty obligation is affected by product failure rates, use of materials and service delivery costs incurred in correcting any product failure. Should actual product failure rates, use of materials or service delivery costs differ from the Company’s estimates, additional warranty reserves could be required, which could reduce its gross margin.
F-11
Table of Contents
APPLIED MICRO CIRCUITS CORPORATION
NOTES TO CONSOLIDATED FINANCIAL STATEMENTS—(Continued)
The following table summarizes warranty reserve activity (in thousands):
| Year Ended March 31, | ||||||||
| 2010 | 2009 | |||||||
| Beginning balance |
$ | 1,285 | $ | 1,475 | ||||
| Charged to (reductions in) costs of revenues* |
(766 | ) | 268 | |||||
| Charges incurred |
(350 | ) | (458 | ) | ||||
| Ending balance |
$ | 169 | $ | 1,285 | ||||
| * | The amounts in the year ended March 31, 2010 include a $0.8 million reduction in warranty reserve related to the sale of our 3ware storage adapter business which was settled for $0.5 million. |
Property and Equipment
Property and equipment are stated at cost and depreciated over the estimated useful lives of the assets ranging from 3 to 31.5 years using the straight line method. Leasehold improvements are stated at cost and amortized over the shorter of the term of the related lease or its estimated useful life.
The Company considers events and changes in circumstances that could indicate carrying amounts of the long-lived assets, including property and equipment and intangible assets, may not be recoverable. When such events or changes in circumstances occur, the Company assesses recoverability of long-lived assets.
Intangible Asset Valuation
The Company evaluates its long-lived assets such as property, plant and equipment and purchased intangible assets with finite lives, for impairment whenever events or changes in circumstances indicate the carrying value of an asset or asset group may not be recoverable. The carrying value of an asset or asset group is not recoverable if the amount of undiscounted future cash flows the assets are expected to generate (including any net proceeds expected from the disposal of the asset) are less than its carrying value. When the Company identifies an impairment has occurred, it reduces the carrying value of the assets to its comparable market value (if available and appropriate) or to its estimated fair value based on a discounted cash flow approach.
Intangible assets, such as purchased technology, are generally recorded in connection with a business acquisition. The value assigned to intangible assets is usually based on estimates and judgments regarding expectations for the success and life cycle of products and technology acquired. The Company evaluates the useful lives of its intangible assets each reporting period to determine whether events and circumstances require revising the remaining period of amortization.
During the fiscal year ended March 31, 2009, the Company determined that its goodwill was impaired and recognized a charge of $223.0 million to continuing operations, which reduced goodwill to zero. For the years ended March 31, 2010, 2009 and 2008, the Company recorded goodwill impairment charges of zero, $41.1 million and $71.5 million, respectively, to discontinued operations.
Research and Development
Research and development costs are expensed as incurred. Substantially all research and development expenses are related to new product development and designing significant improvements to existing products.
F-12
Table of Contents
APPLIED MICRO CIRCUITS CORPORATION
NOTES TO CONSOLIDATED FINANCIAL STATEMENTS—(Continued)
Advertising Costs
Advertising costs of zero, $1.2 million and $1.3 million were expensed as incurred for each fiscal years ended March 31, 2010, 2009 and 2008, respectively. Advertising costs were primarily related to our Storage Business which was sold to LSI on April 21, 2009.
Income Taxes
The Company utilizes the asset and liability method of accounting for income taxes as set forth in ASC Subtopic 740-10 (“ASC 740-10”). Under the asset and liability method, deferred taxes are determined based on the temporary differences between the financial statement and tax bases of assets and liabilities using enacted tax rates. A valuation allowance is recorded when it is more likely than not that some or all of the deferred tax assets will not be realized. During the fiscal year ended March 31, 2010, the Company recorded a tax charge of approximately $4.2 million to discontinued operations in connection with the sale of the Company’s 3ware storage adapter business and concurrently recorded the same amount as an income tax benefit to continuing operations. In applying the exception to the general principle of intra-period tax allocations under ASC 740-10, the Company considered income recognized both in discontinued operations and other comprehensive income. Accordingly, the allocation of the current year tax provision included recognizing a $10.4 million tax benefit arising from the loss from continuing operations. The offsetting tax expense was allocated on a pro rata basis to discontinued operations and other comprehensive income in the amounts of $4.2 million and $6.2 million, respectively, for the fiscal year ended March 31, 2010.
Stock-Based Compensation
The Company accounts for stock based compensation activity using the modified prospective method. This method requires companies to estimate the fair value of stock-based compensation on the date of grant using an option-pricing model. The Company uses the Black-Scholes model to value stock-based compensation. The Black-Scholes model determines the fair value of share-based payment awards based on the stock price on the date of grant and is affected by assumptions regarding a number of highly complex and subjective variables. These variables include, but are not limited to, the Company’s stock price, volatility over the term of the awards and actual and projected employee stock option exercise behaviors. Option-pricing models were developed for use in estimating the value of traded options that have no vesting or hedging restrictions and are fully transferable. Although the fair value of stock options granted by the Company is estimated by the Black-Scholes model, the estimated fair value may not be indicative of the fair value observed in a willing buyer/willing seller market transaction.
The following table summarizes stock-based compensation expense related to stock options and restricted stock units for the three fiscal years ended March 31, 2010, which is as follows (in thousands, except per share data):
| Fiscal Year Ended March 31, | |||||||||||
| 2010 | 2009 | 2008 | |||||||||
| Stock-based compensation expense by type of awards |
|||||||||||
| Stock options (including employee stock purchase program) |
$ | 4,118 | $ | 4,520 | $ | 8,524 | |||||
| Restricted stock units |
9,601 | 4,648 | 1,674 | ||||||||
| Total stock-based compensation |
13,719 | 9,168 | 10,198 | ||||||||
| Stock-based compensation expensed from (capitalized to) inventory |
(37 | ) | 73 | (142 | ) | ||||||
| Total stock-based compensation expense |
$ | 13,682 | $ | 9,241 | $ | 10,056 | |||||
F-13
Table of Contents
APPLIED MICRO CIRCUITS CORPORATION
NOTES TO CONSOLIDATED FINANCIAL STATEMENTS—(Continued)
The following table summarizes stock-based compensation expense as it relates to the Company’s statement of operations (in thousands):
| Fiscal Year Ended March 31, | |||||||||||
| 2010 | 2009 | 2008 | |||||||||
| Stock-based compensation expense by type of awards |
|||||||||||
| Cost of revenues |
$ | 624 | $ | 369 | $ | 692 | |||||
| Research and development |
6,268 | 3,845 | 4,035 | ||||||||
| Selling, general and administrative |
6,827 | 4,954 | 5,471 | ||||||||
| Total stock-based compensation |
13,719 | 9,168 | 10,198 | ||||||||
| Stock-based compensation expensed from (capitalized to) inventory |
(37 | ) | 73 | (142 | ) | ||||||
| Total stock-based compensation expense |
$ | 13,682 | $ | 9,241 | $ | 10,056 | |||||
The fair value of the options granted is estimated as of the grant date using the Black-Scholes option-pricing model assuming the weighted-average assumptions listed in the following table:
| Employee Stock Options | Employee Stock Purchase Plans |
|||||||||||||||||||||||
| Fiscal Years Ended March 31, |
Fiscal Years Ended March 31, |
|||||||||||||||||||||||
| 2010 | 2009 | 2008 | 2010 | 2009 | 2008 | |||||||||||||||||||
| Expected life (years) |
3.9 | 3.9 | 3.9 | 0.5 | 0.5 | 0.5 | ||||||||||||||||||
| Risk-free interest rate |
1.8 | % | 2.5 | % | 4.1 | % | 0.2 | % | 1.3 | % | 3.6 | % | ||||||||||||
| Volatility |
0.59 | 0.49 | 0.50 | 0.51 | 0.57 | 0.54 | ||||||||||||||||||
| Dividend yield |
— | % | — | % | — | % | — | % | — | % | — | % | ||||||||||||
| Expected forfeiture rate |
5.9 | % | 5.2 | % | 6.1 | % | — | % | — | % | — | % | ||||||||||||
| Weighted average fair value |
$ | 3.50 | $ | 2.50 | $ | 5.08 | $ | 2.30 | $ | 1.84 | $ | 2.98 | ||||||||||||
Compensation Amortization Period. All stock-based compensation is amortized over the requisite service period of the awards, which is generally the same as the vesting period of the awards. The Company amortizes the fair value on a straight-line basis over the expected service periods.
Expected Life. The expected life of stock options granted represents the expected weighted average period of time from the date of grant to the estimated date that the stock option would be fully exercised. To calculate the expected term, the Company utilizes historical actual exercise data and assumes that unexercised stock options would be exercised at the midpoint of the valuation date of its analysis and the full contractual term of the option.
Expected Volatility. Expected volatility is a measure of the amount by which the stock price is expected to fluctuate. The Company estimates the expected volatility of its stock options at their grant date by equally weighting the historical volatility and the implied volatility of its stock. The historical volatility is calculated using the weekly stock price of its stock over a recent historical period equal to its expected life. The implied volatility is calculated from the implied market volatility of exchange-traded call options on its common stock.
Risk-Free Interest Rate. The risk-free interest rate is the implied yield currently available on zero-coupon government issues with a remaining term equal to the expected life.
F-14
Table of Contents
APPLIED MICRO CIRCUITS CORPORATION
NOTES TO CONSOLIDATED FINANCIAL STATEMENTS—(Continued)
Expected Dividends. The Company has never paid any cash dividends on its common stock and does not anticipate paying any cash dividends in the foreseeable future. Consequently, the Company uses an expected dividend yield of zero percent in valuation models.
Expected Forfeitures. As stock-based compensation expense recognized in the Consolidated Statements of Operations for the fiscal years ended March 31, 2010, 2009 and 2008 are based on awards that are ultimately expected to vest, it should be reduced for estimated forfeitures. Forfeitures are required to be estimated at the time of grant and revised, if necessary, in subsequent periods if actual forfeitures differ from those estimates. Pre-vesting forfeiture rates were based upon the average of expected forfeiture data using the Company’s current demographics and standard probabilities of employee turnover and the annual forfeiture rate based on the Company’s historical forfeiture rates.
The weighted average fair value per share of the restricted stock units awarded in the fiscal years ended March 31, 2010, 2009 and 2008 was $6.74, $7.73 and $10.61, respectively. The weighted average fair value per share was calculated based on the fair market value of the Company’s common stock on the respective grant dates.
Stock-based compensation expense will continue to have a significant adverse impact on the Company’s reported results of operations, although it will have no impact on its overall financial position. The amount of unearned stock-based compensation currently estimated to be expensed from now through fiscal 2014 related to unvested share-based payment awards at March 31, 2010 is $26.0 million. The weighted-average period over which the unearned stock-based compensation is expected to be recognized is approximately 2.3 years. If there are any modifications or cancellations of the underlying unvested securities, the Company may be required to accelerate, increase or cancel any remaining unearned stock-based compensation expense. Future stock-based compensation expense and unearned stock-based compensation will increase to the extent that the Company grants additional equity awards or assumes unvested equity awards in connection with acquisitions.
Comprehensive Income (Loss)
ASC Subtopic 220-10, (“ASC 220-10”) establishes rules for the reporting and display of comprehensive income (loss) and its components. ASC 220-10 requires the change in net unrealized gains or losses on short-term investments, marketable securities and foreign currency translation gains and losses to be included in comprehensive income (loss). Comprehensive income (loss) is included in the Company’s Consolidated Statements of Stockholders’ Equity.
Components of accumulated other comprehensive income (loss) consists of (in thousands):
| March 31, | ||||||||
| 2010 | 2009 | |||||||
| Unrealized gain (loss) on investments |
$ | 9,845 | $ | (1,057 | ) | |||
| Cumulative implementation reclassification for prior non-credit related other-than-temporary impairment charges |
(1,134 | ) | — | |||||
| Release upon disposition of investment with cumulative implementation reclassification for prior non-credit related other-than-temporary impairment charges |
140 | — | ||||||
| Gain (loss) on foreign currency translation |
(148 | ) | (240 | ) | ||||
| $ | 8,703 | $ | (1,297 | ) | ||||
F-15
Table of Contents
APPLIED MICRO CIRCUITS CORPORATION
NOTES TO CONSOLIDATED FINANCIAL STATEMENTS—(Continued)
Segments of a Business Enterprise
The Company operates in one reportable operating segment. ASC Subtopic 280-10, (“ASC 280-10”), establishes standards for the way public business enterprises report information about operating segments in annual consolidated financial statements and requires that those enterprises report selected information about operating segments in interim financial reports. ASC 280-10 also establishes standards for related disclosures about products and services, geographic areas and major customers. Although the Company had two operating segments at March 31, 2010 — Process and Transport, under the aggregation criteria set forth in ASC 280-10, the Company operates in only one reportable operating segment.
Under ASC 280-10, two or more operating segments may be aggregated into a single operating segment for financial reporting purposes if aggregation is consistent with the objective and basic principles of ASC 280-10, if the segments have similar economic characteristics, and if the segments are similar in each of the following areas:
| • | the nature of products and services; |
| • | the nature of the production processes; |
| • | the type or class of customer for their products and services; and |
| • | the methods used to distribute their products or provide their services. |
Because the Company meets each of the criteria set forth in ASC 280-10 and the two operating segments as of March 31, 2010 share similar economic characteristics, the Company aggregates its results of operations into one reportable operating segment.
Recent Accounting Pronouncements
In June 2009, the FASB issued SFAS No. 167, Amendments to FASB Interpretation No. 46(R) (“SFAS 167”). SFAS 167 was subsequently codified in December 2009 as ASU No. 2009-17, Improvements to Financial Reporting by Enterprises Involved With Variable Interest Entities (“ASU 2009-17”), which becomes effective the first annual reporting period after November 15, 2009 and will be effective for the Company in the fiscal year ending March 31, 2011. ASU 2009-17 amends ASC Topic 810 to require revised evaluations of whether entities represent variable interest entities, ongoing assessments of control over such entities, and additional disclosures for variable interests. The adoption of ASU 2009-17 is not expected to have a material impact for the Company.
2. Investments
The Company classifies its short-term investments as “available-for-sale” and records such assets at the estimated fair value with unrealized gains and losses excluded from earnings and reported, net of tax, in comprehensive income (loss). The portion of such unrealized losses that are deemed to be other-than-temporary in nature are charged to the statements of operations. The basis for computing realized gains or losses is by specific identification. In addition, the Company had approximately $0.9 million and $0.8 million in restricted cash related to its voluntary disability insurance program for the years ended March 31, 2010 and 2009, respectively.
F-16
Table of Contents
APPLIED MICRO CIRCUITS CORPORATION
NOTES TO CONSOLIDATED FINANCIAL STATEMENTS—(Continued)
The following is a summary of available-for-sale securities (in thousands):
| March 31, 2010 | March 31, 2009 | |||||||||||||||||||||||
| Amortized Cost |
Gross Unrealized | Estimated Fair Value |
Amortized Cost |
Gross Unrealized | Estimated Fair Value | |||||||||||||||||||
| Gains | Losses | Gains | Losses | |||||||||||||||||||||
| Cash |
$ | 9,126 | $ | — | $ | — | $ | 9,126 | $ | 8,047 | $ | — | $ | — | $ | 8,047 | ||||||||
| Cash equivalents |
113,400 | — | — | 113,400 | 91,290 | — | — | 91,290 | ||||||||||||||||
| U.S. Treasury securities and agency bonds |
4,024 | 1 | 3 | 4,022 | 1,166 | 79 | — | 1,245 | ||||||||||||||||
| Corporate bonds |
11,086 | 92 | 23 | 11,155 | 4,541 | 10 | 232 | 4,319 | ||||||||||||||||
| Mortgage-backed and asset-backed securities* |
13,076 | 285 | 114 | 13,247 | 21,372 | 631 | 607 | 21,396 | ||||||||||||||||
| Closed-end bond funds |
36,545 | 7,858 | 105 | 44,298 | 45,031 | 789 | 3,850 | 41,970 | ||||||||||||||||
| Preferred stock |
10,664 | 731 | — | 11,395 | 18,809 | 28 | 3,095 | 15,742 | ||||||||||||||||
| $ | 197,921 | $ | 8,967 | $ | 245 | $ | 206,643 | $ | 190,256 | $ | 1,537 | $ | 7,784 | $ | 184,009 | |||||||||
| Reported as: |
||||||||||||||||||||||||
| Cash and cash equivalents |
$ | 122,526 | $ | 99,337 | ||||||||||||||||||||
| Short-term investments available-for-sale |
84,117 | 84,672 | ||||||||||||||||||||||
| $ | 206,643 | $ | 184,009 | |||||||||||||||||||||
| * | At March 31, 2010 and 2009, approximately $9.6 million and $16.6 million of the amounts presented were mortgage-backed securities, respectively. |
The established guidelines for measuring fair value and expanded disclosures regarding fair value measurements are defined as a three-level valuation hierarchy for disclosure of fair value measurements as follows:
| Level 1 — |
Inputs are unadjusted, quoted prices in active markets for identical assets or liabilities at the measurement date. | |
| Level 2 — |
Inputs (other than quoted market prices included in Level 1) are either directly or indirectly observable for the asset or liability through correlation with market data at the measurement date and for the duration of the instrument’s anticipated life. | |
| Level 3 — |
Inputs reflect management’s best estimate of what market participants would use in pricing the asset or liability at the measurement date. Consideration is given to the risk inherent in the valuation technique and the risk inherent in the inputs to the model. Valuation of instruments includes unobservable inputs to the valuation methodology that are significant to the measurement of the fair value of assets or liabilities. | |
F-17
Table of Contents
APPLIED MICRO CIRCUITS CORPORATION
NOTES TO CONSOLIDATED FINANCIAL STATEMENTS—(Continued)
The following is a summary of cash, cash equivalents and available-for-sale investments by type of instruments measured at fair value on a recurring basis (in thousands):
| March 31, 2010 | March 31, 2009 | |||||||||||||||||||||||
| Level 1 | Level 2 | Level 3 | Total | Level 1 | Level 2 | Level 3 | Total | |||||||||||||||||
| Cash |
$ | 9,126 | $ | — | $ | — | $ | 9,126 | $ | 8,047 | $ | — | $ | — | $ | 8,047 | ||||||||
| Cash equivalents |
113,400 | — | — | 113,400 | 91,290 | — | — | 91,290 | ||||||||||||||||
| U.S. Treasury securities and agency bonds |
4,022 | — | — | 4,022 | 1,245 | — | — | 1,245 | ||||||||||||||||
| Corporate bonds |
— | 11,155 | — | 11,155 | — | 4,319 | — | 4,319 | ||||||||||||||||
| Mortgage-backed and asset-backed securities |
— | 13,247 | — | 13,247 | — | 21,396 | — | 21,396 | ||||||||||||||||
| Closed-end bond funds |
44,298 | — | — | 44,298 | 41,970 | — | — | 41,970 | ||||||||||||||||
| Preferred stock |
— | 11,395 | — | 11,395 | — | 15,742 | — | 15,742 | ||||||||||||||||
| $ | 170,846 | $ | 35,797 | $ | — | $ | 206,643 | $ | 142,552 | $ | 41,457 | $ | — | $ | 184,009 | |||||||||
The Company periodically reviews its strategic investments for other-than-temporary declines in fair value based on the specific identification method and writes down investments when an other-than-temporary decline has occurred. During the fiscal year ended March 31, 2010, the Company recognized an impairment charge for one of its non-marketable strategic investments of $2.0 million in other income (expense), net. The fair value was estimated on a non-recurring basis based on Level 3 inputs. The Level 3 inputs used to estimate the fair value of this investment was based on the current cash position and recent operational performance of the investee. During the fiscal year ended March 31, 2010, the Company invested $1.0 million in another non-marketable equity investment and this amount was carried at cost at year end.
At March 31, 2010, the cost and estimated fair values of available-for-sale securities with stated maturities are U.S. Treasury securities and agency bonds, corporate bonds and mortgage-backed and asset-backed securities by contractual maturity are as follows (in thousands):
| Cost | Fair Value | |||||
| Less than 1 year |
$ | 9,931 | $ | 9,829 | ||
| Mature in 1 – 2 years |
6,177 | 6,187 | ||||
| Mature in 3 – 5 years |
— | — | ||||
| Mature after 5 years |
12,078 | 12,408 | ||||
| $ | 28,186 | $ | 28,424 | |||
F-18
Table of Contents
APPLIED MICRO CIRCUITS CORPORATION
NOTES TO CONSOLIDATED FINANCIAL STATEMENTS—(Continued)
The following is a summary of gross unrealized losses (in thousands):
| Less Than 12 Months of Unrealized Losses |
12 Months or More of Unrealized Losses |
Total | ||||||||||||||||
| As of March 31, 2010 | Estimated Fair Value |
Gross Unrealized Losses |
Estimated Fair Value |
Gross Unrealized Losses |
Estimated Fair Value |
Gross Unrealized Losses | ||||||||||||
| U.S. Treasury securities and agency bonds |
$ | 4,012 | $ | 3 | $ | — | $ | — | $ | 4,012 | $ | 3 | ||||||
| Corporate bonds |
1,850 | 23 | — | — | 1,850 | 23 | ||||||||||||
| Mortgage-backed and asset-backed securities |
1,931 | 114 | — | — | 1,931 | 114 | ||||||||||||
| Closed-end bond funds |
7,821 | 105 | — | — | 7,821 | 105 | ||||||||||||
| $ | 15,614 | $ | 245 | $ | — | $ | — | $ | 15,614 | $ | 245 | |||||||
| Less Than 12 Months of Unrealized Losses |
12 Months or More of Unrealized Losses |
Total | ||||||||||||||||
| As of March 31, 2009 | Estimated Fair Value |
Gross Unrealized Losses |
Estimated Fair Value |
Gross Unrealized Losses |
Estimated Fair Value |
Gross Unrealized Losses | ||||||||||||
| Corporate bonds |
$ | 3,619 | $ | 232 | $ | — | $ | — | $ | 3,619 | $ | 232 | ||||||
| Mortgage-backed and asset-backed securities |
6,531 | 607 | — | — | 6,531 | 607 | ||||||||||||
| Closed-end bond funds |
25,251 | 3,850 | — | — | 25,251 | 3,850 | ||||||||||||
| Preferred stock and options |
14,950 | 3,095 | — | — | 14,950 | 3,095 | ||||||||||||
| $ | 50,351 | $ | 7,784 | $ | — | $ | — | $ | 50,351 | $ | 7,784 | |||||||
Other-Than-Temporary Impairment
The Company assessed whether it intends to sell or it is more likely than not that it will be required to sell an available-for-sale debt instrument before recovery of its amortized cost basis less any current-period credit losses. For available-for-sale debt instruments that are considered other-than-temporarily impaired and that the Company does not intend to sell and will not be required to sell prior to recovery of the amortized cost basis, we separate the amount of the impairment into the amount that is credit related and the amount due to all other factors. The credit loss component is recognized in earnings and is the difference between the debt instrument’s amortized cost basis and the present value of its expected future cash flows. The cumulative implementation adjustment was a $1.1 million reclassification of prior other-than-temporary impairment charges from retained earnings to other comprehensive income as the impairment losses were determined to be non-credit related. The remaining difference between the opening debt instrument’s fair value and the present value of future expected cash flows is due to factors that are not credit related and is recognized in other comprehensive income (loss). Subsequently, as the underlying securities matured or were sold, an amount of approximately $0.1 million was expensed though interest income (expense), net and other-than-temporary impairment during the fiscal year ended March 31, 2010.
F-19
Table of Contents
APPLIED MICRO CIRCUITS CORPORATION
NOTES TO CONSOLIDATED FINANCIAL STATEMENTS—(Continued)
3. Certain Financial Statement Information
Accounts receivable:
| March 31, | ||||||||
| 2010 | 2009 | |||||||
| (In thousands) | ||||||||
| Accounts receivable |
$ | 23,607 | $ | 18,688 | ||||
| Less: allowance for bad debts |
(715 | ) | (1,151 | ) | ||||
| $ | 22,892 | $ | 17,537 | |||||
Inventories:
| March 31, | ||||||
| 2010 | 2009 | |||||
| (In thousands) | ||||||
| Finished goods |
$ | 12,888 | $ | 20,170 | ||
| Work in process |
1,668 | 5,324 | ||||
| Raw materials |
831 | 1,104 | ||||
| $ | 15,387 | $ | 26,598 | |||
Other current assets:
| March 31, | ||||||
| 2010 | 2009 | |||||
| (In thousands) | ||||||
| Prepaid expenses |
$ | 7,882 | $ | 7,434 | ||
| Strategic investment* |
5,369 | — | ||||
| Executive deferred compensation assets |
3,213 | 2,463 | ||||
| Deposits |
812 | 634 | ||||
| Other |
822 | 803 | ||||
| $ | 18,098 | $ | 11,334 | |||
| * | $5.0 million was reclassified to current assets because the investee where the Company had a strategic investment was acquired in April 2010 and the Company’s investment was liquidated. |
F-20
Table of Contents
APPLIED MICRO CIRCUITS CORPORATION
NOTES TO CONSOLIDATED FINANCIAL STATEMENTS—(Continued)
Property and equipment:
| Useful Life |
March 31, | |||||||||
| 2010 | 2009 | |||||||||
| (In years) | (In thousands) | |||||||||
| Machinery and equipment |
5-7 | $ | 29,252 | $ | 34,546 | |||||
| Leasehold improvements |
1-15 | 9,931 | 9,375 | |||||||
| Computers, office furniture and equipment |
3-7 | 43,789 | 51,843 | |||||||
| Buildings |
31.5 | 2,756 | 2,756 | |||||||
| Land |
N/A | 9,800 | 9,800 | |||||||
| 95,528 | 108,320 | |||||||||
| Less: accumulated depreciation and amortization |
(69,649 | ) | (82,571 | ) | ||||||
| $ | 25,879 | $ | 25,749 | |||||||
Goodwill and purchased intangible assets:
Goodwill is as follows (in thousands):
| Fiscal Years Ended March 31, | |||||||||||
| 2010 | 2009 | 2008 | |||||||||
| Beginning balance, gross |
$ | — | $ | 4,441,026 | $ | 4,441,259 | |||||
| Accumulated amortization and impairments |
— | (4,176,896 | ) | (4,105,402 | ) | ||||||
| Beginning balance, net |
— | 264,130 | 335,857 | ||||||||
| Canadian tax settlement |
— | — | (233 | ) | |||||||
| Impairment charges to continuing operations |
— | (222,972 | ) | — | |||||||
| Impairment charges to discontinued operations |
— | (41,158 | ) | (71,494 | ) | ||||||
| Ending balance |
$ | — | $ | — | $ | 264,130 | |||||
Purchase-related intangibles were as follows (in thousands):
| March 31, 2010 | March 31, 2009 | |||||||||||||||||||
| Gross | Accumulated Amortization and Impairments |
Net | Gross | Accumulated Amortization and Impairments |
Net | |||||||||||||||
| Developed technology |
$ | 425,000 | $ | (413,625 | ) | $ | 11,375 | $ | 425,000 | $ | (401,528 | ) | $ | 23,472 | ||||||
| Customer relationships |
6,330 | (5,226 | ) | 1,104 | 6,330 | (4,976 | ) | 1,354 | ||||||||||||
| Patents/core technology rights/tradename |
62,305 | (57,934 | ) | 4,371 | 62,305 | (54,166 | ) | 8,139 | ||||||||||||
| $ | 493,635 | $ | (476,785 | ) | $ | 16,850 | $ | 493,635 | $ | (460,670 | ) | $ | 32,965 | |||||||
F-21
Table of Contents
APPLIED MICRO CIRCUITS CORPORATION
NOTES TO CONSOLIDATED FINANCIAL STATEMENTS—(Continued)
The estimated future amortization expense of purchased intangible assets to be charged to cost of sales and operating expenses as of March 31, 2010, is as follows (in thousands):
| Cost of Sales |
Operating Expenses |
Total | |||||||
| Fiscal years ending March 31, |
|||||||||
| 2011 |
$ | 10,500 | $ | 4,018 | $ | 14,518 | |||
| 2012 |
875 | 852 | 1,727 | ||||||
| 2013 |
— | 250 | 250 | ||||||
| 2014 |
— | 250 | 250 | ||||||
| 2015 and Thereafter |
— | 105 | 105 | ||||||
| Total |
$ | 11,375 | $ | 5,475 | $ | 16,850 | |||
Other Assets:
| March 31, | ||||||
| 2010 | 2009 | |||||
| (In thousands) | ||||||
| Non-current portion of prepaid expenses |
$ | 9,295 | $ | 10,860 | ||
| Strategic investments* |
1,000 | 7,000 | ||||
| $ | 10,295 | $ | 17,860 | |||
| * | $5.0 million was reclassified to current assets because the investee where the Company had a strategic investment was acquired in April 2010 and the Company’s investment was liquidated. |
Other accrued liabilities:
| March 31, | ||||||
| 2010 | 2009 | |||||
| (In thousands) | ||||||
| Executive deferred compensation |
$ | 3,213 | $ | 2,463 | ||
| Employee related liabilities |
2,052 | 1,896 | ||||
| Professional fees |
1,114 | 644 | ||||
| Restructuring liabilities |
583 | 4,142 | ||||
| Warranty |
169 | 1,285 | ||||
| Product development cost |
— | 2,000 | ||||
| Other |
2,475 | 3,036 | ||||
| $ | 9,606 | $ | 15,466 | |||
F-22
Table of Contents
APPLIED MICRO CIRCUITS CORPORATION
NOTES TO CONSOLIDATED FINANCIAL STATEMENTS—(Continued)
Interest income (expense), net and other-than-temporary impairment:
| Fiscal Years Ended March 31, | ||||||||||||
| 2010 | 2009 | 2008 | ||||||||||
| (In thousands) | ||||||||||||
| Interest income |
$ | 6,207 | $ | 9,757 | $ | 11,482 | ||||||
| Net realized gain (loss) on short-term investments |
1,380 | (682 | ) | (1,148 | ) | |||||||
| Impairment of marketable securities |
(4,147 | ) | (17,144 | ) | (1,682 | ) | ||||||
| Interest expense |
— | (4 | ) | (17 | ) | |||||||
| $ | 3,440 | $ | (8,073 | ) | $ | 8,635 | ||||||
Other income, net:
| Fiscal Years Ended March 31, | ||||||||||||
| 2010 | 2009 | 2008 | ||||||||||
| (In thousands) | ||||||||||||
| Impairment of strategic investment |
$ | (2,000 | ) | $ | — | $ | (3,000 | ) | ||||
| Net loss on disposals of property |
(103 | ) | (51 | ) | (21 | ) | ||||||
| Gain on strategic investments |
— | — | 4,649 | |||||||||
| Other |
552 | 543 | 316 | |||||||||
| $ | (1,551 | ) | $ | 492 | $ | 1,944 | ||||||
Net loss per share:
Shares used in basic net income (loss) per share are computed using the weighted average number of common shares outstanding during each period. Shares used in diluted net income per share include the dilutive effect of common shares potentially issuable upon the exercise of stock options, vesting of restricted stock units (“RSUs”) and outstanding warrants. However, potentially issuable common shares are not used in computing net loss per share as their effect would be anti-dilutive due to the loss recorded during the period. The reconciliation of shares used to calculate basic and diluted net loss per share consists of the following (in thousands, except per share data):
| Fiscal Years Ended March 31, | ||||||||||||
| 2010 | 2009 | 2008 | ||||||||||
| Net income (loss): |
||||||||||||
| From continuing operations |
$ | (13,597 | ) | $ | (261,098 | ) | $ | (45,205 | ) | |||
| From discontinued operations, net of taxes |
6,112 | (48,235 | ) | (69,916 | ) | |||||||
| Net loss |
$ | (7,485 | ) | $ | (309,333 | ) | $ | (115,121 | ) | |||
| Shares used in net income (loss) per share computation: |
||||||||||||
| Weighted average common shares outstanding |
66,006 | 65,271 | 67,775 | |||||||||
| Net effect of dilutive common share equivalents |
— | — | — | |||||||||
| Shares used in basic and diluted net loss per share computation |
66,006 | 65,271 | 67,775 | |||||||||
| Basic and diluted net income (loss) per share: |
||||||||||||
| From continuing operations |
$ | (0.21 | ) | $ | (4.00 | ) | $ | (0.67 | ) | |||
| From discontinued operations, net of taxes |
0.10 | (0.74 | ) | (1.03 | ) | |||||||
| Net loss per share |
$ | (0.11 | ) | $ | (4.74 | ) | $ | (1.70 | ) | |||
F-23
Table of Contents
APPLIED MICRO CIRCUITS CORPORATION
NOTES TO CONSOLIDATED FINANCIAL STATEMENTS—(Continued)
The effect of dilutive securities (comprised of options, restricted stock units and warrants) totaling 2.2 million, 0.2 million and 0.2 million equivalent shares for the fiscal years ended March 31, 2010, 2009 and 2008, respectively, have been excluded from the loss per share computation, as their impact would be anti-dilutive because the Company has incurred losses in the periods presented.
4. Stockholders’ Equity
Preferred Stock
The Certificate of Incorporation allows for the issuance of up to two million shares of preferred stock in one or more series and to fix the rights, preferences, privileges and restrictions thereof, including dividend rights, dividend rates, conversion rights, voting rights, terms of redemption, redemption prices, liquidation preferences, and the number of shares constituting any series of the designation of such series, without further vote or action by the stockholders.
Common Stock
At March 31, 2010 the Company had 375.0 million shares authorized for issuance and approximately 65.4 million shares issued and outstanding. At March 31, 2009, there were approximately 65.9 million shares issued and outstanding.
In March 2007, the Company’s stockholders approved a proposal that allowed the Board to implement a reverse stock split on the common stock using any one of three approved ratios: 1-for-2, 1-for-3 or 1-for-4. On December 10, 2007, the Board implemented a 1-for-4 reverse stock split. All the share numbers in these financial statements have been restated to reflect this reverse stock split.
Stock Repurchase Program
In August 2004, the Board authorized a stock repurchase program for the repurchase of up to $200.0 million of the Company’s common stock. Under the program, the Company is authorized to make purchases in the open market or enter into structured agreements. In October 2008, the Board increased the stock repurchase program by $100.0 million. During the fiscal year ended March 31, 2010, 1.1 million shares were repurchased on the open market at a weighted average price of $7.54 per share. During the fiscal year ended March 31, 2009, no shares were repurchased on the open market. During the fiscal year ended March 31, 2008, the Company repurchased 5.0 million shares of its common stock for approximately $57.0 million on the open market. From the time the program was first implemented in August 2004, the Company has repurchased on the open market a total of 9.9 million shares at a weighted average price of $11.29 per share. All repurchased shares were retired upon delivery to us.
The Company also utilizes structured stock repurchase agreements to buy back shares which are prepaid written put options on its common stock. The Company pays a fixed sum of cash upon execution of each agreement in exchange for the right to receive either a pre-determined amount of cash or stock depending on the closing market price of its common stock on the expiration date of the agreement. Upon expiration of each agreement, if the closing market price of its common stock is above the pre-determined price, the Company will have its cash investment returned with a premium. If the closing market price is at or below the pre-determined price, the Company will receive the number of shares specified at the agreement inception. The Company considers the guidance in ASC Topic 480-10 and ASC Topic 815-40 to account for these transactions. Any cash received, including the premium, is treated as additional paid-in capital on the balance sheet.
F-24
Table of Contents
APPLIED MICRO CIRCUITS CORPORATION
NOTES TO CONSOLIDATED FINANCIAL STATEMENTS—(Continued)
During the fiscal year ended March 31, 2010, the Company entered into structured repurchase agreements totaling $41.8 million. For those agreements that settled during the fiscal year ended March 31, 2010, the Company received $27.8 million in cash (including 0.7 million in gains) and 0.7 million in shares of its common stock at an effective purchase price of $7.25 per share from the settled structured stock repurchase agreements. During the fiscal year ended March 31, 2009, the Company did not enter into any structured stock repurchase agreements. At March 31, 2010, the Company had approximately $92.4 million remaining available to repurchase shares under the stock repurchase program and two outstanding structured stock repurchase agreements for $10.0 million, of which one settled with the receipt of $5.1 million in April 2010. From the inception of the Company’s most recent stock repurchase program in August 2004, it entered into structured stock repurchase agreements totaling $257.5 million. Upon settlement of these agreements, as of March 31, 2010, the Company received $164.3 million in cash and 8.5 million shares of its common stock at an effective purchase price of $9.84 per share.
The table below is a plan-to-date summary of the Company’s repurchase program activity as of March 31, 2010 (in thousands, except per share data):
| Aggregate Price |
Repurchased Shares |
Average Price Per Share | ||||||
| Stock repurchase program |
||||||||
| Authorized amount |
$ | 300,000 | — | $ | — | |||
| Open market repurchases |
112,042 | 9,927 | 11.29 | |||||
| Structured stock repurchase agreements* |
95,517 | 8,487 | 11.26 | |||||
| Total repurchases |
$ | 207,559 | 18,414 | $ | 11.27 | |||
| Available for repurchase |
$ | 92,441 | ||||||
| * | The amounts above do not include gains, recorded to additional paid-in-capital of $12.0 million from structured stock repurchase agreements which settled in cash. The average price per share for structured stock repurchase agreements adjusted for gains from settlements in cash would have been $9.84 per share and for total repurchases would have been $10.62 per share. |
Stock Options
The Company has granted stock options to employees and non-employee directors under several plans. These option plans include two stockholder-approved plans (the 1992 Stock Option Plan and 1997 Directors’ Stock Option Plan) and four plans not approved by stockholders (the 2000 Equity Incentive Plan, Cimaron Communications Corporation’s 1998 Stock Incentive Plan assumed in the fiscal 1999 merger, and JNI Corporation’s 1997 and 1999 Stock Option Plans assumed in the fiscal 2004 merger). Certain other outstanding options were assumed through the Company’s various acquisitions.
In March 2007, the Company’s stockholders also approved the amendment and restatement of the 1992 Stock Option Plan (i) to expand the type of awards available under the plan, (ii) to rename the plan as the 1992 Equity Incentive Plan, (iii) to extend the plan’s expiration date until January 10, 2017, (iv) to increase the shares reserved under the plan by 2.3 million shares, (v) to serve as a successor plan to the 2000 Equity Incentive Plan, which is no longer used for equity awards, and (vi) to provide that any shares subject to stock awards under the 2000 Equity Incentive Plan that terminate or are forfeited or repurchased (other than options issued under the 2000 Equity Incentive Plan that were tendered in the stock option exchange, which occurred in May 2007) are added to the share reserve under the 1992 Equity Incentive Plan.
F-25
Table of Contents
APPLIED MICRO CIRCUITS CORPORATION
NOTES TO CONSOLIDATED FINANCIAL STATEMENTS—(Continued)
The Board has delegated administration of the Company’s equity plans to the Compensation Committee, which generally determines eligibility, vesting schedules and other terms for awards granted under the plans. Options under the plans expire not more than ten years from the date of grant and are generally exercisable upon vesting. Vesting generally occurs over four years. New hire grants generally vest and become exercisable at the rate of 25% on the first anniversary of the date of grant and ratably on a monthly basis over a period of 36 months thereafter; subsequent option grants to existing employees generally vest and become exercisable ratably on a monthly basis over a period of 48 months measured from the date of grant.
In connection with its annual review of officer compensation in April 2006, the Compensation Committee granted to each of the Company’s executive officers performance options that vest based on pre-determined Company goals. These options become exercisable only if the Company achieves specific revenue and non-GAAP pre-tax profit targets in any fiscal quarter before fiscal 2010. During the fiscal year ended March 31, 2008, the Company determined these targets will not be achieved before the fiscal year ended March 31, 2010 and therefore reversed the associated stock-based compensation expense of $1.3 million.
In connection with its annual review of officer compensation in April 2007, the Compensation Committee granted to each of the Company’s executive officers performance options that vest based on pre-determined Company goals. There were two types of performance options. The first type vests in 48 equal monthly installments beginning one month after the grant date; provided, however, if the Company achieved specific goals under its fiscal year ended March 31, 2008 operating plan, the vesting of the option would have accelerated such that the option would have been fully exercisable at the end of two years instead of four years. The second type of performance options would have been exercisable only if the Company achieved certain rankings within a group of peer companies with respect to certain measures of performance by the end of the fiscal year ended March 31, 2008 as determined by the Compensation Committee. As a result of the Company’s performance during the fiscal year ended March 31, 2008, the Compensation Committee determined the performance criteria for both types of performance options were not achieved.
In connection with its annual review of officer compensation in May 2008, the Compensation Committee granted to each of the Company’s executive officers performance options that vest based on pre-determined Company goals. The performance options become exercisable only if the Company achieves certain rankings within a group of peer companies with respect to certain measures of performance by the end of the fiscal year ended March 31, 2009 as determined by the Compensation Committee. As a result of the Company’s performance during the fiscal year ended March 31, 2009, the Compensation Committee determined the performance criteria were not achieved.
In May 2009, Dr. Gopi, our CEO, was awarded 300,000 stock options for “Extraordinary Accomplishment.” The Black-Scholes value of these stock options are $1.1 million. These options will vest only if Company performance milestones are satisfied; otherwise they will expire unvested. The first milestone for 75,000 shares will vest only if we achieve an annual revenue target of $270 million or more for any fiscal year from fiscal 2010 through fiscal 2013. The next milestone for another 75,000 shares will vest only if we achieve an annual revenue target of $310 million or more for any fiscal year from fiscal 2010 through fiscal 2013 or an annual revenue target of $350 million or more for fiscal 2014. The last milestone for 150,000 shares will vest only if we achieve an annual operating margin of 13.5% of annual revenue or higher in fiscal 2013 or 15% or higher for any fiscal year from fiscal 2010 through fiscal 2012. The Company evaluates the probability of achieving the milestones and adjusts any stock option expense accordingly under stock-based compensation expense.
At March 31, 2010, 2009, and 2008 there were no shares of common stock subject to repurchase. Options are granted at prices at least equal to fair value of the Company’s common stock on the date of grant.
F-26
Table of Contents
APPLIED MICRO CIRCUITS CORPORATION
NOTES TO CONSOLIDATED FINANCIAL STATEMENTS—(Continued)
A summary of the Company’s stock option activity and related information is as follows (options in thousands):
| Fiscal Years Ended March 31, | ||||||||||||||||||
| 2010 | 2009 | 2008 | ||||||||||||||||
| Options | Weighted Average Exercise Price |
Options | Weighted Average Exercise Price |
Options | Weighted Average Exercise Price | |||||||||||||
| Outstanding at the beginning of the year |
7,923 | $ | 13.60 | 9,214 | $ | 17.57 | 12,486 | $ | 21.84 | |||||||||
| Granted and assumed |
1,141 | 7.55 | 2,410 | 6.21 | 1,544 | 11.12 | ||||||||||||
| Exercised |
(407 | ) | 4.92 | (53 | ) | 2.02 | (205 | ) | 7.32 | |||||||||
| Forfeited |
(2,347 | ) | 17.09 | (3,648 | ) | 18.90 | (4,611 | ) | 27.42 | |||||||||
| Outstanding at the end of the year |
6,310 | $ | 11.76 | 7,923 | $ | 13.60 | 9,214 | $ | 17.57 | |||||||||
| Vested and expected to vest at the end of the year |
6,156 | $ | 11.88 | 7,594 | $ | 13.85 | 8,956 | $ | 17.74 | |||||||||
| Vested at the end of the year |
4,125 | $ | 14.21 | 5,042 | $ | 17.04 | 6,956 | $ | 19.39 | |||||||||
While the Company’s stock options outstanding at the end of the year have decreased since the fiscal year ended March 31, 2008, there has been a corresponding increase in the Company’s restricted stock units outstanding at the end of the year. See “Restricted Stock Units.”
The following is a further breakdown of the options outstanding at March 31, 2010 (options in thousands):
| Range of Exercise Prices |
Options Outstanding |
Weighted Average Remaining Contractual Life |
Weighted Average Exercise Price |
Options Exercisable |
Weighted Average Exercise Price | |||||||
| $ 0.52 - $ 7.12 |
1,567 | 5.97 | $ | 6.00 | 360 | $ | 5.45 | |||||
| 7.13 - 8.56 |
1,514 | 6.57 | 7.94 | 616 | 7.86 | |||||||
| 8.57 - 12.84 |
1,503 | 2.46 | 12.26 | 1,431 | 12.24 | |||||||
| 12.85 - 22.60 |
1,327 | 3.54 | 15.05 | 1,319 | 15.05 | |||||||
| 22.61 - 152.25 |
399 | 1.82 | 36.11 | 399 | 36.11 | |||||||
| $ 0.52 - $152.25 |
6,310 | 4.50 | $ | 11.76 | 4,125 | $ | 14.20 | |||||
As of March 31, 2010, the aggregate pre-tax intrinsic value of options outstanding and exercisable was $1.6 million and options outstanding was $5.2 million. The aggregate pre-tax intrinsic value of options exercised during the fiscal year ended March 31, 2010 was $1.3 million.
Restricted Stock Units
The Company has granted restricted stock units pursuant to its 2000 Equity Incentive Plan as part of its regular annual employee equity compensation review program as well as to new hires. In addition, in May 2007, the Company granted approximately 0.4 million restricted stock units in exchange for approximately 2.0 million options for shares of common stock in connection with the stock option exchange program approved by its stockholders in March 2007. Restricted stock units are share awards that, upon vesting, will deliver to the holder shares of the Company’s common stock. Generally, restricted stock units vest ratably on a quarterly basis over four years from the date of grant. For new hires, restricted stock units will vest on a quarterly basis over four
F-27
Table of Contents
APPLIED MICRO CIRCUITS CORPORATION
NOTES TO CONSOLIDATED FINANCIAL STATEMENTS—(Continued)
years from the date of hire provided that no shares will vest during the first year, at the end of which the shares that would have vested during that year will vest and the remaining shares will vest over the remaining 12 quarters.
In May 2009, the Committee issued three-year RSU grants, or “EBITDA Grants.” Vesting for the EBITDA Grants is subject to (i) the Company’s performance as measured by earnings before interest, taxes, depreciation and amortization (“EBITDA”), and (ii) individual performance as measured by the accomplishment of goals and objectives. For the fiscal year ended March 31, 2010, approximately 34% of the three-year performance pool is expected to vest because the Company’s performance exceeded its “stretch” EBITDA target. For the fiscal year ending March 31, 2011, up to 42% of the remaining three-year performance pool can vest. Approximately 21% can vest for “at plan” Company performance, 28% can vest for “stretch” Company performance and 42% can vest for “extraordinary” Company performance. The Company evaluates the probability of achieving the milestones and adjusts any RSU expense accordingly under stock-based compensation expense.
A summary of the Company’s restricted stock unit activity and related information in the three fiscal years ended March 31, 2010 is as follows (shares in thousands):
| Fiscal Years Ended March 31, | |||||||||
| 2010 | 2009 | 2008 | |||||||
| Outstanding at the beginning of the year |
1,467 | 1,200 | 184 | ||||||
| Awarded during the year |
3,716 | 1,271 | 1,405 | ||||||
| Vested during the year |
(624 | ) | (559 | ) | (221 | ) | |||
| Cancelled during the year |
(872 | ) | (445 | ) | (168 | ) | |||
| Outstanding at the end of the year |
3,687 | 1,467 | 1,200 | ||||||
The weighted average grant-date fair value per share of restricted stock units awarded during the fiscal years ended March 31, 2010, 2009 and 2008 was $6.74, $7.73 and $10.61, respectively. The weighted average remaining contractual term for the restricted stock units outstanding as of March 31, 2010 was 2.2 years.
As of March 31, 2010, the aggregate pre-tax intrinsic value of restricted stock units outstanding was $31.8 million and the aggregate pre-tax intrinsic value of restricted stock units vested during the fiscal year ended March 31, 2010 was $4.6 million.
Employee Stock Purchase Plan
The Company has in effect an employee stock purchase plan under which 4.8 million shares of common stock have been reserved for issuance. Under the terms of this plan, purchases are made semiannually and the purchase price of the common stock is equal to 85% of the fair market value of the common stock on the first or last day of the offering period, whichever is lower. During the fiscal years ended March 31, 2010, 2009 and 2008, approximately 0.4 million, 0.5 million and 0.6 million shares, respectively, were issued under this plan. At March 31, 2010, approximately 4.0 million shares had been issued under this plan and approximately 0.8 million shares were available for future issuance.
Warrants
On May 17, 2009, the Company entered into agreements with Veloce pursuant to which Veloce has agreed to perform development work for the Company on an exclusive basis for up to five years for cash and other consideration, including a warrant to purchase shares of the Company’s common stock, which would vest upon the achievement of certain performance and time-based milestones.
F-28
Table of Contents
APPLIED MICRO CIRCUITS CORPORATION
NOTES TO CONSOLIDATED FINANCIAL STATEMENTS—(Continued)
The warrant expires on July 15, 2014 and has an exercise price of $0.01. Provided that “certain milestones” are achieved by the 12-month anniversary of the agreement date, the first tranche for 33% will vest on the 12-month anniversary of the agreement date and the remaining 67% will vest 8% every three months beginning on the 15th month after the agreement date until the warrant is 100% vested. If at any time, Veloce achieves the “project milestone,” the warrant will vest 100% on the date the “project milestone” is achieved. Veloce has elected to exercise the warrants prior to vesting. The shares are not considered outstanding and are subject to repurchase until they are vested. Recognition of expense related to the warrant agreement is initially dependent upon the probability of “certain milestones” being achieved, which is based on consideration of several factors including the stage of development, nature and complexity of the technology being developed and the uncertainty involved in developing complex leading edge products. The Company assesses the probability of the “certain milestones” being achieved each reporting period. As of March 31, 2010, the milestones required for vesting to begin have not been achieved.
Common Shares Reserved for Future Issuance
At March 31, 2010, the Company has the following shares of common stock reserved for issuance upon the exercise of equity instruments (in thousands):
| Options granted and outstanding |
6,310 | |
| Restricted Stock Units |
3,687 | |
| Options and RSUs authorized for future grants |
6,763 | |
| Employee Stock Purchase Plan |
760 | |
| Warrants outstanding |
658 | |
| 18,178 | ||
During the fiscal year ended March 31, 2010, we issued a performance option for 0.3 million shares and performance RSUs for 3.2 million shares, of which only 1.1 million RSUs are expected to vest because the Company’s performance exceeded its “stretch” EBITDA target.
5. Income Taxes
Loss from continuing operations before income tax consists of the following (in thousands):
| Fiscal Years Ended March 31, | ||||||||||||
| 2010 | 2009 | 2008 | ||||||||||
| Loss from continuing operations before income tax: |
||||||||||||
| Domestic |
$ | (26,229 | ) | $ | (265,348 | ) | $ | (42,807 | ) | |||
| Foreign |
2,022 | 304 | 1,375 | |||||||||
| $ | (24,207 | ) | $ | (265,044 | ) | $ | (41,432 | ) | ||||
F-29
Table of Contents
APPLIED MICRO CIRCUITS CORPORATION
NOTES TO CONSOLIDATED FINANCIAL STATEMENTS—(Continued)
Income tax expense (benefit) from continuing operations consists of the following (in thousands):
| Fiscal Years Ended March 31, | ||||||||||||
| 2010 | 2009 | 2008 | ||||||||||
| Current: |
||||||||||||
| Federal |
$ | (10,078 | ) | $ | (375 | ) | $ | — | ||||
| Foreign |
213 | 311 | (295 | ) | ||||||||
| State |
(745 | ) | 75 | 111 | ||||||||
| Total Current |
(10,610 | ) | 11 | (184 | ) | |||||||
| Deferred: |
||||||||||||
| Federal |
— | (3,370 | ) | 3,370 | ||||||||
| State |
— | (587 | ) | 587 | ||||||||
| Total Deferred |
— | (3,957 | ) | 3,957 | ||||||||
| $ | (10,610 | ) | $ | (3,946 | ) | $ | 3,773 | |||||
The provision (benefit) for income taxes reconciles to the amount computed by applying the federal statutory rate (35%) to loss before income taxes as follows for continuing operations (in thousands):
| Fiscal Years Ended March 31, | |||||||||||||||||||||
| 2010 | 2009 | 2008 | |||||||||||||||||||
| $ | % | $ | % | $ | % | ||||||||||||||||
| Tax at federal statutory rate |
$ | (8,473 | ) | 35 | % | $ | (92,767 | ) | 35 | % | $ | (14,501 | ) | 35 | % | ||||||
| Tax benefit from loss from continuing operations |
(10,386 | ) | 43 | — | — | — | — | ||||||||||||||
| Goodwill |
— | — | 57,807 | (22 | ) | 27,693 | (67 | ) | |||||||||||||
| Other Permanent Differences |
1,144 | (5 | ) | — | — | — | — | ||||||||||||||
| State taxes, net of federal benefit |
(903 | ) | 4 | (9,899 | ) | 4 | (1,547 | ) | 4 | ||||||||||||
| Federal tax credits |
(1,746 | ) | 7 | (337 | ) | — | — | — | |||||||||||||
| State tax credits |
(295 | ) | 1 | (1,110 | ) | — | — | — | |||||||||||||
| Valuation allowance |
9,706 | (40 | ) | 39,532 | (15 | ) | (8,806 | ) | 21 | ||||||||||||
| Change in contingency reserve |
(36 | ) | — | 123 | — | (442 | ) | — | |||||||||||||
| Other |
379 | (2 | ) | 2,705 | (1 | ) | 1,376 | (2 | ) | ||||||||||||
| $ | (10,610 | ) | 43 | % | $ | (3,946 | ) | 1 | % | $ | 3,773 | (9 | )% | ||||||||
Significant components of the Company’s deferred tax assets and liabilities for federal and state income taxes are as shown below (in thousands):
| March 31, | ||||||
| 2010 | 2009 | |||||
| Deferred tax assets: |
||||||
| Net operating loss carryforwards |
$ | 273,649 | $ | 267,340 | ||
| Research and development credit carryforwards |
69,546 | 69,674 | ||||
| Inventory write-downs and other reserves |
14,234 | 19,944 | ||||
| Capitalization of research and development costs |
12,059 | 6,603 | ||||
| Goodwill |
9,760 | 10,640 | ||||
| Intangible assets |
53,026 | 54,485 | ||||
| Investment impairment |
8,716 | 6,641 | ||||
F-30
Table of Contents
APPLIED MICRO CIRCUITS CORPORATION
NOTES TO CONSOLIDATED FINANCIAL STATEMENTS—(Continued)
| March 31, | ||||||||
| 2010 | 2009 | |||||||
| Stock-based compensation |
27,088 | 24,042 | ||||||
| Other |
3,165 | 2,559 | ||||||
| Total deferred tax assets |
471,243 | 461,928 | ||||||
| Deferred tax liabilities: |
||||||||
| Depreciation and amortization |
(2,533 | ) | (3,152 | ) | ||||
| Intangible assets |
(824 | ) | (596 | ) | ||||
| Net deferred tax asset |
467,886 | 458,180 | ||||||
| Valuation allowance |
(467,886 | ) | (458,180 | ) | ||||
| $ | — | $ | — | |||||
| Deferred tax liability — goodwill amortization |
— | — | ||||||
| $ | — | $ | — | |||||
At March 31, 2010, the Company has federal and state research and development tax credit carryforwards of approximately $85.6 million and $49.0 million, respectively, which began to expire in the fiscal year ended March 31, 2010 unless previously utilized. The Company also has federal and state net operating loss carryforwards of approximately $993.3 million and $552.4 million, respectively, which will begin to expire in fiscal 2018 and fiscal 2013, respectively. Federal and state laws impose restrictions on the utilization of net operating loss and tax credit carryforwards in the event of an “ownership change” for tax purposes as defined by Section 382 of the Internal Revenue Code. The Company has completed a Section 382 analysis regarding the limitation of net operating loss and research and development tax credit carryforwards. There were no ownership changes identified.
As a result of the adoption of ASC 718-10, the Company recognizes tax benefits associated with the exercise of stock options directly to stockholders’ equity only when realized. Accordingly, deferred tax assets are not recognized for net operating loss carryforwards resulting from tax benefits occurring from April 1, 2006 onward. A windfall tax benefit occurs when the actual tax benefit realized upon an employee’s disposition of a share-based award exceeds the deferred tax asset, if any, associated with the award.
The Company has established a valuation allowance against its net deferred tax assets, due to uncertainty regarding their future realization. In assessing the realizability of its deferred tax assets, management considers the scheduled reversal of deferred tax liabilities, projected future taxable income, and tax planning strategies. Based on the projections for future taxable income over the periods in which the deferred tax assets are realizable and the full utilization of the Company’s loss carryback potential, management concluded that a full valuation allowance should be recorded in 2010, 2009 and 2008.
The Company adopted the provisions of ASC 740-10 as it relates to accounting for uncertainty in income taxes, on April 1, 2007. The adoption of ASC 740-10 was not material to the financial statements due to a full valuation allowance against deferred tax assets. The total amount of unrecognized tax benefits as of the date of adoption was $37.4 million, including interest and penalties.
F-31
Table of Contents
APPLIED MICRO CIRCUITS CORPORATION
NOTES TO CONSOLIDATED FINANCIAL STATEMENTS—(Continued)
The following is a tabular reconciliation of the Unrecognized Tax Benefits activity during the fiscal year ended March 31, 2010 (in thousands):
| Opening Balance |
$ | 38,580 | ||
| Gross decreases — tax positions in prior period |
(191 | ) | ||
| Gross increase — current-period tax positions |
585 | |||
| Settlements |
(255 | ) | ||
| Ending Balance |
$ | 38,719 | ||
If recognized, approximately $0.4 million of the $38.7 million of unrecognized tax benefits would affect the Company’s effective tax rate.
The Company recognizes interest accrued related to unrecognized tax benefits in interest expense and penalties in income tax expense. As of March 31, 2010, the Company has recognized $0.1 million of accrued interest and penalties related to uncertain tax positions.
The Company claimed federal research and development credit for qualified research expenditure incurred through December 31, 2009. No federal research and development tax credit is allowed for expenditures incurred after December 31, 2009 as the related statute allowing it has expired.
The Company is subject to taxation in the U.S. and various states and foreign jurisdictions. The Company is currently under audit by the North Carolina Department of Revenue for fiscal years 2006 to 2008.
Effectively, all of the Company’s historical tax years are subject to examination by the Internal Revenue Service and various state jurisdictions due to the generation of net operating loss and credit carryforwards. With few exceptions, the Company is no longer subject to foreign examinations by tax authorities for years before 2007.
The Company does not foresee significant changes to its unrecognized tax benefits within the next twelve months.
6. Restructuring Charges
The Company recognizes restructuring costs associated with exit or disposal activities when they are incurred rather than at the date of a commitment to an exit or disposal plan. Over the last several years, the Company has undertaken significant restructuring activities under several plans in an effort to reduce operating costs. A combined summary of the activity of the restructuring programs initiated by the Company is as follows (in thousands):
| Workforce Reduction |
Facilities Consolidation and Operating Lease Commitments |
Property and Equipment Impairments and Contract Cancellations |
Total | |||||||||||||
| Liability, March 31, 2008 |
$ | 725 | $ | 853 | $ | — | $ | 1,578 | ||||||||
| Charged to continuing operations |
5,850 | 792 | 2,359 | 9,001 | ||||||||||||
| Charged to discontinued operations |
126 | — | — | 126 | ||||||||||||
| Cash payments |
(3,745 | ) | (451 | ) | — | (4,196 | ) | |||||||||
| Non-cash charges |
(1,130 | ) | — | (859 | ) | (1,989 | ) | |||||||||
| Reductions to estimated liability |
(258 | ) | (120 | ) | — | (378 | ) | |||||||||
| Liability, March 31, 2009 |
$ | 1,568 | $ | 1,074 | $ | 1,500 | $ | 4,142 | ||||||||
F-32
Table of Contents
APPLIED MICRO CIRCUITS CORPORATION
NOTES TO CONSOLIDATED FINANCIAL STATEMENTS—(Continued)
| Workforce Reduction |
Facilities Consolidation and Operating Lease Commitments |
Property and Equipment Impairments and Contract Cancellations |
Total | |||||||||||||
| Charged to continuing operations |
666 | — | 359 | 1,025 | ||||||||||||
| Cash payments |
(1,687 | ) | (759 | ) | (1,500 | ) | (3,946 | ) | ||||||||
| Non-cash charges |
— | — | (359 | ) | (359 | ) | ||||||||||
| Reductions to estimated liability |
(154 | ) | (125 | ) | — | (279 | ) | |||||||||
| Liability, March 31, 2010 |
$ | 393 | $ | 190 | $ | — | $ | 583 | ||||||||
The following table provides detailed activity related to the restructuring programs as of March 31, 2010 (in thousands):
| Workforce Reduction |
Facilities Consolidation and Operating Lease Commitments |
Property and Equipment Impairments and Contract Cancellations |
Total | |||||||||||||
| Prior Fiscal Years’ Completed Restructuring Programs: |
||||||||||||||||
| Liability, March 31, 2008 |
$ | 725 | $ | 853 | $ | — | $ | 1,578 | ||||||||
| Charged to continuing operations |
1,163 | — | — | 1,163 | ||||||||||||
| Charged to discontinued operations |
126 | — | — | 126 | ||||||||||||
| Cash payments |
(1,605 | ) | (451 | ) | — | (2,056 | ) | |||||||||
| Non-cash charges |
(57 | ) | — | — | (57 | ) | ||||||||||
| Reductions to estimated liability |
(258 | ) | (120 | ) | — | (378 | ) | |||||||||
| Liability, March 31, 2009 |
$ | 94 | $ | 282 | $ | — | $ | 376 | ||||||||
| Cash payments |
— | (282 | ) | — | (282 | ) | ||||||||||
| Reductions to estimated liability |
(94 | ) | — | — | (94 | ) | ||||||||||
| Liability, March 31, 2010 |
$ | — | $ | — | $ | — | $ | — | ||||||||
| February 2009 Restructuring Program |
||||||||||||||||
| Charged to continuing operations |
$ | 4,687 | $ | 792 | $ | 2,359 | $ | 7,838 | ||||||||
| Cash payments |
(2,140 | ) | — | — | (2,140 | ) | ||||||||||
| Non-cash charges |
(1,073 | ) | — | (859 | ) | (1,932 | ) | |||||||||
| Liability, March 31, 2009 |
$ | 1,474 | $ | 792 | $ | 1,500 | $ | 3,766 | ||||||||
| Cash payments |
(1,414 | ) | (477 | ) | (1,500 | ) | (3,391 | ) | ||||||||
| Reductions to estimated liability |
(60 | ) | (125 | ) | — | (185 | ) | |||||||||
| Liability, March 31, 2010 |
$ | — | $ | 190 | $ | — | $ | 190 | ||||||||
| January 2010 Restructuring Program |
||||||||||||||||
| Charged to continuing operations |
$ | 666 | $ | — | $ | 359 | $ | 1,025 | ||||||||
| Cash payments |
(273 | ) | — | — | (273 | ) | ||||||||||
| Non-cash charges |
$ | — | — | (359 | ) | (359 | ) | |||||||||
| Liability, March 31, 2010 |
$ | 393 | $ | — | $ | — | $ | 393 | ||||||||
F-33
Table of Contents
APPLIED MICRO CIRCUITS CORPORATION
NOTES TO CONSOLIDATED FINANCIAL STATEMENTS—(Continued)
February 2009 Restructuring Program
The February 2009 restructuring program was implemented to reduce its expenses and excess capacity in response to the worsening economic conditions. The restructuring program consisted of the elimination of approximately 100 positions.
January 2010 Restructuring Program
The January 2010 restructuring program was implemented as part of the Company’s ongoing cost reduction efforts and to better align its global operations to achieve greater efficiencies. The Company moved some of its functions offshore, which will allow it to be much closer to its third party subcontract manufacturers, thus reducing costs by taking advantage of its global cost structure and improving efficiencies by eliminating the delays inherent in working in different time zones. The January 2010 restructuring plan includes eliminating or relocating 63 positions. As a result of the January 2010 restructuring program, the Company recorded a charge of $1.0 million, consisting of $0.6 million for employee severances and $0.4 million for an asset impairment. The Company expects to record additional charges for employee severances of approximately $0.4 million to $0.6 million during the fiscal year ended March 31, 2011.
7. Commitments
The Company leases certain of its facilities under long-term operating leases, which expire at various dates through the fiscal year ended March 31, 2013. The lease agreements frequently include renewal or other provisions, which require the Company to pay taxes, insurance, maintenance costs or defined rent increases. The Company also leases certain engineering design software tools under non-cancelable operating leases expiring through the fiscal year ended March 31, 2013. Other purchase commitments relate primarily to non-cancelable inventory purchase commitments.
The following table summarizes the Company’s contractual operating leases and other purchase commitments as of March 31, 2010 (in thousands):
| Operating Leases |
Other Purchase Commitments |
Total | |||||||
| Fiscal Years Ending March 31, 2011 |
$ | 9,183 | $ | 21,819 | $ | 31,002 | |||
| 2012 |
2,310 | — | 2,310 | ||||||
| 2013 |
2,080 | — | 2,080 | ||||||
| 2014 |
31 | — | 31 | ||||||
| 2015 and thereafter |
— | — | — | ||||||
| Total minimum payments |
$ | 13,604 | $ | 21,819 | $ | 35,423 | |||
The amount in the table above does not include an estimated $0.5 million as it relates to accounting for uncertainty in income taxes.
The Company did not have any off balance sheet arrangements at March 31, 2010.
Rent expense (including short-term leases and net of sublease income) for the years ended March 31, 2010, 2009, and 2008 was $3.0 million, $3.1 million, and $2.9 million, respectively.
F-34
Table of Contents
APPLIED MICRO CIRCUITS CORPORATION
NOTES TO CONSOLIDATED FINANCIAL STATEMENTS—(Continued)
8. Employee Retirement Plan
Effective January 1, 1986, the Company established a 401(k) defined contribution retirement plan (“Retirement Plan”) covering all full-time employees. The Retirement Plan provides for voluntary employee contributions from 1% to 20% of annual compensation, subject to a maximum limit allowed by Internal Revenue Service guidelines. The Company may contribute such amounts as determined by the Board. Employer contributions vest to participants at a rate of 33% per year of service. The total contributions under the plan charged to operations totaled zero, $0.7 million, and $1.0 million for the fiscal years ended March 31, 2010, 2009 and 2008, respectively.
9. Significant Customer and Geographic Information
Based on direct shipments, net revenues to customers that was equal to or greater than 10% of total net revenues in any of the three fiscal years ended March 31, 2010 were as follows:
| 2010 | 2009 | 2008 | |||||||
| Avnet (distributor) |
30 | % | 25 | % | 26 | % | |||
| Hon Hai (sub-contract manufacturer) |
13 | % | * | 10 | % |
| * | Less than 10% of total net revenues for period indicated. |
Net revenues by geographic region were as follows (in thousands):
| Fiscal Years Ended March 31, | |||||||||
| 2010 | 2009 | 2008 | |||||||
| United States of America |
$ | 68,817 | $ | 63,619 | $ | 54,842 | |||
| Other North America |
7,355 | 16,678 | 23,443 | ||||||
| Europe |
35,372 | 34,108 | 28,154 | ||||||
| Asia |
92,859 | 98,777 | 86,609 | ||||||
| Other |
1,195 | 1,034 | 1,067 | ||||||
| $ | 205,598 | $ | 214,216 | $ | 194,115 | ||||
As of March 31, 2010 and 2009, long-lived assets, which represent property, plant and equipment, goodwill and intangible assets, net of accumulated depreciation and amortization, located outside the Americas were not material.
10. Contingencies
Legal Proceedings
The Company acquired JNI Corporation (“JNI”) in October 2003. In November 2001, a class action lawsuit was filed against JNI and the underwriters of its initial and secondary public offerings of common stock in the U.S. District Court for the Southern District of New York, case no. 01 Civ 10740 (SAS). The complaint alleges that defendants violated the Securities Exchange Act of 1934, as amended (the “Exchange Act”), in connection with JNI’s public offerings. This lawsuit is among more than 300 class action lawsuits pending in this District Court that have come to be known as the “IPO laddering cases.” In re Initial Public Offering Securities Litigation, No. 21 MC 92 (SAS), a settlement has been reached in all of the cases. On October 6, 2009, the Court issued an order granting final approval of the settlement and dismissing the case. The Court subsequently issued
F-35
Table of Contents
APPLIED MICRO CIRCUITS CORPORATION
NOTES TO CONSOLIDATED FINANCIAL STATEMENTS—(Continued)
a final judgment. Several appeals of the settlement and judgment were filed between October 29 and November 4, 2009. Should the settlement be overturned on appeal and the final approval vacated, the Company’s liability, if any, could not be reasonably estimated at this time.
In 1993, the Company was named as a (“PRP”) along with more than 100 other companies that used Omega Chemical Corporation waste treatment facility in Whittier, California. The Company is a member of a large group of PRPs, known as the Omega Chemical Site PRP Organized Group (“OPOG”), that has agreed to fund certain on-going remediation efforts at the Omega site. The U.S. Environmental Protection Agency (“EPA”) has alleged that Omega failed to properly treat and dispose of certain hazardous waste materials. On February 26, 2001 the U.S. District Court for the Central District of California approved a consent decree between the EPA and OPOG to study contamination and evaluate cleanup options at the Omega site. Under the terms of the consent decree, EPA agreed to supervise OPOG’s soil remedial investigation and feasibility study, groundwater treatment design and the installation of three groundwater monitoring wells downgradient from the Omega site. On January 22, 2009, the District Court ordered that the first and second amendments to the consent decree be entered and made part of the consent decree. The First Amendment expanded the scope of work to mitigate volatile organic compounds affecting indoor air quality at a roller rink neighboring the Omega site, and, the Second Amendment added settling parties to the consent decree.
On November 7, 2007, Angeles Chemical Company filed Angeles Chemical Company, Inc. et al. v. Omega Chemical PRP Group, LLC, et al., in the U.S. District Court for the Central District of California against OPOG for cost recovery and indemnification for future response costs resulting from an alleged regional groundwater contamination plume originating at the Omega site. On March 27, 2008, the Court granted OPOG’s motion to stay the action pending EPA’s determination of how to investigate and remediate the regional groundwater.
11. Sale of the 3ware Storage Adapter Business to LSI Corporation
On April 5, 2009, the Company entered into a Purchase Agreement with LSI Corporation (“LSI”). Under the Purchase Agreement, the Company agreed to sell to LSI substantially all of the operating assets (other than patents) primarily used or held for use in its 3ware storage adapter business (the “Storage Business”) but retaining certain assets, including patents, cash, accounts receivable and accounts payable, even if related to the Storage Business (the “Transaction”). The assets sold included customer contracts, inventory, fixed assets, certain intellectual property and other assets, as well as rights to the name “3ware.”
The Company completed the Transaction on April 21, 2009. After adjustments for the level of inventory of $0.7 million and products in the channel of $0.8 million, the final adjusted price of the Transaction was approximately $21.5 million for a gain of $11.4 million. During the fiscal year ended March 31, 2010, the Company and LSI reached an agreement to end the warranty support portion of the Purchase Agreement. As a result of the Transaction, the Company decreased its number of full-time employees by 56.
As part of the Transaction, the Company entered into an intellectual property agreement, a transition services agreement, which was completed by the fiscal year ended March 31, 2010, and a master procurement agreement with LSI. These agreements are not material to the Company’s financial condition and operating results and do not constitute a significant continuing involvement with the Storage Business.
The Company has reclassified the financial results of the 3ware storage adapter business as discontinued operations for all periods presented.
F-36
Table of Contents
APPLIED MICRO CIRCUITS CORPORATION
NOTES TO CONSOLIDATED FINANCIAL STATEMENTS—(Continued)
During the fiscal year ended March 31, 2010, the Company recognized a tax charge of approximately $4.2 million to discontinued operations in connection with the sale of the Company’s 3ware storage adapter business and concurrently recorded the same amount as an income tax benefit to continuing operations.
12. Veloce
On May 17, 2009, the Company entered into agreements with Veloce pursuant to which Veloce has agreed to perform product development work for the Company on an exclusive basis for up to five years for cash and other consideration, including a warrant to purchase shares of the Company’s common stock, which will vest upon the achievement of both certain performance and time-based milestones.
The Company has determined that Veloce, a California corporation, is a VIE by evaluating the sufficiency of the entity’s equity investment at risk to absorb losses and the Company’s share of respective expected losses and determined that the Company is the primary beneficiary of the VIE. The Company has included the accounts of Veloce in the consolidated financial statements and all significant intercompany balances and transactions have been eliminated in consolidation.
Under the merger agreement between the Company and Veloce, which has been approved by Veloce’s Board of Directors and stockholders, the Company also agreed to acquire Veloce if certain performance milestones and delivery schedules set forth under the merger and other agreements are achieved. The Company also has the unilateral option to acquire Veloce in the event Veloce fails to meet the milestones and delivery schedules. Should the Company acquire Veloce pursuant to the merger agreement, the purchase price payable by the Company is estimated to be in the range of approximately $5 million up to approximately $100 million, subject to adjustments. The final price would be based upon the achievement and timing of achieving multiple performance milestones and currently is not determinable. The form of consideration used for the merger, cash or the Company’s stock, would be determined by the Company at the time of the merger. The merger agreement contains customary representations, warranties and covenants and may be terminated upon mutual agreement of the parties or unilaterally by the Company or Veloce if the other party fails to meet certain conditions set forth in the agreement. The agreements permit the Company to appoint one individual to serve on Veloce’s Board of Directors and Board committees. The Company’s chief executive officer has been appointed to Veloce’s Board of Directors and as of the fiscal year ended March 31, 2010, the performance milestones and delivery schedules set forth under the merger and other agreements have not been achieved.
In addition, the Company has provided Veloce a promissory note of $1.5 million to be forgiven over eight quarters starting on March 31, 2011. If Veloce commits a material breach of the merger agreement, the outstanding principal amount of the note and accrued interest is due to the Company. If the Company commits a material breach of the merger agreement, the outstanding principal amount of the note and accrued interest is to be forgiven by the Company. The $1.5 million promissory note is eliminated in consolidation. The Company will pay Veloce $1.5 million per quarter for up to twelve consecutive quarters in order to assist Veloce in meeting its expenses to perform its obligations under the agreement and the Company will recognize the payments as research and development expenses when such operating costs have been incurred by Veloce. During the fiscal year ended March 31, 2010, the Company has recognized $6.2 million as research and development expenses.
13. Quarterly Financial Information (unaudited)
The following table sets forth unaudited consolidated statements of operations data for each of the Company’s last eight quarters. This quarterly information is unaudited and has been prepared on the same basis as the annual consolidated financial statements. In the Company’s opinion, this quarterly information reflects all adjustments necessary for a fair presentation of the periods presented. The operating results for any quarter are not necessarily indicative of results for any future period.
F-37
Table of Contents
APPLIED MICRO CIRCUITS CORPORATION
NOTES TO CONSOLIDATED FINANCIAL STATEMENTS—(Continued)
| Fiscal Year 2010 | Fiscal Year 2009 | |||||||||||||||||||||||||||||||
| Q1(1) | Q2(2) | Q3 | Q4 | Q1 | Q2 | Q3(3) | Q4 | |||||||||||||||||||||||||
| (In thousands, except per share data) | ||||||||||||||||||||||||||||||||
| Net revenues |
$ | 45,052 | $ | 49,232 | $ | 53,704 | $ | 57,610 | $ | 61,199 | $ | 64,290 | $ | 47,726 | $ | 41,001 | ||||||||||||||||
| Cost of revenues |
22,175 | 23,796 | 24,173 | 22,787 | 28,426 | 28,576 | 22,226 | 21,842 | ||||||||||||||||||||||||
| Gross profit |
22,877 | 25,436 | 29,531 | 34,823 | 32,773 | 35,714 | 25,500 | 19,159 | ||||||||||||||||||||||||
| Total operating expenses |
30,784 | 33,699 | 36,058 | 38,222 | 35,395 | 36,281 | 254,862 | 44,071 | ||||||||||||||||||||||||
| Operating loss |
(7,907 | ) | (8,263 | ) | (6,527 | ) | (3,399 | ) | (2,622 | ) | (567 | ) | (229,362 | ) | (24,912 | ) | ||||||||||||||||
| Interest and other income (expense) |
1,589 | (3,425 | ) | 1,619 | 2,106 | (1,327 | ) | (550 | ) | (7,397 | ) | 1,693 | ||||||||||||||||||||
| Loss from continuing operations before income taxes |
(6,318 | ) | (11,688 | ) | (4,908 | ) | (1,293 | ) | (3,949 | ) | (1,117 | ) | (236,759 | ) | (23,219 | ) | ||||||||||||||||
| Income tax expense (benefit) |
(3,519 | ) | (3,617 | ) | (2,248 | ) | (1,226 | ) | 502 | 403 | (4,396 | ) | (455 | ) | ||||||||||||||||||
| Loss from continuing operations |
(2,799 | ) | (8,071 | ) | (2,660 | ) | (67 | ) | (4,451 | ) | (1,520 | ) | (232,363 | ) | (22,764 | ) | ||||||||||||||||
| Income (loss) from discontinued operations |
5,697 | 1,347 | (934 | ) | 2 | (723 | ) | (793 | ) | (42,097 | ) | (4,622 | ) | |||||||||||||||||||
| Net income (loss) |
$ | 2,898 | $ | (6,724 | ) | $ | (3,594 | ) | $ | (65 | ) | $ | (5,174 | ) | $ | (2,313 | ) | $ | (274,460 | ) | $ | (27,386 | ) | |||||||||
| Basic income (loss) per share: |
||||||||||||||||||||||||||||||||
| Loss per share from continuing operations |
$ | (0.04 | ) | $ | (0.12 | ) | $ | (0.04 | ) | $ | (0.00 | ) | $ | (0.07 | ) | $ | (0.03 | ) | $ | (3.55 | ) | $ | (0.35 | ) | ||||||||
| Income (loss) per share from discontinued operations |
0.08 | 0.02 | (0.01 | ) | (0.00 | ) | (0.01 | ) | (0.01 | ) | (0.65 | ) | (0.07 | ) | ||||||||||||||||||
| Net income (loss) per share |
$ | 0.04 | $ | (0.10 | ) | $ | (0.05 | ) | $ | (0.00 | ) | $ | (0.08 | ) | $ | (0.04 | ) | $ | (4.20 | ) | $ | (0.42 | ) | |||||||||
| Shares used in calculating basic net income (loss) per share |
66,070 | 66,469 | 66,139 | 65,345 | 64,864 | 65,150 | 65,366 | 65,703 | ||||||||||||||||||||||||
| Diluted income (loss) per share: |
||||||||||||||||||||||||||||||||
| Loss per share from continuing operations |
$ | (0.04 | ) | $ | (0.12 | ) | $ | (0.04 | ) | $ | (0.00 | ) | $ | (0.07 | ) | $ | (0.03 | ) | $ | (3.55 | ) | $ | (0.35 | ) | ||||||||
| Income (loss) per share from discontinued operations |
0.08 | 0.02 | (0.01 | ) | (0.00 | ) | (0.01 | ) | (0.01 | ) | (0.65 | ) | (0.07 | ) | ||||||||||||||||||
| Net income (loss) per share |
$ | 0.04 | $ | (0.10 | ) | $ | (0.05 | ) | $ | (0.00 | ) | $ | (0.08 | ) | $ | (0.04 | ) | $ | (4.20 | ) | $ | (0.42 | ) | |||||||||
| Shares used in calculating diluted net income (loss) per share |
66,733 | 66,469 | 66,139 | 65,345 | 64,864 | 65,150 | 65,366 | 65,703 | ||||||||||||||||||||||||
| (1) | The consolidated operating results for the first quarter of fiscal 2010 included a $0.2 million impairment of marketable securities. Discontinued operations for the first quarter of fiscal 2010 included a gain of $10.7 million on the sale of the 3ware storage adapter business to LSI Corporation. |
| (2) | The consolidated operating results for the second quarter of fiscal 2010 included a $3.1 million impairment of marketable securities and a $2.0 million impairment of a strategic equity investment. Discontinued operations for the second quarter of fiscal 2010 included an additional gain of $0.7 million on the settlement to end the warranty support portion of the 3ware storage adapter business Purchase Agreement with LSI Corporation. |
| (3) | The consolidated operating results for the third quarter of fiscal 2009 included a $223.0 million goodwill impairment charge, $1.0 million restructuring charge, $10.1 million impairment of marketable securities and $4.4 million reversal of deferred tax liabilities as a result of the goodwill impairment, for financial reporting purposes, on tax deductible goodwill which had only been amortized for tax purposes in connection with the acquisition of assets and licensed intellectual property related to IBM’s Power PRS Switch Fabric line which we acquired in September 2003. Discontinued operations for the third quarter of fiscal 2009 included a $41.1 million goodwill impairment charge and $0.1 million restructuring charge. |
F-38
Table of Contents
SCHEDULE II — VALUATION AND QUALIFYING ACCOUNTS
| Description |
Balance at Beginning of Period |
Charged (Credited) to Costs and Expenses |
Charged
to Other Accounts |
Deductions | Balance at End of Period | |||||||||||
| (In thousands) | ||||||||||||||||
| Year ended March 31, 2010: |
||||||||||||||||
| Allowance for doubtful accounts |
$ | 1,151 | $ | (404 | ) | $ | — | $ | 32 | $ | 715 | |||||
| Year ended March 31, 2009: |
||||||||||||||||
| Allowance for doubtful accounts |
$ | 1,313 | $ | (68 | ) | $ | — | $ | 94 | $ | 1,151 | |||||
| Year ended March 31, 2008: |
||||||||||||||||
| Allowance for doubtful accounts |
$ | 1,558 | $ | — | $ | — | $ | 245 | $ | 1,313 | ||||||
F-39
Table of Contents
Exhibit Index
| 2.1(12)+ |
Agreement and Plan of Merger between the Company, Espresso Acquisition Corporation and Veloce Technologies, Inc., dated May 17, 2009. | |
| 3.1(1) |
Amended and Restated Certificate of Incorporation of the Company. | |
| 3.2(2) |
Amended and Restated Bylaws of the Company. | |
| 3.3(17) |
Certificate of Amendment of Amended and Restated Certificate of Incorporation of the Company. | |
| 4.1(3) |
Specimen Stock Certificate. | |
| 10.1(3)* |
Form of Indemnification Agreement between the Company and each of its officers and directors. | |
| 10.2(16)* |
Form of Restricted Stock Unit Agreement under the 1992 Equity Incentive Plan. | |
| 10.3(16)* |
Form of Option Agreement under the 1992 Equity Incentive Plan. | |
| 10.4(16)* |
1992 Equity Incentive Plan. | |
| 10.5(11)* |
1997 Directors’ Stock Option Plan, as amended, and form of Option Agreement. | |
| 10.6(3)* |
401(k) Plan effective April 1, 1985 and form of Enrollment Agreement. | |
| 10.24(5)* |
1998 Employee Stock Purchase Plan and form of Subscription Agreement. | |
| 10.30(6) |
Lease of Engineering Building by and between Kilroy Realty, L.P. and the Company dated February 17, 1999. | |
| 10.32(9) |
Amendment No. 1 to Lease of Engineering Building by and between Kilroy Realty, L.P. and the Company dated November 30, 1999. | |
| 10.33(4)* |
2000 Equity Incentive Plan, as amended, and form of Option Agreement. | |
| 10.34(16)* |
Form of Restricted Stock Unit Agreement under the 2000 Equity Incentive Plan. | |
| 10.35(7) |
Lease of Facilities in Andover, Massachusetts between 200 Minuteman Limited Partnership and Registrant dated September 13, 2000. | |
| 10.38(4)* |
AMCC Deferred Compensation Plan. | |
| 10.42(10)+ |
Patent License Agreement between the Company and IBM dated September 28, 2003. | |
| 10.43(10)+ |
Intellectual Property Agreement between the Company and IBM dated September 28, 2003. | |
| 10.53(14)* |
Offer of Employment dated September 14, 2005 by and between the Company and Robert Gargus. | |
| 10.58(15)* |
Executive Severance Benefit Plan dated September 19, 2007. | |
| 10.60(18)+ |
Qualcomm Patent Purchase Agreement dated July 11, 2008. | |
| 10.61(18)+ |
Qualcomm Patent Purchase Amendment dated July 11, 2008. | |
| 10.62(19) |
LSI Asset Purchase Agreement dated April 5, 2009 and Amendment No. 1 dated April 20, 2009. | |
| 10.63(13)+* |
Consulting Agreement with Cynthia J. Moreland entered into on October 21, 2009. | |
| 10.64(14)+* |
Letter Agreement with Cynthia J. Moreland entered into on December 18, 2009. | |
| 11.1(8) |
Computation of Per Share Data under ASC Topic 260-10. | |
| 21.1 |
Subsidiaries of the Registrant. | |
| 23.1 |
Consent of Independent Registered Public Accounting Firm - KPMG LLP. | |
| 23.2 |
Consent of Independent Registered Public Accounting Firm - Ernst & Young LLP. | |
| 24.1 |
Power of Attorney. Reference is made to the signature page of this Annual Report. | |
| 31.1 |
Certification of Chief Executive Officer pursuant to Rule 13a-14(a) and Rule 15d-14(a) of the Securities Exchange Act, as amended. | |
| 31.2 |
Certification of Chief Financial Officer pursuant to Rule 13a-14(a) and Rule 15d-14(a) of the Securities Exchange Act, as amended. | |
| 32.1 |
Certification of Chief Executive Officer pursuant to 18 U.S.C. 1350, as adopted pursuant to Section 906 of the Sarbanes-Oxley Act of 2002. | |
| 32.2 |
Certification of Chief Financial Officer pursuant to 18 U.S.C. 1350, as adopted pursuant to Section 906 of the Sarbanes-Oxley Act of 2002. | |
Table of Contents
| * | Management contract or compensatory plan. |
| + | The Company has been granted confidential treatment for certain portions of these agreements and certain terms and conditions have been redacted from the exhibits. Omitted portions have been filed separately with the SEC. |
| (1) | Incorporated by reference to Exhibit 3.2 filed with the Company’s Registration Statement (No. 333-37609) filed October 10, 1997, and as amended by Exhibit 3.3 filed with the Company’s Registration Statement (No. 333-45660) filed September 12, 2000 and Exhibit 3.1 filed with the Company’s Current Report on Form 8-K filed on December 11, 2007. |
| (2) | Incorporated by reference to Exhibit 3.1 filed with the Company’s Current Report on Form 8-K filed on May 1, 2009. |
| (3) | Incorporated by reference to identically numbered exhibit filed with the Company’s Registration Statement (No. 333-37609) filed October 10, 1997, or with any amendments thereto, which registration statement became effective November 24, 1997. |
| (4) | Incorporated by reference to identically numbered exhibit filed with the Company’s Quarterly Report on Form 10-Q (No. 000-23193) for the quarter ended June 30, 2002. |
| (5) | Incorporated by reference to identically numbered exhibit filed with the Company’s Annual Report on Form 10-K (No. 000-23193) for the year ended March 31, 2001. |
| (6) | Incorporated by reference to identically numbered exhibit filed with the Company’s Annual Report on Form 10-K (No. 000-23193) for the year ended March 31, 1999. |
| (7) | Incorporated by reference to identically numbered exhibit filed with the Company’s Quarterly Report on Form 10-Q (No. 000-23193) for the quarter ended September 30, 2000. |
| (8) | The Computation of Per Share Data under ASC Topic 260-10 is included in the Notes to the Consolidated Financial Statements included in this Annual Report. |
| (9) | Incorporated by reference to identically numbered exhibit filed with the Company’s Annual Report on Form 10-K (No. 000-23193) for the year ended March 31, 2000. |
| (10) | Incorporated by reference to identically numbered exhibit filed with the Company’s Quarterly Report on Form 10-Q (No. 000-23193) for the quarter ended September 30, 2003. |
| (11) | Effective March 31, 2005, our Board of Directors terminated our 1997 Directors’ Stock Option Plan (the “Directors Plan”). The Directors Plan provided for the automatic grant of stock options to our non-employee directors upon initial election to the Board of Directors and annually thereafter. The termination of the Directors Plan will not affect any stock options previously granted pursuant to the Directors Plan. |
| (12) | Incorporated by reference to identically numbered exhibit filed with the Company’s Quarterly Report on Form 10-Q/A for the quarter ended June 30, 2009. Schedules have been omitted pursuant to Item 601(b)(2) of Regulation S-K. The Company has furnished supplementally to the SEC copies of each of the omitted schedules. |
| (13) | Incorporated by reference as Exhibit 10.1 filed with the Company’s Quarterly Report on Form 10-Q for the quarter ended December 31, 2009. |
| (14) | Incorporated by reference as Exhibit 10.2 filed with the Company’s Quarterly Report on Form 10-Q for the quarter ended December 31, 2009. |
| (15) | Incorporated by reference to Exhibit 99.1 filed with the Company’s Current Report on Form 8-K filed September 24, 2007 |
| (16) | Incorporated by reference to identically numbered exhibit filed with the Company’s Annual Report on Form 10-K for the year ended March 31, 2007. |
| (17) | Incorporated by reference to Exhibit 3.1 filed with the Company’s Current Report on Form 8-K filed on December 11, 2007. |
| (18) | Incorporated by reference to identically numbered exhibit filed with the Company’s Quarterly Report on Form 10-Q for the quarter ended September 30, 2008. |
| (19) | Incorporated by reference to identically numbered exhibit filed with the Company’s Annual Report on Form 10-K for the year ended March 31, 2009. |