UNITED STATES
SECURITIES AND EXCHANGE COMMISSION
Washington, D.C. 20549
FORM 8-K
CURRENT REPORT
Pursuant to Section 13 or 15(d) of
the
Securities Exchange Act of 1934
Date of Report (Date of earliest event reported): May 10, 2010
MB FINANCIAL, INC.
(Exact name of registrant as specified in its charter)
|
Maryland |
|
0-24566-01 |
|
36-4460265 |
|
(State or other jurisdiction |
|
(Commission File No.) |
|
(IRS Employer |
|
of incorporation) |
|
|
|
Identification No.) |
800 West Madison Street, Chicago, Illinois 60607
(Address of principal executive offices) (Zip Code)
Registrant’s telephone number, including area code: (888) 422-6562
N/A
(Former name or former address, if changed since last report)
Check the appropriate box below if the Form 8-K filing is intended to simultaneously satisfy the filing obligation of the registrant under any of the following provisions:
o Written communications pursuant to Rule 425 under the Securities Act (17 CFR 230.425)
o Soliciting material pursuant to Rule 14a-12 under the Exchange Act (17 CFR 240.14a-12)
o Pre-commencement communications pursuant to Rule 14d-2(b) under the Exchange Act (17 CFR 240.14d-2(b))
o Pre-commencement communications pursuant to Rule 13e-4(c) under the Exchange Act (17CFR 240.13e-4(c))
Item 7.01. Regulation FD Disclosure
Forward-Looking Statements
When used in this Current Report on Form 8-K and in other reports filed with or furnished to the Securities and Exchange Commission, in press releases or other public shareholder communications, or in oral statements made with the approval of an authorized executive officer, the words or phrases “believe,” “will,” “should,” “will likely result,” “are expected to,” “will continue” “is anticipated,” “estimate,” “project,” “plans,” or similar expressions are intended to identify “forward-looking statements” within the meaning of the Private Securities Litigation Reform Act of 1995. You are cautioned not to place undue reliance on any forward-looking statements, which speak only as of the date made. These statements may relate to our future financial performance, strategic plans or objectives, revenues or earnings projections, or other financial items. By their nature, these statements are subject to numerous uncertainties that could cause actual results to differ materially from those anticipated in the statements.
Important factors that could cause actual results to differ materially from the results anticipated or projected include, but are not limited to, the following: (1) expected cost savings, synergies and other benefits from our merger and acquisition activities might not be realized within the anticipated time frames or at all, and costs or difficulties relating to integration matters, including but not limited to customer and employee retention, might be greater than expected; (2) the possibility that the expected benefits of the Broadway Bank, New Century Bank and other FDIC-assisted transactions we previously completed will not be realized, and the possibility that the amount of the gains, if any, we ultimately realize on these transactions will differ materially from any recorded preliminary gains; (3) the credit risks of lending activities, including changes in the level and direction of loan delinquencies and write-offs and changes in estimates of the adequacy of the allowance for loan losses, which could necessitate additional provisions for loan losses, resulting both from loans we originate and loans we acquire from other financial institutions; (4) results of examinations by the Office of Comptroller of Currency and other regulatory authorities, including the possibility that any such regulatory authority may, among other things, require us to increase our allowance for loan losses or write-down assets; (5) competitive pressures among depository institutions; (6) interest rate movements and their impact on customer behavior and net interest margin; (7) the impact of repricing and competitors’ pricing initiatives on loan and deposit products; (8) fluctuations in real estate values; (9) the ability to adapt successfully to technological changes to meet customers’ needs and developments in the market place; (10) our ability to realize the residual values of our direct finance, leveraged, and operating leases; (11) our ability to access cost-effective funding; (12) changes in financial markets; (13) changes in economic conditions in general and in the Chicago metropolitan area in particular; (14) the costs, effects and outcomes of litigation; (15) new legislation or regulatory changes, including but not limited to changes in federal and/or state tax laws or interpretations thereof by taxing authorities, changes in laws, rules or regulations applicable to companies that have participated in the TARP Capital Purchase Program of the U.S. Department of the Treasury and other governmental initiatives affecting the financial services industry; (16) changes in accounting principles, policies or guidelines; (17) our future acquisitions of other depository institutions or lines of business; and (18) future goodwill impairment due to changes in our business, changes in market conditions, or other factors.
MB Financial does not undertake any obligation to update any forward-looking statement to reflect circumstances or events that occur after the date on which the forward-looking statement is made.
Set forth below are investor presentation materials.
|
|
Investor Presentation May 2010 |

|
|
1 When used in this presentation and in filings with the Securities and Exchange Commission, in other press releases or other public shareholder communications, or in oral statements made with the approval of an authorized executive officer, the words or phrases “believe,” “will,” “should,” “will likely result,” “are expected to,” “will continue,” “is anticipated,” “estimate,” “project,” “plans,” or similar expressions are intended to identify “forward-looking statements” within the meaning of the Private Securities Litigation Reform Act of 1995. You are cautioned not to place undue reliance on any forward-looking statements, which speak only as of the date made. These statements may re late to our future financial performance, strategic plans or objectives, revenues or earnings projections, or other financial items. By their nature, these statements are subject to numerous uncertainties that could cause actual results to differ materially from those anticipated in the statements. Important factors that could cause actual results to differ materially from the results anticipated or projected include, but are not limited to, the following: (1) expected cost savings, synergies and other benefits from our merger and acquisition activities might not be realized within the anticipated time frames or at all, and costs or difficulties relating to integration matters, including but not limited to customer and employee retention, might be greater than expected; (2) the possibility that the expected benefits of the Broadway Bank, New Century Bank and other FDIC-assisted transactions we previously completed will not be realized, and the possibility that the amount of the gains, if any, we ultimately realize on these transactions will differ materially from any recorded preliminary gains; (3) the credit risks of lending activities, including changes in the level and direction of loan delinquencies and write-offs and changes in estimates of the adequacy of the allowance for loan losses, which could necessitate additional provisions for loan losses, resulting both from loans we originate and loans we acquire from other financial institutions; (4) results of examinations by the Office of Comptroller of Currency and other regulatory authorities, including the possibility that any such regulatory authority may, among other things, require us to increase our allowance for loan losses or write-down assets; (5) competitive pressures among depository institutions; (6) interest rate movements and their impact on customer behavior and net interest margin; (7) the impact of repricing and competitors’ pricing initiatives on loan and deposit products; (8) fluctuations in real estate values; (9) the ability to adapt successfully to technological changes to meet customers’ needs and developments in the market place; (10) our ability to realize the residual values of our direct finance, leveraged, and operating leases; (11) our ability to access cost-effective funding; (12) changes in financial markets; (13) changes in economic conditions in general and in the Chicago metropolitan area in particular; (14) the costs, effects and outcomes of litigation; (15) new legislation or regulatory changes, including but not limited to changes in federal and/or state tax laws or interpretations thereof by taxing authorities, changes in laws, rules or regulations applicable to companies that have participated in the TARP Capital Purchase Program of the U.S. Department of the Treasury and other governmental initiatives affecting the financial services industry; (16) changes in accounting principles, policies or guidelines; (17) our future acquisitions of other depository institutions or lines of business; and (18) future goodwill impairment due to changes in our business, changes in market conditions, or other factors. MB Financial does not undertake any obligation to update any forward-looking statement to reflect circumstances or events that occur after the date on which the forward-looking statement is made. Forward Looking Statements |
|
|
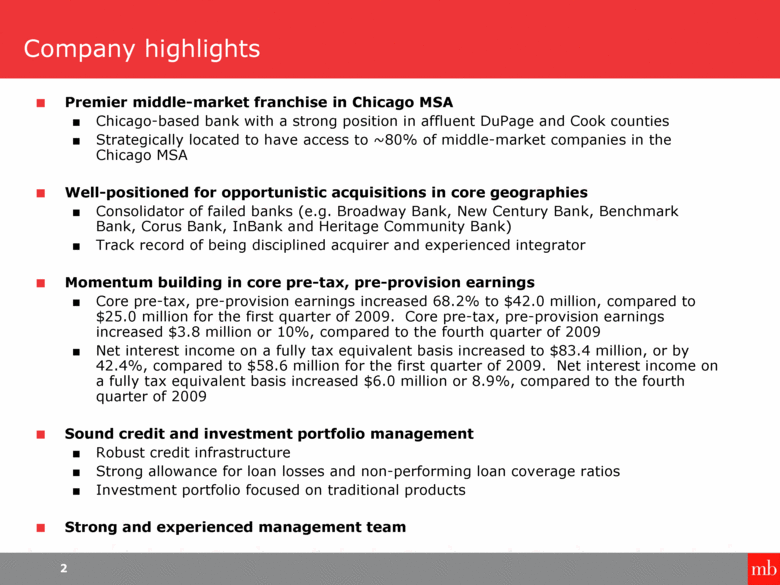
2 Company highlights Premier middle-market franchise in Chicago MSA Chicago-based bank with a strong position in affluent DuPage and Cook counties Strategically located to have access to ~80% of middle-market companies in the Chicago MSA Well-positioned for opportunistic acquisitions in core geographies Consolidator of failed banks (e.g. Broadway Bank, New Century Bank, Benchmark Bank, Corus Bank, InBank and Heritage Community Bank) Track record of being disciplined acquirer and experienced integrator Momentum building in core pre-tax, pre-provision earnings Core pre-tax, pre-provision earnings increased 68.2% to $42.0 million, compared to $25.0 million for the first quarter of 2009. Core pre-tax, pre-provision earnings increased $3.8 million or 10%, compared to the fourth quarter of 2009 Net interest income on a fully tax equivalent basis increased to $83.4 million, or by 42.4%, compared to $58.6 million for the first quarter of 2009. Net interest income on a fully tax equivalent basis increased $6.0 million or 8.9%, compared to the fourth quarter of 2009 Sound credit and investment portfolio management Robust credit infrastructure Strong allowance for loan losses and non-performing loan coverage ratios Investment portfolio focused on traditional products Strong and experienced management team |
|
|
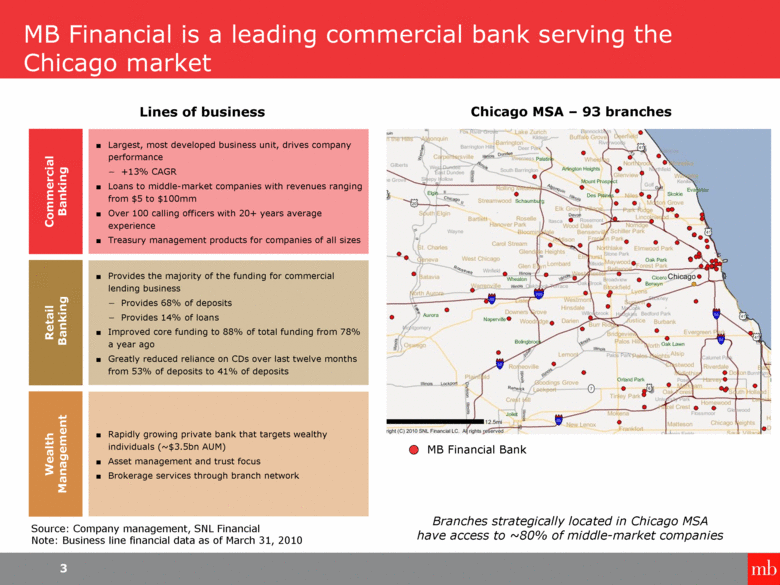
3 Provides the majority of the funding for commercial lending business . Provides 68% of deposits . Provides 14% of loans Improved core funding to 88% of total funding from 78% a year ago Greatly reduced reliance on CDs over last twelve months from 53% of deposits to 41% of deposits Retail Banking Rapidly growing private bank that targets wealthy individuals (~$3.5bn AUM) Asset management and trust focus Brokerage services through branch network Wealth Management Largest, most developed business unit, drives company performance . +13% CAGR Loans to middle-market companies with revenues ranging from $5 to $100mm Over 100 calling officers with 20+ years average experience Treasury management products for companies of all sizes Commercial Banking Lines of business Chicago MSA – 93 branches Branches strategically located in Chicago MSA have access to ~80% of middle-market companies Source: Company management, SNL Financial Note: Business line financial data as of Marc h 31, 2010 MB Financial is a leading commercial bank serving the Chicago market MB Financial Bank |
|
|
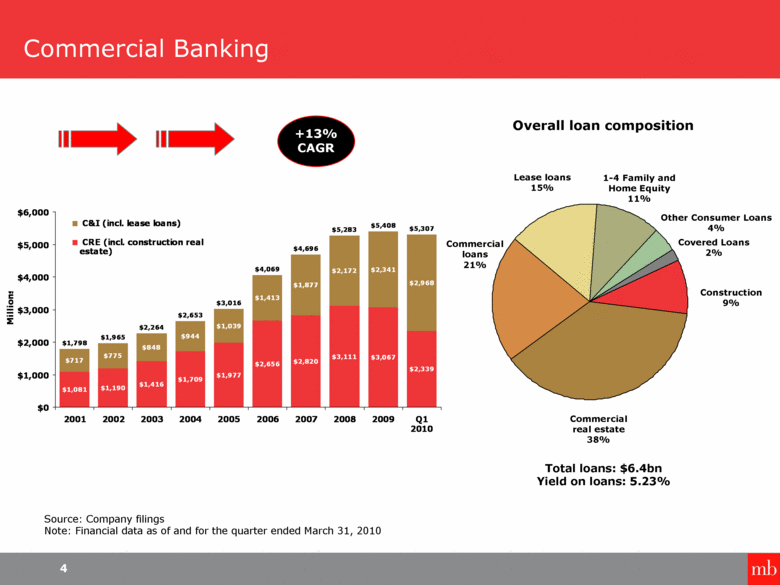
4 Commercial Banking $1,081 $1,190 $1,416 $1,709 $1,977 $2,656 $2,820 $3,111 $3,067 $2,339 $717 $775 $848 $944 $1,039 $1,413 $1,877 $2,172 $2,341 $2,968 $1,798 $1,965 $2,264 $2,653 $3,016 $4,069 $4,696 $5,283 $5,408 $5,307 $0 $1,000 $2,000 $3,000 $4,000 $5,000 $6,000 2001 2002 2003 2004 2005 2006 2007 2008 2009 Q1 2010 Millions C&I (incl. lease loans) CRE (incl. construction real estate) Source: Company filings Note: Financial data as of and for the quarter ended March 31, 2010 - +13% CAGR Total loans: $6.4bn Yield on loans: 5.23% Overall loan composition Lease loans 15% Covered Loans 2% Construction 9% Commercial real estate 38% Commercial loans 21% 1-4 Family and Home Equity 11% Other Consumer Loans 4% |
|
|
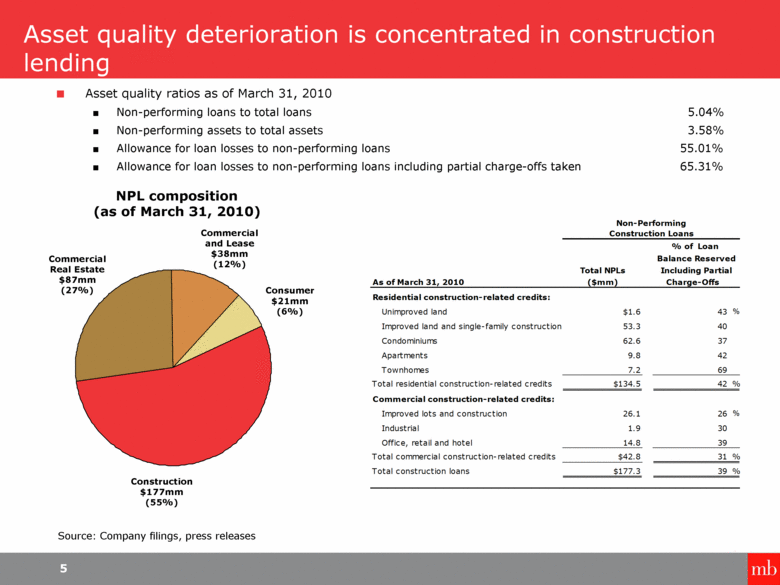
5 Source: Company filings, press releases Asset quality deterioration is concentrated in construction lending Consumer $21mm (6%) Construction $177mm (55%) Commercial Real Estate $87mm (27%) Commercial and Lease $38mm (12%) NPL composition (as of March 31, 2010) Asset quality ratios as of March 31, 2010 Non-performing loans to total loans 5.04% Non-performing assets to total assets 3.58% Allowance for loan losses to non-performing loans 55.01% Allowance for loan losses to non-performing loans including partial charge-offs taken 65.31% Total NPLs As of March 31, 2010 ($mm) Charge-Offs Residential construction-related credits: Unimproved land $1.6 43 % Improved land and single-family construction 53.3 40 Condominiums 62.6 37 Apartments 9.8 42 Townhomes 7.2 69 Total residential construction-related credits $134.5 42 % Commercial construction-related credits: Improved lots and construction 26.1 26 % Industrial 1.9 30 Office, retail and hotel 14.8 39 Total commercial construction-related credits $42.8 31 % Total construction loans $177.3 39 % % of Loan Balance Reserved Including Partial Non-Performing Construction Loans |
|
|
6 Diversified commercial real estate portfolio Commercial real estate portfolio (as of March 31, 2010) Industrial 14% Office 7% Retail 17% Multifamily 20% Owner occupied1 23% Healthcare 9% Church and schools 1% Other 9% Source: Company management ¹ Includes owner-occupied loans for all commercial real estate categories As of March 31, 2010 Total Loans ($mm) % of Total Loans Commercial real estate loans: Owner occupied1 543 $ 8% Multifamily 493 8% Retail 408 6% Industrial 333 5% Healthcare 226 4% Office 179 3% Other 210 3% Church and school 19 1% Total commercial real estate loans 2,412 $ 38% |

|
|
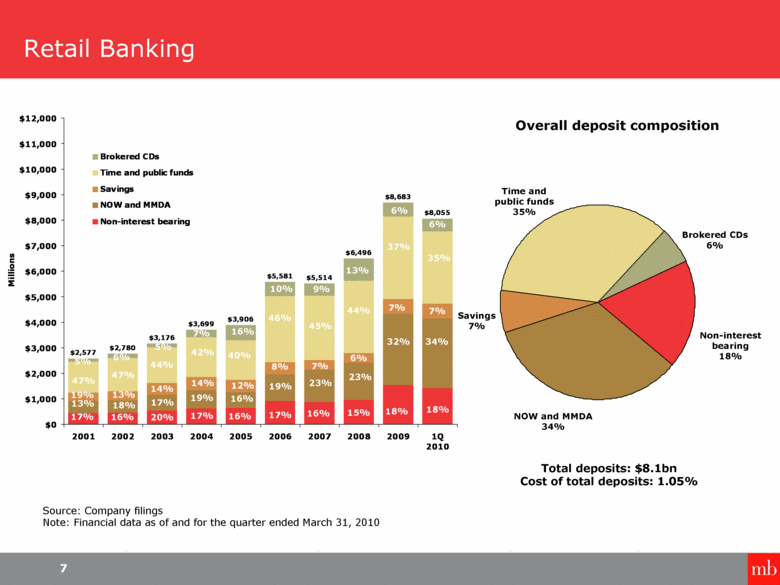
7 Retail Banking $2,577 $2,780 $3,176 $3,699 $3,906 $5,581 $5,514 $6,496 $8,683 $8,055 $0 $1,000 $2,000 $3,000 $4,000 $5,000 $6,000 $7,000 $8,000 $9,000 $10,000 $11,000 $12,000 2001 2002 2003 2004 2005 2006 2007 2008 2009 1Q 2010 Millions Brokered CDs Time and public funds Savings NOW and MMDA Non-interest bearing Source: Company filings Note: Financial data as of and for the quarter ended March 31, 2010 47% 6% Total deposits: $8.1bn Cost of total deposits: 1.05% Overall deposit composition NOW and MMDA 34% Non-interest bearing 18% Savings 7% Brokered CDs 6% Time and public funds 35% 5% 47% 13% 19% 17% 13% 18% 16% 5% 44% 14% 20% 17% 7% 42% 14% 19% 17% 40% 16% 12% 16% 16% 10% 46% 8% 19% 17% 45% 9% 7% 23% 16% 13% 44% 6% 23% 15% 18% 32% 7% 6% 37% 6% 35% 7% 34% 18% |
|
|
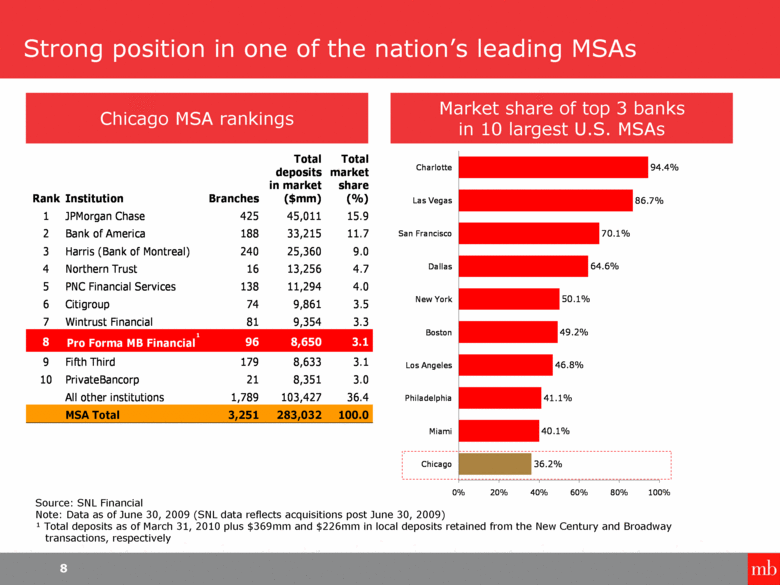
8 Chicago MSA rankings Rank Institution Branches Total deposits in market ($mm) Total market share (%) 1 JPMorgan Chase 425 45,011 15.9 2 Bank of America 188 33,215 11.7 3 Harris (Bank of Montreal) 240 25,360 9.0 4 Northern Trust 16 13,256 4.7 5 PNC Financial Services 138 11,294 4.0 6 Citigroup 74 9,861 3.5 7 Wintrust Financial 81 9,354 3.3 8 Pro Forma MB Financial 1 96 8,650 3.1 9 Fifth Third 179 8,633 3.1 10 PrivateBancorp 21 8,351 3.0 All other institutions 1,789 103,427 36.4 MSA Total 3,251 283,032 100.0 Strong position in one of the nation’s leading MSAs Market share of top 3 banks in 10 largest U.S. MSAs 36.2% 40.1% 41.1% 46.8% 49.2% 50.1% 64.6% 70.1% 86.7% 94.4% 0% 20% 40% 60% 80% 100% Chicago Miami Philadelphia Los Angeles Boston New York Dallas San Francisco Las Vegas Charlotte ` Source: SNL Financial Note: Data as of June 30, 2009 (SNL data reflects acquisitions post June 30, 2009) ¹ Total deposits as of March 31, 2010 plus $369mm and $226mm in local deposits retained from the New Century and Broadway transactions, respectively |
|
|
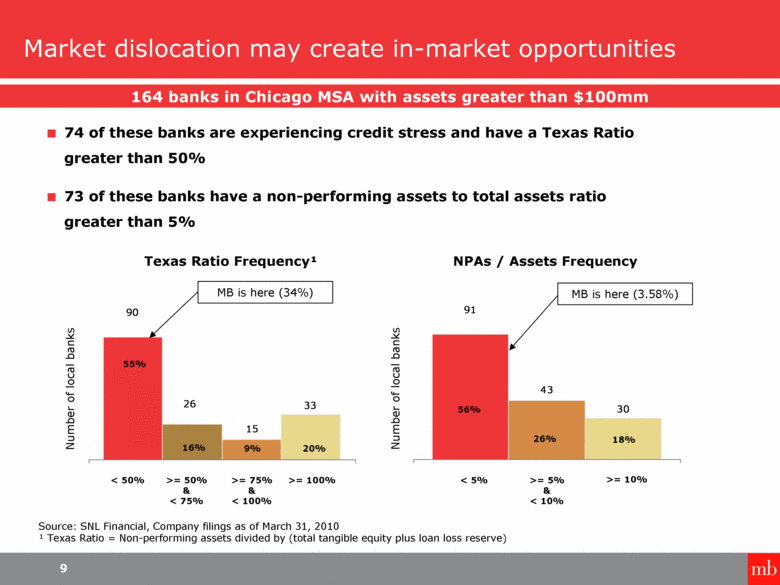
9 74 of these banks are experiencing credit stress and have a Texas Ratio greater than 50% 73 of these banks have a non-performing assets to total assets ratio greater than 5% Source: SNL Financial, Company filings as of March 31, 2010 ¹ Texas Ratio = Non-performing assets divided by (total tangible equity plus loan loss reserve) 164 banks in Chicago MSA with assets greater than $100mm Market dislocation may create in-market opportunities 33 90 26 15 Number of local banks < 50% MB is here (34%) >= 50% & < 75% >= 75% & < 100% >= 100% 30 91 43 Number of local banks < 5% >= 5% & < 10% >= 10% MB is here (3.58%) 55% 16% 9% 20% 56% 26% 18% Texas Ratio Frequency 1 NPAs / Assets Frequency |
|
|
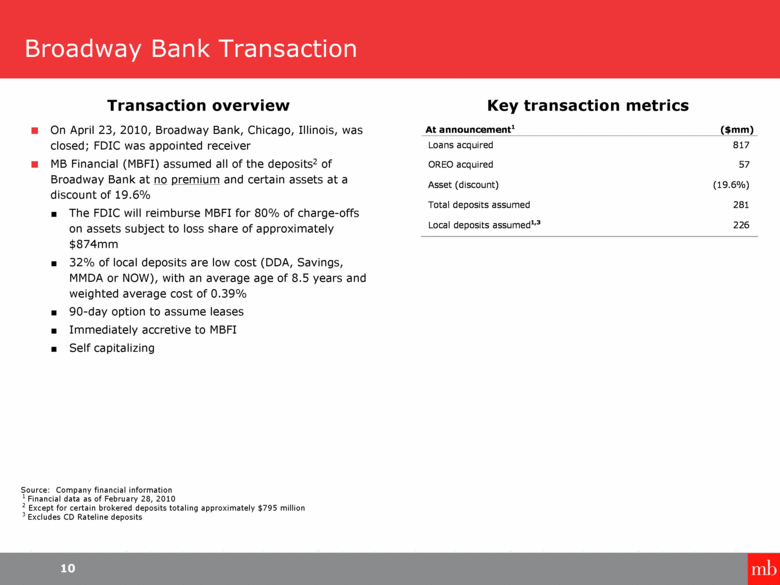
Broadway Bank Transaction 10 Source: Company financial information 1 Financial data as of February 28, 2010 2 Except for certain brokered deposits totaling approximately $795 million 3 Excludes CD Rateline deposits Transaction overview Key transaction metrics On April 23, 2010, Broadway Bank, Chicago, Illinois, was closed; FDIC was appointed receiver MB Financial (MBFI) assumed all of the deposits2 of Broadway Bank at no premium and certain assets at a discount of 19.6% The FDIC will reimburse MBFI for 80% of charge-offs on assets subject to loss-share of approximately $874mm 32% of local deposits are low cost (DDA, Savings, MMDA or NOW), with an average age of 8.5 years and weighted average cost of 0.39% 90-day option to assume leases Immediately accretive to MBFI Self capitalizing At announcement1 ($mm) Loans acquired 817 OREO acquired 57 Asset (discount) (19.6%) Total deposits assumed 281 Local deposits assumed1,3 226 |
|
|
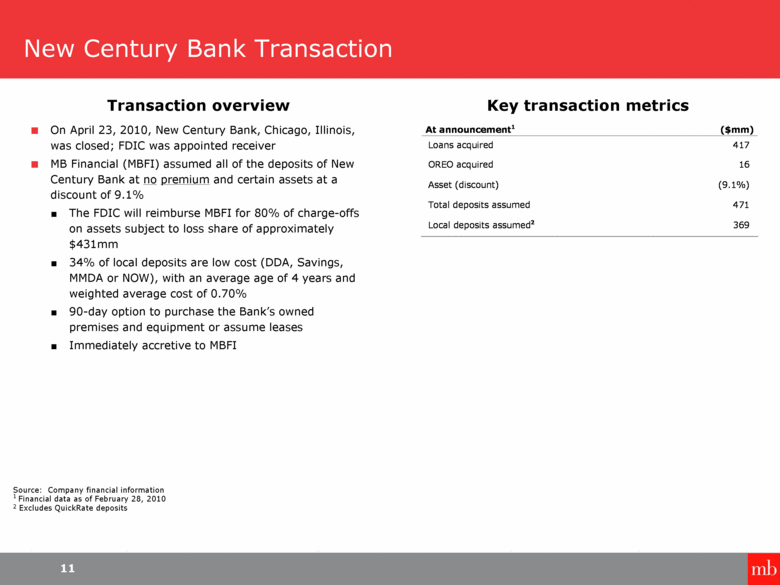
New Century Bank Transaction 11 Source: Company financial information 1 Financial data as of February 28, 2010 2 Excludes QuickRate deposits Transaction overview Key transaction metrics On April 23, 2010, New Century Bank, Chicago, Illinois, was closed; FDIC was appointed receiver MB Financial (MBFI) assumed all of the deposits of New Century Bank at no premium and certain assets at a discount of 9.1% The FDIC will reimburse MBFI for 80% of charge-offs on assets subject to loss-share of approximately $431mm 34% of local deposits are low cost (DDA, Savings, MMDA or NOW), with an average age of 4 years and weighted average cost of 0.70% 90-day option to purchase the Bank’s owned premises and equipment or assume leases Immediately accretive to MBFI At announcement1 ($mm) Loans acquired 417 OREO acquired 16 Asset (discount) (9.1%) Total deposits assumed 471 Local deposits assumed2 369 |
|
|
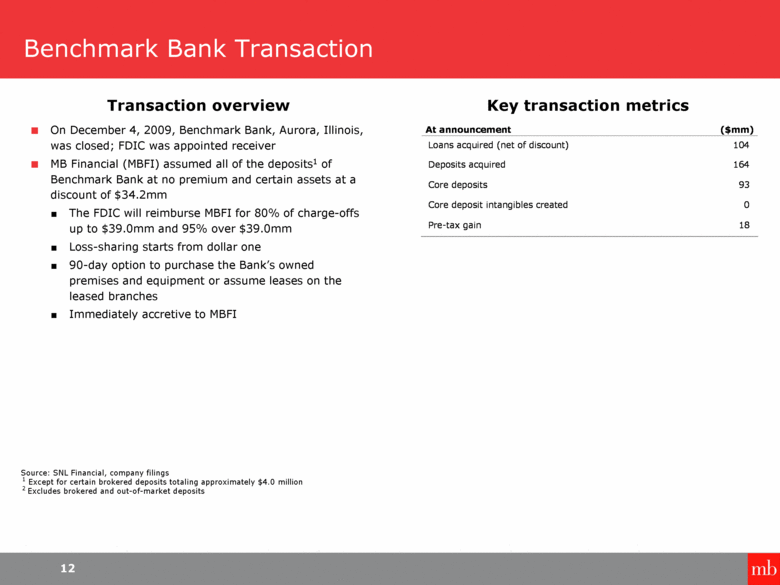
12 Benchmark Bank Transaction Source: SNL Financial, company filings1 Except for certain brokered deposits totaling approximately $4.0 million 2 Excludes brokered and out-of-market deposits Transaction overview Key transaction metrics On December 4, 2009, Benchmark Bank, Aurora, Illinois, was closed; FDIC was appointed receiver MB Financial (MBFI) assumed all of the deposits1 of Benchmark Bank at no premium and certain assets at a discount of $34.2mm The FDIC will reimburse MBFI for 80% of charge-offs up to $39.0mm and 95% over $39.0mm Loss-sharing starts from dollar one 90-day option to purchase the Bank’s owned premises and equipment or assume leases on the leased branches Immediately accretive to MBFI At announcement ($mm) Loans acquired (net of discount) 104 Deposits acquired 164 Core deposits 93 Core deposit intangibles created 0 Pre-tax gain 18 |
|
|
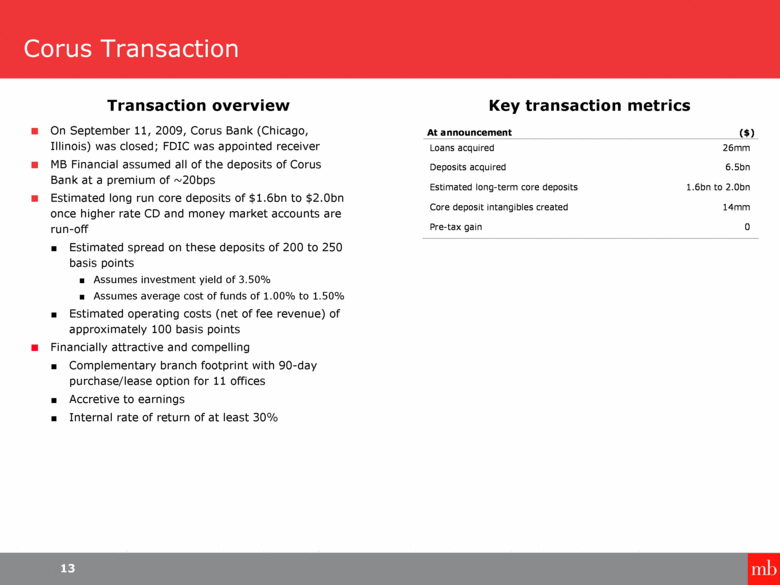
13 Transaction overview Key transaction metrics On September 11, 2009, Corus Bank (Chicago, Illinois) was closed; FDIC was appointed receiver MB Financial assumed all of the deposits of Corus Bank at a premium of ~ 20bps Estimated long run core deposits of $1.6bn to $2.0bn once higher rate CD and money market accounts are run-off Estimated spread on these deposits of 200 to 250 basis points Assumes investment yield of 3.50% Assumes average cost of funds of 1.00% to 1.50% Estimated operating costs (net of fee revenue) of approximately 100 basis points Financially attractive and compelling Complementary branch footprint with 90-day purchase/lease option for 11 offices Accretive to earnings Internal rate of return of at least 30% Corus Transaction At announcement ($) Loans acquired 26mm Deposits acquired 6.5bn Estimated long-term core deposits 1.6bn to 2.0bn Core deposit intangibles created 14mm Pre-tax gain 0 |
|
|
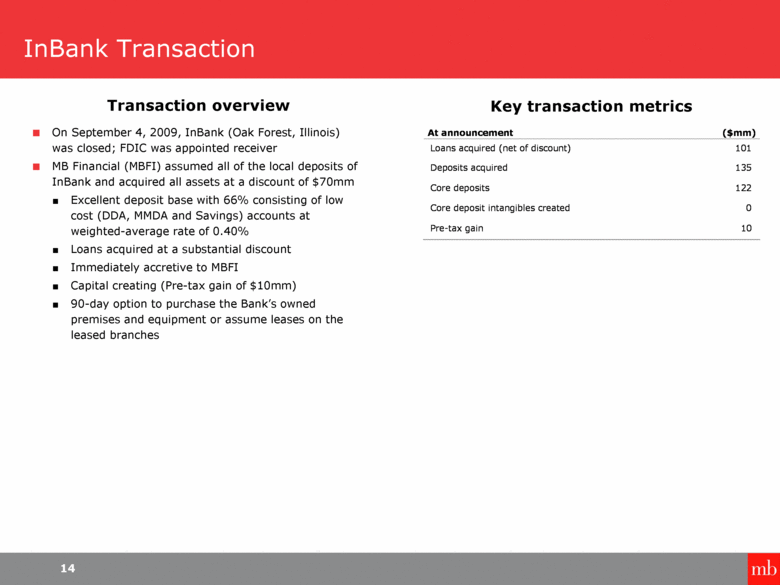
14 Transaction overview Key transaction metrics On September 4, 2009, InBank (Oak Forest, Illinois) was closed; FDIC was appointed receiver MB Financial (MBFI) assumed all of the local deposits of InBank and acquired all assets at a discount of $70mm Excellent deposit base with 66% consisting of low cost (DDA, MMDA and Savings) accounts at weighted-average rate of 0.40% Loans acquired at a substantial discount Immediately accretive to MBFI Capital creating (Pre-tax gain of $10mm) 90-day option to purchase the Bank’s owned premises and equipment or assume leases on the leased branches InBank Transaction At announcement ($mm) Loans acquired (net of discount) 101 Deposits acquired 135 Core deposits 122 Core deposit intangibles created 0 Pre-tax gain 10 |
|
|
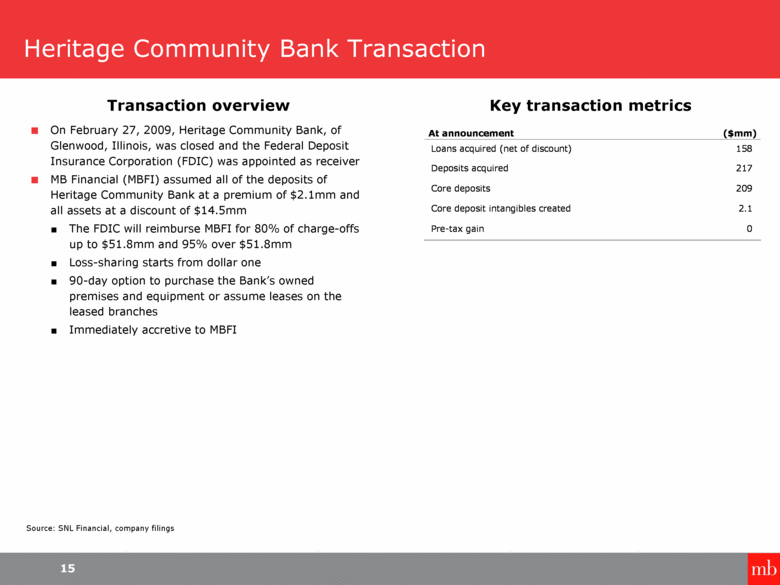
15 Heritage Community Bank Transaction Source: SNL Financial, company filings Transaction overview Key transaction metrics On February 27, 2009, Heritage Community Bank, of Glenwood, Illinois, was closed and the Federal Deposit Insurance Corporation (FDIC) was appointed as receiver MB Financial (MBFI) assumed all of the deposits of Heritage Community Bank at a premium of $2.1mm and all assets at a discount of $14.5mm The FDIC will reimburse MBFI for 80% of charge-offs up to $51.8mm and 95% over $51.8mm Loss-sharing starts from dollar one 90-day option to purchase the Bank’s owned premises and equipment or assume leases on the leased branches Immediately accretive to MBFI At announcement ($mm) Loans acquired (net of discount) 158 Deposits acquired 217 Core deposits 209 Core deposit intangibles created 2.1 Pre-tax gain 0 |
|
|
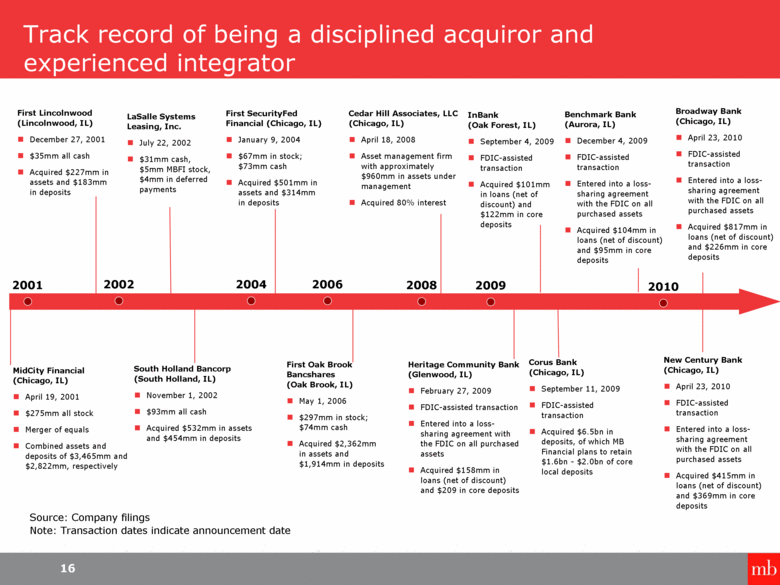
16 2001 2002 2004 2006 2008 First SecurityFed Financial (Chicago, IL) January 9, 2004 $67mm in stock; $73mm cash Acquired $501mm in assets and $314mm in deposits First Lincolnwood (Lincolnwood, IL) December 27, 2001 $35mm all cash Acquired $227mm in assets and $183mm in deposits South Holland Bancorp (South Holland, IL) November 1, 2002 $93mm all cash Acquired $532mm in assets and $454mm in deposits First Oak Brook Bancshares (Oak Brook, IL) May 1, 2006 $297mm in stock; $74mm cash Acquired $2,362mm in assets and $1,914mm in deposits Heritage Community Bank (Glenwood, IL) February 27, 2009 FDIC-assisted transaction Entered into a loss-sharing agreement with the FDIC on all purchased assets Acquired $158mm in loans (net of discount) and $209 in core deposits Source: Company filings Note: Transaction dates indicate announcement date Cedar Hill Associates, LLC (Chicago, IL) April 18, 2008 Asset management firm with approximately $960mm in assets under management Acquired 80% interest LaSalle Systems Leasing, Inc. July 22, 2002 $31mm cash, $5mm MBFI stock, $4mm in deferred payments Track record of being a disciplined acquiror and experienced integrator InBank (Oak Forest, IL) September 4, 2009 FDIC-assisted transaction Acquired $101mm in loans (net of discount) and $122mm in core deposits Corus Bank (Chicago, IL) September 11, 2009 FDIC-assisted transaction Acquired $6.5bn in deposits, of which MB Financial plans to retain $1.6bn - $2.0bn of core local deposits 2009 Benchmark Bank (Aurora, IL) December 4, 2009 FDIC-assisted transaction Entered into a loss-sharing agreement with the FDIC on all purchased assets Acquired $104mm in loans (net of discount) and $95mm in core deposits 2010 Broadway Bank (Chicago, IL) April 23, 2010 FDIC-assisted transaction Entered into a loss-sharing agreement with the FDIC on all purchased assets Acquired $817mm in loans (net of discount) and $226mm in core deposits New Century Bank (Chicago, IL) April 23, 2010 FDIC-assisted transaction Entered into a loss-sharing agreement with the FDIC on all purchased assets Acquired $415mm in loans (net of discount) and $369mm in core deposits MidCity Financial (Chicago, IL) April 19, 2001 $275mm all stock Merger of equals Combined assets and deposits of $3,465mm and $2,822mm, respectively |
|
|
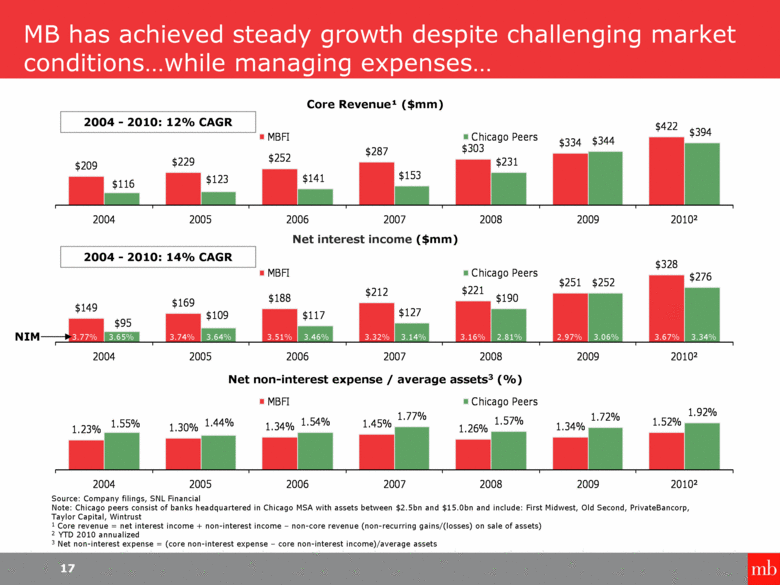
17 Core Revenue1 ($mm) $149 $169 $188 $212 $221 $251 $328 $117 $127 $190 $252 $276 $109 $95 2004 2005 2006 2007 2008 2009 2010² MBFI Chicago Peers Net interest income ($mm) MB has achieved steady growth despite challenging market conditions while managing expenses... Source: Company filings, SNL Financial Note: Chicago peers consist of banks headquartered in Chicago MSA with assets between $2.5bn and $15.0bn and include: First Midwest, Old Second, PrivateBancorp, Taylor Capital, Wintrust 1 Core revenue = net interest income + non-interest income – non-core revenue (non-recurring gains/(losses) on sale of assets) 2 YTD 2010 annualized 3 Net non-interest expense = (core non-interest expense – core non-interest income)/average assets $209 $229 $252 $287 $303 $334 $422 $141 $153 $231 $344 $394 $123 $116 2004 2005 2006 2007 2008 2009 20102 MBFI Chicago Peers 3.77% 3.65% 3.74% 3.64% 3.51% 3.46% 3.32% 3.14% 3.16% 2.81% 2.97% 3.06% 3.67% 3.34% 2004 - 2010: 12% CAGR 2004 - 2010: 14% CAGR Net non-interest expense / average assets3 (%) 1.23% 1.30% 1.34% 1.45% 1.26% 1.34% 1.52% 1.54% 1.77% 1.57% 1.72% 1.92% 1.44% 1.55% 2004 2005 2006 2007 2008 2009 20102 MBFI Chicago Peers NIM |
|
|
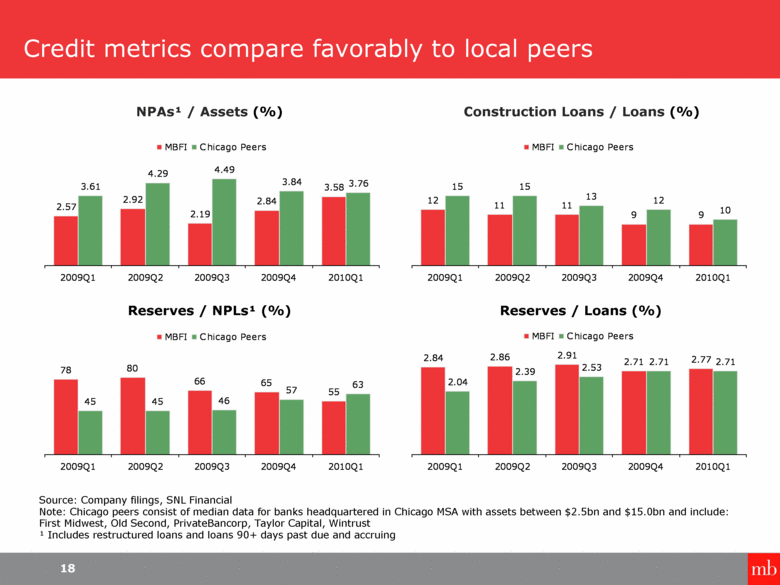
18 Source: Company filings, SNL Financial Note: Chicago peers consist of median data for banks headquartered in Chicago MSA with assets between $2.5bn and $15.0bn and include: First Midwest, Old Second, PrivateBancorp, Taylor Capital, Wintrust 1 Includes restructured loans and loans 90+ days past due and accruing 2.57 2.92 2.19 2.84 3.58 3.61 4.29 4.49 3.84 3.76 2009Q1 2009Q2 2009Q3 2009Q4 2010Q1 MBFI Chicago Peers NPAs1 / Assets (%) Reserves/Loans (%) Reserves / NPLs1 (%) Credit metrics compare favorably to local peers Reserves / Loans (%) Construction Loans / Loans (%) 78 80 66 65 55 45 45 46 57 63 2009Q1 2009Q2 2009Q3 2009Q4 2010Q1 MBFI Chicago Peers 12 11 11 9 9 15 15 13 12 10 2009Q1 2009Q2 2009Q3 2009Q4 2010Q1 MBFI Chicago Peers 2.84 2.86 2.91 2.71 2.77 2.04 2.39 2.53 2.71 2.71 2009Q1 2009Q2 2009Q3 2009Q4 2010Q1 MBFI Chicago Peers |
|
|
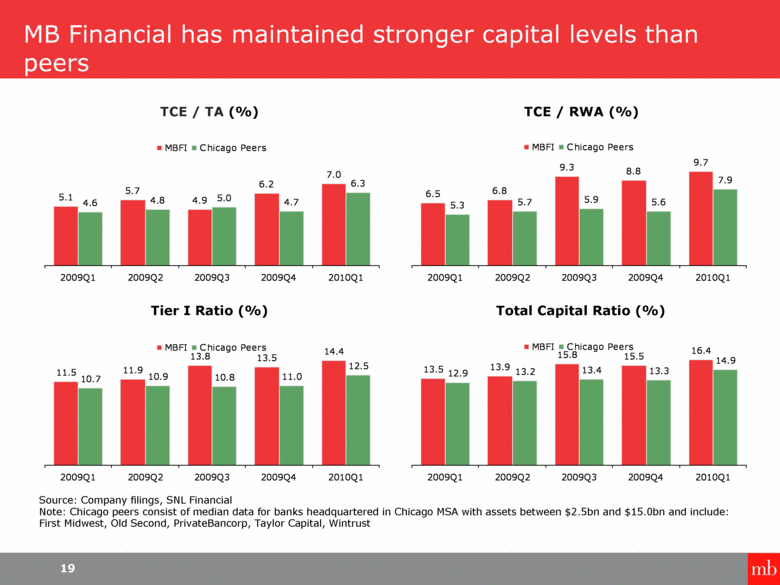
19 MB Financial has maintained stronger capital levels than peers Source: Company filings, SNL Financial Note: Chicago peers consist of median data for banks headquartered in Chicago MSA with assets between $2.5bn and $15.0bn and include: First Midwest, Old Second, PrivateBancorp, Taylor Capital, Wintrust 5.1 5.7 4.9 6.2 7.0 4.6 4.8 5.0 4.7 6.3 2009Q1 2009Q2 2009Q3 2009Q4 2010Q1 MBFI Chicago Peers TCE / TA (%) Tier I Ratio (%) Total Capital Ratio (%) TCE / RWA (%) 6.5 6.8 9.3 8.8 9.7 5.3 5.7 5.9 5.6 7.9 2009Q1 2009Q2 2009Q3 2009Q4 2010Q1 MBFI Chicago Peers 11.5 11.9 13.8 13.5 14.4 10.7 10.9 10.8 11.0 12.5 2009Q1 2009Q2 2009Q3 2009Q4 2010Q1 MBFI Chicago Peers 13.5 13.9 15.8 15.5 16.4 12.9 13.2 13.4 13.3 14.9 2009Q1 2009Q2 2009Q3 2009Q4 2010Q1 MBFI Chicago Peers |
|
|
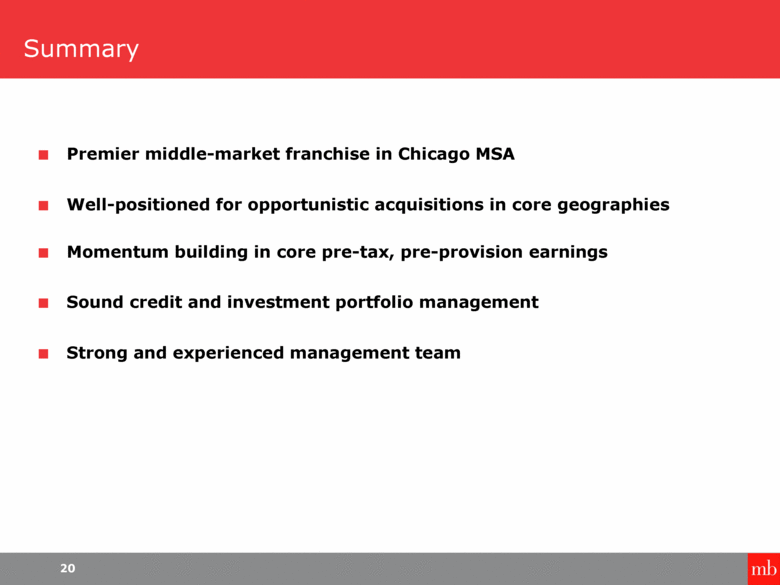
20 Summary Premier middle-market franchise in Chicago MSA Well-positioned for opportunistic acquisitions in core geographies Momentum building in core pre-tax, pre-provision earnings Sound credit and investment portfolio management Strong and experienced management team |
|
|
21 Appendix |

|
|
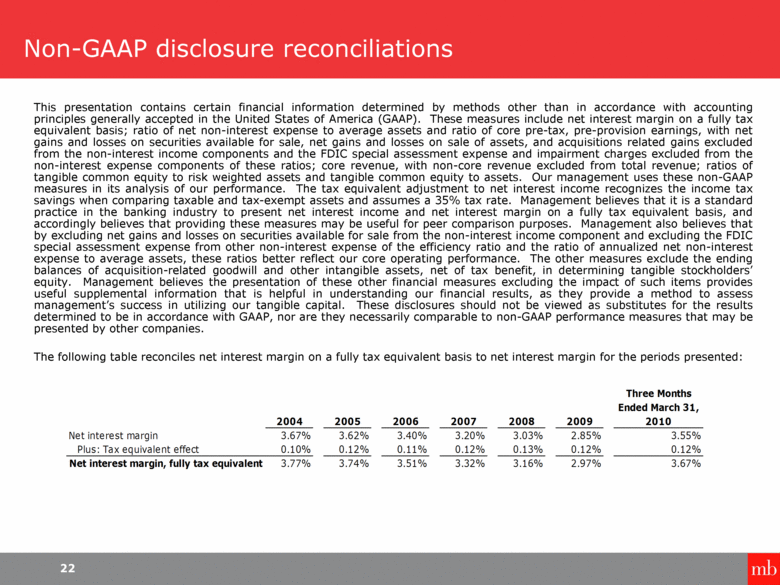
22 Three Months Ended March 31, 2004 2005 2006 2007 2008 2009 2010 Net interest margin 3.67% 3.62% 3.40% 3.20% 3.03% 2.85% 3.55% Plus: Tax equivalent effect 0.10% 0.12% 0.11% 0.12% 0.13% 0.12% 0.12% Net interest margin, fully tax equivalent 3.77% 3.74% 3.51% 3.32% 3.16% 2.97% 3.67% Non-GAAP disclosure reconciliations This presentation contains certain financial information determined by methods other than in accordance with accounting principles generally accepted in the United States of America (GAAP). These measures include net interest margin on a fully tax equivalent basis; ratio of net non-interest expense to average assets and ratio of core pre-tax, pre-provision earnings, with net gains and losses on securities available for sale, net gains and losses on sale of assets, and acquisitions related gains excluded from the non-interest income components and the FDIC special assessment expense and impairment charges excluded from the non-interest expense components of these ratios; core revenue, with non-core revenue excluded from total revenue; ratios of tangible common equity to risk weighted assets and tangible common equity to assets. Our management uses these non-GAAP measures in its analysis of our performance. The tax equivalent adjustment to net interest income recognizes the income tax savings when comparing taxable and tax-exempt assets and assumes a 35% tax rate. Management believes that it is a standard practice in the banking industry to present net interest income and net interest margin on a fully tax equivalent basis, and accordingly believes that providing these measures may be useful for peer comparison purposes. Management also believes that by excluding net gains and losses on securities available for sale from the non-interest income component and excluding the FDIC special assessment expense from other non-interest expense of the efficiency ratio and the ratio of annualized net non-interest expense to average assets, these ratios better reflect our core operating performance. The other measures exclude the ending balances of acquisition-related goodwill and other intangible assets, net of tax benefit, in determining tangible stockholders’ equity. Management believes the presentation of these other financial measures excluding the impact of such items provides useful supplemental information that is helpful in understanding our financial results, as they provide a method to assess management’s success in utilizing our tangible capital. These disclosures should not be viewed as substitutes for the results determined to be in accordance with GAAP, nor are they necessarily comparable to non-GAAP performance measures that may be presented by other companies. The following table reconciles net interest margin on a fully tax equivalent basis to net interest margin for the periods presented: |
|
|
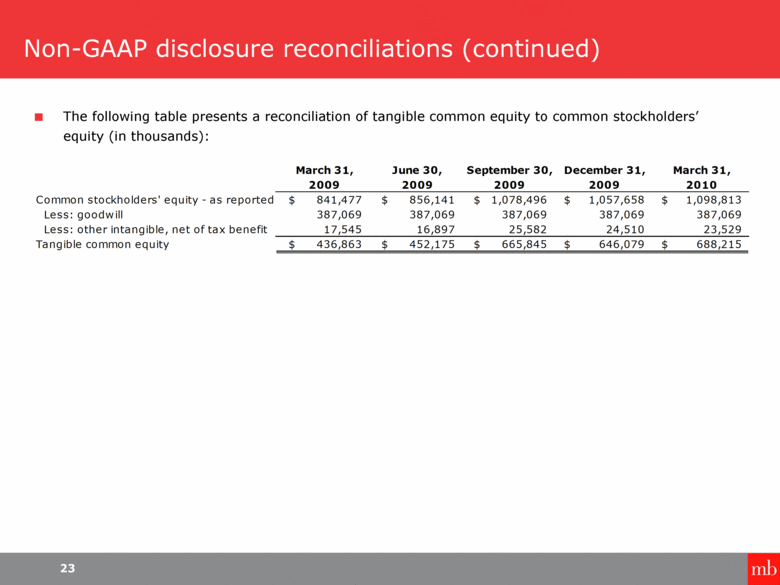
23 The following table presents a reconciliation of tangible common equity to common stockholders’ equity (in thousands): March 31, June 30, September 30, December 31, March 31, 2009 2009 2009 2009 2010 841,477 $ 856,141 $ 1,078,496 $ 1,057,658 $ 1,098,813 $ Less: goodwill 387,069 387,069 387,069 387,069 387,069 Less: other intangible, net of tax benefit 17,545 16,897 25,582 24,510 23,529 436,863 $ 452,175 $ 665,845 $ 646,079 $ 688,215 $ Common stockholders’ equity - as reported Tangible common equity Non-GAAP disclosure reconciliations (continued) |
|
|
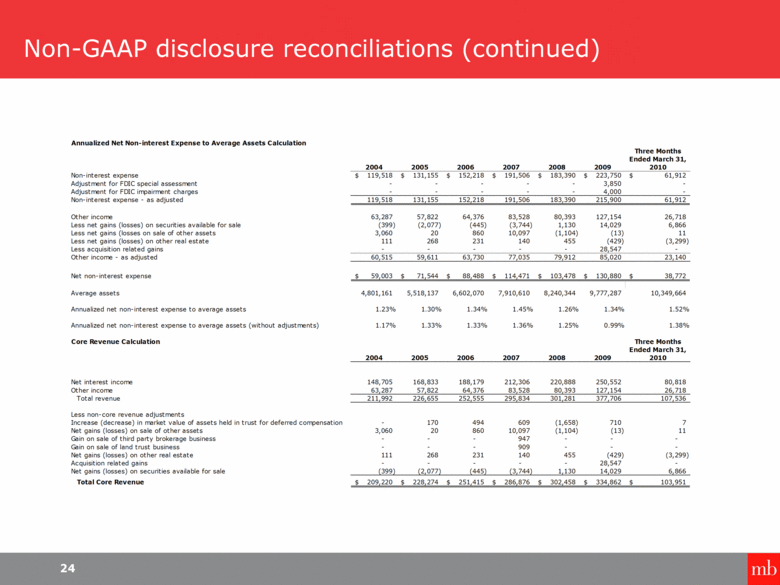
24 Annualized Net Non-interest Expense to Average Assets Calculation Three Months Ended March 31, 2004 2005 2006 2007 2008 2009 2010 Non-interest expense 119,518 $ 131,155 $ 152,218 $ 191,506 $ 183,390 $ 223,750 $ 61,912 $ Adjustment for FDIC special assessment - - - - - 3,850 - Adjustment f or FDIC impairment charges - - - - - 4,000 - Non-interest expense - as adjusted 119,518 131,155 152,218 191,506 183,390 215,900 61,912 Other income 63,287 57,822 64,376 83,528 80,393 127,154 26,718 Less net gains (losses) on securities available for sale (399) (2,077) (445) (3,744) 1,130 14,029 6,866 Less net gains (losses on sale of other assets 3,060 20 860 10,097 (1,104) (13) 11 Less net gains (losses) on other real estate 111 268 231 140 455 (429) (3,299) Less acquisition related gains - - - - - 28,547 - Other income - as adjusted 60,515 59,611 63,730 77,035 79,912 85,020 23,140 Net non-interest expense 59,003 $ 71,544 $ 88,488 $ 114,471 $ 103,478 $ 130,880 $ 38,772 $ Average assets 4,801,161 5,518,137 6,602,070 7,910,610 8,240,344 9,777,287 10,349,664 Annualized net non-interest expense to average assets 1.23% 1.30% 1.34% 1.45% 1.26% 1.34% 1.52% Annualized net non-interest expense to average assets (without adjustments) 1.17% 1.33% 1.33% 1.36% 1.25% 0.99% 1.38% Core Revenue Calculation Three Months Ended March 31, 2004 2005 2006 2007 2008 2009 2010 Net interest income 148,705 168,833 188,179 212,306 220,888 250,552 80,818 Other income 63,287 57,822 64,376 83,528 80,393 127,154 26,718 Total revenue 211,992 226,655 252,555 295,834 301,281 377,706 107,536 Less non-core revenue adjustment s Increase (decrease) in market value of assets held in t rust for deferred compensation - 170 494 609 (1,658) 710 7 Net gains (losses) on sale of other assets 3,060 20 860 10,097 (1,104) (13) 11 Gain on sale of third part y brokerage business - - - 947 - - - Gain on sale of land trust business - - - 909 - - - Net gains (losses) on other real estate 111 268 231 140 455 (429) (3,299) Acquisition related gains - - - - - 28,547 - Net gains (losses) on securities available for sale (399) (2,077) (445) (3,744) 1,130 14,029 6,866 Total Core Revenue 209,220 $ 228,274 $ 251,415 $ 286,876 $ 302,458 $ 334,862 $ 103,951 $ Non-GAAP disclosure reconciliations (continued) |
|
|
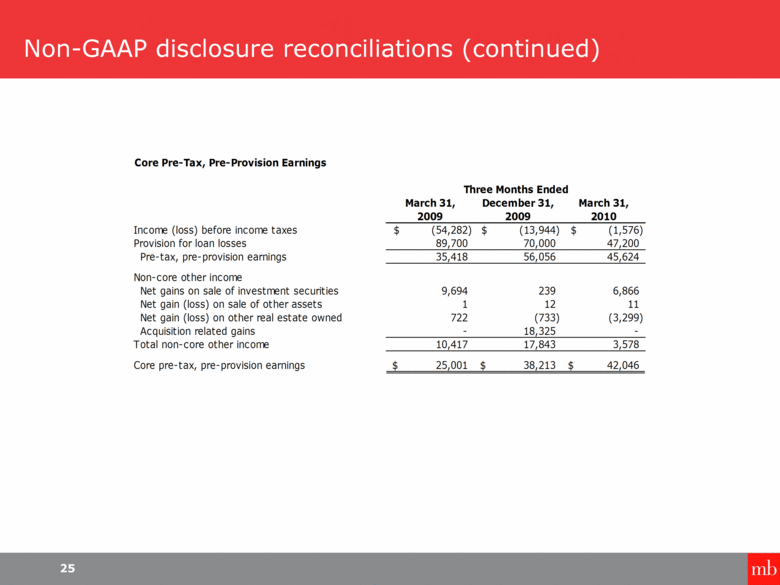
25 Non-GAAP disclosure reconciliations (continued) Core Pre-Tax, Pre-Provision Earnings March 31, December 31, March 31, 2009 2009 2010 Income (loss) before income taxes (54,282) $ (13,944) $ (1,576) $ Provision for loan losses 89,700 70,000 47,200 Pre-tax, pre-provision earnings 35,418 56,056 45,624 Non-core other income Net gains on sale of investment securities 9,694 239 6,866 Net gain (loss) on sale of other assets 1 12 11 Net gain (loss) on other real estate owned 722 (733) (3,299) Acquisition related gains - 18,325 - Total non-core other income 10,417 17,843 3,578 Core pre-tax, pre-provision earnings 25,001 $ 38,213 $ 42,046 $ Three Months Ended |
|
|
Investor Presentation May 2010 |
SIGNATURES
Pursuant to the requirements of the Securities Exchange Act of 1934, MB Financial, Inc. has duly caused this report to be signed on its behalf by the undersigned, thereunto duly authorized, on the 10th day of May, 2010.
MB FINANCIAL, INC.
|
|
By: |
/s/ Jill E. York |
|
|
|
|
|
Jill E. York |
|
|
|
|
Vice President and Chief Financial Officer |
|
||
|
|
(Principal Financial and Principal Accounting Officer) |
|
||