Attached files

Pivotal Energy Development
Dana Grams
President
Dana Grams
President

2
2010 Analyst Meeting
Forward-Looking Statements
Certain expectations and projections regarding our future performance referenced in this presentation, in other reports or statements we file with the SEC or otherwise release to the public,
and on our website, are forward-looking statements. Senior officers and other employees may also make verbal statements to analysts, investors, regulators, the media and others that are
forward-looking. Forward-looking statements involve matters that are not historical facts, such as statements regarding our future operations, prospects, strategies, financial condition,
economic performance (including growth and earnings), industry conditions and demand for our products and services. Because these statements involve anticipated events or conditions,
forward-looking statements often include words such as "anticipate," "assume," "believe," "can," "could," "estimate," "expect," "forecast," "future," "goal," "indicate," "intend," "may,"
"outlook," "plan," "potential," "predict," "project," "seek," "should," "target," "would," or similar expressions. Our expectations are not guarantees and are based on currently available
competitive, financial and economic data along with our operating plans. While we believe our expectations are reasonable in view of the currently available information, our expectations
are subject to future events, risks and uncertainties, and there are several factors - many beyond our control - that could cause results to differ significantly from our expectations.
Such events, risks and uncertainties include, but are not limited to, changes in price, supply and demand for natural gas and related products; the impact of changes in state and federal
legislation and regulation including changes related to climate change; actions taken by government agencies on rates and other matters; concentration of credit risk; utility and energy
industry consolidation; the impact on cost and timeliness of construction projects by government and other approvals, development project delays, adequacy of supply of diversified
vendors, unexpected change in project costs, including the cost of funds to finance these projects; the impact of acquisitions and divestitures; direct or indirect effects on our business,
financial condition or liquidity resulting from a change in our credit ratings or the credit ratings of our counterparties or competitors; interest rate fluctuations; financial market conditions,
including recent disruptions in the capital markets and lending environment and the current economic downturn; general economic conditions; uncertainties about environmental issues and
the related impact of such issues; the impact of changes in weather, including climate change, on the temperature-sensitive portions of our business; the impact of natural disasters such
as hurricanes on the supply and price of natural gas; acts of war or terrorism; and other factors which are provided in detail in our filings with the Securities and Exchange Commission.
Forward-looking statements are only as of the date they are made, and we do not undertake to update these statements to reflect subsequent changes.
Supplemental Information
Company management evaluates segment financial performance based on earnings before interest and taxes (EBIT), which includes the effects of corporate expense allocations and on
operating margin. EBIT is a non-GAAP (accounting principles generally accepted in the United States of America) financial measure that includes operating income, other income and
expenses. Items that are not included in EBIT are financing costs, including debt and interest expense and income taxes. The company evaluates each of these items on a consolidated
level and believes EBIT is a useful measurement of our performance because it provides information that can be used to evaluate the effectiveness of our businesses from an operational
perspective, exclusive of the costs to finance those activities and exclusive of income taxes, neither of which is directly relevant to the efficiency of those operations.
Operating margin is a non-GAAP measure calculated as operating revenues minus cost of gas, excluding operation and maintenance expense, depreciation and amortization, and taxes
other than income taxes. These items are included in the company's calculation of operating income. The company believes operating margin is a better indicator than operating revenues
of the contribution resulting from customer growth, since cost of gas is generally passed directly through to customers.
EBIT and operating margin should not be considered as alternatives to, or more meaningful indicators of, the company's operating performance than operating income or net income
attributable to AGL Resources Inc. as determined in accordance with GAAP. In addition, the company's EBIT and operating margin may not be comparable to similarly titled measures of
another company.
attributable to AGL Resources Inc. as determined in accordance with GAAP. In addition, the company's EBIT and operating margin may not be comparable to similarly titled measures of
another company.
Reconciliations of non-GAAP financial measures referenced in this presentation are available on the company’s Web site at www.aglresources.com.
Cautionary Statements and Supplemental Information

3
2010 Analyst Meeting
Nymex Monthly Continuation
May 6, 2010
May 6, 2010
Nymex Forward Curve
May 6, 2010
Nymex Monthly Volatility 1990-2010
April 5, 2010
Fundamentals of the Marketplace

4
2010 Analyst Meeting
Proposed USGC LNG Terminals
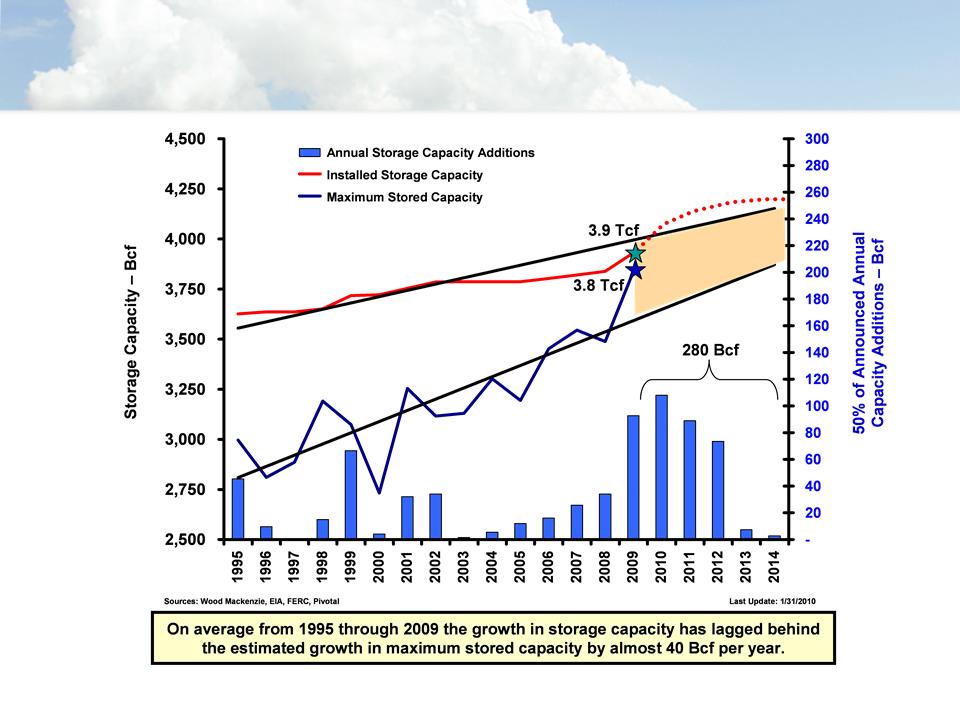
Natural Gas Storage Capacity Supply - Demand
Balance
Balance
U.S. Domestic Shale Production
Extended Economic Slowdown Environmental Policy Domination
Domestic Energy Policy Moderate Policies
U.S. LNG Imports under Alternative Scenarios
Extended Economic Slowdown Environmental Policy Domination
Domestic Energy Policy Moderate Policies
Fundamentals of the Marketplace

5
2010 Analyst Meeting
Fundamentals of the Marketplace
• Market is cyclical
• Supply basins are shifting
– Canada and Gulf of Mexico in decline
– Shale and tight sands increasing
• Deliverability characteristics of new unconventional production are more
challenging
challenging
• Infrastructure need is real (pipeline, treating, processing, storage)
• LNG will come - rapidly expanding global LNG infrastructure
– Variability contributes to price volatility
• Power generation will grow and favors natural gas
• Industrial demand will rebound with economic improvement
• Demand peak continues to grow
• “Green” power fluctuations exaggerates natural gas peaks
• Politics (carbon policies) may dictate size of natural gas market
• The natural gas market will grow
• Storage is a necessity in managing supply / market imbalances
– Operational
– Price mitigator
6
2010 Analyst Meeting
Storage Additions Lag Behind Use

7
2010 Analyst Meeting
Beaumont
Disposal
Line
Line
• Two caverns of 12 Bcf working gas capacity
• Injection/Withdrawal - 300/600 MMcf/d
• 14,205 Hp of compression
• 6 pipeline interconnections
– Kinder Morgan, Centana, Golden Pass,
Houston Pipe Line, Texas Eastern, Florida Gas
• 9 miles of twin 24-inch pipeline
• In service - Cavern 1: 3Q 2010, Cavern 2: 2012
Golden Triangle Program Overview

8
2010 Analyst Meeting
Golden Triangle Storage
• Pipeline
– 80% complete
– Passed FERC inspection
– Completing bores and directional drills
• Meter Stations
– 30% complete
– June-August expected completion dates
• Compressors
– 65% complete
– Expected in-service date of July 2010

9
2010 Analyst Meeting
Three Dimensional Sonar Picture
1250 Ft
Empire State
Building
Building
Golden Triangle Cavern Progress
Cavern 1
• Leaching continues at rates ~3,900 gpm
• Cavern size estimated to be 8.0 MM barrels by
August 1st
August 1st
• Leaching scheduled to end June 1st -
conversion activities to commence
conversion activities to commence
• Sonar completed February 2010; Results
indicated a good cavern shape
indicated a good cavern shape
Cavern 2
• Cavern 2 continues to be monitored during
shutdown until leaching operations start-up
again in June
shutdown until leaching operations start-up
again in June
• Commercial service for Cavern 2 on schedule
to begin 2Q 2012
to begin 2Q 2012
10
2010 Analyst Meeting
Cavern
Creation
• Always full
of water as
it grows
of water as
it grows
Salt
Surface
Open
Brine Out
Fresh Water In
Cavern
Creation
• Always full
of water as
it grows
of water as
it grows
Salt
Surface
Open
Brine Out
Fresh Water In
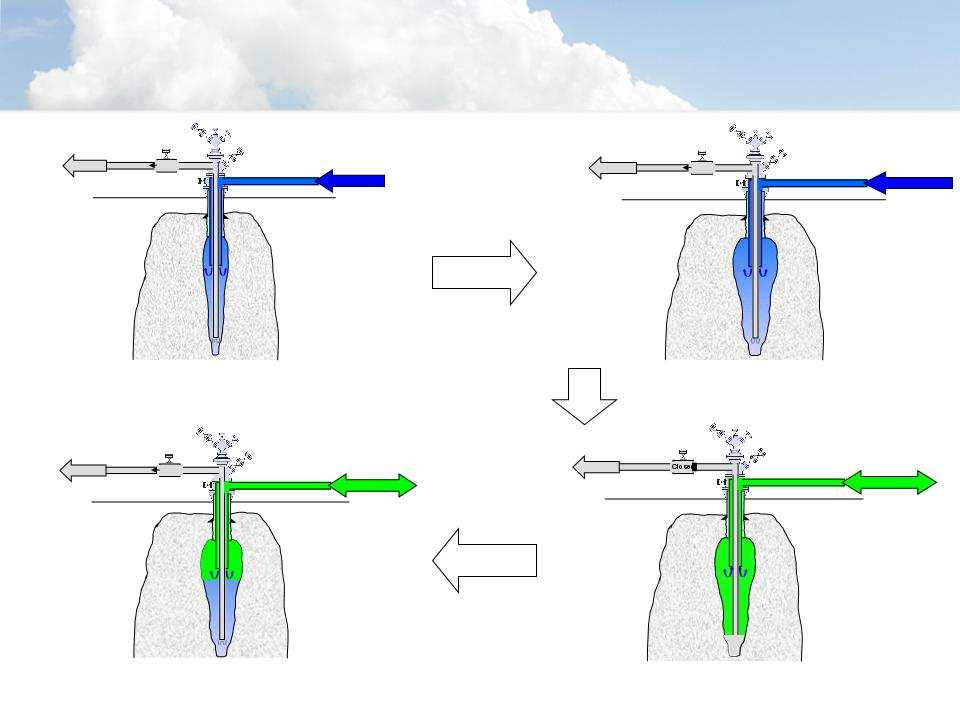
Cavern
Creation
• Always full of
water as it
grows
water as it
grows
• Conversion to
commercial
operations -
gas displaces
water
commercial
operations -
gas displaces
water
Salt
Surface
Gas In and Out
Open
Brine Out
Cavern
Creation
• Always full of
water as it
grows
water as it
grows
• Conversion to
commercial
operations -
gas displaces
water
commercial
operations -
gas displaces
water
Salt
Surface
Gas In and Out
Brine Out
Transition to Commercial Operations

11
2010 Analyst Meeting
Today
Project risk is
significantly
eliminated
significantly
eliminated
Golden Triangle Storage Schedule

12
2010 Analyst Meeting
Compressors
MCC Building
Compressor Piping &
Conduit
Conduit
Gas Coolers
Golden Triangle Construction

13
2010 Analyst Meeting
Cavern 2 Wellhead
24” Header Pipeline
Pipeline Route-of-Way
Golden Triangle Construction

14
2010 Analyst Meeting
: 10.0 MMDth
: 7.5 MMDth
: 2
: 360 MDth/Day
: 600 MDth/Day
: 9
: 15 miles dual 16”
Existing
Configuration
: 37 MMDth
: 17 - 28 MMDth
: 4
: 660 MMcf per Day
: 1,320 MMcf per Day
: 12
: Additional Pipeline
Maximum
Expanded
Configuration
Jefferson Island Expansion
• Total Capacity
• Working Gas
• Number of Caverns
• Max Injection Capability
• Max Withdrawal Capability
• Interconnects
• Header System

15
2010 Analyst Meeting
• Settled mineral lease dispute with State of
Louisiana via operating agreement
Louisiana via operating agreement
• Entered “Stage Gate One” of Asset
Development Process
Development Process
• Expect to submit permit applications
• Permits anticipated, prep for construction,
detailed engineering
detailed engineering
• Expected start-up of operations, Cavern 3
• Cavern 1 expected expansion
• Cavern 2 expected expansion
Jefferson Island Timeline
December 2009
January 2010
June 2010
2011
2014
2015

16
2010 Analyst Meeting
Jefferson Island Program Overview
Project A
– Obtain permits for
Cavern 3 & 4
Cavern 3 & 4
– Complete raw water and
disposal well facility
disposal well facility
– Upgrade leach plant
– Solution mine Cavern 3
adding 6 Bcf working
gas
adding 6 Bcf working
gas
Project B
– Expand Caverns 1 & 2,
adding 3.5 Bcf of
working gas capacity
adding 3.5 Bcf of
working gas capacity
– Replace wellheads and
leaching strings
leaching strings

17
2010 Analyst Meeting
Where We Are Going
• Proceeding with measured expansions
• Geographic diversity
• Increase optionality
• Long-term portfolio value

18
2010 Analyst Meeting
AGL Resources Advantages
• Long-term player
• Well-capitalized
• Good locations
• Speed to market
• Low-cost expansion opportunities
• Strong customer focus
• Experienced management team / sustainable
organization
organization

19
2010 Analyst Meeting
Opportunities Just Beginning
• Storage fundamentals remain strong
– Natural gas market is growing
– Significant barriers now exist to develop new storage
• Uncertainty remains challenging
– Credit markets - Commodity price
– Inflation - Market participates
– Interest rates - Renewable energy sources
– Demand - Carbon / greenhouse gas legislation
– Supply sources
• Next cycle will come
• Long-term view