Attached files
| file | filename |
|---|---|
| 8-K - FORM 8-K - TTM TECHNOLOGIES INC | f8k_050510.htm |
| EX-99 - EXHIBIT 99.1 - TTM TECHNOLOGIES INC | exh_991.htm |
EXHIBIT 99.2

Global Presence / Local Knowledge
2010 First Quarter Earnings Call & Update
May 6, 2010

2
2
Safe Harbor
During the course of this call, the company will make forward-looking statements subject
to known and unknown risks and uncertainties that could cause actual results to differ
materially from those expressed or implied by such statements. Such risks and
uncertainties include, but are not limited to, fluctuations in quarterly and annual operating
results, the volatility and cyclicality of various industries that the company serves and the
impact of the current economic crisis and other risks described in TTM’s most recent
SEC filings. The company assumes no obligation to update the information provided in
this conference call.
The company also will present non-GAAP financial information in this call. For a
reconciliation of TTM’s non-GAAP financial information to the equivalent measures under
GAAP, please refer to the company’s press release, which was filed with the SEC and
which is posted on TTM’s website.
reconciliation of TTM’s non-GAAP financial information to the equivalent measures under
GAAP, please refer to the company’s press release, which was filed with the SEC and
which is posted on TTM’s website.

Global Presence / Local Knowledge
3
Q1 Overview
Kent Alder, CEO & President

4
Strategic Overview
4
A stronger, world-class PCB
manufacturer with the scale,
production capabilities,
market breadth and
expanded customer service
ability to lead in today’s
competitive global PCB
marketplace.
manufacturer with the scale,
production capabilities,
market breadth and
expanded customer service
ability to lead in today’s
competitive global PCB
marketplace.
Restructuring
largely complete
largely complete
Combination with
Meadville complete
Meadville complete

5
5
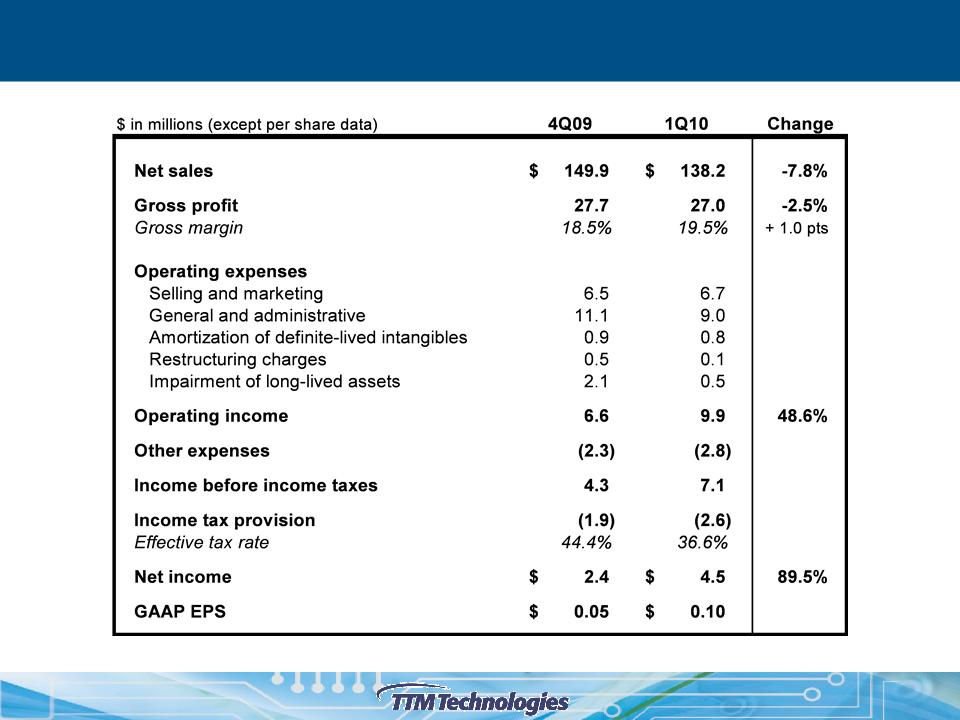
Q1 2010 Highlights
1) Gross margin improved from 18.5 percent to 19.5 percent
– Revenue of $138.2 million came in at the upper end of guidance range
– 2009 strategic restructuring working as planned
2) Cash generation of $7.2 million in the quarter
– Cash and cash equivalents, restricted cash and short term investments
increased from $215.7 million in the fourth quarter to $222.9 million in
the first quarter
increased from $215.7 million in the fourth quarter to $222.9 million in
the first quarter
3) Improved market conditions
– Commercial market supported firmer pricing especially in quick-turn
– Aerospace & Defense pricing higher due to product mix

6
$ in millions
Q1 2010 Segment Results

7
7
Q1 2010 End Market Update
• Aerospace & Defense
– Broad base of diverse programs provide stability
and growth
and growth
– Second quarter forecast stable
• Networking/Communications
– Percentages down due to increased orders
shipped at the end of Q4
shipped at the end of Q4
– Second quarter forecast up due to more normal
ordering patterns and end market strength
ordering patterns and end market strength
|
End Market
|
4Q09
|
1Q10
|
|
Aerospace & Defense
|
42%
|
42%
|
|
Networking /
Communications |
38%
|
33%
|
|
Computing / Storage /
Peripherals |
10%
|
13%
|
|
Medical / Industrial /
Instrument / Other |
10%
|
12%
|
End Markets
• Medical / Industrial / Instrumentation / Other
– Increased on overall segment strength led by Medical and Instrumentation
– Second quarter up on continued broad based strength
• Computing / Storage / Peripherals
– Improvement due to increased orders from a large server and storage customer
– Sustain first quarter revenue level in the second quarter

8
8
Q1 2010 Customer & Order Update
|
Top 5
1Q10 |
31%
|
BAE, Cisco, Hamilton Sundstrand,
Huawei, Raytheon |
|
Top 5
4Q09 |
34%
|
Cisco, Huawei, Juniper Networks,
Northrop Grumman, Raytheon |
Top 5 OEM Customers
alphabetical order
|
Commercial
|
5 - 10
weeks |
6 - 10
weeks |
Stable
|
|
Aerospace &
Defense |
5 - 8
weeks* |
5 - 8
weeks* |
Stable
|
Lead Times
4Q09
1Q10
* Some A&D products require 14-20 weeks lead time
TTM and IPC Book to Bill
Status
• No single customer represented 10 percent or more
of sales during 4Q09 and 1Q10
|
TTM
|
1.05
|
1.08
|
1.12
|
|
IPC
|
1.06
|
1.09
|
1.10
|
4Q09
1Q10
3Q09
• Stable to slightly longer lead time at commercial
plants
plants
• Lead time unchanged for Aerospace & Defense plants
• Strong book to bill reflects improving market
conditions

Global Presence / Local Knowledge
9
Financial Overview
Steve Richards, CFO
10
10
Income Statement - Q1 vs. Q4

11
11
Non-GAAP Results - Q1 vs. Q4
1 Non-GAAP net income & EPS, EDITDA and adjusted EBITDA in this slide are defined in our 1Q 2010 press release

Global Presence / Local Knowledge
12
Meadville Update
13
Aerospace /
Defense
• No. 1 North American
supplier
supplier
• Rigid Flex and specialty
PCB products
PCB products
• Backplane and
subassembly
subassembly
Time
• Dedicated ultra-short
lead time capability
(<24 hours available)
lead time capability
(<24 hours available)
• Dedicated, highly
flexible, ramp-to-
volume production in
<10 days
flexible, ramp-to-
volume production in
<10 days
• High-mix complex
technology production
with standard
technology production
with standard
delivery
Financial Strength
• Focus on operational
excellence
excellence
• Superior asset management
and strong balance sheet
and strong balance sheet
• Strong cash flow generation
• Successful integration of
strategic acquisitions
strategic acquisitions
Technology
• High performance,
technologically complex
PCBs
technologically complex
PCBs
• Advanced manufacturing
processes & technology
expertise
processes & technology
expertise
• Industry-leading average
layer count of 20+ at
Chippewa Falls facility
layer count of 20+ at
Chippewa Falls facility
Industry-Leading
Execution and
Financial Results
Execution and
Financial Results
Global Presence -
Asian Capacity
• High volume capability
• Capture incremental business
from existing customers
from existing customers
• Seamless transition of prototype
to volume production
to volume production
• Footprint to supply growing
Asian demand
Asian demand
• Established financial model with
leading growth and margin profile
leading growth and margin profile
• Excellent management team with
extensive China manufacturing
expertise
extensive China manufacturing
expertise
• Strong cultural fit - with similar
business philosophies
business philosophies
• Advanced technology capabilities -
best fit with TTM
best fit with TTM
• Specialized facility strategy
• Complementary customer base
consisting of Tier 1 OEMs
consisting of Tier 1 OEMs
• Diversified end-market mix
• Cost effective platform with
significant China manufacturing
capacity
significant China manufacturing
capacity
TTM’s Asian M&A Criteria
Meadville
PCB Position
PCB Position
TTM Strategy

14
R&D
Growth
Maturity
NPI
Total Solution Capabilities
• Engineering support
• Prototype
• Low volume / High mix
• Medium volume / Ramp
• Volume production
Product Life Cycle
Advanced
Technology &
Service Excellence
Technology &
Service Excellence
Total Customer Solution
15
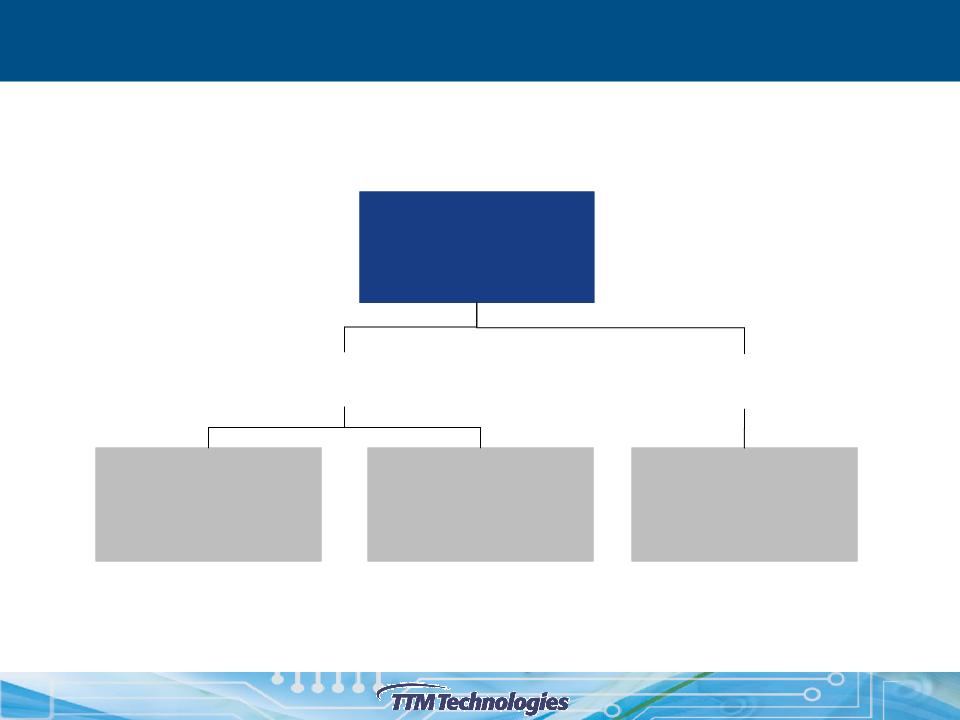
Organization Structure
TTM Corporate
Headquarters
Santa Ana, CA U.S.A.
U.S. / Shanghai
Assembly Business
Assembly Business
(1 plant in U.S.,
1 plant in China)
U.S. PCB
Business
Business
(6 plants in U.S.)
Asian PCB
Business
(7 plants in China,
1 plant in Hong Kong)
Existing TTM
management team
management team
Existing Meadville
management team
management team

16
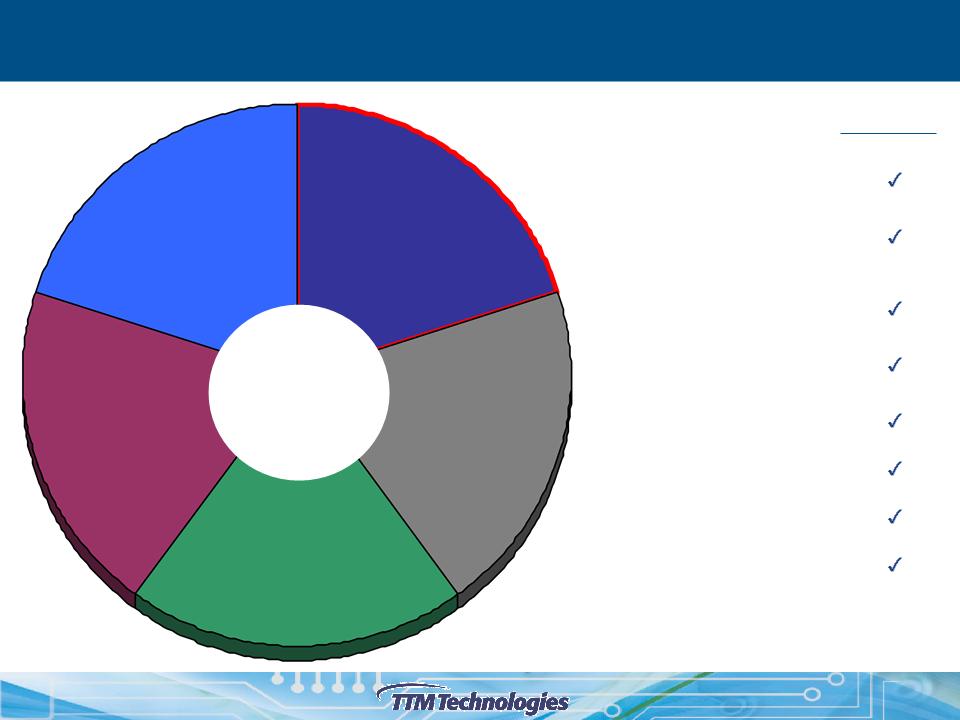
Revenue
by
End-Market
End-Market
TTM
Pro Forma
Meadville PCB
TTM
Pro Forma
Meadville PCB
Source: Company filings. Revenue for the calendar year 2009 period
The combination creates a leading global manufacturer with a highly diversified revenue mix
Notes:
Americas includes United States, Canada, Central and South America. Greater China includes China, Hong Kong and Taiwan. Asia includes Asian countries excluding Greater China
EMEA includes Europe, Middle East and Africa
Diversifying Revenue Base
Revenue
by
Geography

17
17
Accretion and Synergies
Accretion estimate
• Transaction expected to be accretive in the third quarter of 2010
Revenue synergies
• Qualification process varies by customer
• Asian facilities ran at 75 to 95 percent of capacity in the first quarter
• Expanding capacity to accommodate growth
• 2010 potential from “simple qualification” customers
• Targeting “comprehensive qualification” customers for late 2010 and 2011
Cost synergies
• Minimal duplicative public company costs
• Better negotiations on direct materials due to larger scale of combined
operations
operations
• Transfer of best practices

18
Update on Board & Stockholders
• Ownership of shares
– 36.3 million shares issued: 26.2 million to Tang family and 10.1 million to
minority shareholders
minority shareholders
– Meadville’s minority investors request to sell approximately 1.3 million
shares of TTM stock
shares of TTM stock
– Tang family, TTM’s largest minority shareholder, to retain 33 to 35
percent stake in TTM
percent stake in TTM
• Trading restrictions
– Tang family agreement prohibits sale of shares for 18 months; credit
agreement requires Tangs to hold 20 percent stake in TTM
agreement requires Tangs to hold 20 percent stake in TTM
• Expansion of board
– Addition of Tom Tang, Managing Director of Asia Pacific Region
– Three new Government Security Committee members

19
19
2009 Pro Forma Combined Income Statement
1 Pro forma adjustments are disclosed in the Form 8-K/A filed with the SEC on April 26, 2010

20
Transaction Summary
• Final purchase price
– $114 million in cash
– 36.3 million shares of TTM stock
• Closing market value of $329 million assuming closing market price of $9.06
per share on April 8, 2010
per share on April 8, 2010
– Assumed $433 million of Meadville debt
– Total: $876 million
• EBITDA multiple
– $876 million / $114.6 million adjusted EBITDA = 7.6 implied multiple
• Leverage ratio
– Including TTM’s convertible debt of $175 million, initial leverage ratio is
about 3.3 times combined 2009 EBITDA
about 3.3 times combined 2009 EBITDA
– Goal is to be under 3 times EBITDA within first year following deal close
21
21
First Quarter Review - Meadville
• Performance updates
– Revenue was $159 million in the first quarter. Forecasting higher
revenue in the second quarter
revenue in the second quarter
– Material costs increasing - negotiating price increases with customers to
offset
offset
– Book to bill for the first quarter was strong at 1.2
• End markets
– In general, end markets remained steady with fourth quarter 2009 as a
percent of sales
percent of sales
– The Computing end market benefited from a new product launch by a
major customer
major customer
• Capacity expansion
– Planned enhancements to physical plant capacity are in progress and
should be production ready by third quarter 2010
should be production ready by third quarter 2010
– This increase in overall capacity is anticipated to raise quarterly revenue
by 10 to 14 percent by first quarter 2011
by 10 to 14 percent by first quarter 2011

22
22
Q2 2010 Guidance
|
Revenue
|
$290 - $310
|
|
GAAP EPS
|
$0.03 - $0.12
|
|
Non-GAAP EPS
|
$0.16 - $0.25
|
($millions)
EPS based on approximately 76.5 million shares
• U.S. revenue expected to rise by 5 percent at plants with commercial focus and remain
steady at Aerospace/Defense plants; Backplane Assembly revenue expected to decrease
by about 10 percent due to Hayward facility closure
steady at Aerospace/Defense plants; Backplane Assembly revenue expected to decrease
by about 10 percent due to Hayward facility closure
• Asian operations should experience revenue growth in computing, cell phones
• Purchase accounting will raise COGS by about $4.5 million for inventory mark-up
• Forecast reflects $7.7 million in transaction costs, primarily payments to advisor