Attached files
| file | filename |
|---|---|
| 8-K - FORM 8-K - Forestar Group Inc. | d72804e8vk.htm |
| EX-99.1 - EX-99.1 - Forestar Group Inc. | d72804exv99w1.htm |
Exhibit 99.2

| 1 May 6, 2010 First Quarter 2010 Financial Results May 7, 2010 |

| 2 Forward Looking Statements This presentation contains "forward-looking statements" within the meaning of the federal securities laws. These statements reflect management's current views with respect to future events and are subject to risk and uncertainties. We note that a variety of factors and uncertainties could cause our actual results to differ significantly from the results discussed in the forward-looking statements. Factors and uncertainties that might cause such differences include, but are not limited to: general economic, market, or business conditions; the opportunities (or lack thereof) that may be presented to us and that we may pursue; fluctuations in costs and expenses including development costs; demand for new housing, including impacts from mortgage credit availability; lengthy and uncertain entitlement processes; cyclicality of our businesses; accuracy of accounting assumptions; competitive actions by other companies; changes in laws or regulations; and other factors, many of which are beyond our control. Except as required by law, we expressly disclaim any obligation to publicly revise any forward- looking statements contained in this presentation to reflect the occurrence of events after the date of this presentation. |

| First Quarter 2010 Results 3 ($ in Millions, except per share data) 1st Qtr 2010 1st Qtr 2009 4th Qtr 2009 Net Income ($3.0) ($3.9) ($7.4) Earnings Per Share - Basic ($0.08) ($0.11) ($0.21) 1st Qtr 2010 weighted average basic shares outstanding were 36.1 million 1st Qtr. 2010 results negatively impacted by $1.8 million increase in non-cash share-based compensation expense compared with 1st Qtr. 2009, principally due to increase in stock price 1st Qtr 2009 financial results include approximately $3.2 million paid to outside advisors regarding an evaluation by our Board of Directors of an unsolicited shareholder proposal |
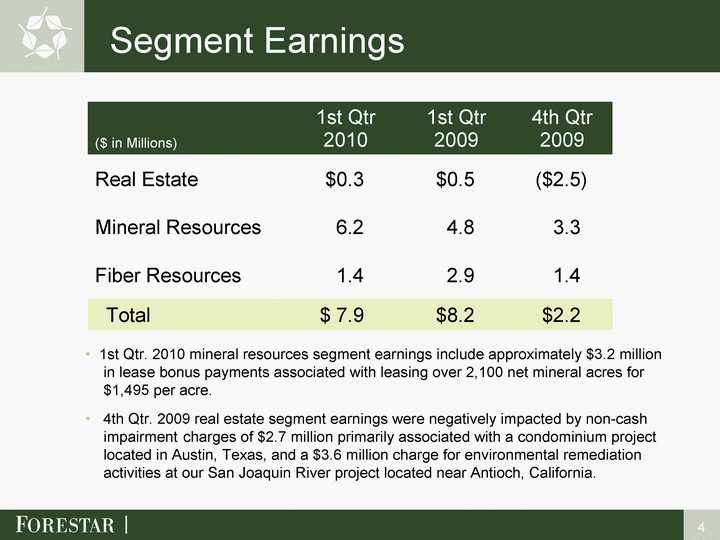
| Segment Earnings 4 ($ in Millions) 1st Qtr 2010 1st Qtr 2009 4th Qtr 2009 Real Estate $0.3 $0.5 ($2.5) Mineral Resources 6.2 4.8 3.3 Fiber Resources 1.4 2.9 1.4 Total $ 7.9 $8.2 $2.2 1st Qtr. 2010 mineral resources segment earnings include approximately $3.2 million in lease bonus payments associated with leasing over 2,100 net mineral acres for $1,495 per acre. 4th Qtr. 2009 real estate segment earnings were negatively impacted by non-cash impairment charges of $2.7 million primarily associated with a condominium project located in Austin, Texas, and a $3.6 million charge for environmental remediation activities at our San Joaquin River project located near Antioch, California. |
| 5 May 6, 2010 1st Qtr 2010 Results and Key Performance Indicators 5 Strategy and Initiative Execution Have Forestar Well Positioned |

| 6 Housing Starts* Normal Real Estate Cycle** Forestar is well positioned to capitalize on growth in housing starts ** Source: CEL & Associates, Inc. Real Estate Market Conditions Forestar Market Fundamentals: Affordability - good Consumer confidence - improving Mortgage rates - good Economic activity - improving Inventory - good Current foreclosure rates - limited Issues: Job growth * Housing Starts = SAAR; Thousand Units |

| 7 Real Estate Segment KPI's 1st Qtr 2010 1st Qtr 2009 4th Qtr 2009 Residential Lot Sales * Lots Sold 195 107 202 Average Price / Lot $49,500 $72,400 $45,000 Gross Profit / Lot $14,300 $27,000 $12,600 Commercial Tract Sales * Acres Sold 1.6 4.1 0.3 Average Price / Acre $172,800 $215,600 $87,000 Land Sales * Acres Sold 2,088 2,192 3,240 Average Price / Acre $2,300 $3,800 $3,100 Segment Revenues ($ in millions) $17.2 $18.8 $24.3 Segment Earnings ($ in millions) $0.3 $0.5 ($2.5) * Includes 100% of venture activity |

| Residential Lot Sales 8 Note: Includes ventures $49,500 Residential Lot Sales Average Annual Lot Price 2006 Average Price Per Lot * Excludes bulk sale of 117 lots at project located near Fort Worth, Texas |

| Forestar Residential Lot Inventory 9 Note: Includes ventures 2007 2008 |
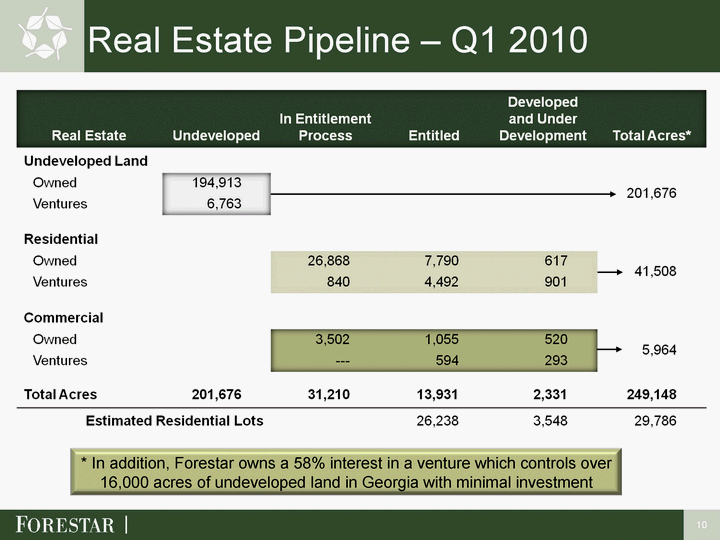
| Real Estate Pipeline - Q1 2010 * In addition, Forestar owns a 58% interest in a venture which controls over 16,000 acres of undeveloped land in Georgia with minimal investment 10 |

| 11 Entitlement Activity - Q1 2010 Entitlements 153 Single-family acres 3 Commercial acres 156 Total acres 821 residential lots Location near Austin, TX Austin, TX MSA Solid market fundamentals: < 7.9 New Home MOS 5.1 Existing Home MOS < 2% Foreclosure Inventory Lower Unemployment Increased Housing Affordability Site Location Entitlement value creation in solid market - minimal capital investment Entrada * Site plans subject to change 5 mile radius 10 mile radius |

| 12 Forestar is well positioned to take advantage of improving oil and gas markets Oil & Gas Market Conditions Near-Term Fundamentals: Oil prices supported by reduced supply and anticipation of economic growth Natural gas prices pressured by elevated inventories and supply E&P companies drilling to hold leases and prove reserves vs. increasing lease acreage Long-Term Fundamentals: Strong Macro & Global Outlook Companies Refocusing on U.S. / Canada Onshore Long-Lived Assets Attractive lower-risk investments Unconventional resource plays expanding Significant reserve potential U.S. Energy Policy Themes: Clean - Self-Sufficient - Sustainable |

| 13 Mineral Resources Segment KPI's 1st Qtr 2010 1st Qtr 2009 4th Qtr 2009 Minerals Net Acres Leased 2,130 6,116 720 Average Bonus / Acre $1,495 $347 $662 Natural Gas Production (MMCF) 373.2 394.7 586.5 Average Price / MCF $4.30 $6.16 $3.15 Oil Production (Barrels) 29,400 27,300 30,800 Average Price / Barrel $71.26 $46.78 $66.62 Segment Revenues ($ in millions) $7.1 $5.9 $4.5 Segment Earnings ($ in millions) $6.2 $4.8 $3.3 |
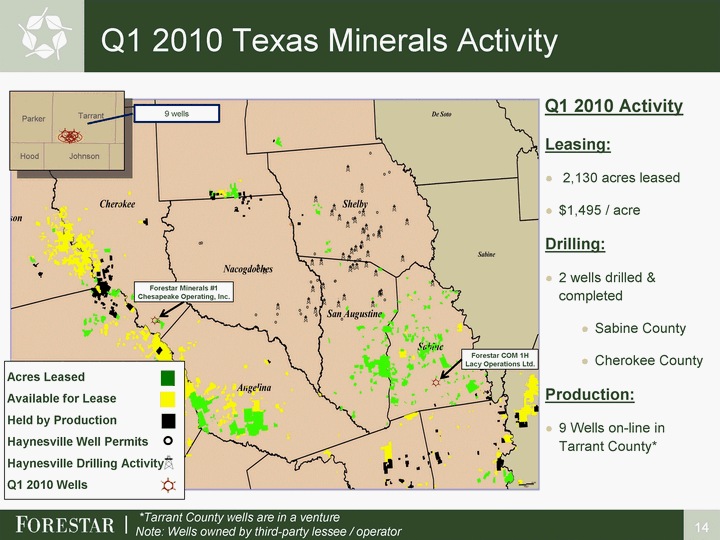
| Q1 2010 Texas Minerals Activity 14 *Tarrant County wells are in a venture Note: Wells owned by third-party lessee / operator Leasing: 2,130 acres leased $1,495 / acre Drilling: 2 wells drilled & completed Sabine County Cherokee County Production: 9 Wells on-line in Tarrant County* Q1 2010 Activity Parker Tarrant Hood Johnson Acres Leased Available for Lease Held by Production Haynesville Well Permits Haynesville Drilling Activity Q1 2010 Wells Forestar Minerals #1 Chesapeake Operating, Inc. Forestar COM 1H Lacy Operations Ltd. |

| 15 Fiber Resources Segment KPI's 1st Qtr 2010 1st Qtr 2009 4th Qtr 2009 Fiber Sales Pulpwood Tons Sold 83,100 206,600 143,300 Average Pulpwood Price / Ton $10.92 $8.15 $9.76 Sawtimber Tons Sold 29,600 90,700 40,900 Average Sawtimber Price / Ton $20.14 $22.84 $18.93 Total Tons Sold 112,700 297,300 184,200 Average Price / Ton $13.34 $12.63 $11.80 Recreational Leases (acres) 211,000 299,000 213,900 Segment Revenues ($ in millions) $2.0 $4.4 $2.6 Segment Earnings ($ in millions) $1.4 $2.9 $1.4 Timberland Acres 225,000 338,000 227,000 |
| 16 Right Strategy Experienced Management Team Strong Balance Sheet, Assets & Projects Strategy and Initiative Execution Have Forestar Well Positioned |

| 17 May 6, 2010 |