Attached files
| file | filename |
|---|---|
| 8-K - 8-K - Tennessee Commerce Bancorp, Inc. | a10-9393_18k.htm |
Exhibit 99.1
|
|
TENNESSEE COMMERCE BANCORP, INC. Investor Presentation NASDAQ: TNCC www.tncommercebank.com May 2010 |
|
|
2 Cautionary Note Regarding Forward-Looking Statements This presentation contains forward-looking statements within the meaning of Section 27A of the Securities Act of 1933 and Section 21E of the Securities Exchange Act of 1934. Forward-looking statements, which are based on assumptions and estimates and describe our future plans, strategies, and expectations, are generally identifiable by the use of the words “anticipate,” “will,” “believe,” “may,” “could,” “would,” “should,” “estimate,” “expect,” “intend,” “seek,” or similar expressions. These forward-looking statements may address, among other things, business model, lending transactions, returns on small indirect lending, exposure to commodity equipment, opportunities provided by courier and electronic service products, non-interest bearing deposits, real estate construction loans, non-performing loans, loans in our Nashville regional portfolio, return on average assets, return on average equity, earnings per share, capital raisings, capital resources, ratio of price to tangil. Although these statements reflect our good faith belief based on current expectations, estimates and projections, they are subject to risks, uncertainties and assumptions, and are not guarantees of future performance. Important factors that could cause actual results to differ materially from the forward-looking statements we make in this presentation include, but are not limited to: Our concentration of commercial loans and commercial real estate loans; The sufficiency of our current sources of funds; Our reliance on internet and brokered deposits; The effect of capital constraints on our pace of growth and our ability to raise additional capital when needed; The adequacy of our allowance for loan losses; Informal or formal enforcement actions to which we may become subject; Our reliance on the services of key personnel; The success of the local economies in which we do business; The potential disposition of collateral upon foreclosure with respect to our national market funding outside of the Nashville MSA; The execution of our business strategies; Competition from financial institutions and other financial service providers; Material fluctuations in non-interest income; Negative developments in the financial services industry and U.S. and global credit markets; The effect of recent legislative and regulatory initiatives to address difficult market and economic conditions on the stabilization of the U.S. banking system; Changes in interest rates; The limitation or restriction of our activities as a result of the extensive regulation to which we are subject; Our ability to return capital to our shareholders as a result of our issuance of securities to Treasury; The right of holders of our Series A Preferred Stock; The senior rights of holders of our subordinated debentures; and Other factors detailed from time to time in our press releases and filings with the Securities and Exchange Commission If one or more of these risks or uncertainties materialize, or if any of our underlying assumptions prove incorrect, our actual results, performance, or achievements may vary materially for future results, performance, or achievements expressed or implied by these forward-looking statements. All forward-looking statements attributable to us or persons acting on our behalf are expressly qualified in their entirety by the cautionary statements in this section. We do not intend to and assume no responsibility for updating or revising any forward-looking statements contained in this presentation, whether as a result of new information, future events, or otherwise. Explanation of Non-GAAP Financial Measures Reported amounts are presented in accordance with accounting principles generally accepted in the United States of America ("GAAP"). The Company's management believes that the supplemental non-GAAP information, which consists of measurements and ratios based on tangible equity and tangible assets, is utilized by regulators and market analysts to evaluate a company's financial condition and therefore, such information is useful to investors. These disclosures should not be viewed as a substitute for financial results determined in accordance with GAAP, nor are they necessarily comparable to non-GAAP performance measures which may be presented by other companies. The Company also uses an efficiency ratio that is a non-GAAP financial measure. The ratio that the Company uses excludes expenses on other real estate owned and other repossessed assets and, where applicable, long-term debt prepayment fees. Income for the non-GAAP ratio is increased by the favorable effect of tax-exempt income and excludes securities gains and losses, which can vary from period to period. The Company uses this ratio because it believes the ratio provides a better comparison of period to period operating performance. |
|
|
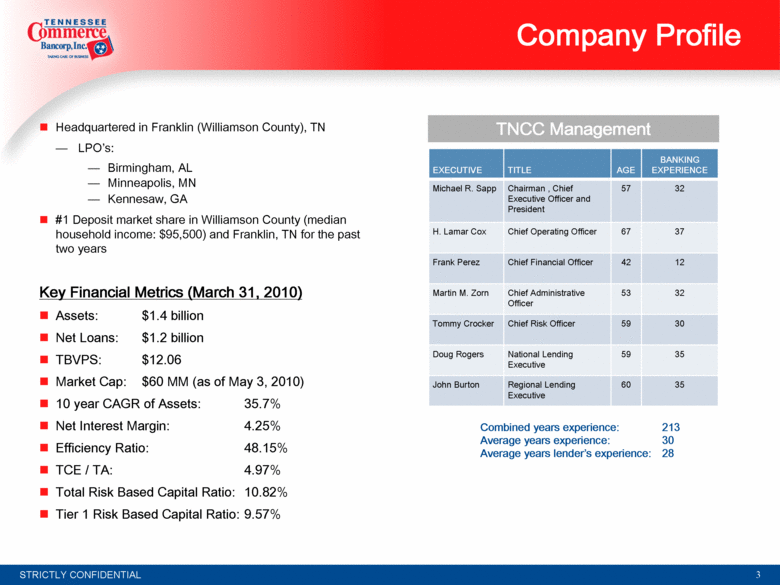
3 Company Profile Headquartered in Franklin (Williamson County), TN LPO’s: Birmingham, AL Minneapolis, MN Kennesaw, GA #1 Deposit market share in Williamson County (median household income: $95,500) and Franklin, TN for the past two years Key Financial Metrics (March 31, 2010) Assets: $1.4 billion Net Loans: $1.2 billion TBVPS: $12.06 Market Cap: $60 MM (as of May 3, 2010) 10 year CAGR of Assets: 35.7% Net Interest Margin: 4.25% Efficiency Ratio: 48.15% TCE / TA: 4.97% Total Risk Based Capital Ratio: 10.82% Tier 1 Risk Based Capital Ratio: 9.57% EXECUTIVE TITLE AGE BANKING EXPERIENCE Michael R. Sapp Chairman , Chief Executive Officer and President 57 32 H. Lamar Cox Chief Operating Officer 67 37 Frank Perez Chief Financial Officer 42 12 Martin M. Zorn Chief Administrative Officer 53 32 Tommy Crocker Chief Risk Officer 59 30 Doug Rogers National Lending Executive 59 35 John Burton Regional Lending Executive 60 35 Combined years experience: 213 Average years experience: 30 Average years lender’s experience: 28 TNCC Management |
|
|
4 Business Model C&I focused secured lender to middle-market segment C&I lender for over a decade Serve owner managed businesses, entrepreneurs and professionals Long-term relationship driven, understanding of our clients’ business and cash flows Expertise in asset-based lending, equipment finance and tax advantaged lending High customer retention Scalable business platform and efficient operating model “Seasoned” bankers with an average tenure of 28 years – multiple cycle experience Not the cheapest game in town, but high customer attraction and retention due to service oriented business model Ability for above average growth with above average return on capital |
|
|
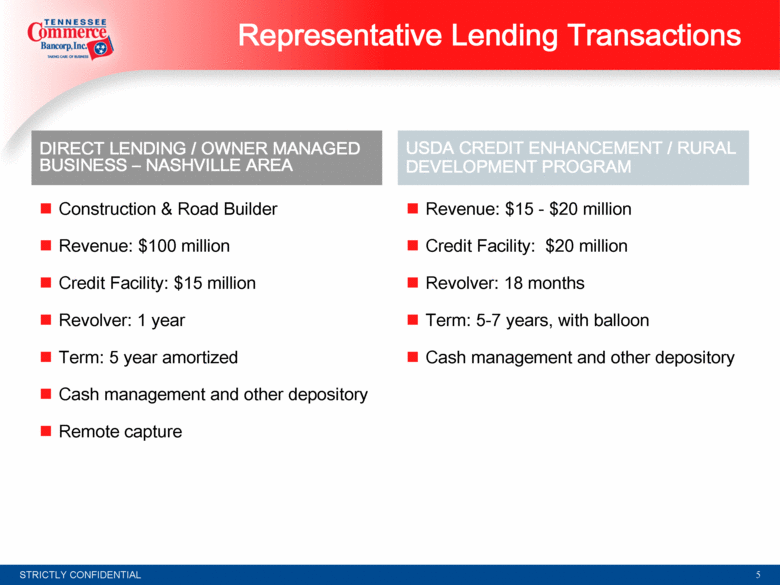
5 Representative Lending Transactions Construction & Road Builder Revenue: $100 million Credit Facility: $15 million Revolver: 1 year Term: 5 year amortized Cash management and other depository Remote capture Revenue: $15 - $20 million Credit Facility: $20 million Revolver: 18 months Term: 5-7 years, with balloon Cash management and other depository DIRECT LENDING / OWNER MANAGED BUSINESS – NASHVILLE AREA USDA CREDIT ENHANCEMENT / RURAL DEVELOPMENT PROGRAM |
|
|
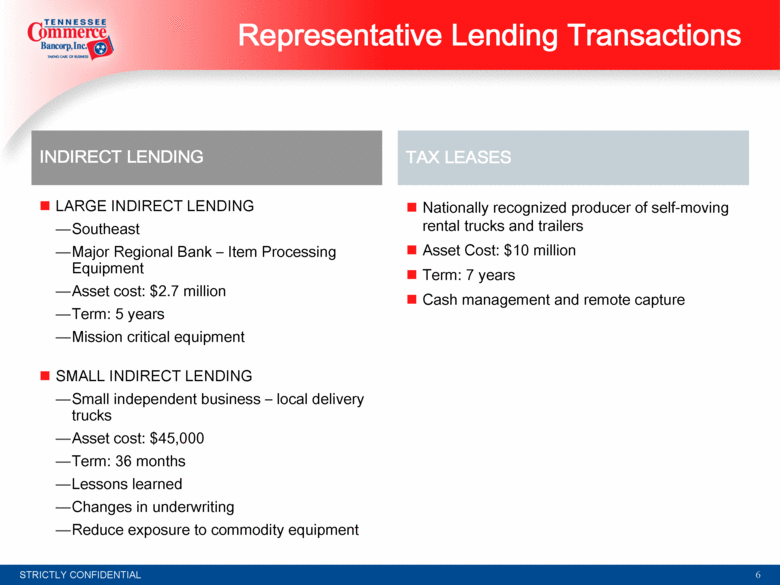
6 Representative Lending Transactions LARGE INDIRECT LENDING Southeast Major Regional Bank – Item Processing Equipment Asset cost: $2.7 million Term: 5 years Mission critical equipment SMALL INDIRECT LENDING Small independent business – local delivery trucks Asset cost: $45,000 Term: 36 months Lessons learned Changes in underwriting Reduce exposure to commodity equipment Nationally recognized producer of self-moving rental trucks and trailers Asset Cost: $10 million Term: 7 years Cash management and remote capture INDIRECT LENDING TAX LEASES |
|
|
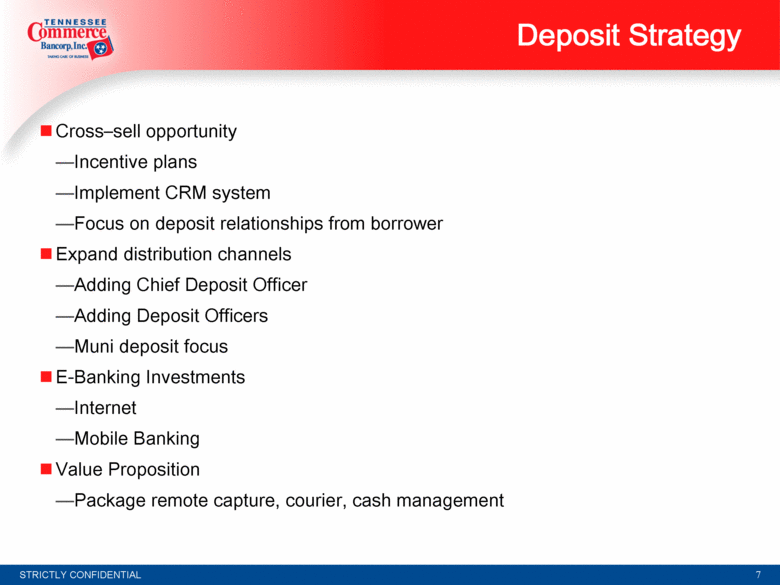
7 Deposit Strategy Cross–sell opportunity Incentive plans Implement CRM system Focus on deposit relationships from borrower Expand distribution channels Adding Chief Deposit Officer Adding Deposit Officers Muni deposit focus E-Banking Investments Internet Mobile Banking Value Proposition Package remote capture, courier, cash management |
|
|
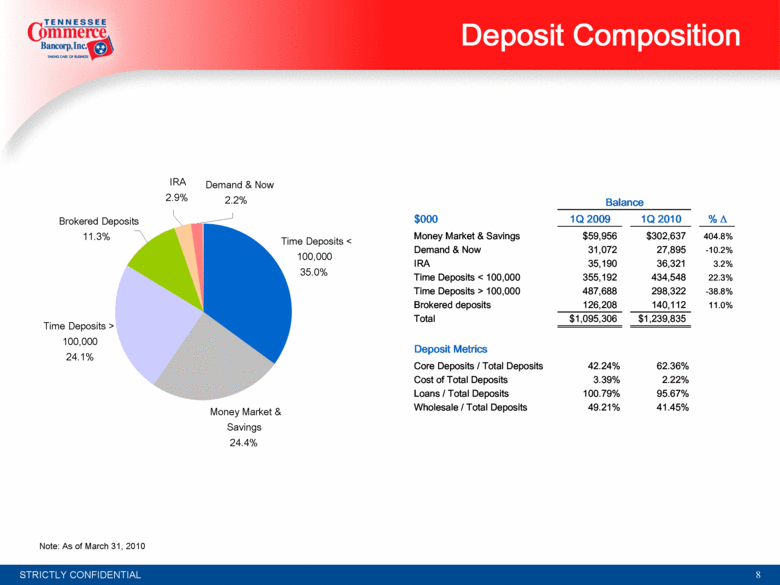
8 Deposit Composition Note: As of March 31, 2010 Money Market & Savings 24.4% Time Deposits < 100,000 35.0% Demand and & Now 2.2% Brokered Deposits 11.3% IRA 2.9% Time Deposits > 100,000 24.1% Balance $000 1Q 2009 1Q 2010 % Money Market & Savings $59,956 $302,637 404.8% Demand & Now 31,072 27,895 -10.2% IRA 35,190 36,321 3.2% Time Deposits < 100,000 355,192 434,548 22.3% Time Deposits > 100,000 487,688 298,322 -38.8% Brokered deposits 126,208 140,112 11.0% Total $1,095,306 $1,239,835 Deposit Metrics Core Deposits / Total Deposits 42.24% 62.36% Cost of Total Deposits 3.39% 2.22% Loans / Total Deposits 100.79% 95.67% Wholesale / Total Deposits 49.21% 41.45% |
|
|
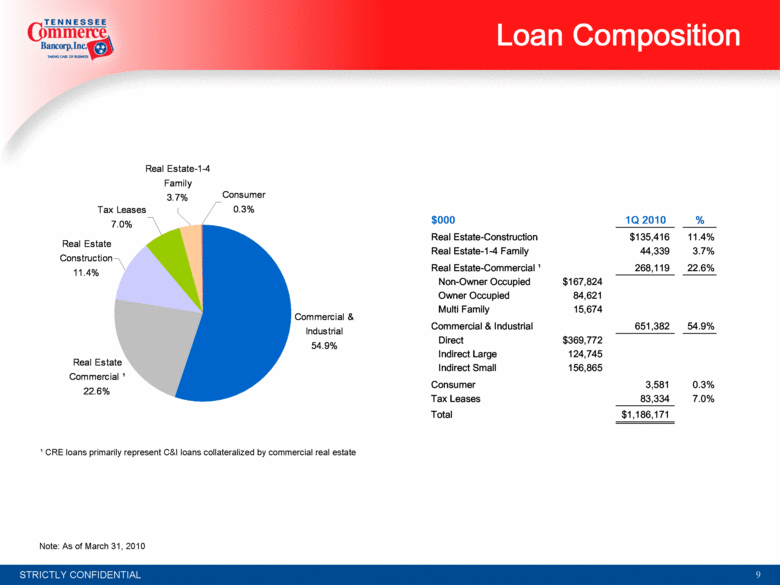
9 Loan Composition Note: As of March 31, 2010 1 CRE loans primarily represent C&I loans collateralized by commercial real estate $000 1Q 2010 % Real Estate-Construction $135,416 11.4% Real Estate-1-4 Family 44,339 3.7% Real Estate-Commercial ¹ 268,119 22.6% Non-Owner Occupied $167,824 Owner Occupied 84,621 Multi Family 15,674 Commercial & Industrial 651,382 54.9% Direct $369,772 Indirect Large 124,745 Indirect Small 156,865 Consumer 3,581 0.3% Tax Leases 83,334 7.0% Total $1,186,171 Commercial & Industrial 54.9% Real Estate Commercial ¹ 22.6% Real Estate Construction 11.4% Real Estate-1-4 Family 3.7% Tax Leases 7.0% Consumer 0.3% |
|
|
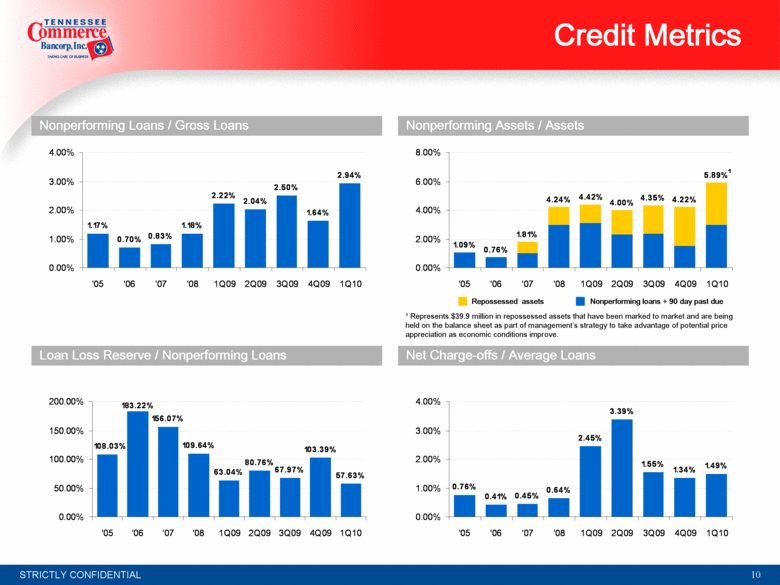
10 Credit Metrics Loan Loss Reserve / Nonperforming Loans Net Charge-offs / Average Loans Nonperforming Loans / Gross Loans Nonperforming Assets / Assets Repossessed assets Nonperforming loans + 90 day past due ¹ Represents $39.9 million in repossessed assets that have been marked to market and are being held on the balance sheet as part of management’s strategy to take advantage of potential price appreciation as economic conditions improve. 0.76% 0.41% 0.45% 0.64% 2.45% 3.39% 1.55% 1.34% 1.49% 0.00% 1.00% 2.00% 3.00% 4.00% 05 06 07 08 1Q09 2Q09 3Q09 4Q09 1Q10 1.17% 0.70% 0.83% 1.18% 2.22% 2.04% 2.50% 1.64% 2.94% 0.00% 1.00% 2.00% 3.00% 4.00% 05 06 07 08 1Q09 2Q09 3Q09 4Q09 1Q10 1.09% 0.76% 1.81% 4.24% 4.42% 4.00% 4.35% 4.22% 5.89%1 0.00% 2.00% 4.00% 6.00% 8.00% 05 06 07 08 1Q09 2Q09 3Q09 4Q09 1Q10 108.03% 183.22% 156.07% 109.64% 63.04% 80.76% 67.97% 103.39% 57.63% 0.00% 50.00% 100.00% 150.00% 200.00% 05 06 07 08 1Q09 2Q09 3Q09 4Q09 1Q10 |
|
|
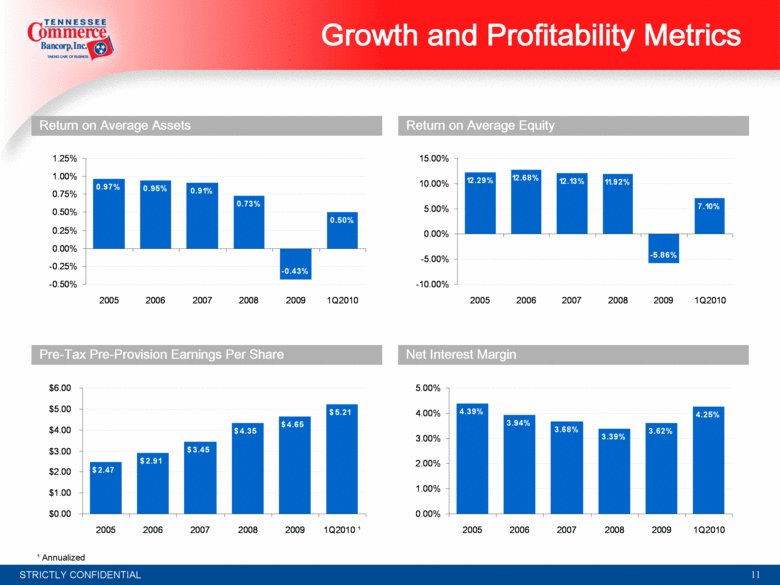
11 Growth and Profitability Metrics Return on Average Assets Return on Average Equity Pre-Tax Pre-Provision Earnings Per Share Net Interest Margin ¹ Annualized 0.97% 0.95% 0.91% 0.73% -0.43% 0.50% -0.50% -0.25% 0.00% 0.25% 0.50% 0.75% 1.00% 1.25% 2005 2006 2007 2008 2009 1Q2010 12.29% 12.68% 12.13% 11.92% -5.86% 7.10% -10.00% -5.00% 0.00% 5.00% 10.00% 15.00% 2005 2006 2007 2008 2009 1Q2010 4.39% 3.94% 3.68% 3.39% 3.62% 4.25% 0.00% 1.00% 2.00% 3.00% 4.00% 5.00% 2005 2006 2007 2008 2009 1Q2010 $6.00 $5.00 $5.21 $4.65 $4.00 $4.35 $3.00 $3.45 $2.91 $2.00$2.47 $1.00 $0.00 2005 2006 2007 2008 2009 |
|
|
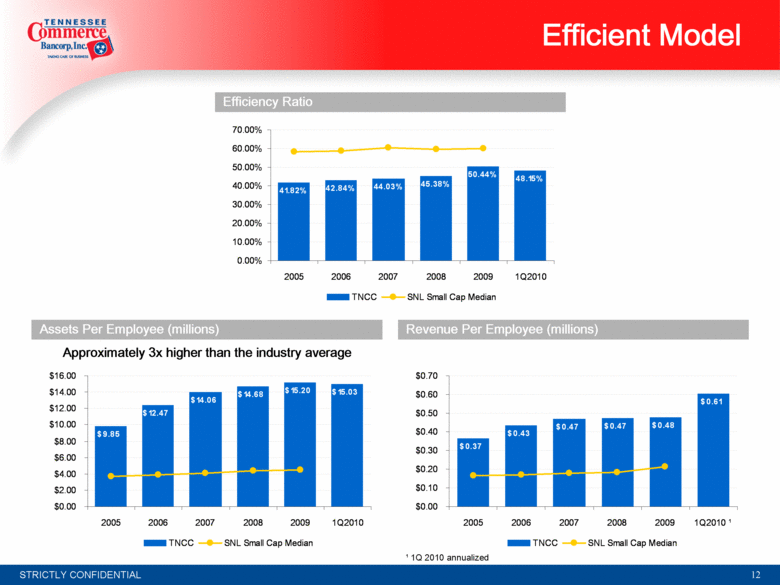
12 Efficient Model Efficiency Ratio Approximately 3x higher than the industry average Assets Per Employee (millions) Revenue Per Employee (millions) ¹ 1Q 2010 annualized $9.85 $12.47 $14.06 $14.68 $15.20 $15.03 $0.00 $2.00 $4.00 $6.00 $8.00 $10.00 $12.00 $14.00 $16.00 2005 2006 2007 2008 2009 1Q2010 TNCC SNL Small Cap Median $0.37 $0.43 $0.47 $0.47 $0.48 $0.61 $0.00 $0.10 $0.20 $0.30 $0.40 $0.50 $0.60 $0.70 2005 2006 2007 2008 2009 1Q2010 ¹ TNCC SNL Small Cap Median |
|
|
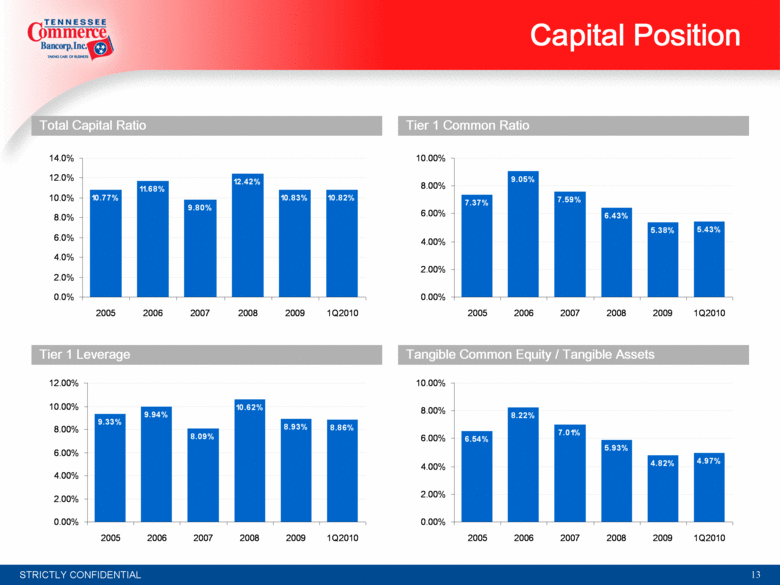
13 Capital Position Total Capital Ratio Tier 1 Common Ratio Tier 1 Leverage Tangible Common Equity / Tangible Assets 6.54% 8.22% 7.01% 5.93% 4.82% 4.97% 0.00% 2.00% 4.00% 6.00% 8.00% 10.00% 2005 2006 2007 2008 2009 1Q2010 10.77% 11.68% 9.80% 12.42% 10.83% 10.82% 0.0% 2.0% 4.0% 6.0% 8.0% 10.0% 12.0% 14.0% 2005 2006 2007 2008 2009 1Q2010 9.33% 9.94% 8.09% 10.62% 8.93% 8.86% 0.00% 2.00% 4.00% 6.00% 8.00% 10.00% 12.00% 2005 2006 2007 2008 2009 1Q2010 |
|
|
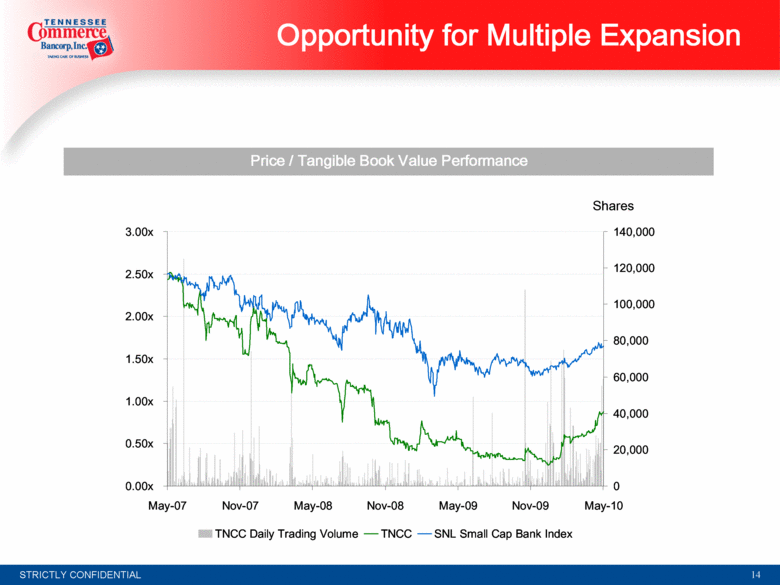
14 Opportunity for Multiple Expansion Price / Tangible Book Value Performance Shares 0.00x 0.50x 1.00x 1.50x 2.00x 2.50x 3.00x May-07 Nov-07 May-08 Nov-08 May-09 Nov-09 May-10 0 20,000 40,000 60,000 80,000 100,000 120,000 140,000 TNCC Daily Trading Volume TNCC SNL Small Cap Bank Index |
|
|
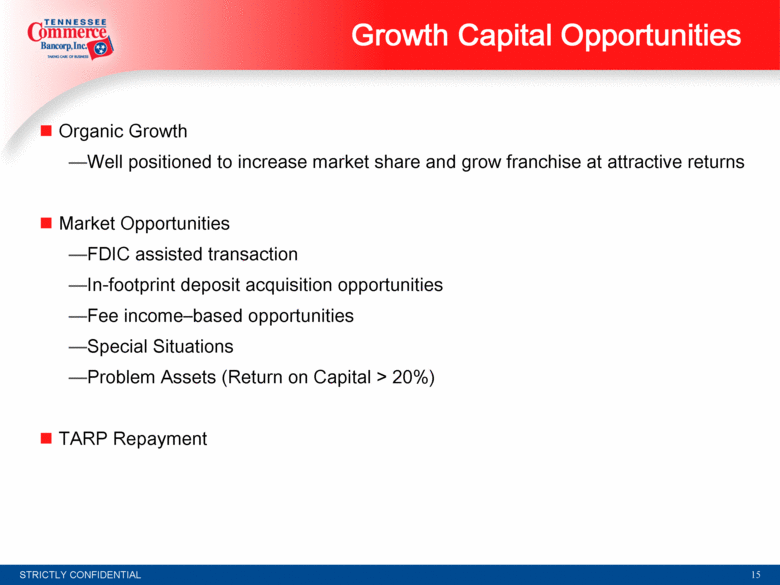
15 Organic Growth Well positioned to increase market share and grow franchise at attractive returns Market Opportunities FDIC assisted transaction In-footprint deposit acquisition opportunities Fee income–based opportunities Special Situations Problem Assets (Return on Capital > 20%) TARP Repayment Growth Capital Opportunities |
|
|
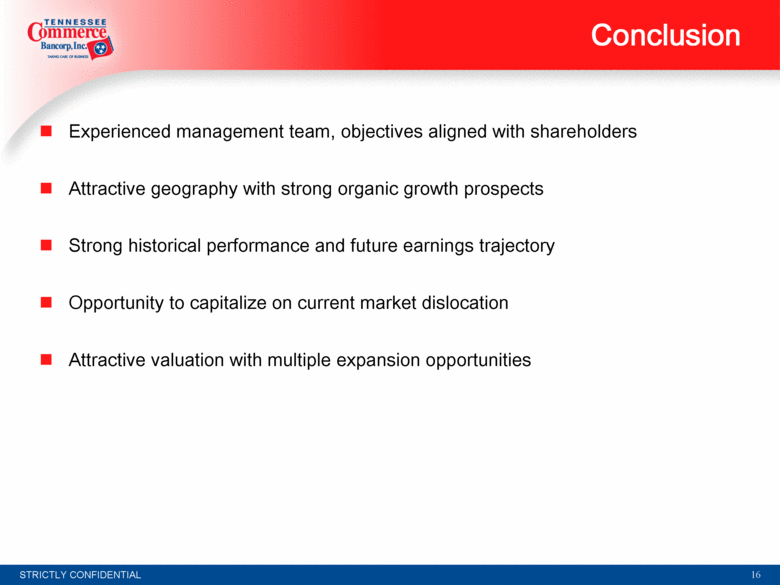
16 Experienced management team, objectives aligned with shareholders Attractive geography with strong organic growth prospects Strong historical performance and future earnings trajectory Opportunity to capitalize on current market dislocation Attractive valuation with multiple expansion opportunities Conclusion |
|
|
17 APPENDIX |
|
|
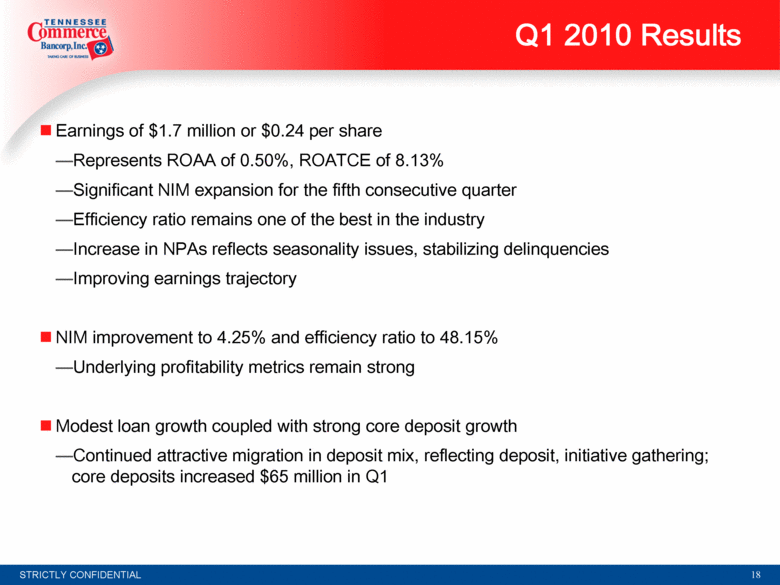
18 Q1 2010 Results Earnings of $1.7 million or $0.24 per share Represents ROAA of 0.50%, ROATCE of 8.13% Significant NIM expansion for the fifth consecutive quarter Efficiency ratio remains one of the best in the industry Increase in NPAs reflects seasonality issues, stabilizing delinquencies Improving earnings trajectory NIM improvement to 4.25% and efficiency ratio to 48.15% Underlying profitability metrics remain strong Modest loan growth coupled with strong core deposit growth Continued attractive migration in deposit mix, reflecting deposit, initiative gathering; core deposits increased $65 million in Q1 |
|
|
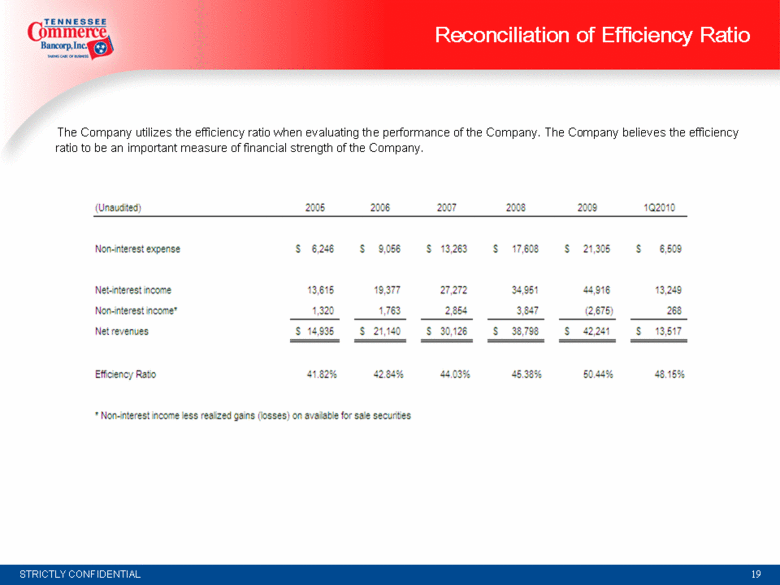
19 Reconciliation of Efficiency Ratio The Company utilizes the efficiency ratio when evaluating the performance of the Company. The Company believes the efficiency ratio to be an important measure of financial strength of the Company. (Unaudited) 2005 2006 2007 2008 2009 1Q2010 Non-interest expense $6,246 $9,056 $13,263 $17,608 $21,305 $6,509 Net-interest income 13,615 19,377 27,272 34,951 44,916 13,249 Non-interest income* 1,320 1,763 2,854 3,847 (2,675) 268 Net revenues $14,935 $21,140 $30,126 $38,798 $42,241 $13,517 Efficiency Ratio 41.82% 42.84% 44.03% 45.38% 50.44% 48.15% * Non-interest income less realized gains (losses) on available for sale securities |
|
|
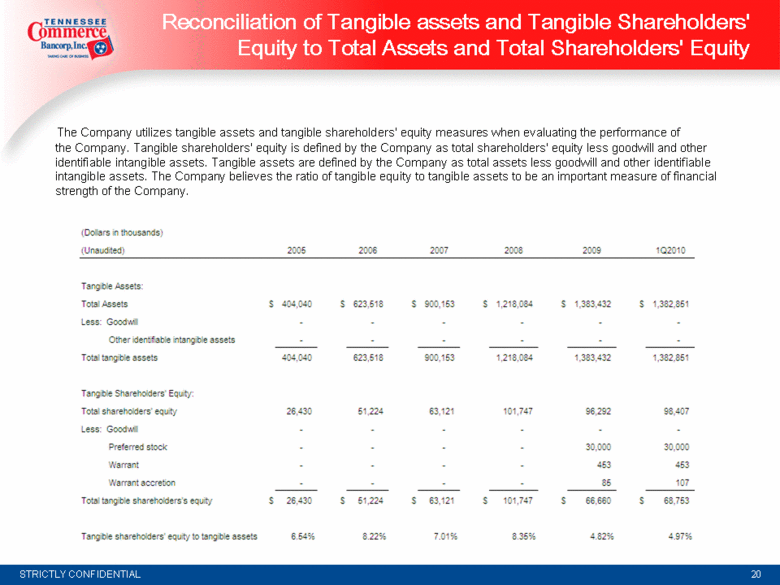
20 Reconciliation of Tangible assets and Tangible Shareholders' Equity to Total Assets and Total Shareholders' Equity The Company utilizes tangible assets and tangible shareholders' equity measures when evaluating the performance of the Company. Tangible shareholders' equity is defined by the Company as total shareholders' equity less goodwill and other identifiable intangible assets. Tangible assets are defined by the Company as total assets less goodwill and other identifiable intangible assets. The Company believes the ratio of tangible equity to tangible assets to be an important measure of financial strength of the Company. (Dollars in thousands) (Unaudited) 2005 2006 2007 2008 2009 1Q2010 Tangible Assets: Total Assets $ 404,040 $ 623,518 $ 900,153 $ 1,218,084 $1,383,432 $1,382,851 Less: Goodwill - - - - - - Other identifiable intangible assets - - - - - - Total tangible assets 404,040 623,518 900,153 1,218,084 1,383,432 1,382,851 Tangible Shareholders' Equity: Total shareholders' equity 26,430 51,224 63,121 101,747 96,292 98,407 Less: Goodwill - - - - - - Preferred stock - - - - 30,000 30,000 Warrant - - - - 453 453 Warrant accretion - - - - 85 107 Total tangible shareholders's equity $ 26,430 $ 51,224 5 63,121 $ 101,747 $66,660 $68,753 Tangible shareholders' equity to tangible assets 6.54% 8.22% 7.01% 8.35% 4.82% 4.97% |
|
|
21 Investor Relations Contact Frank Perez, Chief Financial Officer Tennessee Commerce Bancorp, Inc. 381 Mallory Station Rd. Franklin, TN 37067 Tel: (615) 599-2274 Fax: (615) 807-3206 Email: IR@tncommercebank.com |
|
|
22 |

