Attached files
| file | filename |
|---|---|
| 8-K - FORM 8-K - MOSAIC CO | d8k.htm |
 UBS
Global Agricultural Chemicals and Seed Conference
Jim Prokopanko, President and Chief Executive Officer
May 5, 2010 |
| Good afternoon-everyone. I’m delighted to have the
opportunity to speak with you today about Mosaic, the outstanding
long-term outlook for the crop nutrient industry and our strong market position in both Potash and
Phosphates.
We’d like to thank Don Carson for coverage of the sector and sponsoring this
conference. Following
a
year
of
challenging
economic
events
and
considerable
uncertainty,
I’m
happy
to
say
2010
has
already presented dramatic improvement. We have already experienced tangible
evidence of a return to normal activity and expect continued
improvements in demand for our products. Mosaic is uniquely positioned
as a leading supplier of both potash and phosphate products needed by grain
and oilseed producers worldwide. This unique paring of nutrients will benefit
our customers and shareholders and help the world produce the food it
needs. |
 Slide 2
Safe Harbor Statement
This presentation contains forward-looking statements within the meaning of the
Private Securities Litigation Reform Act of 1995. Such statements
include, but are not limited to, statements about future financial and
operating results. Such statements are based upon the current beliefs
and expectations of The Mosaic Company’s management and are subject to
significant risks and uncertainties.
These risks and uncertainties include but are not limited to
the predictability and volatility of, and customer expectations about, agriculture,
fertilizer, raw material, energy and transportation markets that are subject
to competitive and other pressures and the effects of the current
economic and financial turmoil; the level of inventories in the distribution
channels for crop nutrients; changes in foreign currency and exchange rates;
international trade risks; changes in government policy;
changes in environmental and other governmental
regulation, including greenhouse gas regulation; difficulties or delays in
receiving, or increased costs of, necessary governmental permits or
approvals; the effectiveness of our processes for managing our strategic
priorities; adverse
weather conditions affecting operations in Central Florida or the Gulf Coast of the
United States, including potential hurricanes or excess rainfall; actual
costs of asset retirement, environmental remediation, reclamation or other
environmental regulation differing from management’s current estimates;
accidents and other disruptions involving Mosaic’s operations,
including brine inflows at its Esterhazy, Saskatchewan potash mine and other
potential mine fires, floods, explosions, seismic events or releases of hazardous
or volatile chemicals, as well as other risks and uncertainties reported
from time to time in The Mosaic Company’s reports filed with the
Securities and Exchange Commission. Actual results may differ from
those set forth in the forward-looking statements. |
| Before I proceed, I need to remind you that our presentation contains
forward-looking statements. The remarks I make are based on
information and understandings we believe to be accurate as of today’s
date, May 5, 2010.
Actual results are likely to differ from those set forth in the forward-looking
statements. |
 Slide 3
Strategic Focus
Deliver value for shareholders
Focus on Potash and Phosphate
•
Grow Potash
•
Strengthen Phosphate
Maintain a strong balance sheet |
| At
Mosaic,
our
focus
is
on
shareholder
value
creation,
driven
by
the
unquestionable
long-term
demand
for our products. Our mission is to help the world grow the food it
needs. As a global leader in crop nutrients,
Mosaic
will
benefit
from
the
expanding
worldwide
need
for
food,
feed
and
fuel.
We are executing well on our strategy. At the core of our strategy is a plan
to extend our resource base and invest in the growth of both phosphate and
potash. In Potash, we are growing through top line growth
by
pursuing
brownfield
expansions.
In
Phosphates,
we
are
focusing
on
growing
the
value
of
our
business and maintaining our position as one of the lowest cost phosphate producers
in the world. Our expansive global distribution network, aligned with
our North American production assets, provides us access to the largest
global markets on a counter seasonal basis. Over time, the combination of two
strong product lines has produced great returns for our shareholders.
Compared to single nutrient focused companies, our balanced portfolio in phosphates
and potash gives us steadier sales volumes and cash flow in periods where
demand for one nutrient may be greater than for another. Both our
Phosphates and Potash segments have generated robust results over the past
few years.
Supported by our strong balance sheet, with a cash balance in excess of two billion
dollars, we have the financial flexibility required to expand our global
profile in potash and phosphates and are actively pursuing opportunities to
do so. |
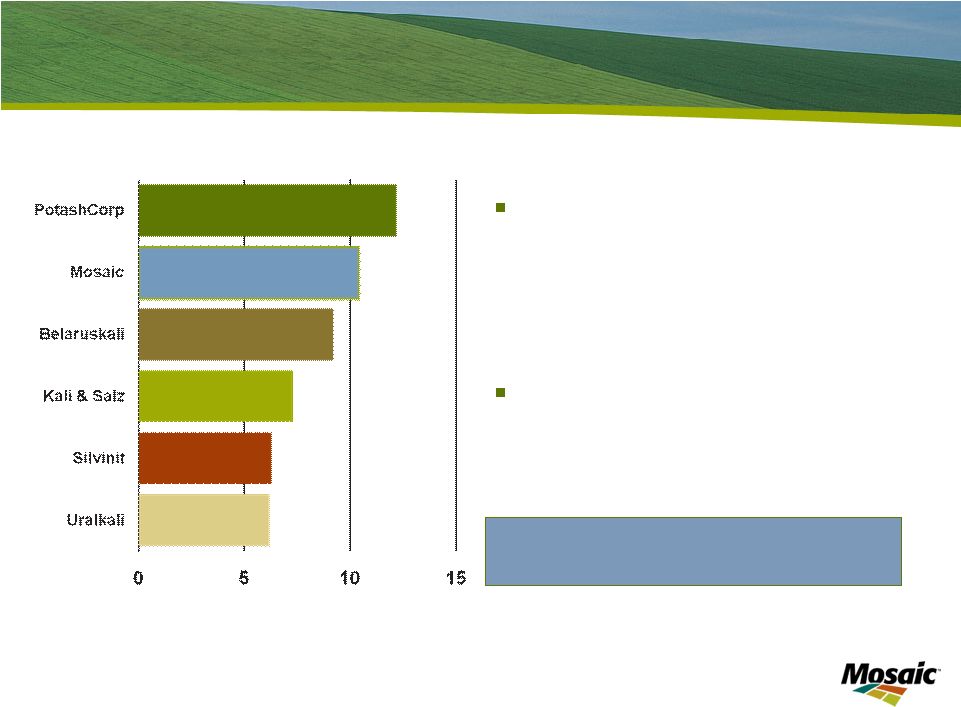 Slide 4
Leading Global Potash Producer
Mosaic MOP production share
•
10% Global
•
41% North America
•
Five mines
Competitive industry position
World capacity approximates 74
million tonnes
(all potash products)
Mil tonnes
•Potash Fertilizer Capacity
Source: Fertecon
/ Mosaic |
| Let’s first talk about our Potash segment. Mosaic is one
of the world’s top producers of potash with an estimated 10% of global
market share. Potash is produced in only 12 countries in the world, and
agricultural giants such as China, India and Brazil depend on imports.
|
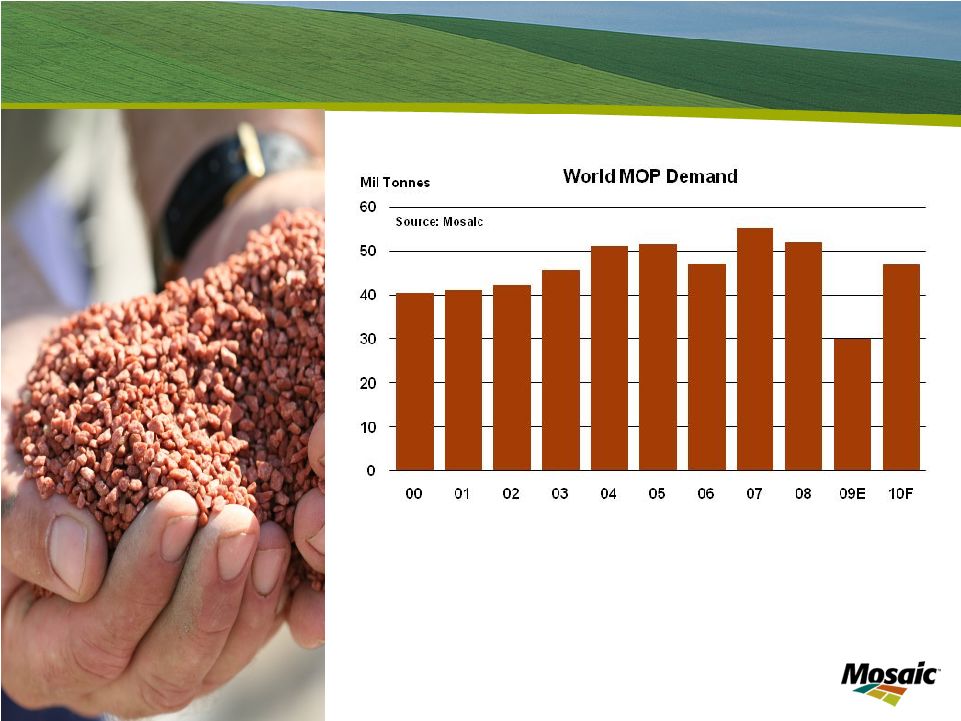 Slide 5
Rebounding Potash Demand |
| Following the well documented drop in potash demand last year, we have
seen a sharp rebound this spring season and expect continued strength through
the remainder of this year. The nutritional value of potash is critical
to optimize crop yields and increase food production. We believe this nutrient has
been under-applied historically.
Early this calendar year, North American potash shipments surged, exports climbed,
inventories dropped and we ramped up production. We expect to operate
our plants at high operating rates during the 2010/11 fertilizer year to
meet projected demand. We are now in the midst of the North American
spring
season
with
demand
back
to
near
normal
levels.
Brazilian
potash
orders
will
commence
soon
with typical shipping periods from July through August.
As
of
last
Friday,
the
price
of
MOP,
FOB
Midwest
warehouse
is
$395
-
$405
per
short
ton,
a
respectable
price, well balanced to farm economics, that will generate healthy margins. We
forecast that global MOP shipments
will
increase
to
about
47
million
tonnes
in
calendar
2010
compared
to
about
30
million
tonnes
in calendar 2009.
Longer term, we expect potash demand to grow between 3% and 3.5% annually.
|
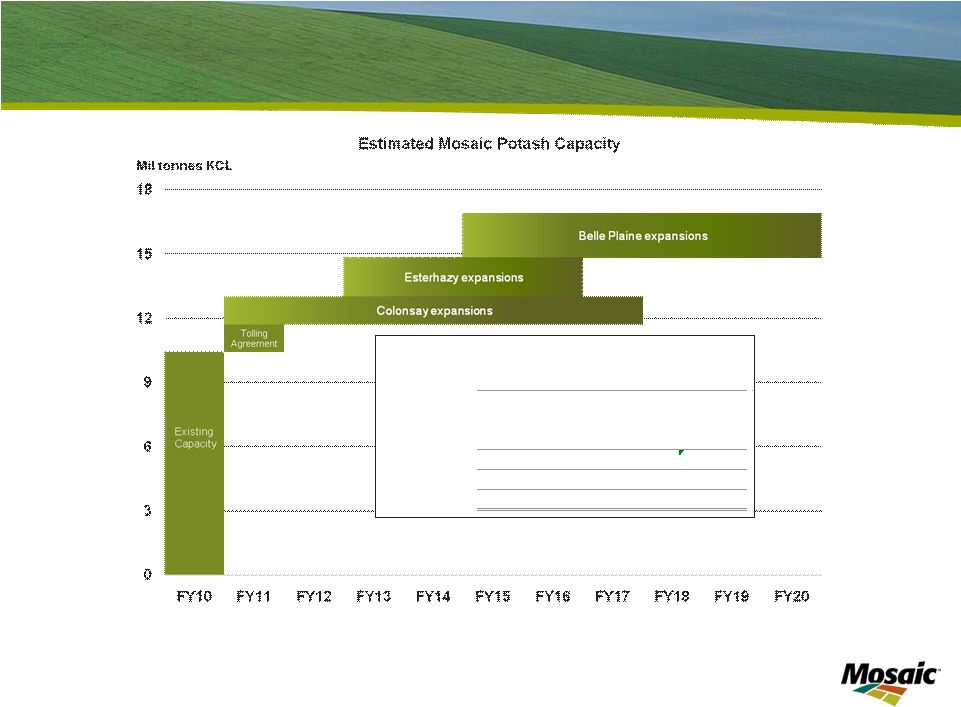    Slide 6
Growth Opportunities -
Our Potash Expansions
Note:
The
projected
annual
capacity
includes
up
to
an
approximate
1.3
million
tonnes
that
under
a
third
party
tolling
agreement
at
our
Esterhazy, Saskatchewan potash mine that will revert to us when the tolling
agreement expires. Current
Capacity
Tolling
Agreement
Expansions
Estimated
Future
Capacity
Esterhazy
4.0
1.3
1.8
7.1
Belle Plaine
2.8
2.0
4.8
Colonsay
1.8
1.3
3.1
8.6
1.3
5.1
15.0
US Mines
1.8
1.8
Total
10.4
1.3
5.1
16.8
|
| The world will need substantially more potash this decade. Mosaic
has the capacity to meet the increasing demands from the agricultural
market. We currently own enough mineral reserves to run our potash mines
for over 100 years.
In
addition,
we
think
the
best
way
to
provide
additional
potash
is
through
brownfield
expansions
at
existing
mine sites. Our ongoing expansions are expected to increase annual capacity
by over five million tonnes by 2020, ensuring that we will maintain our
position as one of the premier potash companies in the world. Our
expansion program consists of nearly a dozen discrete, multi-year projects at our three Canadian mine
sites, and we can adjust the pace of these projects in response to supply/demand
dynamics. We have made
great
progress
on
a
number
of
these
projects.
The
first
phases
at
Colonsay
and
Esterhazy
are
wrapping
up.
These
two
projects
will
add
about
300
thousand
tonnes
of
annual
capacity,
starting
in
fiscal
2011.
We
will
be
ready
to
bring
these
tonnes
on
line
if
market
demand
warrants.
We are mindful of the threat of new entrants in this industry and we take these
threats seriously. Time will tell whether these threats become
reality. As a well established, large player in this industry, we believe
we
are
well
positioned
to
bring
on
new
brownfield
expansions
more
economically
than
greenfield
capacity.
We
certainly
know
our
markets
and
customers
better
than
a
new
entrant
would.
In
addition,
we
produce
up
to
1.3
million
tonnes
annually
for
a
third
party
under
a
tolling
agreement.
As
many of you know the expiration date for this agreement is the subject of a dispute
currently pending before
the
Saskatchewan
courts.
Based
upon
our
estimates,
we
believe
this
capacity
could
revert
to
Mosaic as early as the end of this calendar year.
And, as a reminder, this production capacity of 1.3
million tonnes
will revert to Mosaic at no cost. |
 Slide 7
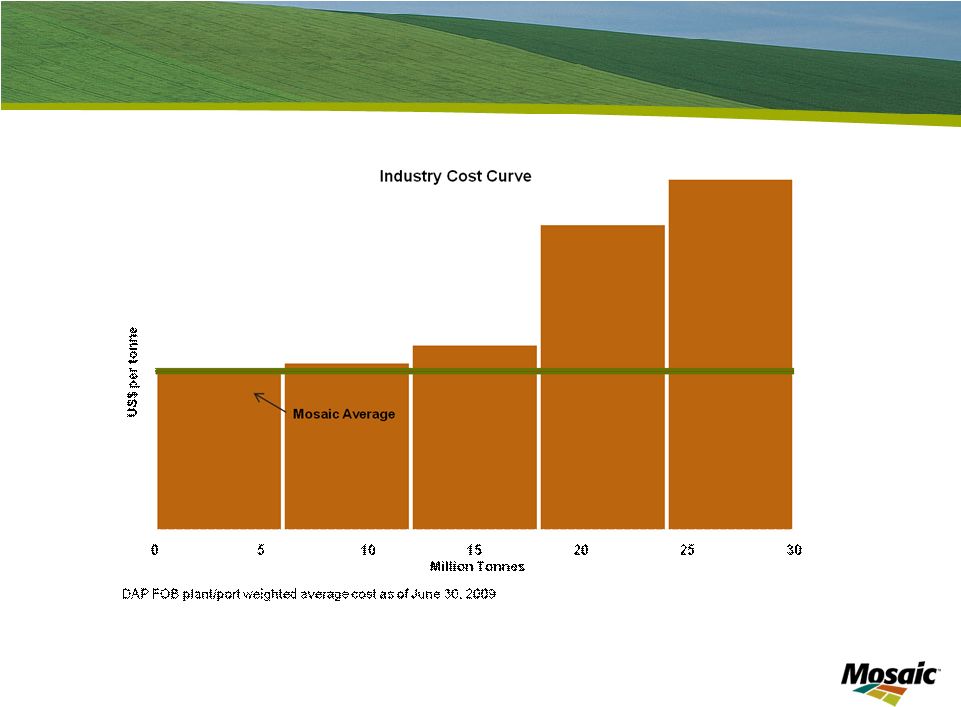
Expansions Improve Mosaic’s Cost Structure |
| The global potash industry has a relatively flat cost curve. This
chart shows estimated cost per tonne for all major potash producers.
Mosaic’s potash cost structure is competitive and will improve as our
expansions come on line. The expected increase in sales and production volumes will
leverage the existing
assets
at
our
three
Canadian
mines
–
thereby
driving
lower
per
tonne
costs.
Our industry leadership position, together with our investments to expand capacity,
places us in a strong competitive position to leverage the growth of this
market. |
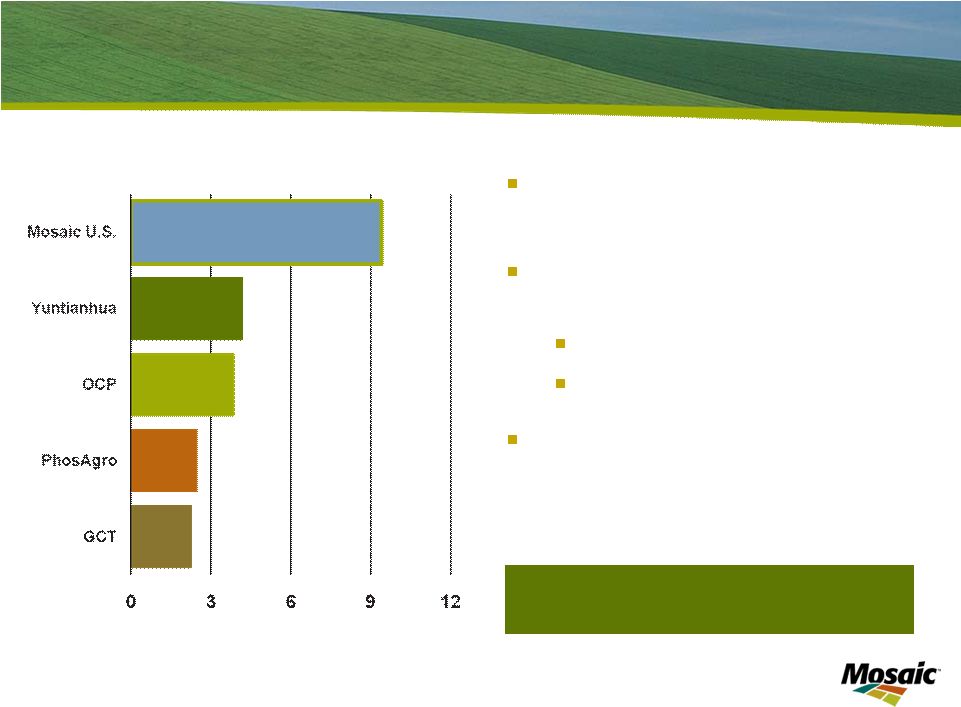 Slide 8
World’s Largest Integrated Phosphate Producer
World’s largest capacity of
finished phosphate fertilizer
Mosaic U.S. phosphate
production share
13% Globally
57% U.S.
World scale & efficient
operations
World capacity approximates 80
million tonnes
(DAP/MAP/TSP)
•Phosphate Fertilizer Capacity
Mil tonnes
Source: Fertecon
/ Mosaic |
| Now,
let’s
turn
to
our
Phosphates
segment.
Our
substantial
asset
base
and
geographic
reach
are
unmatched
in
the
industry.
As
the
largest
vertically
integrated
producer
in
the
world,
our
Phosphates business possesses its own attractive set of attributes. We have
substantial company- owned rock reserves, granulation capacity, and a
worldwide supply chain and distribution network. |
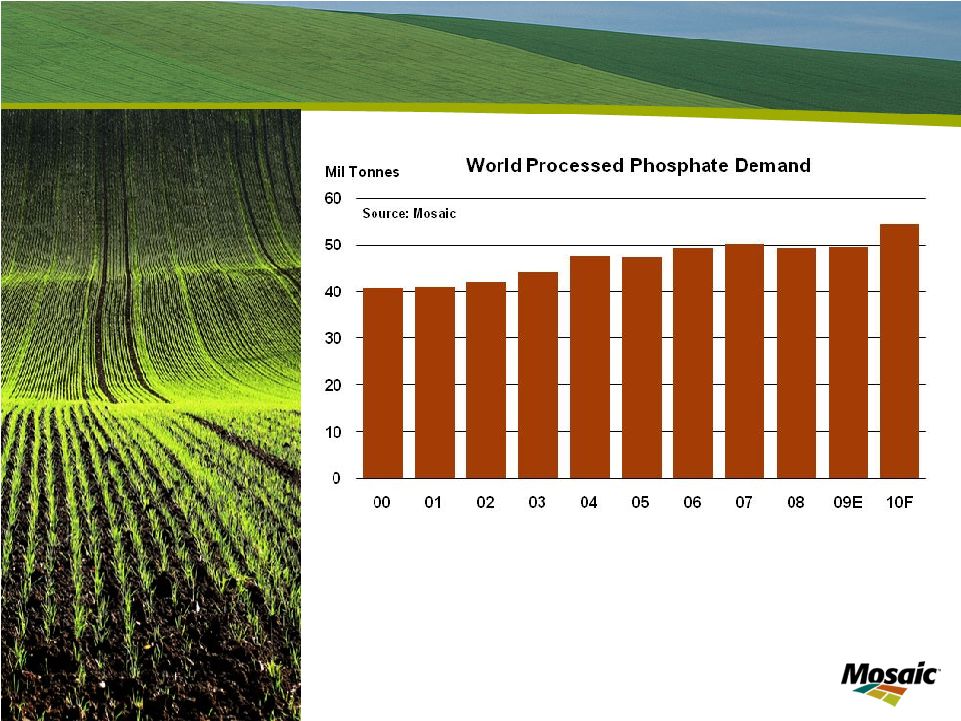 Slide 9
Phosphate Demand Recovery |
| Phosphate fundamentals remain constructive and we expect the phosphate
market to remain snug for several years. Strong demand has driven down
North American producer stocks --despite an increase in operating
rates. We project stocks to continue to drop during the remainder of the current fertilizer
year and remain at low levels throughout the 2010/11 fertilizer year.
We
sense
growing
concern
about
the
Ma’aden
project.
By
our
estimate,
DAP
production
at
this
facility
will
ramp
up
in
late
2011.
We
forecast
that
this
supply
will
be
needed
to
match
demand
that
is
growing
at a 2 to 2.5 percent annual compound rate.
In
March,
PhosChem
signed
a
multi-year
contract
with
customers
in
India
for
6
million
tonnes
of
DAP.
This large baseload
contract provides Mosaic the opportunity to optimize production
rates and thereby
improve profitability.
Prices
bottomed
a
few
months
ago
and,
after
rising
significantly
early
this
year,
appear
to
have stabilized
in the upper-$400 range. As of last Friday, prevailing market DAP selling
prices were in the $470
range
per
tonne
FOB
Tampa.
And,
while
raw
material
costs
are
higher
than
historical
levels,
they
are
down
from
peak
pricing
in
the last
cycle. |
 Slide10
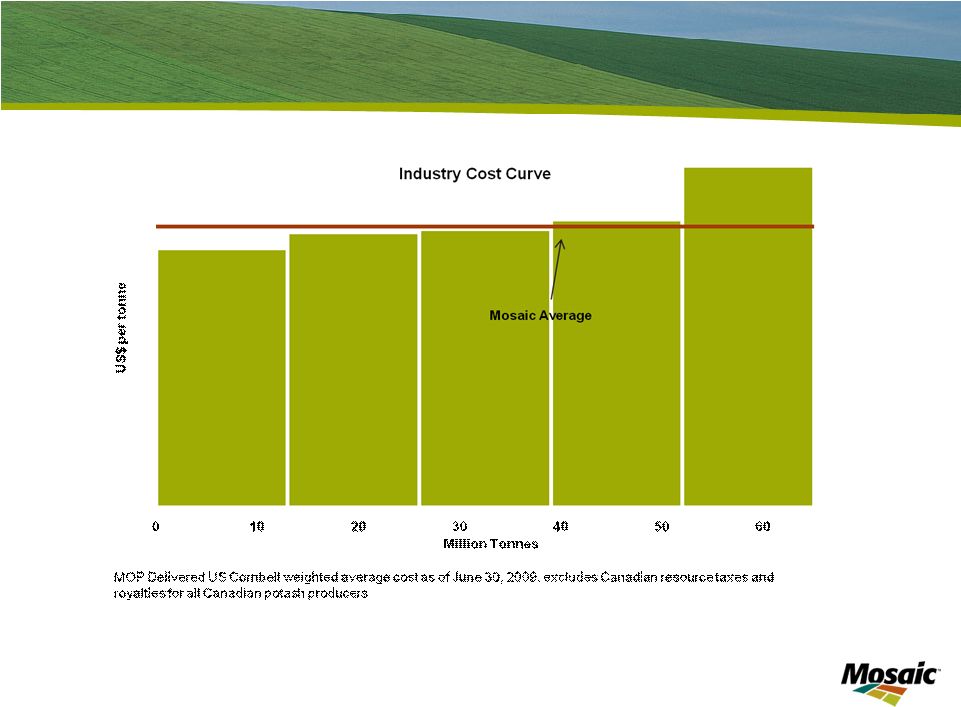
Industry Leading Cost Structure in Phosphate |
| Unlike
the
potash
industry,
the
phosphate
industry
cost
curve
is
steeper
–
and
you
can
see
that
Mosaic
is
one
of
the
world’s
low
cost
producers.
We
are
working
on
a
number
of
operational
fronts
to
improve
and
secure that position, as I will discuss further. |
 Slide 11
Phosphate Strategic Priorities
Strengthen our competitive position
Leverage scale and location
Low cost rock
Cost advantaged sulfur, competitive ammonia
Procurement leverage
Operational excellence
Maintenance practices
Capital deployment
Energy use and co-generation capacity
Improve coordination of sales and operation planning
Extend phosphate reserves |
| In order to strengthen our competitive advantage, we are focusing on
three strategic priorities: First, we are working on several initiatives to
leverage our scale and geographic location. We have a
strong
competitive
position
due
to
low
rock
and
conversion
costs
as
well
as
preferential
geographic
access to sulfur and ammonia. We are also working to better leverage our
procurement processes. Next, we are focused on improving our
operations. We are implementing improved processes for
maintenance, capital deployment, energy use and co-generation capacity.
In addition, our global sales and operations teams are working closely to
improve production planning. Finally, we continue work to secure the mineral
resource base for our U.S. operations and to obtain advantaged access to
rock reserves elsewhere in the world. We recently announced an investment in
the Bayovar
rock mine which will give us additional flexibility and diversifies our reserve
position. All of these initiatives are intended to drive stronger cash flow
and returns on capital from our Phosphates segment.
|
 Slide 12
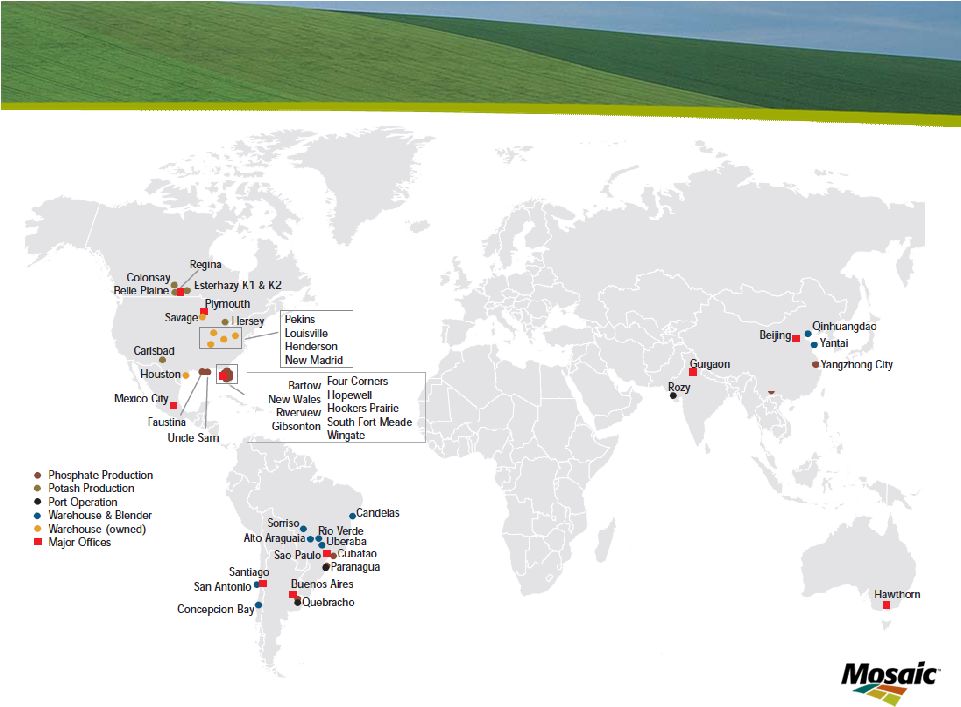
Distribution Assets Aligned with Global Demand |
| Mosaic
also
has
a
distribution
network
without
peer
in
our
industry
–
allowing
us
to
move
our
products
where and when needed, efficiently and cost-effectively.
Our industry leading North American distribution capabilities are bolstered by
strong networks in prime growth regions such as Asia and Latin America where
we combine production assets, blending and bagging facilities, ports and
other capabilities. This
global
network
is
especially
valuable
in
balancing
seasonal
demand
patterns.
It
allows
us
to
run
our
North
American
production
plants
more
efficiently
as
we
can
ship
products
to
key
regions
around
the
world as needed.
We are also taking steps to further align our global distribution network with our
North American production assets.
Our strategic priorities in Phosphates focus on growing the value of our business
and maintaining our position as one of the lowest cost phosphate producers
in the world. |
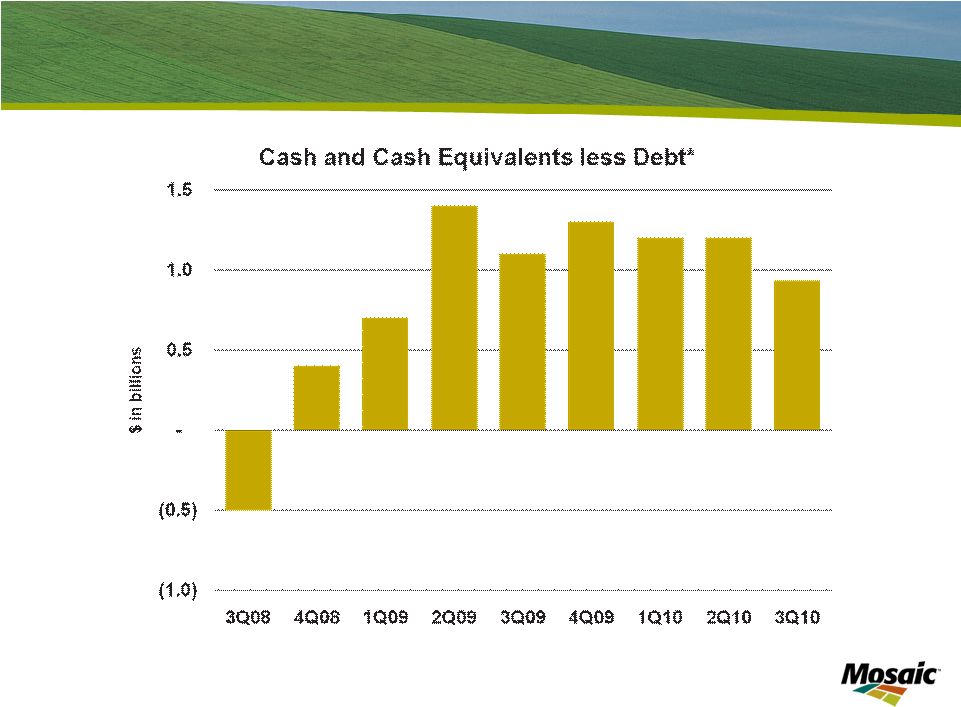 Strong Financial Position
*
See appendix for reconciliation of Cash and Cash Equivalents less Debt
|
| As we have discussed, our overall strategy is to capitalize on attractive
long-term agriculture fundamentals by investing in and reengineering our
potash and phosphate businesses. Through the ups and downs of the
markets we serve, we have created long term value through sound capital
allocation decisions. Our strong cash flow has allowed us to build one of the strongest
balance sheets in the industry despite the recent economic downturn. We have
demonstrated our willingness and ability to make investments, to divest
non-strategic assets and to return cash to shareholders, as
appropriate. The
sale
of
our
Fosfertil
investment
is
proceeding.
The
estimated
$900
million
of
net
cash
proceeds
will
be
partially
offset
by
the
$385
million
investment
in
Bayovar
that
we
expect
to
make
in
the
coming months. |
 Business Outlook |
| Now I will give you a few thoughts on the outlook for the agricultural
markets. |
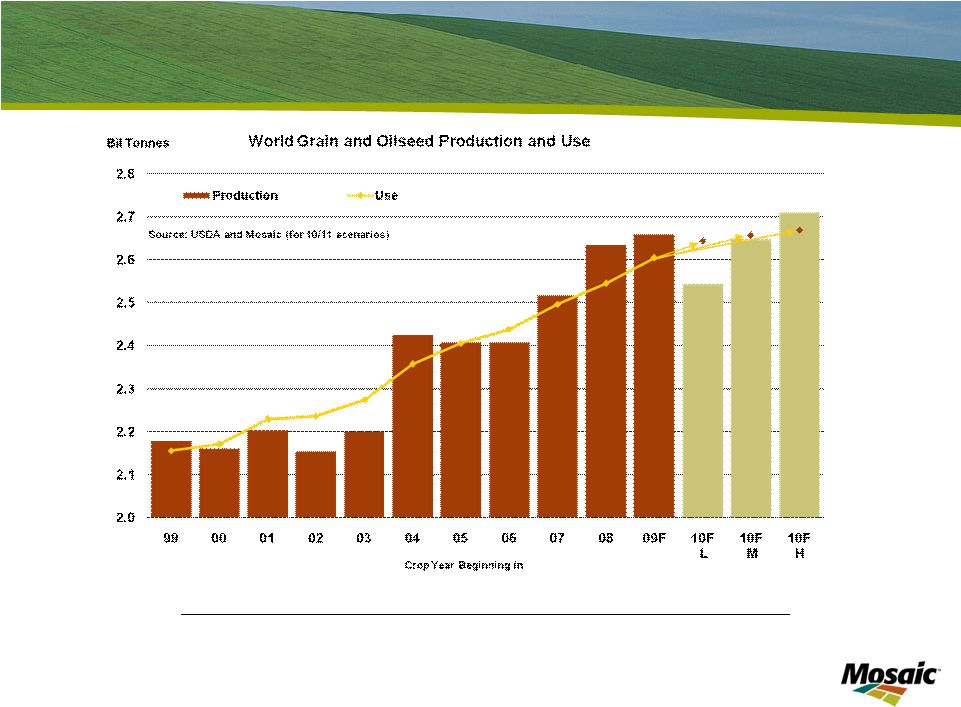 Slide 15
Growing Grain & Oilseed Use
2010/11 Scenario Assumptions
Low
Medium
High
Change in Harvested Area
-0.5%
-0.5%
-0.5%
Yield (Deviation from 10-year Trend)
Largest Negative
0
Largest Positive
Demand Growth
0.0%
1.0%
2.0% |
| Long term agricultural fundamentals continue to look positive. The
overall food security story has not changed. Economic development,
improving diets, weather and political instability will continue to stress
the global food supply.
To meet food and fuel demands, grain production will need to increase
substantially. Improved farming practices, including proper
application of crop nutrients, is vital to grow the food the world needs.
Here we show the increase in grain and oilseed production and use over the past
decade. As
you
can
see,
use
has
grown
slowly,
but
consistently.
History
has
proven
that
economic
slowdowns
don’t
have
a
large
negative
impact
on
food
consumption
–
people
need
to
eat
regardless
of
the
economic
climate. The most recent global economic downturn was no exception.
On the production side, we have seen significant increases over the past two
years. This growth has come from increased harvested land and above
trend yields. However we need to continue this above trend growth just
to stay even with projected use. |
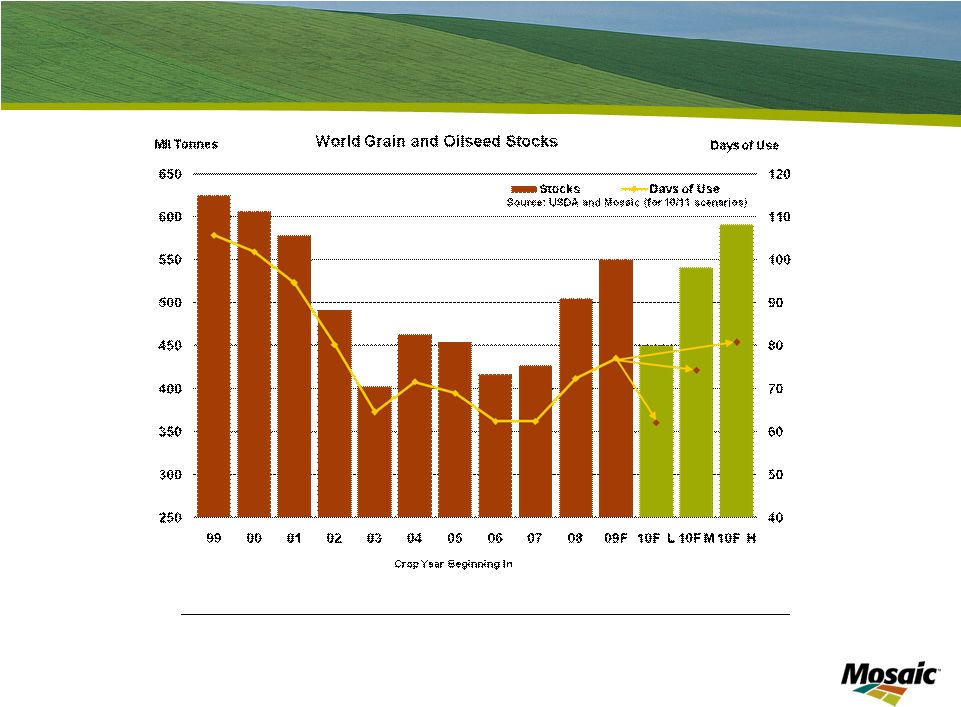 Slide 16
More Cushion but Stocks Still Not at Secure Levels
2010/11 Scenario Assumptions
Low
Medium
High
Change in Harvested Area
-0.5%
-0.5%
-0.5%
Yield (Deviation from 10-year Trend)
Largest Negative
0
Largest Positive
Demand Growth
0.0%
1.0%
2.0% |
| Back-to-back
bumper
crops
have
built
global
grain
and
oilseed
stocks
and
calmed
agricultural
markets.
Over the past couple of years, supply has responded to higher prices and good
weather. Our
base
forecast
assumes
a
trend
yield
and
a
slight
decrease
in
harvested
area.
We
expect
the
stock
to use ratio to remain at a relatively low level.
We believe global grain and oilseed stocks still are not at a secure enough level
to withstand weather or other shocks over a period of time. If crops
continue above trend yields, stocks will continue to increase.
However, weather or other shocks have the potential to draw down stocks significantly. |
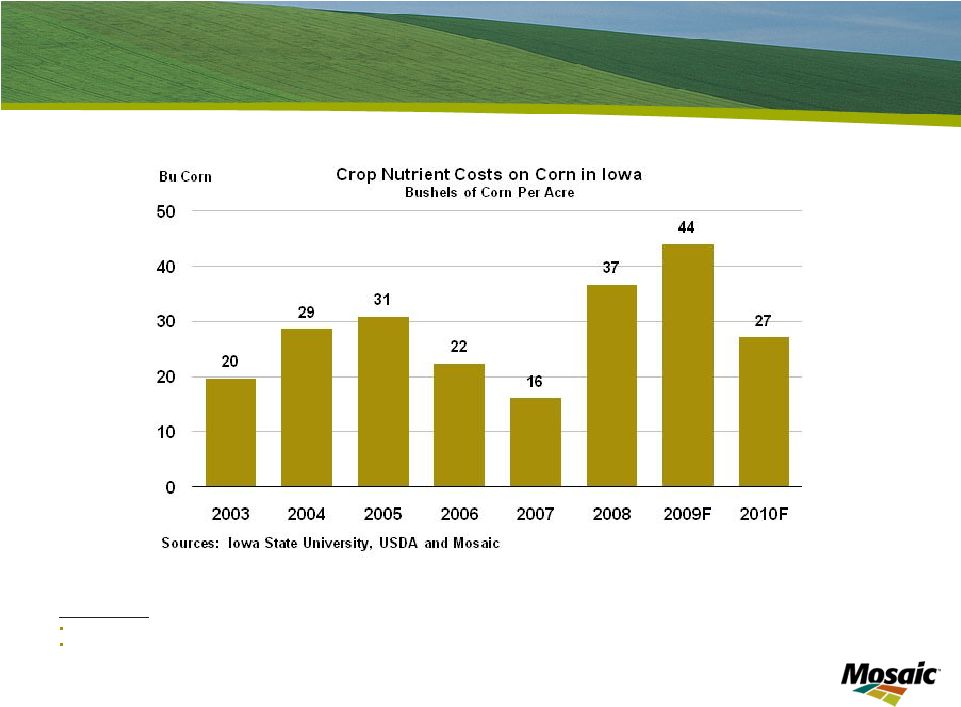 Slide 17
Farm Economics
Key assumptions
Iowa State University application rate recommendations
Fertilizer prices for 2003 -
2009 are from USDA. 2010 fertilizer prices are based
on current spot wholesale prices |
| Farmer economics remain healthy despite the recent downward trend in
grain markets. Grain prices remain at relatively high levels as
compared to historical prices. At the same time, input prices have
fallen from their high levels of the last two years. This has allowed farmers
to remain profitable.
The graph shows the number of bushels of corn that a farmer would have to sell in
order to pay for crop nutrients. This indicates that the cost of crop
nutrients, relative to grain prices, has declined to levels closer to the
historic range. |
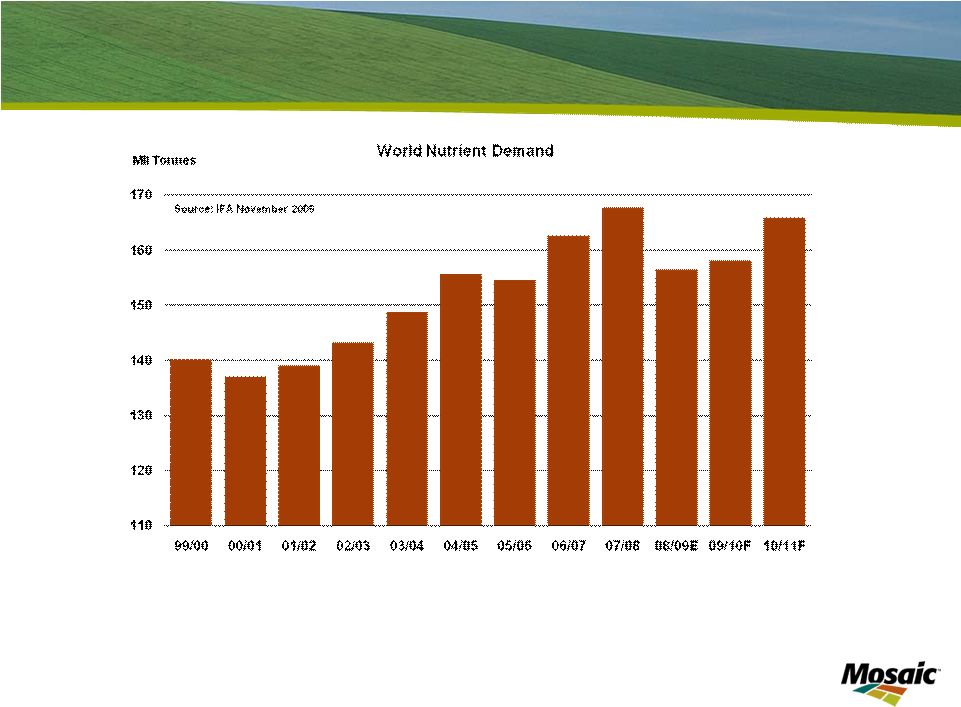 Slide 18
Growth Expected to Resume |
| Following the drop in nutrient use in 2008 and 2009, we expect use to
rebound significantly this year. By the 2013/14 fertilizer year, the
International Fertilizer Industry Association projects crop nutrient use to
increase 11% over the peak 2007/08 period.
There has been a lot of debate about the potential effects of nutrient
under-application on yields. With the increased use of GMO seeds
and improved application technology, some have thought this would mean less
demand for nutrients. However, the science of agronomy and plant production has not
changed, plants still need balanced nutrition to develop properly. To obtain
higher yields, crops will need increased nutrient application rates.
Every plant and crop harvested removes vital and necessary nutrients from
the soil. These nutrients must be replaced in order to maintain productivity of the farm
field. There is no alchemy in agronomy.
Most profitable farmers have lower costs per unit of production because they attain
higher crop yields while controlling total costs. Farmers recognize proper
soil fertility is the foundation on which high yields are built.
As world demand for increased yields stresses the food supply, adequate and
balanced soil fertility will continue to be a high priority.
|
 Slide 19
Focus on value creation
Global leader with vertically integrated
operations
Potash growth projects at attractive
capital costs
Phosphate growth options in rock
reserves and acquisitions
Positive agricultural market outlook
Key Takeaways |
| In closing, I will emphasize a few key points about Mosaic. First,
we are successfully executing our strategic plan, focusing on long term value
creation. Second, we are an established industry leader with vertically
integrated operations, a strong balance sheet and a broad international
presence. Our global scale is unmatched due to our strength in both
potash and phosphates.
Next,
we
are
making
significant
investments
to
grow
our
capacity
in
Potash
at
competitive
costs.
In addition, we are strengthening our Phosphates business by leveraging our scale,
improving efficiencies at our plants and mines, and extending our reserve
base. Finally, the long term agricultural outlook is positive. After a
difficult 2009, crop nutrient demand has returned to normal.
We remain confident in Mosaic’s long-term outlook. Agricultural
fundamentals remain positive because of continued global demand for food and
fuel. Mosaic is uniquely positioned as a leading supplier of both
potash and phosphate products needed by agricultural producers worldwide.
|
 Thank you |
| Thank you for your time this afternoon. I appreciate you listening
to Mosaic’s story and our outlook for the future. Before I open
the floor to questions, I’d like to mention that UBS is hosting a potash tour at our
Colonsay
site
on
May
26 .
Contact
Don
Carson
if
you
are
interested.
Now I’d be happy to take questions.
th |
 Slide 21
Appendix: Cash and Cash Equivalents Less Debt Reconciliation
$ in billions
Period Ended
Cash and Cash
Equivalents
Short-Term Debt
Current
Maturities
Long-Term Debt
Total Debt
Net (Debt) Cash
February 29, 2008
1.1
0.2
-
1.4
1.7
(0.5)
May 31, 2008
2.0
0.1
-
1.4
1.6
0.4
August 31, 2008
2.2
0.1
0.1
1.3
1.5
0.7
November 30, 2008
2.8
0.1
-
1.3
1.4
1.4
February 28, 2009
2.5
0.1
-
1.3
1.4
1.1
May 31, 2009
2.7
0.1
-
1.3
1.4
1.3
August 31, 2009
2.6
0.1
-
1.3
1.4
1.2
November 30, 2009
2.6
0.1
-
1.3
1.4
1.2
February 28, 2010
2.3
0.1
-
1.2
1.4
0.9
-
Source:
Cash
and
cash
equivalents
from
10Q/10K
as
filed.
Total
debt
includes
Short
term
debt,
Current
maturities
of
long-term
debt,
Long-term debt less current maturities and Long-term debt due to Cargill
Inc and affiliates. |