Attached files
| file | filename |
|---|---|
| 8-K - FORM 8-K - GRUBB & ELLIS CO | c00212e8vk.htm |
| EX-10.1 - EXHIBIT 10.1 - GRUBB & ELLIS CO | c00212exv10w1.htm |
| EX-10.2 - EXHIBIT 10.2 - GRUBB & ELLIS CO | c00212exv10w2.htm |
| EX-99.2 - EXHIBIT 99.2 - GRUBB & ELLIS CO | c00212exv99w2.htm |
| EX-99.1 - EXHIBIT 99.1 - GRUBB & ELLIS CO | c00212exv99w1.htm |
Exhibit
10.3

| Grubb & Ellis Company Investor Presentation |

| This presentation contains forward-looking statements within the meaning of the Private Securities Litigation Reform Act of 1995. These statements include assumptions regarding expectations or estimates of future financial and operating results or events, industry and market trends and other market opportunities for Grubb & Ellis. The information in this presentation discusses the state of Grubb & Ellis' business as of the date of presentation. Grubb & Ellis does not assume any obligation to update or correct any information covered herein. There are a number of risks and uncertainties that could cause our actual results to differ materially from those described in the forward-looking statements. For additional information concerning risks that could cause such differences, please refer to our annual report on Form 10-K, quarterly reports on Form 10-Q and other filings with the Securities and Exchange Commission. We may make certain statements during the course of this presentation which include references to "non-GAAP financial measures," as defined by SEC regulations. As required by these regulations, we have provided reconciliations of these measures to what we believe are the most directly comparable GAAP measures, which are attached hereto within the appendix. Forward Looking Statements |
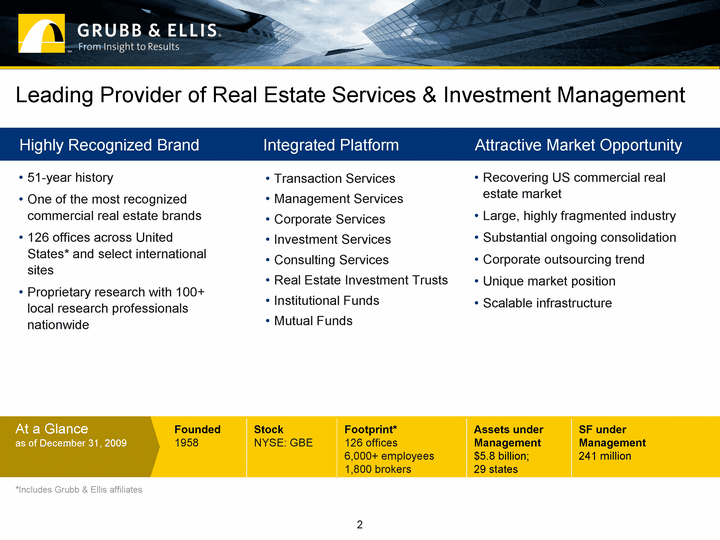
| Leading Provider of Real Estate Services & Investment Management Highly Recognized Brand At a Glance as of December 31, 2009 Founded 1958 Stock NYSE: GBE Footprint* 126 offices 6,000+ employees 1,800 brokers Assets under Management $5.8 billion; 29 states SF under Management 241 million Transaction Services Management Services Corporate Services Investment Services Consulting Services Real Estate Investment Trusts Institutional Funds Mutual Funds Recovering US commercial real estate market Large, highly fragmented industry Substantial ongoing consolidation Corporate outsourcing trend Unique market position Scalable infrastructure 51-year history One of the most recognized commercial real estate brands 126 offices across United States* and select international sites Proprietary research with 100+ local research professionals nationwide Integrated Platform Attractive Market Opportunity 2 *Includes Grubb & Ellis affiliates |
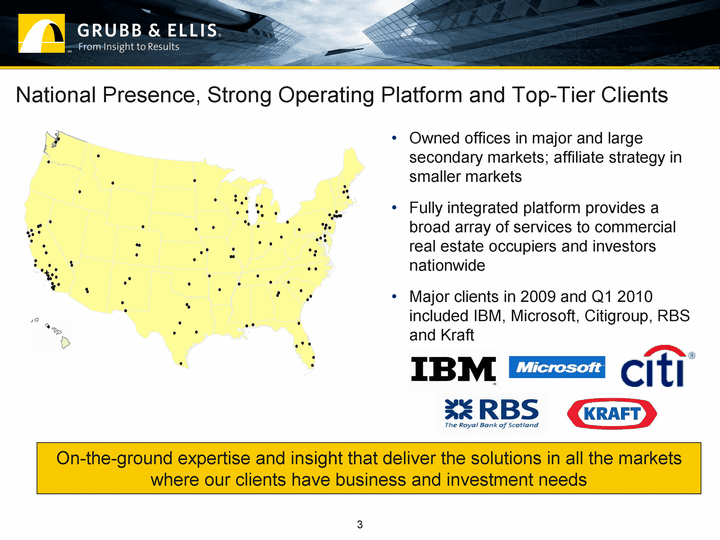
| Owned offices in major and large secondary markets; affiliate strategy in smaller markets Fully integrated platform provides a broad array of services to commercial real estate occupiers and investors nationwide Major clients in 2009 and Q1 2010 included IBM, Microsoft, Citigroup, RBS and Kraft National Presence, Strong Operating Platform and Top-Tier Clients On-the-ground expertise and insight that deliver the solutions in all the markets where our clients have business and investment needs 3 |
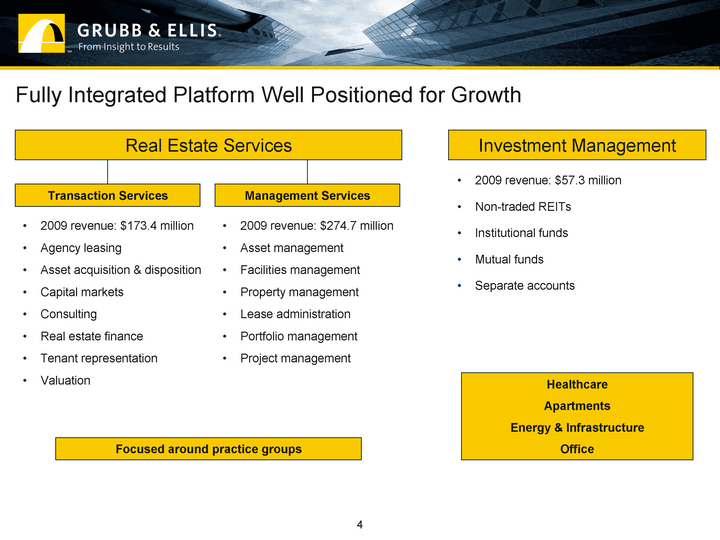
| Fully Integrated Platform Well Positioned for Growth 2009 revenue: $57.3 million Non-traded REITs Institutional funds Mutual funds Separate accounts Investment Management 2009 revenue: $173.4 million Agency leasing Asset acquisition & disposition Capital markets Consulting Real estate finance Tenant representation Valuation 2009 revenue: $274.7 million Asset management Facilities management Property management Lease administration Portfolio management Project management Real Estate Services Transaction Services Management Services Healthcare Apartments Energy & Infrastructure Office Focused around practice groups 4 |
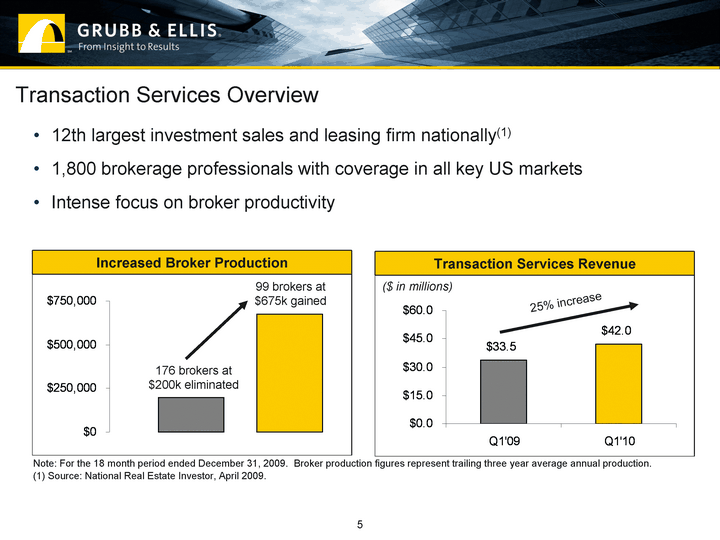
| Transaction Services Revenue ($ in millions) Increased Broker Production Transaction Services Overview 5 12th largest investment sales and leasing firm nationally(1) 1,800 brokerage professionals with coverage in all key US markets Intense focus on broker productivity Note: For the 18 month period ended December 31, 2009. Broker production figures represent trailing three year average annual production. (1) Source: National Real Estate Investor, April 2009. 25% increase 99 brokers at $675k gained 176 brokers at $200k eliminated |
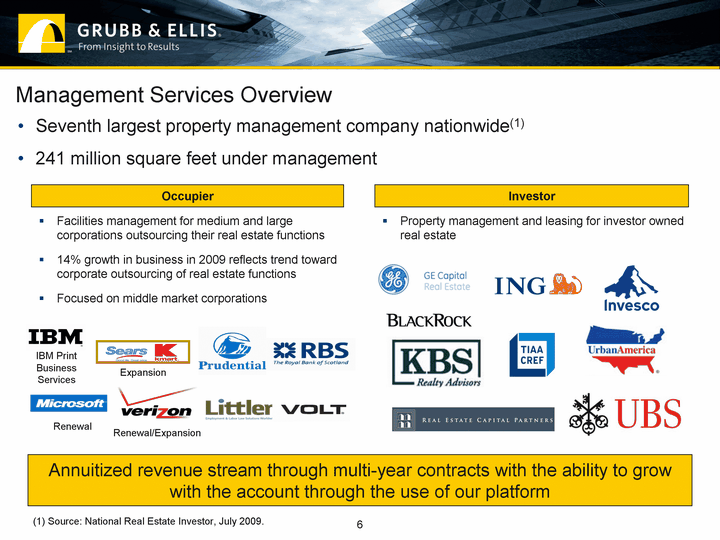
| Management Services Overview Facilities management for medium and large corporations outsourcing their real estate functions 14% growth in business in 2009 reflects trend toward corporate outsourcing of real estate functions Focused on middle market corporations Occupier Investor Property management and leasing for investor owned real estate Annuitized revenue stream through multi-year contracts with the ability to grow with the account through the use of our platform 6 Renewal/Expansion Expansion IBM Print Business Services Renewal Seventh largest property management company nationwide(1) 241 million square feet under management (1) Source: National Real Estate Investor, July 2009. |
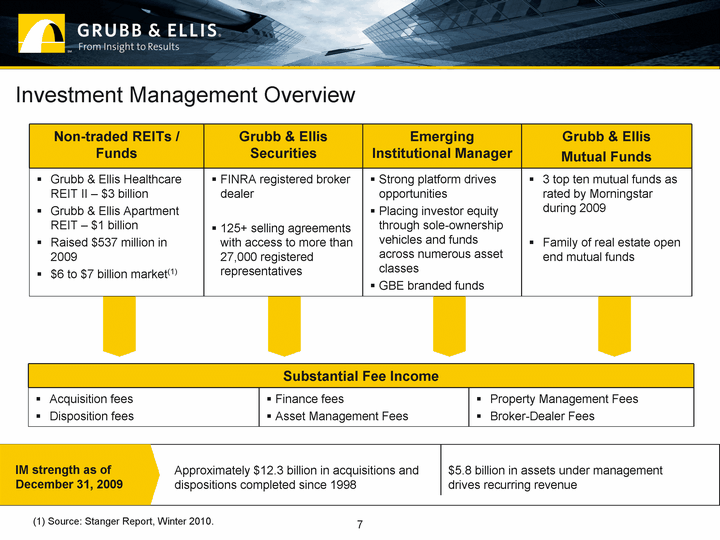
| Non-traded REITs / Funds Grubb & Ellis Securities Emerging Institutional Manager Grubb & Ellis Mutual Funds Grubb & Ellis Healthcare REIT II - $3 billion Grubb & Ellis Apartment REIT - $1 billion Raised $537 million in 2009 $6 to $7 billion market(1) FINRA registered broker dealer 125+ selling agreements with access to more than 27,000 registered representatives Strong platform drives opportunities Placing investor equity through sole-ownership vehicles and funds across numerous asset classes GBE branded funds 3 top ten mutual funds as rated by Morningstar during 2009 Family of real estate open end mutual funds Investment Management Overview IM strength as of December 31, 2009 Approximately $12.3 billion in acquisitions and dispositions completed since 1998 $5.8 billion in assets under management drives recurring revenue Substantial Fee Income Substantial Fee Income Substantial Fee Income Acquisition fees Disposition fees Finance fees Asset Management Fees Property Management Fees Broker-Dealer Fees 7 (1) Source: Stanger Report, Winter 2010. |
| Investment Management - Focused Actions for 2010 Expand tier 1 broker-dealer selling relationships through GBE Securities Generate revenue from Energy & Infrastructure Advisors JV formed in 2009 Launch GBE branded institutional fund - $250 - $500 million Launch closed end mutual fund through Alesco Global Advisors Continue to manage tenant-in-common portfolio through challenging market environment 8 Grow assets under management to $10 billion by 2013 |
| 9 Foundation Laid for Growth During 2009 Raised $97 million in preferred stock with high-quality fundamental investors Repaid credit facility and significantly strengthened capital structure New corporate leadership Significant client wins and expansion of existing relationships, noted below |
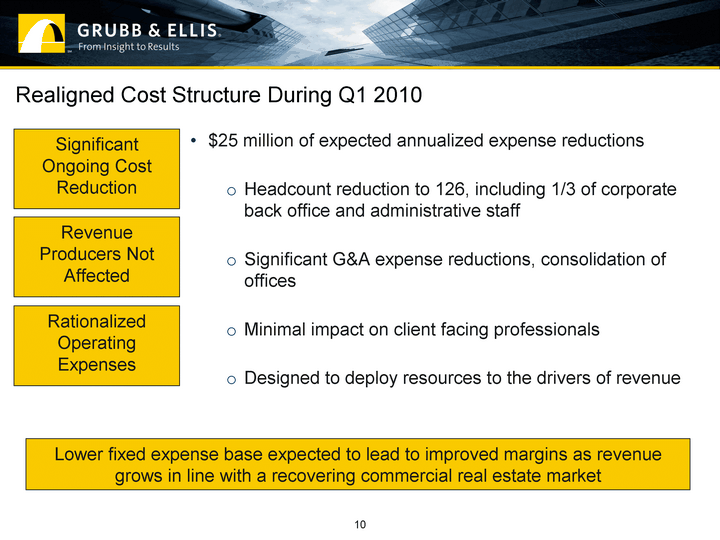
| $25 million of expected annualized expense reductions Headcount reduction to 126, including 1/3 of corporate back office and administrative staff Significant G&A expense reductions, consolidation of offices Minimal impact on client facing professionals Designed to deploy resources to the drivers of revenue Realigned Cost Structure During Q1 2010 Lower fixed expense base expected to lead to improved margins as revenue grows in line with a recovering commercial real estate market Significant Ongoing Cost Reduction Revenue Producers Not Affected Rationalized Operating Expenses 10 |
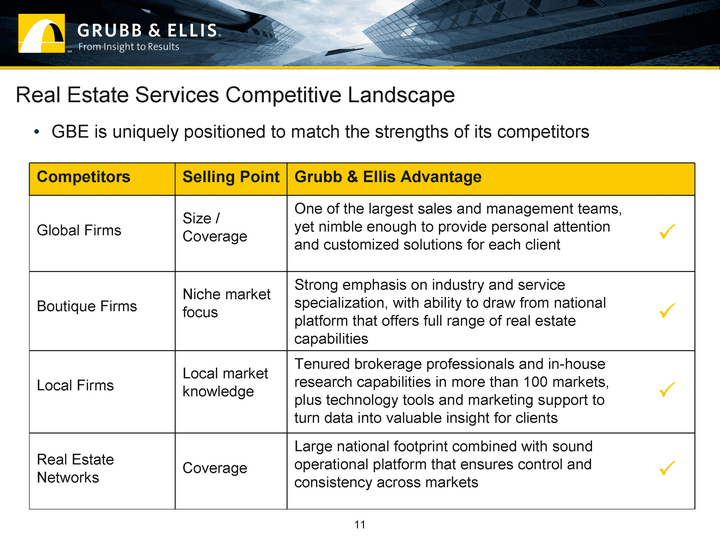
| Real Estate Services Competitive Landscape Competitors Selling Point Grubb & Ellis Advantage Global Firms Size / Coverage One of the largest sales and management teams, yet nimble enough to provide personal attention and customized solutions for each client Boutique Firms Niche market focus Strong emphasis on industry and service specialization, with ability to draw from national platform that offers full range of real estate capabilities Local Firms Local market knowledge Tenured brokerage professionals and in-house research capabilities in more than 100 markets, plus technology tools and marketing support to turn data into valuable insight for clients Real Estate Networks Coverage Large national footprint combined with sound operational platform that ensures control and consistency across markets GBE is uniquely positioned to match the strengths of its competitors ? ? ? ? 11 |
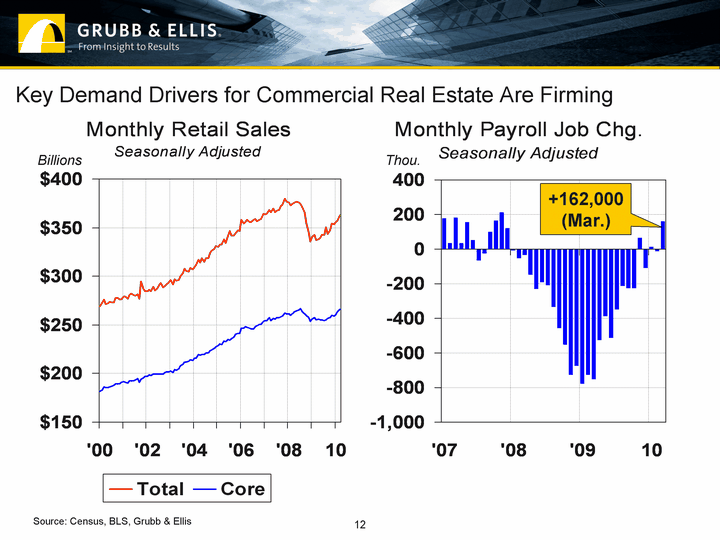
| New Jobs '07 180 36 184 35 156 54 -65 -28 100 165 215 120 '08 -10 -50 -33 -149 -231 -193 -210 -334 -458 -554 -728 -673 '09 -779 -726 -753 -528 -387 -515 -346 -212 -225 -224 64 -109 10 14 Total Core '00 269.085 181.503 272.89 183.485 275.809 186.303 271.861 185.533 271.906 185.98 273.556 186.227 273.376 186.827 273.365 187.579 278.076 189.735 277.583 189.822 276.17 189.651 276.349 190.654 1 279.352 191.578 279.275 191.397 277.108 190.605 281.05 192.307 282.33 192.687 281.036 192.373 280.394 193.504 281.946 194.536 276.76 191.17 295.097 194.475 287.275 195.492 284.413 196.964 '02 284.383 197.323 286.091 198.496 284.983 198.3 289.263 199.836 285.428 199.261 287.796 199.657 291.115 199.523 293.252 199.718 288.844 199.626 290.024 201.007 292.026 202.13 293.966 201.869 3 295.975 202.906 291.924 201.325 296.727 204.033 295.828 203.644 296.488 205.017 299.837 207.837 303.112 209.97 307.721 212.017 305.948 212.023 304.777 212.792 308.676 213.887 307.271 213.785 '04 309.51 215.41 311.726 215.612 317.466 219.92 313.722 218.6 319.018 219.483 315.086 219.529 318.489 220.835 318.629 221.351 324.197 223.202 326.252 224.378 327.876 225.493 331.123 227.526 5 329.969 228.598 332.956 230.542 332.62 230.08 337.766 233.715 334.529 232.481 342.087 234.789 346.446 234.031 341.673 236 342.185 237.184 343.96 240.783 347.215 241.389 346.817 241.124 '06 357.885 246.908 354.63 247.134 356.074 248.024 357.914 247.725 355.82 246.805 355.588 246.329 358.401 246.321 359.012 248.011 357.033 249.364 357.95 250.816 359.012 250.73 364.449 253.948 7 363.236 254.572 364.526 254.852 368.181 257.571 365.657 254.852 370.03 256.632 366.129 256.029 367.715 257.718 368.282 257.225 372.006 258.517 373.893 259.157 379.767 262.198 376.42 261.144 '08 376.262 261.14 373.14 260.036 374.845 261.435 Billions +162,000 (Mar.) Thou. Key Demand Drivers for Commercial Real Estate Are Firming 12 Source: Census, BLS, Grubb & Ellis |
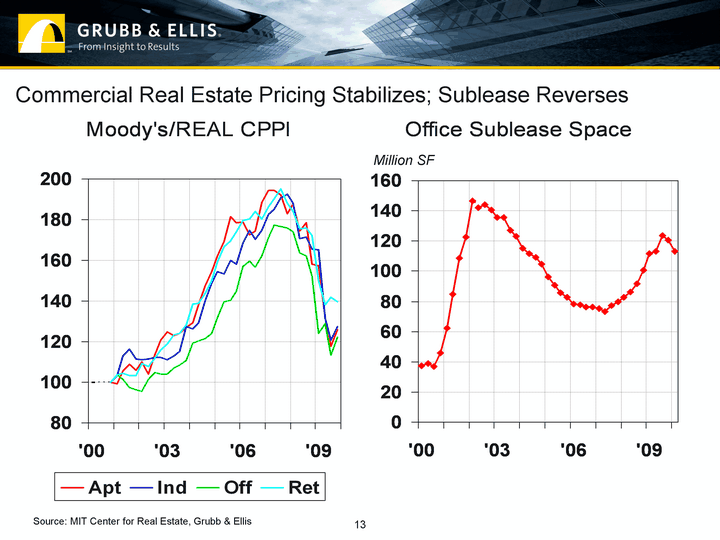
| Sublease '00 37.14 39.01 37.03 45.67 '01 62.37 84.98 108.5 122.5 '02 146.49 142.04 144.14 140.4 '03 135.78 135.35 126.88 122.89 '04 114.95 111.42 109.18 104.92 '05 95.96 90.75 85.88 82.84 '06 78.45 78 76.45 76.17 '07 75.09 73.28 77.09 80 '08 82.88 86.29 91.5 100.57 '09 111.81 113.17 123.58 120.66 10 113.07 Apt Ind Off Ret '00 100 100 100 100 100 100 100 '01 99.11821 103.3325 103.5921 103.8838 105.4308 112.9478 101.5434 104.5484 108.9797 116.4205 97.27241 103.3627 106.0326 111.6295 96.23474 103.4904 '02 110.0953 111.0812 95.4129 109.1839 104.1041 111.3528 101.4335 107.9223 113.6541 112.2974 104.7864 111.8013 120.8872 112.1346 104.1694 115.7864 '03 124.8472 110.9697 104.0332 119.0462 123.0082 113.0315 107.1017 123.1923 124.2467 115.1402 108.3374 123.9361 127.1932 127.4062 110.5801 127.9716 '04 129.3149 126.3283 119.1029 138.4834 138.3113 129.1983 120.5346 138.9181 147.3766 139.9545 121.6107 143.5795 154.288 148.8487 124.013 149.8473 '05 162.3302 154.5358 131.9074 159.3215 169.1704 153.2086 139.5563 166.644 181.5133 160.1418 140.4254 169.6046 178.3407 158.1753 144.6637 174.2107 '06 178.9635 168.4831 157.0732 179.7243 172.6192 174.6892 159.449 180.5442 174.2797 170.4096 156.6522 184.1595 188.4402 174.7629 162.1926 180.5258 '07 194.5316 182.6723 170.9794 186.298 194.3721 185.163 177.5762 190.1957 192.3336 190.6824 176.7272 195.1919 182.9639 192.5059 176.0671 188.3119 '08 187.8761 188.1427 174.016 184.1511 174.5148 170.7173 163.6777 175.5893 178.573 171.373 162.0764 175.8447 158.1176 165.6612 152.2207 172.31 '09 157.5598 165.0532 123.9174 150.0866 Million SF Commercial Real Estate Pricing Stabilizes; Sublease Reverses 13 Source: MIT Center for Real Estate, Grubb & Ellis |
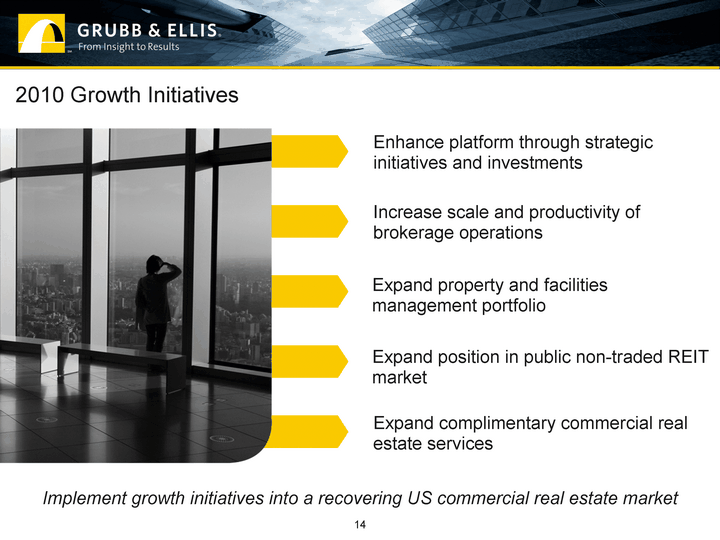
| Expand property and facilities management portfolio Increase scale and productivity of brokerage operations Expand complimentary commercial real estate services 2010 Growth Initiatives Expand position in public non-traded REIT market Enhance platform through strategic initiatives and investments Implement growth initiatives into a recovering US commercial real estate market 14 |

| Financial Performance |
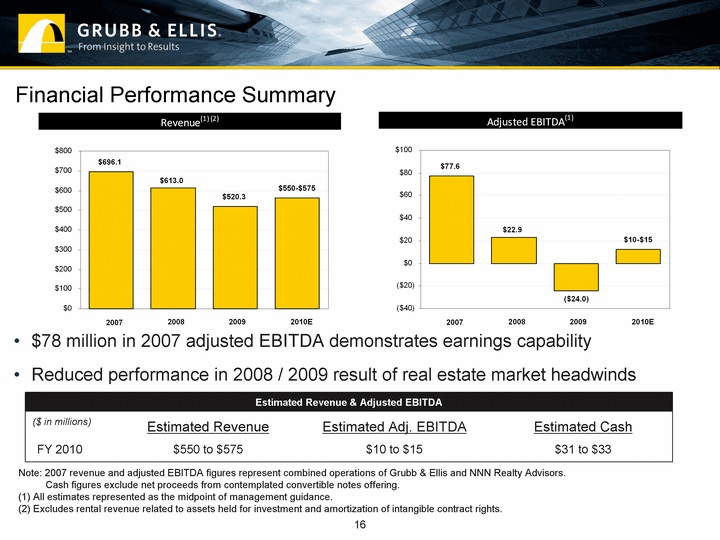
| Financial Performance Summary Estimated Revenue & Adjusted EBITDA ($ in millions) Estimated Revenue Estimated Adj. EBITDA Estimated Cash FY 2010 $550 to $575 $10 to $15 $31 to $33 Note: 2007 revenue and adjusted EBITDA figures represent combined operations of Grubb & Ellis and NNN Realty Advisors. Cash figures exclude net proceeds from contemplated convertible notes offering. (1) All estimates represented as the midpoint of management guidance. (2) Excludes rental revenue related to assets held for investment and amortization of intangible contract rights. $78 million in 2007 adjusted EBITDA demonstrates earnings capability Reduced performance in 2008 / 2009 result of real estate market headwinds 16 |
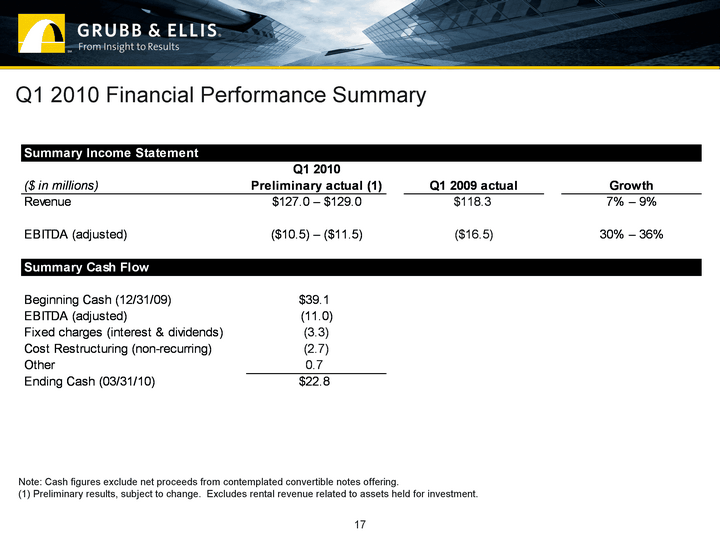
| Q1 2010 Financial Performance Summary 17 Note: Cash figures exclude net proceeds from contemplated convertible notes offering. (1) Preliminary results, subject to change. Excludes rental revenue related to assets held for investment. |
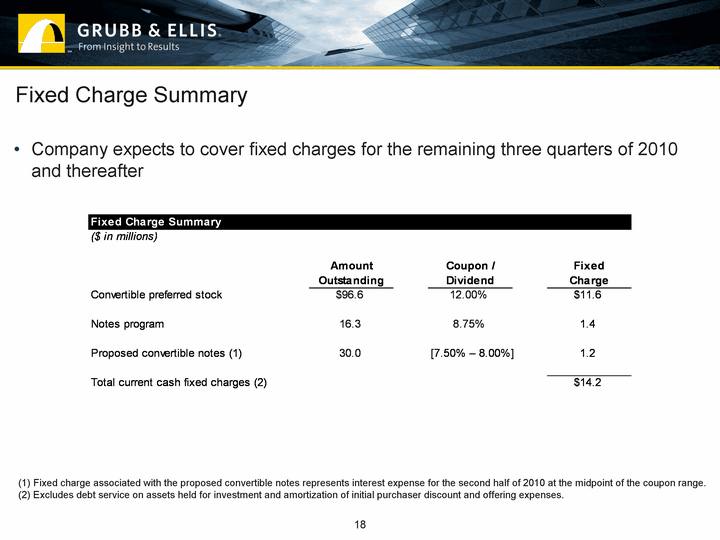
| Fixed Charge Summary Company expects to cover fixed charges for the remaining three quarters of 2010 and thereafter 18 (1) Fixed charge associated with the proposed convertible notes represents interest expense for the second half of 2010 at the midpoint of the coupon range. (2) Excludes debt service on assets held for investment and amortization of initial purchaser discount and offering expenses. |
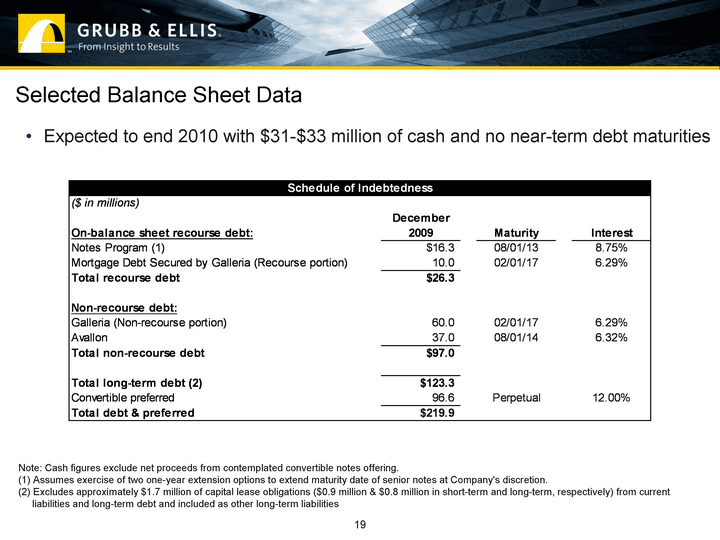
| Selected Balance Sheet Data Expected to end 2010 with $31-$33 million of cash and no near-term debt maturities Note: Cash figures exclude net proceeds from contemplated convertible notes offering. (1) Assumes exercise of two one-year extension options to extend maturity date of senior notes at Company's discretion. (2) Excludes approximately $1.7 million of capital lease obligations ($0.9 million & $0.8 million in short-term and long-term, respectively) from current liabilities and long-term debt and included as other long-term liabilities 19 |
| Expected Use of Proceeds Focused on growth initiatives in the following areas: Expand complimentary commercial real estate services Aggressive growth plan for management services Enhance brokerage talent in key markets Institutional management business Selectively expand owned office presence Drive incremental annual EBITDA of $5 million and ROIC of 20+% over 5 year term 20 |
| Grubb & Ellis Advantage Top-tier commercial real estate services and investment management firm Poised to capitalize on recovery in commercial real estate market Sponsor of public non-traded REITs Highly recognized and well-regarded brand and broad market presence Strong business model with diversified revenue streams and growth opportunities Opportunity to capitalize on highly fragmented industry dynamics Strong client retention and growing client base Revitalized balance sheet and experienced leadership team 21 |

| Appendix |
| Executive Management Team Thomas P. D'Arcy President, Chief Executive Officer and Director As president and chief executive officer, D'Arcy is responsible for the day-to-day management of Grubb & Ellis Company; he also serves as a member of the board of directors. He brings to this position 25 years of successful leadership experience at various public and private real estate companies. Before joining Grubb & Ellis in November 2009, he was a principal in Bayside Realty Partners, a private real estate company focused on acquiring, renovating and developing land and income-producing real estate. Previously, he served as president and chief executive officer of Equity Investment Group, a private real estate investment trust, as well as chairman and chief executive officer of Bradley Real Estate, Inc., a NYSE-listed REIT. D'Arcy has been the non- executive chairman of Inland Real Estate Corporation since 2008 and a member of the board since 2005. Michael Rispoli Chief Financial Officer, Grubb & Ellis Equity Advisors SVP Strategic Planning and IR Grubb & Ellis Company Michael J. Rispoli has served as senior vice president, strategic planning and investor relations since he joined Grubb & Ellis Company in May 2007 and as chief financial officer of Grubb & Ellis Equity Advisors since October 2008. From 2004 to 2007, Mr. Rispoli was executive director and corporate controller of Conexant Systems, Inc., a publicly traded semiconductor company with $1 billion in annual revenue. Prior to such time, Mr. Rispoli spent three years as corporate controller of GlobespanVirata, Inc., which merged with Conexant Systems, Inc. in February 2004. Mr. Rispoli began his career as manager of audit and business assurance services at PricewaterhouseCoopers LLP in 1993. A certified public accountant, Mr. Rispoli received a B.S. degree in Accounting from Seton Hall University. 23 |
| Executive Management Team Matthew Engel SVP, Accounting and Finance Chief Accounting Officer Matthew Engel has served as senior vice president, accounting and finance and chief accounting officer of Grubb & Ellis Company since joining the firm in November 2008. From 2001 to 2008, Mr. Engel held various finance and accounting positions at H&R Block, Inc. most recently as senior vice president, chief financial officer of the mortgage services segment. While at H&R Block, he also held the title of vice president, controller for the mortgage services segment and chief accounting officer for the parent company. Engel spent eight years at DST Systems, Inc. in various finance and accounting positions. He began his career in 1990 in the audit practice of Price Waterhouse. Engel is a Certified Public Accountant and holds a bachelor's degree from University of Northern Iowa. 24 |
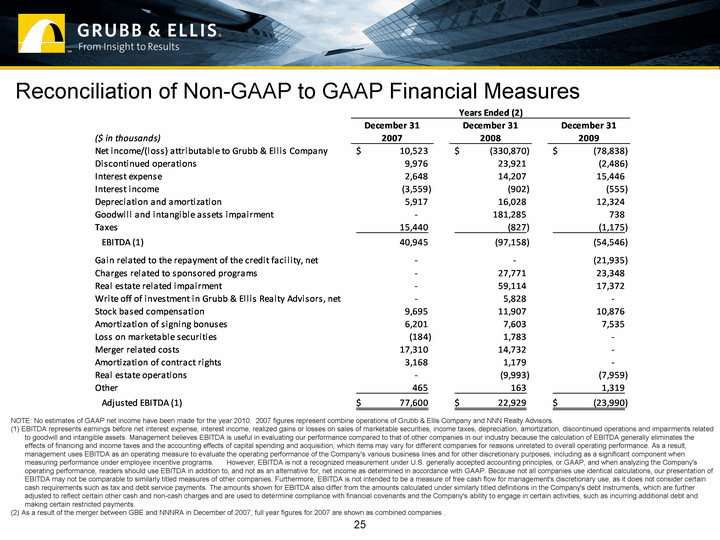
| Reconciliation of Non-GAAP to GAAP Financial Measures 25 NOTE: No estimates of GAAP net income have been made for the year 2010. 2007 figures represent combine operations of Grubb & Ellis Company and NNN Realty Advisors. (1) EBITDA represents earnings before net interest expense, interest income, realized gains or losses on sales of marketable securities, income taxes, depreciation, amortization, discontinued operations and impairments related to goodwill and intangible assets. Management believes EBITDA is useful in evaluating our performance compared to that of other companies in our industry because the calculation of EBITDA generally eliminates the effects of financing and income taxes and the accounting effects of capital spending and acquisition, which items may vary for different companies for reasons unrelated to overall operating performance. As a result, management uses EBITDA as an operating measure to evaluate the operating performance of the Company's various business lines and for other discretionary purposes, including as a significant component when measuring performance under employee incentive programs. However, EBITDA is not a recognized measurement under U.S. generally accepted accounting principles, or GAAP, and when analyzing the Company's operating performance, readers should use EBITDA in addition to, and not as an alternative for, net income as determined in accordance with GAAP. Because not all companies use identical calculations, our presentation of EBITDA may not be comparable to similarly titled measures of other companies. Furthermore, EBITDA is not intended to be a measure of free cash flow for management's discretionary use, as it does not consider certain cash requirements such as tax and debt service payments. The amounts shown for EBITDA also differ from the amounts calculated under similarly titled definitions in the Company's debt instruments, which are further adjusted to reflect certain other cash and non-cash charges and are used to determine compliance with financial covenants and the Company's ability to engage in certain activities, such as incurring additional debt and making certain restricted payments. (2) As a result of the merger between GBE and NNNRA in December of 2007, full year figures for 2007 are shown as combined companies . |
