Attached files
| file | filename |
|---|---|
| 8-K - FORM 8-K - Energy Future Holdings Corp /TX/ | d8k.htm |
| EX-99.1 - PRESS RELEASE - Energy Future Holdings Corp /TX/ | dex991.htm |
 EFH
Corp. Q1 2010 Investor Call
May 4, 2010
Exhibit 99.2 |
 1
Safe Harbor Statement
This presentation contains forward-looking statements, which are subject to
various risks and uncertainties. Discussion of risks and uncertainties
that could cause actual results to differ materially from management's current
projections, forecasts, estimates and expectations is contained in EFH Corp.'s
filings with the Securities and Exchange Commission (SEC). In addition
to the risks and uncertainties set forth in EFH Corp.'s SEC filings, the
forward-looking statements in this presentation regarding the company’s long-
term hedging program could be affected by, among other things: any change in the
ERCOT electricity market, including a regulatory or legislative change, that
results in wholesale electricity prices not being largely correlated to
natural gas prices; any decrease in market heat rates as the long-term
hedging program generally does not mitigate exposure to changes in market heat
rates; the unwillingness or failure of any hedge counterparty or the lender
under the commodity collateral posting facility to perform its obligations; or any
other unforeseen event that results in the inability to continue
to use a first lien to secure a
substantial portion of the hedges under the long-term hedging program. In
addition, the forward-looking statements in this presentation regarding
the company’s new generation plants could be affected by, among other
things, any adverse judicial rulings with respect to the plants’
construction and operating permits.
Regulation G
This presentation includes certain non-GAAP financial measures. A reconciliation
of these measures to the most directly comparable GAAP measures is included in
the appendix to this presentation. |
    2
Today’s Agenda
Paul Keglevic
Executive Vice President & CFO
Financial and Operational
Overview
Q1 2010 Review
Q&A |
 3
8
8
-
Income
tax charge recorded as a result of health care legislation enacted by
Congress in March 2010
(90)
-
90
Goodwill impairment charge
(265)
-
(134)
(663)
442
Q1 09
50
(215)
EFH Corp. adjusted (non-GAAP) operating (loss)
204
70
Unrealized mark-to-market net (gains) losses on interest rate swaps
(9)
(639)
355
Q1 10
(9)
Debt extinguishment (gain) -
March 2010 debt exchange
24
Unrealized commodity-related mark-to-market net (gains) losses
Items
excluded
from
adjusted
(non-GAAP)
operating
results
(after
tax)
-
noncash:
(87)
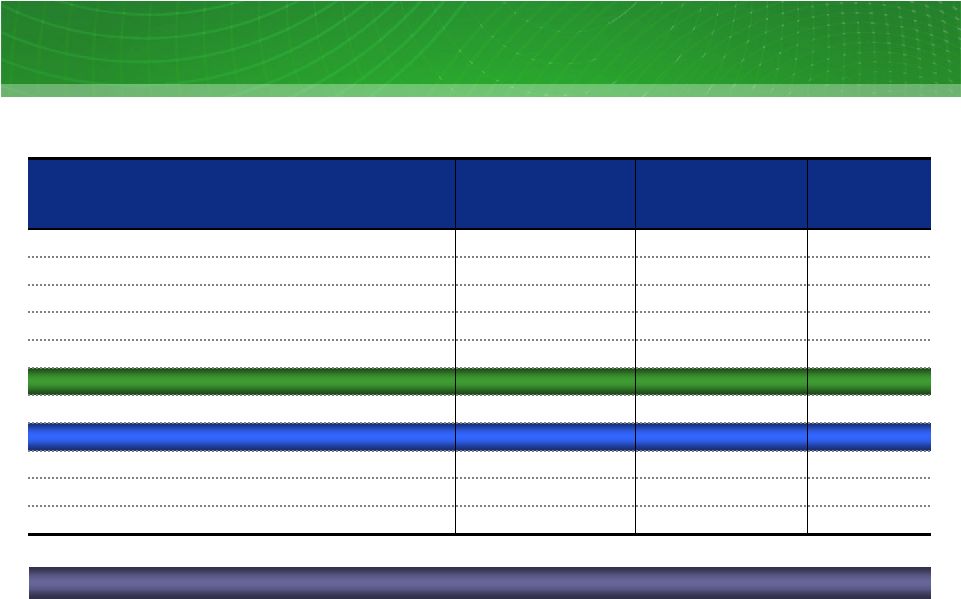
GAAP net income attributable to EFH Corp.
Change
Factor
Consolidated:
reconciliation
of
GAAP
net
income
to
adjusted
(non-GAAP)
operating
results
Q1 09 vs. Q1 10; $ millions, after tax
1
See Appendix for Regulation G reconciliations and definitions.
EFH Corp. Adjusted (Non-GAAP) Operating Results
1 |
 4
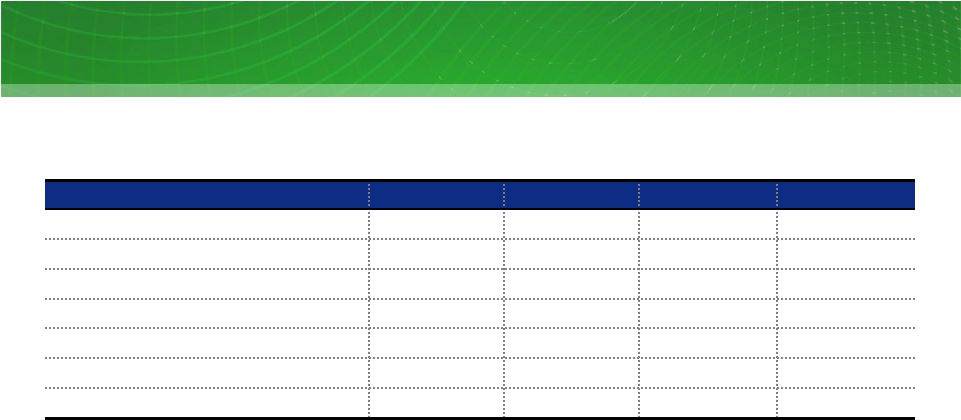
Consolidated key drivers of the change in (non-GAAP) operating results
Q1 10 vs. Q1 09; $ millions, after tax
19
Lower amortization of intangibles arising from purchase accounting
25
Higher
retail
volumes
primarily
driven
by
colder
winter
weather
and
improvement
in
the
economy
9
Higher other income
10
Lower costs related to outsourcing transition and new retail customer care
system (10)
Higher retail bad debt expense
(4)
Increase in income attributable to minority interests
(27)
Higher net interest expense driven by lower capitalized interest
due to completion of the new generation units
34
Higher
distribution
tariffs,
including
the
rates
approved
in
the
September
2009
rate
review
order
52
Impact of new lignite-fueled generation units
(20)
Higher fuel expense at the legacy coal-fueled generation units primarily due to
increased transportation costs (36)
Higher depreciation reflecting the two new lignite-fueled generation units and
mining facilities and ongoing investment in the generation fleet
Description/Drivers
Better
(Worse)
Than
Q1 09
Competitive business¹
:
Higher margin from asset management and the retail business
23
All other -
net
(2)
Contribution margin
97
Higher operating costs related to the new generation units
(13)
All other -
net
4
Total improvement -
Competitive business
34
Regulated business:
Higher
average
consumption
driven
by
the
effect
of
colder
winter
weather
23
Higher depreciation reflecting higher depreciation rates approved in the September
rate review order and infrastructure investment (26)
Higher costs reflecting amortization of regulatory assets approved for recovery, AMS
implementation and higher transmission fees (11)
Total improvement –
Regulated business (80% owned by EFH Corp.)
16
Total change in EFH Corp. adjusted (non-GAAP) operating results
50
1
Competitive business consists of Competitive Electric segment and Corp. &
Other. EFH Corp. Adjusted (Non-GAAP) Operating Results
|
 5
1
See Appendix for Regulation G reconciliations and definitions.
2
Three months ended March 31.
Q1
09 and Q1 10 include $5 million and $10 million, respectively, of Corp. &
Other Adjusted EBITDA. EFH Corp. had solid performance largely due to colder
winter weather, the effectiveness of our hedge program and operational
improvements. EFH
Corp.
Adjusted
EBITDA
(non-GAAP)
1
Q1
09
vs.
Q1
10
2
; $ millions
TCEH
Oncor
Q1 09
Q1 10
13%
EFH Corp. Adjusted EBITDA (Non-GAAP) Performance
1,263
1,116
823
891
288
362
26%
8% |
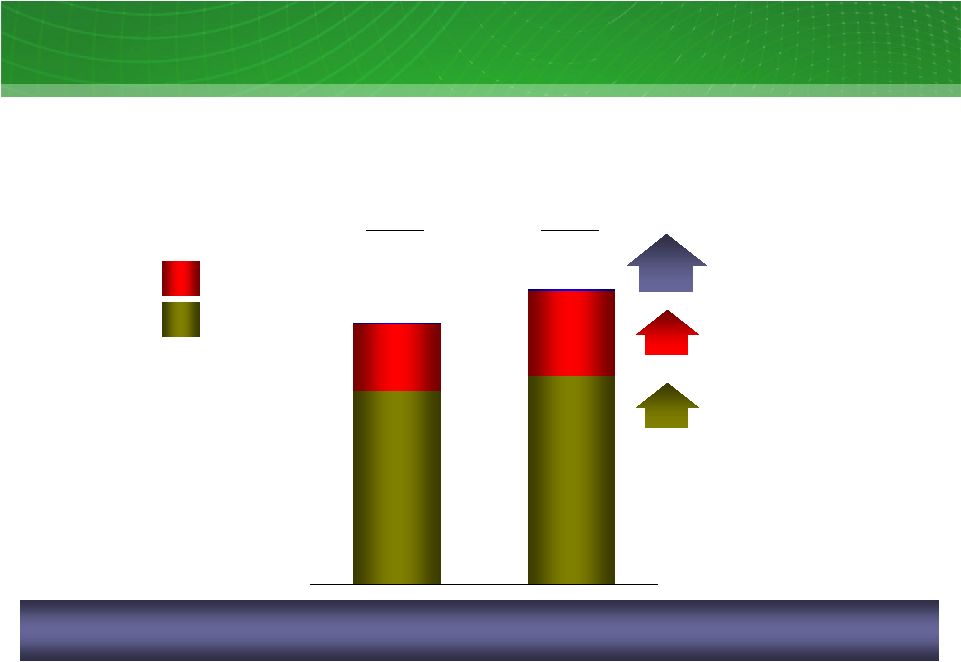
 6
Luminant Operational Results
Nuclear-fueled generation; GWh
Coal-fueled generation; GWh
2,223
Q1 10
Solid performance from the nuclear-fueled fleet
Q1 09
10,255
12,818
1
Variance
does
not
include
generation
from
Sandow
5
and
Oak
Grove
1.
Oak Grove & Sandow 5
Legacy coal-fueled plants
Q1 10 Results
Continued strong safety performance
Nuclear production impacted by
forced outage in January 2010
Solid reliability at legacy coal-fueled
units drove higher output
New coal-fueled units performed well
adding more than 2 TWh of
generation to the baseload fleet
3%
1
Improved
performance
from
the
legacy
coal-fueled
fleet
Q1 10
Q1 09
5,190
5,013
3% |
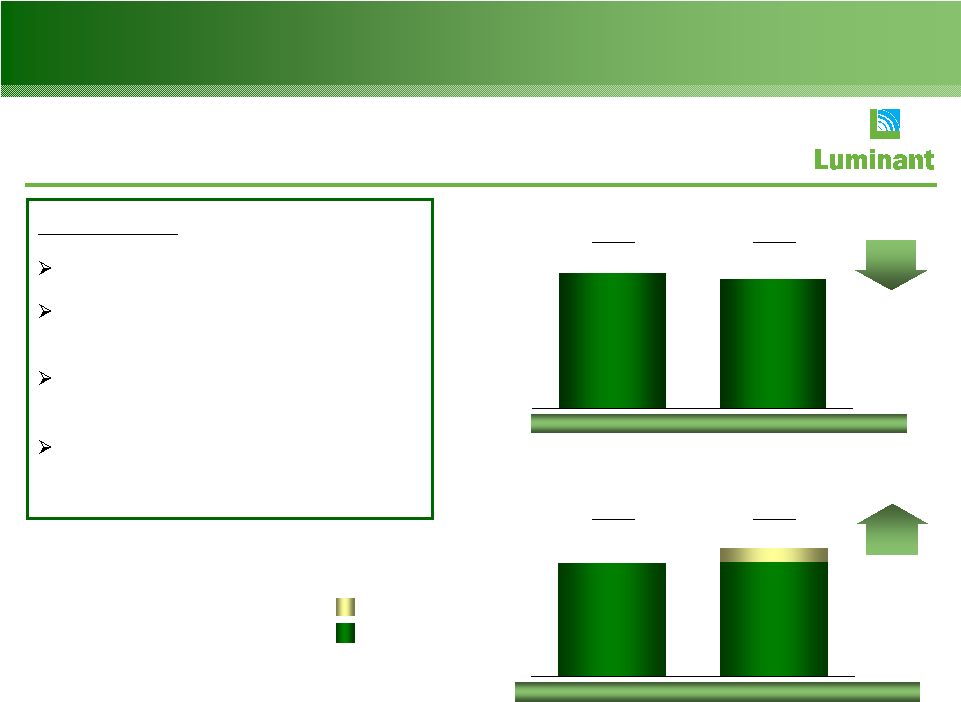
  7
Q1 10 Results
Higher residential sales volumes
driven by colder than normal
weather in Q1 10 compared to
warmer than normal weather in Q1
09
Business load growth attributable
to new customers, weather and
improved economy
Lower residential customer counts
reflect competitive activity in the
marketplace
Launched new brand
and mass
advertising campaign
TXU Energy Operational Results
Continued strong competitive activity
Higher volumes due to weather and improved economy
Total residential customers
End of period, thousands
Retail electricity sales volumes by customer class;
GWh
1,862
1,849
1
Small business customers
2
Large commercial and industrial customers
Q1 10
SMB
LCI
Residential
Q1 09
10,907
12,220
Q1 09
Q4 09
4%
12%
6,719
5,880
3,519
3,305
1,722
1,982
Q1 10
Q1 10
1,849
1,930
1%
1
2 |
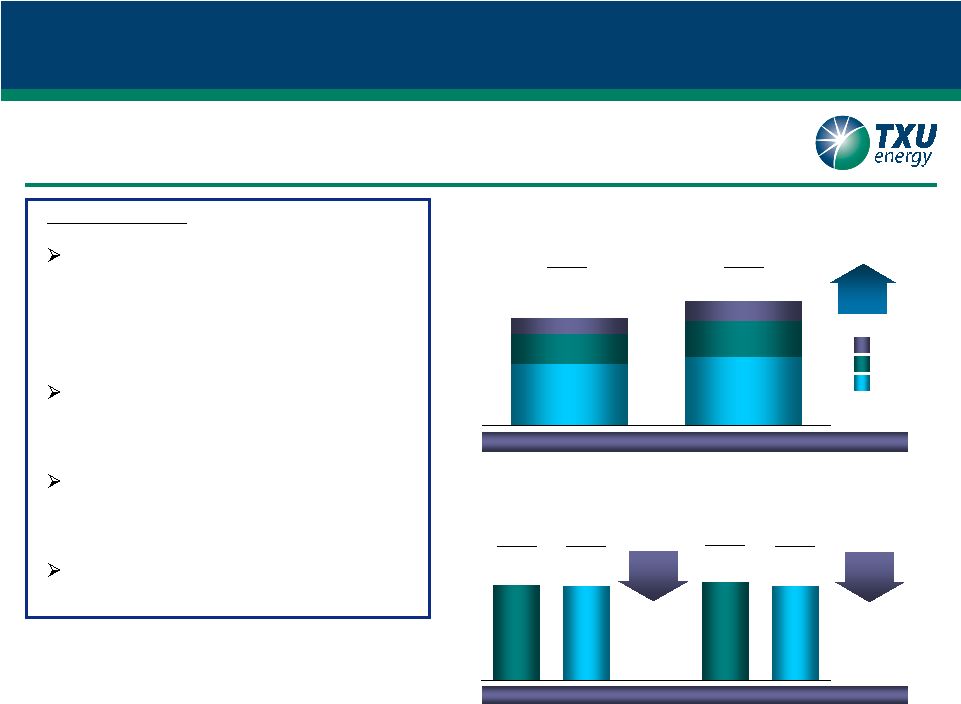
 8
15,094
15,555
11,057
9,133
Oncor Operational Results
Electric energy billed volumes; GWh
Q1 09
Q1 10
Q1 09
Q1 10
Volume
increases
due
to
weather
and
improved
economy
Growth
below ERCOT estimated CAGR of 2.5% Q1 10 Results
Higher energy volumes due to
colder than normal weather in Q1
10 compared to warmer than
normal weather in Q1 09
Execution of AMS plan –
~185,000
advanced meters installed during
the first quarter; over 900,000
through April 30, 2010
9 of 14 CREZ-related Certificates of
Convenience and Necessity (CCN)
approved by the Public Utility
Commission of Texas
Cost estimates for 9 approved and
3 default CREZ-related projects are
expected to exceed the original
ERCOT estimates
by $220 million
1
SMB
–
small
business;
LCI
–
large
commercial
and
industrial
Residential
SMB & LCI
1
26,612
24,227
3,128
3,154
10%
1%
Electricity
distribution points of delivery
End of period, thousands of meters
Q1 10
Q4 09
3,145
3,154 |
 9
Cash and Equivalents
TCEH Letter of Credit Facility
TCEH Revolving Credit Facility
EFH Corp. Liquidity Management
2,700
253
2,421
1,250
816
434
1,328
Facility Limit
LOCs/Cash Borrowings
Availability
4,183
1,069
3,950
EFH Corp. and TCEH have sufficient liquidity to meet their anticipated short-term
needs, but will continue to monitor market conditions to ensure financial
flexibility. 1
Facility
to
be
used
for
issuing
letters
of
credit
for
general
corporate
purposes.
Cash
borrowings
of
$1.250
billion
were
drawn
on
this
facility
in
October
2007,
and,
except
for
$115
million
related
to
a
letter
of
credit
drawn
in
June
2009,
have
been
retained
as
restricted
cash.
Outstanding
letters
of
credit
are
supported
by
the
restricted
cash.
2
Facility availability includes $141 million of undrawn commitments from a
subsidiary of Lehman Brothers that has filed for bankruptcy. These funds are only available
from the fronting banks and the swingline lender, and exclude $26 million of
requested draws not funded by the Lehman subsidiary. EFH Corp. (excluding
Oncor) available liquidity As of 3/31/10; $ millions
•
Liquidity reflected in the table
does not include the unlimited
capacity available under the
Commodity Collateral Posting
Facility for ~540 million MMBtu
of natural gas hedges.
1
2 |
 10
Current Maturity Profile
EFH Corp. debt maturities¹ (excluding Oncor),
2010-2020 and thereafter As of 3/31/10; $ millions
1
Includes amortization of the $4.1 billion Delayed Draw Term Loan.
2
Excludes borrowings under the TCEH Revolving Credit Facility maturing in 2013, the
Deposit Letter of Credit maturing in 2014 and unamortized discounts and premiums. 19,338
1,925
1,029
4,857
4,612
2010
2011
2012
2013
2014
2015
2016
2017
2018
2019
2020+
177
668
251
305
20,369
2
4,881
1,946
4,652
11
TCEH-Secured
EFH Corp
EFCH
TCEH-Revolver
TCEH-Unsecured
2,034
3,077
2
267
EFH Corp. continues to explore opportunities to improve the
enterprise’s maturity profile.
988
EFIH
April 2010 transactions:
•
EFH repurchased $5 million of EFH LBO Cash Pay Notes for $3.6 million
•
EFH exchanged $11 million of EFH 10% Senior Secured Notes for $15
million of EFH LBO PIK Toggle Notes
•
EFH exchanged $55 million of EFH 10% Senior Secured Notes for $60
million of EFH LBO PIK Toggle Notes and $17 million of TCEH LBO PIK
Toggle Notes
Issued $500 million
of EFH 10% Senior
Secured Notes in
Jan. 2010
March 2010 Exchange -
$34 million of EFH 10%
Senior Secured Notes were exchanged for $47
million of EFH and TCEH LBO PIK Toggle Notes
March 2010 Exchange
reduced 2016 and 2017
maturities by $27 million and
$20 million, respectively
$1.25 billion LOC Facility
expires in 2014
$2.70 billion Revolving Credit
Facility expires in 2013 |
    11
Today’s Agenda
John Young
President & CEO
Financial and Operational
Overview
Q1 2010 Review
Q&A |
    12
Today’s Agenda
EFH Corp. Senior Executive Team
Financial and Operational
Overview
Q1 2010 Review
Q&A |
 13
Questions & Answers |
 14
Appendix –
Additional Slides and
Regulation G Reconciliations
Appendix |
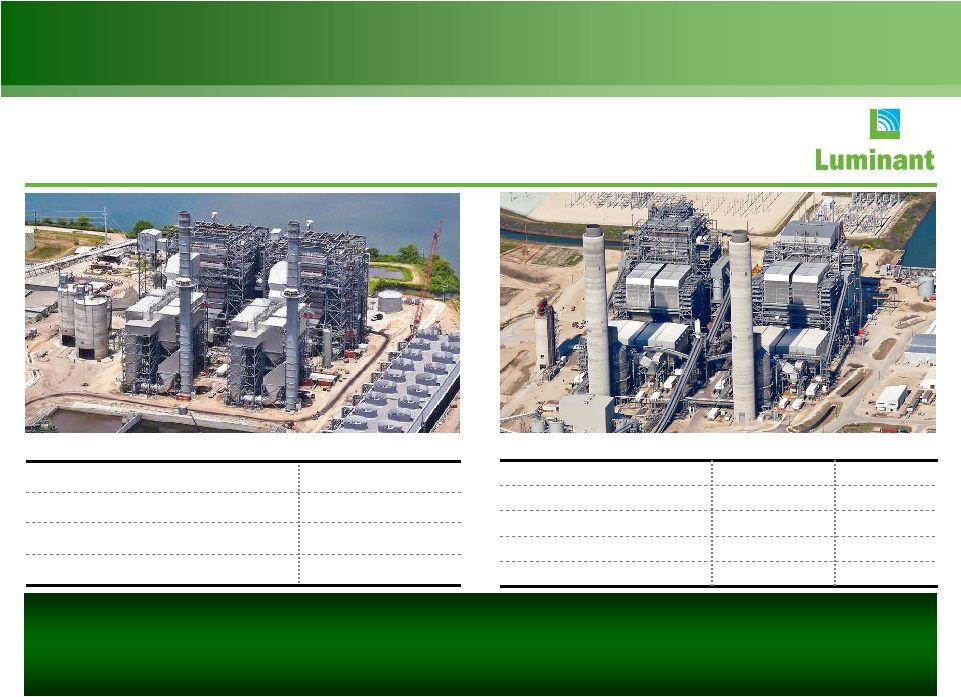 15
Luminant Solid-Fuel Development Program
Sandow Power Plant Unit 5
Rockdale, Texas
Oak Grove
Power Plant
Robertson County, Texas
Texas lignite
Texas lignite
Primary fuel
~97%
100%
Percent complete at 3/31/10
January 2010
August 2009
Initial synchronization
December 2009
~800 MW
Unit 1
Unit 2
Estimated net capacity
~800 MW
Substantial completion date
Mid-2010
Estimated net capacity
~580 MW
Primary fuel
Texas lignite
Initial synchronization
July 2009
Substantial completion date
September 2009
•
Both Sandow 5 and Oak Grove 1 lignite-fueled generating units achieved 70%
average capacity factors during the first quarter of 2010.
•
Luminant’s construction of the Oak
Grove 2 lignite-fueled generating unit continues to track on time and on
budget. 1
Substantial completion date is the contractual milestone when Luminant takes over
operations of the unit from the EPC contractor. 1
1 |
 16
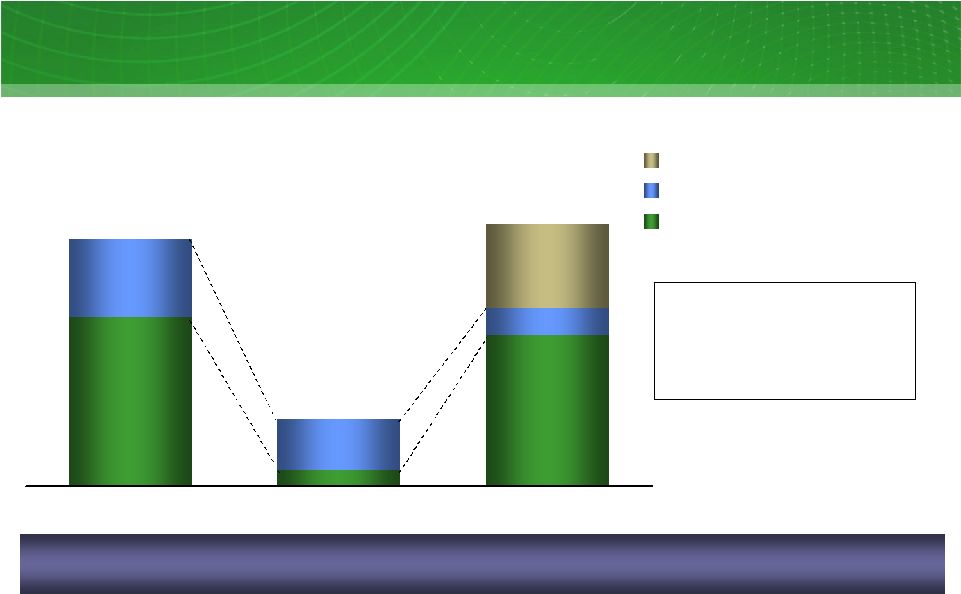
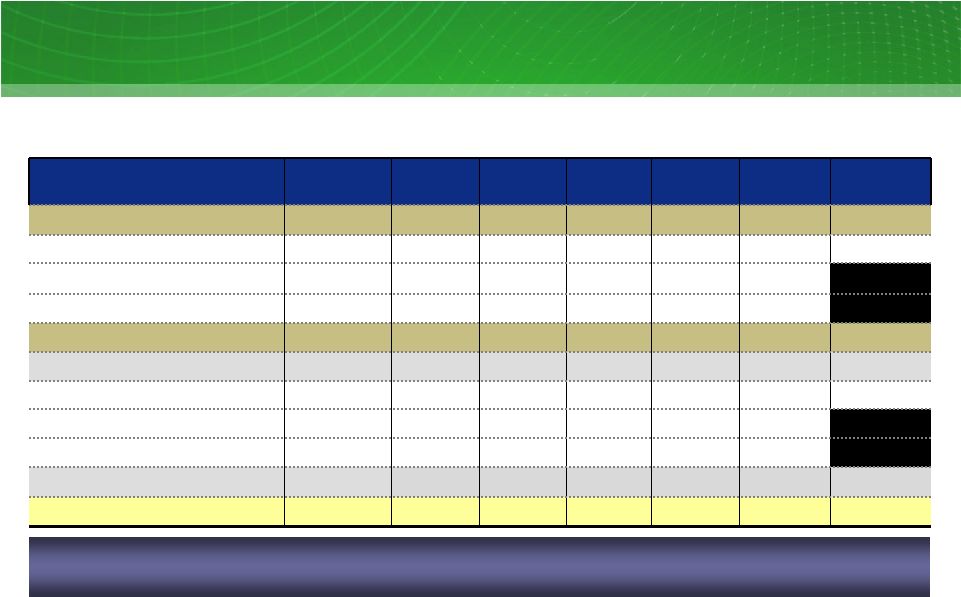
Unrealized Mark-To-Market Impact Of Hedging
Unrealized mark-to-market impact of hedging program
3/31/10 vs. 12/31/09; mixed measures, pre-tax
Factor
Measure
2010
2011
2012
2013
2014
Total or
Avg.
12/31/09
Natural gas hedges
mm MMBtu
~240
~447
~490
~300
~97
~1,574
Wtd. avg. hedge price¹
$/MMBtu
~$7.79
~$7.56
~$7.36
~$7.19
~$7.80
Natural gas prices
$/MMBtu
~$5.79
~$6.34
~$6.53
~$6.67
~$6.84
Cum. MtM gain at 12/31/09²
$ billions
~$0.8
~$0.4
~$0.4
~$0.2
~$0.2
~$2.0
3/31/10
Natural gas hedges³
mm MMBtu
~181
~424
~487
~300
~99
~1,491
Wtd. avg. hedge price¹
$/MMBtu
~$7.71
~$7.56
~$7.36
~$7.19
~$7.80
Natural gas prices
$/MMBtu
~$4.27
~$5.34
~$5.79
~$6.07
~$6.36
Cum. MtM gain at 3/31/10²
$ billions
~$0.8
~$0.9
~$0.8
~$0.3
~$0.3
~$3.1
Q1 10 MtM gain
$ billions
~$0
~$0.5
~$0.4
~$0.1
~$0.1
~$1.1
Decreases
in
natural
gas
prices
during
the
first
quarter
of
2010
resulted
in
a
~$1.1
billion
(~$680 million after tax) unrealized mark-to-market net gain in GAAP net
income for Q1 10. 1
Weighted
average
prices
are
based
on
NYMEX
Henry
Hub
prices
of
forward
natural
gas
sales
positions
in
the
long-term
hedging
program
(excluding
the
impact
of
offsetting
purchases
for
rebalancing
and
pricing
point
basis
transactions).
Where
collars
are
reflected,
sales
price
represents
the
collar
floor
price.
3/31/10
prices
for
2010
represent
April
1,
2010
through
December 31, 2010 values.
2
MtM values include the effects of all transactions in the long-term hedging
program including offsetting purchases (for re-balancing) and natural gas basis deals.
3
As of 3/31/10. 2010 represents April 1, 2010 through December 31, 2010 volumes.
Where collars are reflected, the volumes are estimated based on the natural gas price sensitivity (i.e.,
delta position) of the derivatives. The notional volumes for collars are
approximately 150 million MMBtu, which corresponds to a delta position of approximately 99 million MMBtu in 2014. |
 17
17
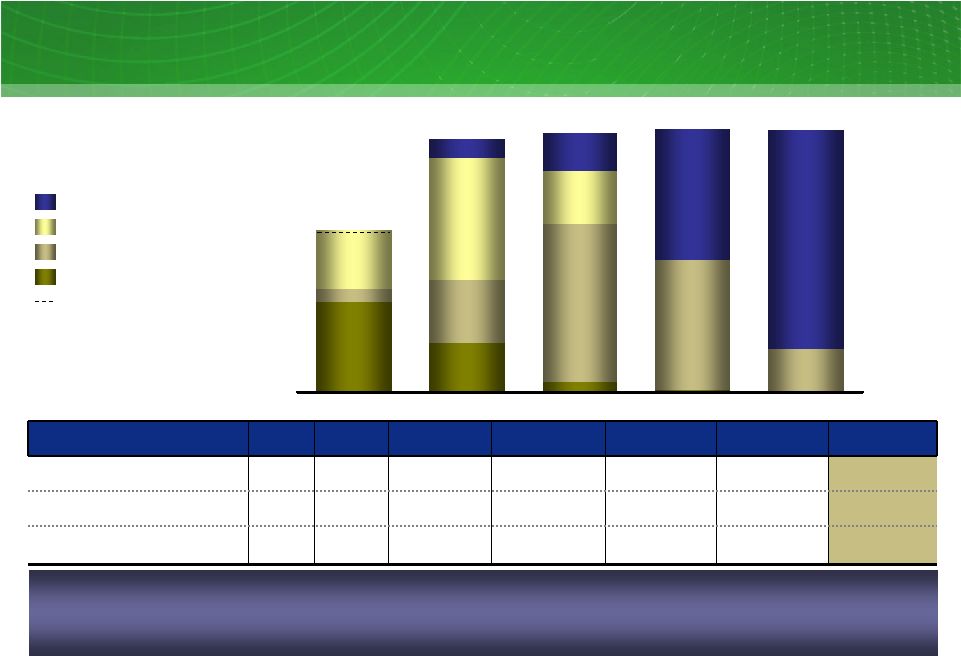
TCEH Natural Gas Exposure
TCEH Natural Gas Position
10-14
1
; million MMBtu
Hedges Backed by Asset First Lien
Open Position
1
As of 3/31/10. Balance of 2010 is from May 1, 2010 to December 31,
2010. Assumes conversion of electricity positions based on a ~8.0 heat rate with natural gas being on the margin
~75-90%
of
the
time
(i.e.
when
other
technologies
are
forecast
to
be
on
the
margin,
no
natural
gas
position
is
assumed
to
be
generated).
2
Includes estimated retail/wholesale effects. 2010 position includes ~15
million MMBtu of short gas positions associated with proprietary trading positions; excluding these positions, 2010
position is ~99% hedged.
209
115
24
143
364
281
123
44
85
504
583
596
1
6
29
99
300
136
301
362
604
607
BAL 10
2011
2012
2013
2014
100% Hedge Level
Factor
Measure
BAL 10
2011
2012
2013
2014
Total or
Average
Natural gas hedging program
million
MMBtu
~165
~424
~487
~300
~99
~1,475
TXUE and Luminant net positions
million
MMBtu
~209
~115
~24
~6
~1
~355
Overall estimated percent of total
NG position hedged
percent
~103%
~92%
~86%
~50%
~17%
~67%
TXUE
and
Luminant
Net
Positions
2
TCEH has hedged approximately 67% of its estimated Henry Hub-based natural gas
price exposure from May 1, 2010 through December 31, 2014 . More than
95% of the NG hedges are supported by a first lien and the TCEH Commodity
Collateral Posting Facility. Hedges Backed by CCP
|
 18
18
EFH Corp. Adjusted EBITDA Sensitivities
Commodity
Percent Hedged at
March 31, 2010
Change
BOY 10E
Impact
$ millions
7X24 market heat rate (MMbtu/MWh)²
~85
0.1 MMBtu/MWh
~4
NYMEX gas price ($/MMBtu)³
~100
$1/MMBtu
~13
Texas gas vs. NYMEX Henry Hub price ($/MMBtu)
3,4
>95
$0.10/MMBtu
~0
Diesel ($/gallon)
5
>95
$1/gallon
~2
Base coal ($/ton)
6
~90
$5/ton
~6
Generation operations
Baseload generation (TWh)
n.a.
1 TWh
~25
Retail operations
Balance of 2010
Residential contribution margin ($/MWh)
22 TWh
$1/MWh
~22
Residential consumption
22 TWh
1%
~7
Business markets consumption
20 TWh
1%
~3
Impact
on
EFH
Corp.
Adjusted
EBITDA
1
10E; mixed measures
The majority of 2010 commodity-related risks are significantly mitigated.
1
2010
estimate
based
on
commodity
positions
as
of
3/31/10,
net
of
long-term
hedges
and
wholesale/retail
effects,
excludes
gains
and
losses
incurred
prior
to
March
31,
2010.
See
Appendix for definition.
2
Simplified representation of heat rate position in a single TWh position. In
reality, heat rate impacts are differentiated across plants and respective pricing periods: baseload (linked
primarily to changes in North Zone 7x24), natural gas plants (primarily North Zone
5x16) and wind (primarily West Zone 7x8). 3
Assumes conversion of electricity positions based on a ~8.0 market heat rate with
natural gas being on the margin ~75-90% of the time (i.e., when coal is forecast to be on the margin, no
natural gas position is assumed to be generated).
4
The
percentage
hedged
represents
the
amount
of
estimated
natural
gas
exposure
based
on
Houston
Ship
Channel
(HSC)
gas
price
sensitivity
as
a
proxy
for
Texas
gas
price.
5
Includes positions related to fuel surcharge on rail transportation.
6
Excludes fuel surcharge on rail transportation. |
 19
19
Commodity Prices
Commodity
Units
Q1 09 Actual
Q1 10 Actual
BOY
10E
1
NYMEX
gas
price
2
$/MMBtu
$4.58
$5.15
$4.27
HSC gas price
$/MMBtu
$4.04
$5.09
$4.23
7x24
market
heat
rate
(HSC)
3
MMBtu/MWh
7.24
7.70
7.94
North Zone 7x24 power price
$/MWh
$29.24
$39.22
$33.63
Gulf Coast ultra-low sulfur diesel
$/gallon
$1.33
$2.06
$2.26
PRB 8400 coal
$/ton
$11.62
$8.08
$9.69
LIBOR
interest
rate
4
percent
1.74%
0.40%
0.68%
Commodity prices
Q1 09, Q1 10 and BOY 10E; mixed measures
1
BOY 10 estimate based on commodity prices as of 3/31/10 for April through
December 2010 2
Based on NYMEX forward curve
3
Based on market clearing price for power
4
The index for the settled value is a 6 month LIBOR rate
|
 20
Financial Definitions
Refers to the results of Oncor and the Oncor ring-fenced entities.
Regulated Business
Results
Refers to the combined results of the Competitive Electric segment and Corporate
& Other. Competitive Business
Results
Operating revenues less fuel, purchased power costs, and delivery fees, plus or
minus net gain (loss) from commodity hedging and trading activities, which on
an adjusted (non-GAAP) basis, exclude unrealized gains and losses.
Contribution Margin (non-
GAAP)
Net income (loss) from continuing operations before interest expense and related
charges, and income tax expense (benefit) plus depreciation and
amortization. EBITDA
(non-GAAP)
Generally accepted accounting principles.
GAAP
The purchase method of accounting for a business combination as prescribed by GAAP,
whereby the purchase price of a business combination is allocated to
identifiable assets and liabilities (including intangible assets) based upon their fair values.
The excess of the purchase price over the fair values of assets and liabilities is
recorded as goodwill. Depreciation and amortization due to purchase
accounting represents the net increase in such noncash expenses due to recording the fair
market values of property, plant and equipment, debt and other assets and
liabilities, including intangible assets such as emission allowances,
customer relationships and sales and purchase contracts with pricing favorable to market prices at the
date of the Merger. Amortization is reflected in revenues, fuel, purchased
power costs and delivery fees, depreciation and amortization, other income
and interest expense in the income statement. Purchase Accounting
Net income (loss) adjusted for items representing income or losses that are not
reflective of underlying operating results. These items include
unrealized mark-to-market gains and losses, noncash impairment charges and other charges, credits or
gains
that
are
unusual
or
nonrecurring.
EFH
Corp.
uses
adjusted
(non-GAAP)
operating
earnings
as
a
measure
of
performance
and believes that analysis of its business by external users is enhanced by
visibility to both net income (loss) prepared in accordance with GAAP and
adjusted (non-GAAP) operating earnings (losses). Adjusted (non-GAAP)
Operating Results
EBITDA adjusted to exclude interest income, noncash items, unusual items, interest
income, income from discontinued operations and other adjustments allowable
under the EFH Corp. senior and senior secured notes indentures. Adjusted
EBITDA plays an important role in respect of certain covenants contained in these
indentures. Adjusted EBITDA is not intended to be an alternative to
GAAP results as a measure of operating performance or an alternative to cash flows from
operating
activities
as
a
measure
of
liquidity
or
an
alternative
to
any
other
measure
of
financial
performance
presented
in
accordance
with
GAAP,
nor
is
it
intended
to
be
used
as
a
measure
of
free
cash
flow
available
for
EFH
Corp.’s
discretionary
use,
as the measure excludes certain cash requirements such as interest payments, tax
payments and other debt service requirements. Because not all companies
use identical calculations, Adjusted EBITDA may not be comparable to similarly titled
measures of other companies.
Adjusted EBITDA
(non-GAAP)
Definition
Measure |
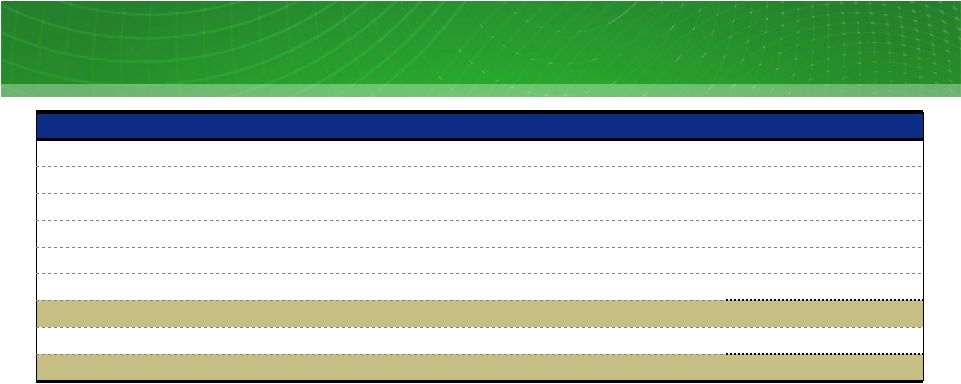
 21
Table 1: EFH Corp. Adjusted EBITDA Reconciliation
Three Months Ended March 31, 2009 and 2010
$ millions
(63)
-
Equity in earnings of unconsolidated subsidiaries
(5)
-
Amortization of ”day one”
net loss on Sandow 5 power purchase agreement
(14)
-
Net gain on debt exchange offers
-
12
Net income attributable to noncontrolling interests
-
2
EBITDA amount attributable to consolidated unrestricted subsidiaries
(993)
(1,030)
Unrealized net gain resulting from hedging transactions
4
1
90
97
24
(1)
25
(298)
1,849
407
667
333
442
Q1 09
-
Losses on sale of receivables
-
Impairment of goodwill
2
1
Impairment of assets and inventory write-down
56
Purchase accounting adjustments
1
(10)
Interest income
37
Amortization of nuclear fuel
Adjustments to EBITDA (pre-tax):
-
Oncor EBITDA
30
Oncor distributions
954
Interest expense and related charges
1,854
342
203
355
Q1 10
Net income attributable to EFH Corp.
Income tax expense
Depreciation and amortization
EBITDA
Factor
Note: Table and footnotes to this table continue on following page
|
 22
1
Includes amortization of the intangible net asset value of retail and wholesale
power sales agreements, environmental credits, coal purchase contracts, nuclear fuel
contracts and power purchase agreements and the stepped-up value of nuclear
fuel. Also includes certain credits not recognized in net income due to purchase
accounting.
2
Reflects the completion in the first quarter of 2009 of the fair
value calculation supporting the goodwill impairment charge that was recorded in
the fourth quarter of 2008.
3
Accounted for under accounting standards related to stock compensation and excludes
capitalized amounts. 4
Includes amounts incurred related to outsourcing, restructuring and other amounts
deemed to be in excess of normal recurring amounts. 5
Includes professional fees primarily for retail billing and customer care systems
enhancements and certain incentive compensation. 6
Includes costs related to the Merger and abandoned strategic transactions,
outsourcing transition costs, administrative costs related to the cancelled program to
develop coal-fueled facilities, the Sponsor Group management fee, costs related
to certain growth initiatives and costs related to the Oncor sale of noncontrolling
interests.
7
Reflects noncapital outage costs.
1,263
332
931
23
(10)
13
-
3
9
Q1 10
1,116
264
852
34
3
17
11
7
5
Q1 09
Severance expense
4
Noncash compensation
expense³
EFH Corp. Adjusted EBITDA per Incurrence Covenant
EFH Corp. Adjusted EBITDA per Restricted Payments Covenant
Expenses incurred to upgrade or expand a generation station
7
Add back Oncor adjustments
Transaction and merger expenses
6
Transition and business optimization costs
5
Restructuring and other
Factor
Table 1: EFH Adjusted EBITDA Reconciliation (continued from previous page)
Three Months Ended March 31, 2009 and 2010
$ millions |
 23
Table 2: TCEH Adjusted EBITDA Reconciliation
Three Months Ended March 31, 2009 and 2010
$ millions
1
11
Transition and business optimization costs
5
3
7
Severance expense
4
1
2
4
-
-
(1,030)
2
70
86
24
(8)
1,618
276
399
367
576
Q1 09
2
Corp. depreciation, interest and income tax expense included in SG&A
-
Losses on sale of receivables
(5)
Amortization of ”day one”
net loss on Sandow 5 power purchase agreement
11
Transaction and merger expenses
6
7
Noncash compensation
expense³
-
Impairment of
goodwill²
-
EBITDA amount attributable to consolidated unrestricted subsidiaries
44
Purchase accounting
adjustments¹
(22)
Interest income
37
Amortization of nuclear fuel
(993)
Unrealized net gain resulting from hedging transactions
Adjustments to EBITDA (pre-tax):
749
Interest expense and related charges
1,794
337
258
450
Q1 10
Net income
Income tax expense
Depreciation and amortization
EBITDA
Factor
Note: Table and footnotes to this table continue on following page
|
 24
Table 2: TCEH Adjusted EBITDA Reconciliation (continued from previous page)
Three Months Ended March 31, 2009 and 2010
$ millions
(11)
2
Restructuring and other
861
5
33
823
34
Q1 09
3
Other adjustments allowed to determine Adjusted EBITDA per Maintenance
Covenant
8
891
TCEH Adjusted EBITDA per Incurrence Covenant
953
TCEH Adjusted EBITDA per Maintenance Covenant
23
Expenses incurred to upgrade or expand a generation station
7
59
Expenses related to unplanned generation station outages
7
Q1 10
Factor
1
Includes amortization of the intangible net asset value of retail and wholesale
power sales agreements, environmental credits, coal purchase contracts, nuclear fuel
contracts
and
power
purchase
agreements
and
the
stepped
up
value
of
nuclear
fuel.
Also
includes
certain
credits
not
recognized
in
net
income
due
to
purchase
accounting.
2
Reflects
the
completion
in
the
first
quarter
of
2009
of
the
fair
value
calculation
supporting
the
goodwill
impairment
charge
that
was
recorded
in
the fourth quarter
of 2008.
3
Excludes capitalized amounts.
4
Includes amounts incurred related to outsourcing, restructuring and other amounts
deemed to be in excess of normal recurring amounts. 5
Includes professional fees primarily for retail billing and customer care systems
enhancements and certain incentive compensation. 6
Includes costs related to the Merger, outsourcing transition costs and costs
related to certain growth initiatives. 7
Reflects noncapital outage costs.
8
Primarily pre-operating expenses related to Oak Grove and Sandow 5 generation
facilities. |
 25
1
Purchase accounting adjustments consist of amounts related to the accretion of an adjustment
(discount) to regulatory assets resulting from purchase accounting. Table 3: Oncor Adjusted EBITDA
Reconciliation Three Months Ended March 31, 2009 and 2010
$ millions
(10)
(9)
Interest income
288
-
(10)
307
126
86
37
58
Q1 09
(9)
Purchase
accounting
adjustments
1
379
EBITDA
362
Oncor Adjusted EBITDA
2
Restructuring and other
86
Interest expense and related charges
166
48
79
Q1 10
Net income
Income tax expense
Depreciation and amortization
Factor |