Attached files
| file | filename |
|---|---|
| 8-K - SUNOCO INC--FORM 8-K - SUNOCO INC | d8k.htm |
| EX-99.1 - PRESS RELEASE - SUNOCO INC | dex991.htm |
 1Q10
Earnings Conference Call April
29, 2010 Exhibit 99.2 |
 2
Safe Harbor Statement
This slide presentation should be reviewed in conjunction with Sunoco’s First Quarter 2010 earnings
conference call held on April 29, 2010 at 5:30 p.m. ET. You may listen to the audio portion
of the conference call on the website or an audio recording will be available after the
call’s completion by calling 1-800-642-1687 and entering conference
ID#71298469.
Statements in this presentation that are not historical facts are forward-looking statements
intended to be covered by the safe harbor provisions of Section 27A of the Securities Act of 1933
and Section 21E of the Securities Exchange Act of 1934. These forward-looking statements
are based upon assumptions by Sunoco concerning future conditions, any or all of which ultimately
may prove to be inaccurate, and upon the current knowledge, beliefs and expectations of Sunoco
management. These forward-looking statements are not guarantees of future
performance.
Forward-looking statements are inherently uncertain and involve significant risks and uncertainties
that could cause actual results to differ materially from those described during this
presentation. Such risks and uncertainties include economic, business, competitive and/or
regulatory factors affecting Sunoco's business, as well as uncertainties related to the outcomes
of pending or future litigation. In accordance with the safe harbor provisions of the
Private Securities Litigation Reform Act of 1995, Sunoco has included in its Annual Report on Form 10-K for
the year ended December 31, 2009, and in its subsequent Form 10-Q and Form 8-K filings,
cautionary language identifying important factors (though not necessarily all such factors) that
could cause future outcomes to differ materially from those set forth in the forward-looking
statements. For more information concerning these factors, see Sunoco's Securities and
Exchange Commission filings, available on Sunoco's website at www.SunocoInc.com. Sunoco expressly
disclaims any obligation to update or alter its forward-looking statements, whether as a result of
new information, future events or otherwise.
This presentation includes certain non-GAAP financial measures intended to supplement, not
substitute for, comparable GAAP measures. Reconciliations of non-GAAP financial measures to
GAAP financial measures are provided in the Appendix at the end of the presentation.
Investors are urged to consider carefully the comparable GAAP measures and the reconciliations to
those measures provided in the Appendix, or on our website at www.SunocoInc.com.
|
 3
Summary
1Q10 Results
Income before special items* of $17MM ($0.14/share)
Refining & Supply continues to be challenged by weak demand and
high global supply
Planned maintenance activity limited refineries’
throughput and
challenged margin realization during the quarter
Retail Marketing, Logistics and Coke businesses continue to deliver
solid and consistent results
Closed sale of Chemicals’
Polypropylene business in 1Q
Strategic Outlook
We remain focused on the fundamentals: running our refineries
safely and reliably at optimal capacity utilization, lowering our
breakeven cost per barrel, and improving margin capture, all of
which are designed to increase our cash generation from operations
Actions to improve balance sheet and strengthen our liquidity will
position us to take advantage of attractive growth opportunities
* For reconciliation to Total Income (Loss), see Slide 14.
|
 4
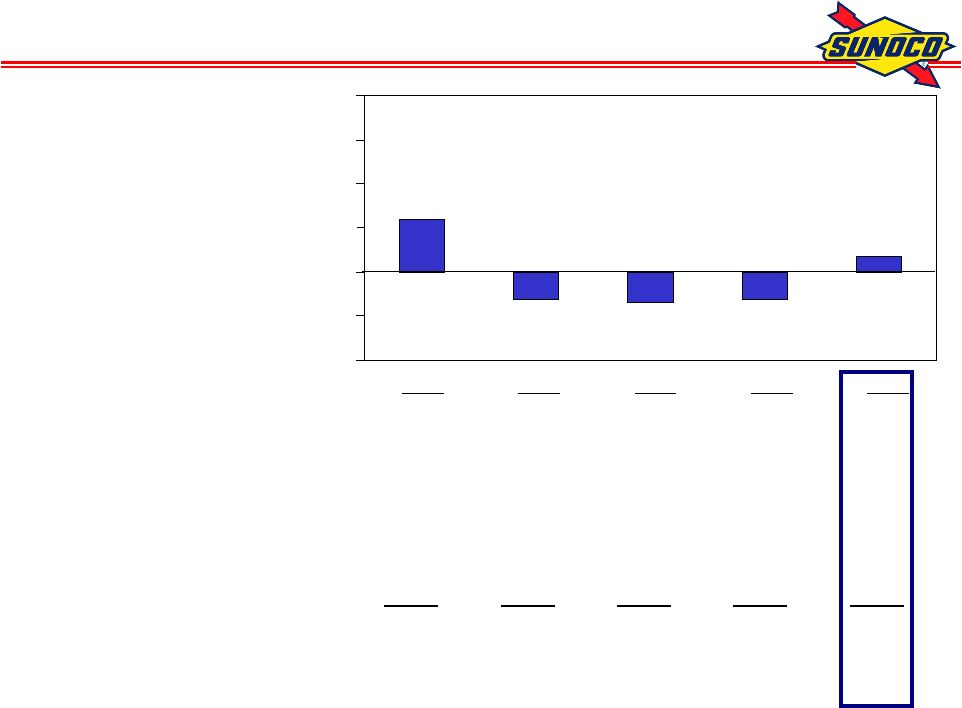
Income (Loss) Before Special Items*, MM$
59
(31)
(34)
(31)
17
($100)
($50)
$0
$50
$100
$150
$200
* For reconciliation to Total Income (Loss), see Slide 14.
1Q09
2Q09
3Q09
4Q09
1Q10
Refining & Supply:
Continuing Operations
14
(77)
(118)
(135)
(42)
Discontinued Tulsa Operations
9
(6)
-
-
-
Non-Refining
Continuing Operations
49
75
101
125
78
Discontinued Polypropylene Operations
8
3
1
2
21
Corp. & Net Fin.
(21)
(26)
(18)
(23)
(40)
Income (Loss), Before Special Items
59
(31)
(34)
(31)
17
EPS (Diluted), Before Special Items
0.50
-0.27
-0.29
-0.27
0.14 |
 5
1Q10 Special Items, MM$ after tax
($44) –
Loss related to the divestment of the discontinued
polypropylene operations
($20) –
Provision primarily related to contract losses in
connection with excess barge capacity resulting from the
shutdown of the Eagle Point refining operations
($7) –
Primarily related to pension settlement losses
($9) –
Unfavorable adjustment to deferred state income taxes
attributable to continuing phenol chemical operations
($80) |
 6
Refining & Supply Summary* –
1Q10
1Q10 Loss from Continuing Operations of $42MM
Low utilization due to March turnarounds at Marcus Hook and Toledo
pressured margin realization and operating income due to fixed costs
Improved margin capture, in particular outside of the turnaround
periods
Delivering cost savings after closure of Eagle Point
Outlook
Market is expected to remain challenging with continued economic
weakness and additional global supply
We remain focused on the fundamentals
running our assets safely and reliably
optimizing our refining system to meet market demand
lower sustainable cost structure
improved margin capture
* Business Unit Income after tax. For reconciliation to Total Income (Loss), see
Slide 14. |
 7
Realized Refining Margin vs. Benchmark, $/B
* Excludes discontinued Tulsa refining operations.
** R&S Weighted
Benchmark. For calculation, including changes effective with this quarter, see
Slide 22. 1Q09
2Q09
3Q09
4Q09
FY09
1Q10
Refining
&
Supply
Realized Margin *
6.33
3.65
2.72
1.96
3.66
4.08
Weighted Benchmark **
5.71
6.05
4.57
3.59
4.98
5.67
Differential
0.62
(2.40)
(1.85)
(1.63)
(1.32)
(1.59)
Margin Capture Rate
111%
60%
60%
55%
73%
72%
Actual vs. Weighted Benchmark:
Crude
1.40
0.18
0.10
(0.61)
0.27
(0.92)
Product
(0.78)
(2.58)
(1.95)
(1.02)
(1.59)
(0.67)
Differential
0.62
(2.40)
(1.85)
(1.63)
(1.32)
(1.59) |
 8
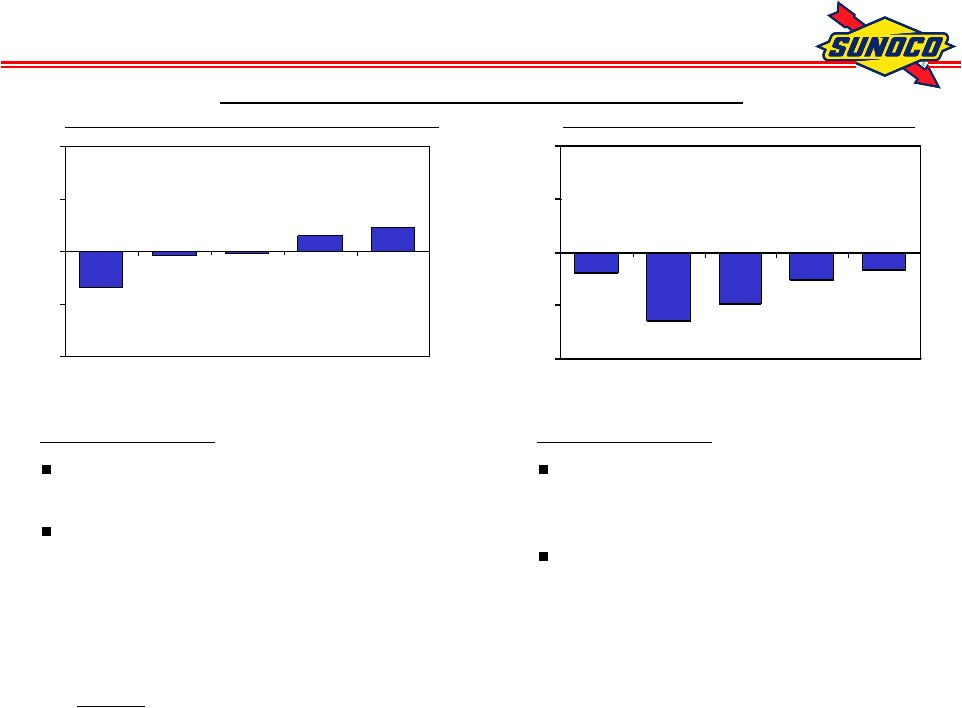
0.61
0.92
(0.10)
(0.18)
(1.40)
-4.00
-2.00
0.00
2.00
4.00
1Q09
2Q09
3Q09
4Q09
1Q10
Crude Cost vs. Weighted Benchmark
(0.67)
(1.02)
(1.95)
(2.58)
(0.78)
-4.00
-2.00
0.00
2.00
4.00
1Q09
2Q09
3Q09
4Q09
1Q10
Products vs. Weighted Benchmark
Refining Margin vs. Benchmark*, $/B
Total
Refining
&
Supply
(excluding
Tulsa)
* R&S Weighted
Benchmark. For calculation, see Slide 22.
1Q10 Comments:
Higher transportation costs vs
benchmark and 4Q09
LIFO reserve for year-to-date
inventory draw at higher quarter-end
crude prices
1Q10 Comments:
Negative due to non-benchmark
products and effects of turnaround
(ratability and yield gains)
Versus 4Q09, improved realizations
on benchmark products and
chemicals offset by impact of
turnaround, LIFO reserves & non-
benchmark products |
 9
Non-Refining Business Income* -
1Q10
Retail Marketing –
Earnings of $21MM
Margins consistent with 4Q09, still challenged due to rising
wholesale prices; seasonal drop in demand and further
affected by winter storms in Northeast
Logistics –
Earnings of $17MM
Largely contributions from Sunoco Logistics Partners L.P.
(NYSE: SXL); lower than 1Q09 related primarily to lower
income from crude marketing activities
Coke –
Earnings of $37MM
Consistent with 4Q09 earnings, excluding the $41MM one
time tax credit associated with start-up of Granite City
Maintain full year guidance of net income between $125MM
-$140MM
* Business Unit Income after tax. For reconciliation to Total Income (Loss), see
Slide 14. |
 10
SunCoke Update
Granite City Start Up
The ramp up during 1Q10 was slower than planned
Needed performance improvements have been identified and are being
implemented Impact to
income
guidance
expected
to
be
offset
by
benefits
from
higher
coal
prices
extending out further than planned and lower costs
Middletown Plant Update
Construction
began
in
early
April
2010
with
coke
production
expected
in
2
nd
half
2011
Total capital spend projected at $380MM, including capitalized interest
of approximately $25MM
Jewell Mining Expansion Planned
Expand production from Jewell mines by 500,000 tons per year (increase of
40%) Will be producing at annualized rate of 1.75MM tons by late 2012
Total capital spend estimated to be approximately $25MM through 2014
Expansion provides an opportunity for income growth
Will also be updating coal reserve study |
 11
SUN
SXL
(ex SXL)
Sunoco
Cash flow from Operations*
7
494
501
Capital Program
(27)
(132)
(159)
Free Cash Flow
(20)
362
342
Divestments
-
8
8
Dividends to Sunoco Shareholders
-
(18)
(18)
Distributions & Other
(23)
(5)
(28)
SXL Dividends to Sunoco
(24)
24
-
Net Proceeds from Sale of LP units
-
145
145
Modification of SXL IDRs
(201)
201
-
Net Cash Flow before Net Debt Activity
(268)
717
449
Net Debt Activity
268
(282)
(14)
Net Increase in Cash & Cash Equivalents
-
435
435
1Q10
1Q10 Cash Flow, MM$
* Includes $394 MM income tax refund. |
 12
Net Debt-to-Capital Ratio, %
34%
41%
16%
32%
Consolidated
Sunoco (ex-SXL)
*
Proforma.
**
Sunoco Revolver Covenant basis. For calculation, see Slide 18.
12/31/09
3/31/10
Sunoco (ex-SXL)*
32%
16%
SXL
50%
63%
Consolidated**
41%
34%
Sunoco Net Debt
1,223
498
SXL Net Debt
866
1,139
Total Net Debt
2,089
1,637 |
 13
Key Takeaways
We will maintain our focus on delivering value to
shareholders and achieving our aspiration of becoming
the preferred provider of transportation fuels in our
markets
We took early proactive steps to make us stronger, leaner
and more competitive
We remain focused on the fundamentals
Running our refineries safely, reliably & at optimal capacity
utilization Cost reduction & capital discipline
Improving margin capture
Actions to improve balance sheet and liquidity position us to
take advantage of attractive growth opportunities in Logistics,
Coke and Retail Marketing |
 Appendix |
 15
Earnings Profile, MM$ after tax
1Q09
2Q09
3Q09
4Q09
FY09
1Q10
Refining & Supply
Continuting Operations
14
(77)
(118)
(135)
(316)
(42)
Discontinued Tulsa Operations
9
(6)
-
-
3
-
Retail Marketing
6
10
49
21
86
21
Chemicals
Continuting Operations
(12)
(3)
(2)
4
(13)
3
Discontinued Polypropylene Operations
8
3
1
2
14
21
Logistics
30
26
19
22
97
17
Coke
25
42
35
78
180
37
Corporate Expenses
(11)
(15)
(6)
(6)
(38)
(23)
Net Financing Expenses & Other
(10)
(11)
(12)
(17)
(50)
(17)
Income(Loss) Before Special Items
59
(31)
(34)
(31)
(37)
17
Special Items
(47)
(24)
(278)
57
(292)
(80)
Total Income (Loss)
12
(55)
(312)
26
(329)
(63)
EPS (Diluted), Income (Loss)
Before Special Items
0.50
(0.27)
(0.29)
(0.27)
(0.32)
0.14
EPS (Diluted), Income (Loss)
0.10
(0.47)
(2.67)
0.22
(2.81)
(0.53)
|
 16
Key Indicators
1Q09
2Q09
3Q09
4Q09
FY09
1Q10
Realized Margin Indicators
Refining & Supply, $/B*
6.33
3.65
2.72
1.96
3.66
4.08
Retail Marketing, cpg
Gasoline
6.4
7.0
13.0
8.8
8.9
8.9
Distillate
24.5
12.0
11.7
7.9
14.8
8.0
Chemicals, cpp**
6.6
8.2
7.3
9.7
8.0
9.9
Market Indicators
Dated Brent Crude Oil, $/B
44.40
58.79
68.27
74.56
61.51
76.24
Natural Gas, $/DT
4.48
3.81
3.44
4.92
4.16
5.04
* Excludes discontinued Tulsa refining operations.
** Excludes discontinued polypropylene operations. |
 17
Key Volume Indicators -
Refining & Supply
* Excludes discontinued Tulsa refining operations.
1Q09
2Q09
3Q09
4Q09
FY09
1Q10
Total Refining & Supply *
Crude Throughputs, MB/D
627
644
613
617
625
533
% Capacity
76
78
74
85
78
79
Net Prod. Available for Sale, MB/D
689
720
669
682
690
591
Net Prod. Available for Sale, MMB
62
66
62
62
252
53 |
 18
Key Volume Indicators –
Non-Refining
* Excludes discontinued polypropylene operations.
1Q09
2Q09
3Q09
4Q09
FY09
1Q10
Retail Marketing
Gasoline Sales, MM gal
1,066
1,147
1,140
1,108
4,461
1,026
Middle Distillate Sales, MM gal
138
116
114
95
463
91
Total Sales, MM gal
1,204
1,263
1,254
1,203
4,924
1,117
Gasoline and Diesel Throughput
143
153
156
153
151
147
(Company-owned or leased outlets)
(M gal/Site/Month)
Merchandise Sales (M$/Store/Month)
78
92
104
91
91
88
Chemicals*
Phenol and Related Sales, MM#
407
427
483
457
1,774
449
Coke
Production, M tons:
United States
681
694
715
778
2,868
841
Brazil
280
282
321
383
1,266
413 |
 19
Financial Ratios, MM$ except ratios
*
Represents Partners’
Capital for SXL and Shareholders’
Equity for Sunoco.
**
The
Net
Debt
/
Capital
ratio
is
used
by
Sunoco
management
in
its
internal
financial
analysis
and
by
investors
and
creditors in the assessment of Sunoco’s financial position.
*** Capital excludes noncontrolling
interests.
Proforma
Proforma
SUN
SUN
SXL
(ex SXL)
Sunoco
SXL
(ex SXL)
Sunoco
Debt
868
1,596
2,464
1,141
1,306
2,447
Plus: Debt Guarantees
-
2
2
-
2
2
Less: Cash
(2)
(375)
(377)
(2)
(810)
(812)
Net Debt
866
1,223
2,089
1,139
498
1,637
Equity*
862
2,557
2,557
657
2,712
2,712
SXL Noncontrolling
Interest
-
-
488
-
-
414
Capital
1,728
3,780
5,134
1,796
3,210
4,763
Net Debt / Capital (Sunoco
Revolver Covenant Basis)**
50%
32%
41%
63%
16%
34%
Debt / Capital (GAAP Basis) ***
49%
47%
12/31/2009
3/31/2010 |
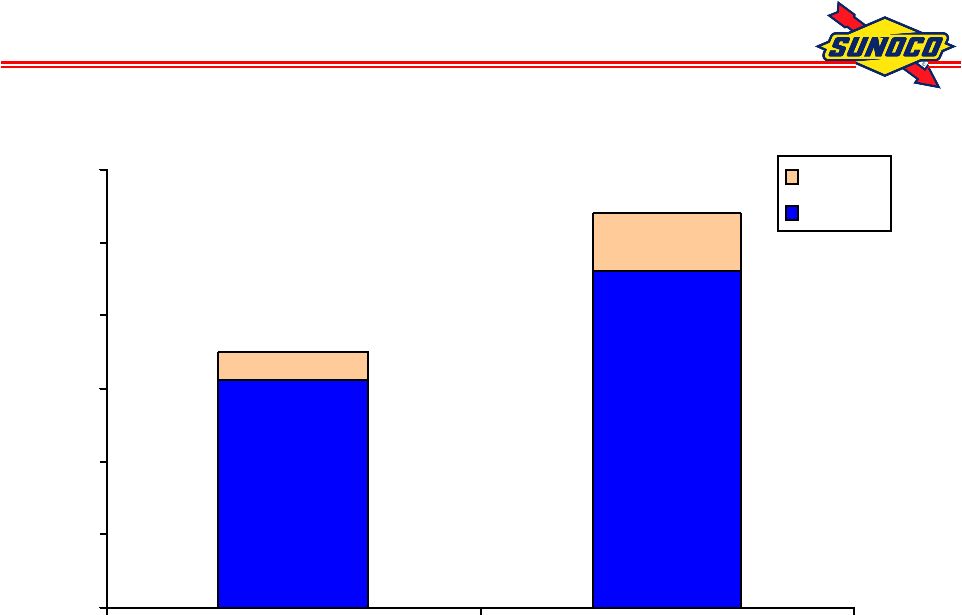 20
0.0
0.5
1.0
1.5
2.0
2.5
3.0
12/31/2009
3/31/2010
SXL
Sunoco
1.7
Liquidity*, B$
* Includes
$0.4B
and
$0.8B
at
12/31/09
and
3/31/10
of
cash
and
cash
equivalents.
2.7 |
 21
Refining & Supply –
Products Manufactured
* Excludes discontinued Tulsa refining operations.
1Q09
2Q09
3Q09
4Q09
FY09
1Q10
Total Refining & Supply *
Net Production, MB/D
689.1
720.2
669.2
681.7
689.9
590.5
Gasoline
51%
51%
52%
53%
52%
52%
Middle Distillates
34%
32%
33%
32%
32%
34%
Residual Fuel
9%
9%
9%
8%
9%
6%
Petrochemicals
3%
4%
4%
4%
4%
4%
Other
8%
9%
7%
8%
8%
9%
Less Refinery Fuel
-5%
-5%
-5%
-5%
-5%
-5% |
 22
Refining & Supply -
Gasoline and Distillate Production
1Q09
2Q09
3Q09
4Q09
FY09
1Q10
Total Refining & Supply *
Gasoline Production, MB/D
350.0
370.3
346.0
365.5
357.9
306.3
RFG
46%
46%
55%
45%
48%
47%
Conventional
54%
54%
45%
55%
52%
53%
Distillate Production, MB/D
233.4
229.5
219.3
219.3
225.3
202.4
On-Road Diesel Fuel
47%
53%
56%
52%
52%
53%
Heating Oil / Off-Road Diesel
30%
22%
23%
25%
25%
28%
Jet Fuel
20%
23%
19%
21%
21%
17%
Kerosene/Other
3%
2%
2%
2%
2%
2%
* Excludes discontinued Tulsa refining operations. |
 23
Sunoco Refining Weighted Benchmark Margin, $/B
Toledo
4-3-1
Benchmark
4 WTI Crude: NYMEX Futures Close + $2.00 for transportation*
3 Unleaded Gasoline: Chicago Pipeline Platt’s Low
1 Distillate: 50% ULSD Chicago Pipeline Platt’s Low
50% Jet Gulf Coast Pipe Platt’s Low**
Northeast
6-3-2-1
Value-Added
Benchmark
6 Dated Brent Crude: Platt’s Mid + $2.25 for transportation*
3 Gasoline: 50% Unleaded RBOB NY Harbor Barge Platt's Low
50% Unleaded Regular Gasoline NY Harbor Barge Platt's Low
2 Distillate: 55% ULSD/LSD NY Harbor Barge Platt's Low
20% Jet/Kero NY Harbor Barge Platt's Low
25% No.2 Fuel Oil NY Harbor Barge Platt's Low
1 No. 6 0.3% Sulfur High Pour Resid: NY Harbor Barge Platt’s Low
1Q09
2Q09
3Q09
4Q09
FY09
1Q10
Northeast 6-3-2-1
Value-Added Benchmark
5.32
5.23
4.10
3.85
4.62
6.09
Toledo 4-3-1
Benchmark
7.28
9.36
6.41
2.56
6.40
3.99
Note: The weighted benchmark has been updated for two items to be more reflective of
market and operations: *The crude transportation cost within the weighted
benchmark is now $2.20/B, $1/B higher than the previous benchmark calculated from a new
Northeast crude transportation benchmark of $2.25/B and a new Toledo crude
transportation benchmark of $2/B. All periods have been
restated for this new crude transportation cost benchmark.
**The
Toledo
benchmark
was
also
updated
effective
1/1/2010
to
include
the
US
Gulf
Coast
Jet
Platts
Low
marker
as
50%
of
the
distillate
benchmark, with
ULSD
Chicago
Platts
Low
comprising
the
other
50%.
The
distillate
benchmark
previously
was
comprised
of
100%
ULSD
Chicago Platts
Low. Prior to 2010, the benchmarks were not restated for this change due to
immateriality. 1Q09
2Q09
3Q09
4Q09
FY09
1Q10
Northeast 6-3-2-1
at 80% weight
4.26
4.18
3.28
3.08
3.70
4.87
Toledo 4-3-1
at 20% weight
1.45
1.87
1.29
0.51
1.28
0.80
R&S Weighted Benchmark
5.71
6.05
4.57
3.59
4.98
5.67 |
 24
For More Information
Media releases and SEC filings are available
on
our
website
at
www.SunocoInc.com
Contact for more information:
Clare McGrory
(215) 977-6764 |