Attached files
| file | filename |
|---|---|
| 8-K - 8-K - VIST FINANCIAL CORP | a10-8715_28k.htm |
Exhibit 99.1
|
|
Alfred J. Weber Chairman of the Board Robert D. Davis President and Chief Executive Officer Edward C. Barrett Executive Vice President, Chief Financial Officer VIST Financial Corp. Annual Shareholder Meeting April 27, 2010 |
|
|
ALFRED J. WEBER Chairman of the Board 2 |
|
|
ROBERT D. DAVIS President & Chief Executive Officer 3 |
|
|
This presentation may contain forward-looking statements regarding VIST’s strategies, plans and objectives and estimates of future operating results or financial condition. These statements and estimates involve significant risks and uncertainties that may cause actual results to differ materially from the results described. Factors that might cause such a difference include, but are not limited to: the effects of changing economic conditions in our market area and nationally, credit risks related to our lending activities, significant changes in interest rates, changes in federal and state laws and regulations applicable to our businesses, funding costs, and other external developments which could materially affect our business and operations. Securities offered through, and Investment Consultants registered with, UVEST Financial Services, a registered independent broker/dealer, Member FINRA/SIPC Securities are not bank products, are not insured by the FDIC or any other government agency, and involve risk including possible loss of principal. Insurance services offered through VIST Insurance, a subsidiary of VIST Financial Corp. 4 |
|
|
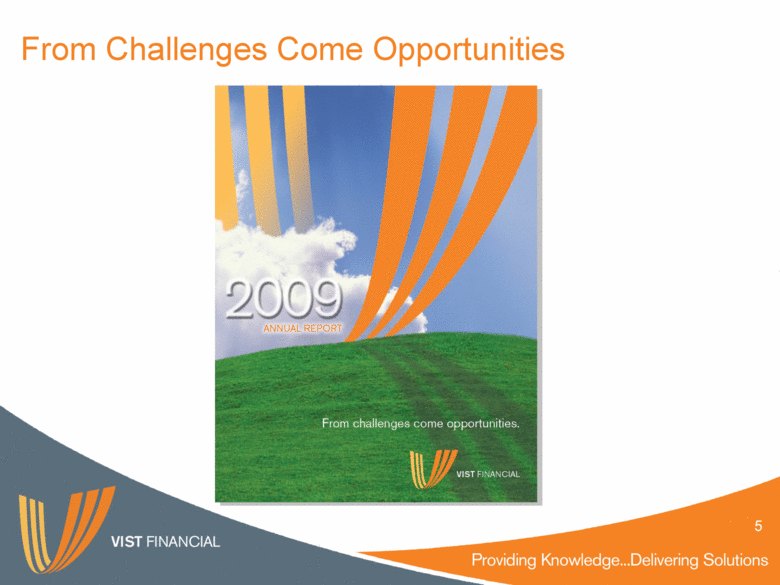
From Challenges Come Opportunities 5 |
|
|
The VIST Value Proposition “VIST Financial delivers Trusted Financial Advisors focused on meeting your banking, insurance and investment needs.” 6 |
|
|
Our Mission The mission of VIST Financial Corp. is to meet the interdependent financial needs and interests of customers, employees, communities and shareholders. We will accomplish this mission through the delivery of banking, insurance, investment and related financial services with an intense focus on developing deep and broad, long-term customer relationships. 7 |
|
|
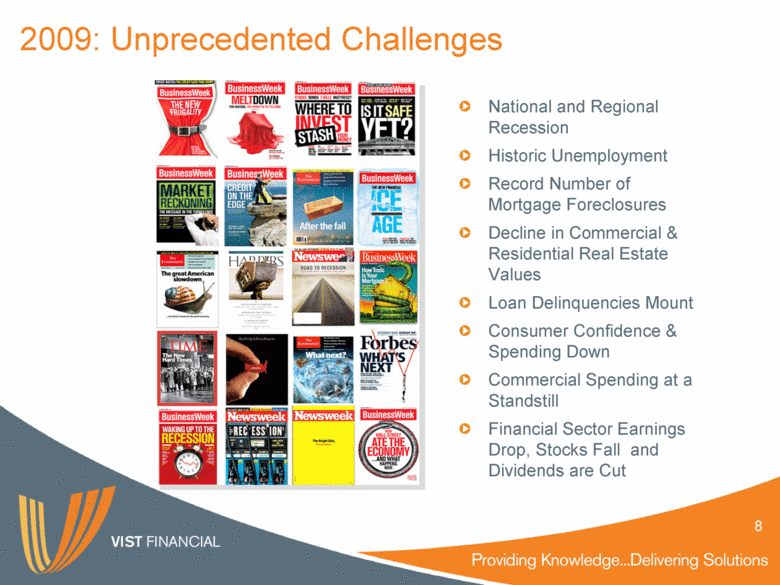
2009: Unprecedented Challenges National and Regional Recession Historic Unemployment Record Number of Mortgage Foreclosures Decline in Commercial & Residential Real Estate Values Loan Delinquencies Mount Consumer Confidence & Spending Down Commercial Spending at a Standstill Financial Sector Earnings Drop, Stocks Fall and Dividends are Cut 8 |
|
|
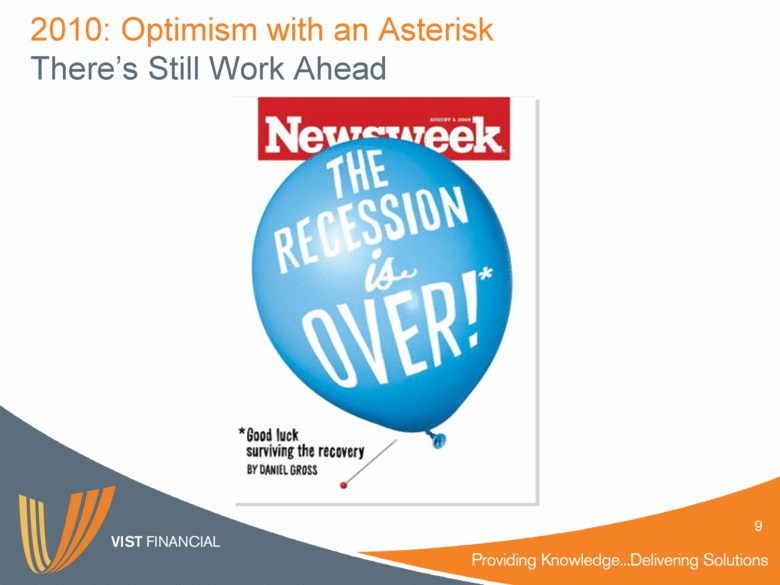
2010: Optimism with an Asterisk There’s Still Work Ahead 9 |
|
|
Regional Economy/Depth & Duration of Recession Asset Quality is Job One Investment Portfolio - OTTI Historical Earnings Performance Net Interest Margin (COF Driven) High Net Operating Expenses Regulatory/Capital Cost SEC and FASB Valuation Acquisition Potency Navigating Remaining Challenges 10 |
|
|
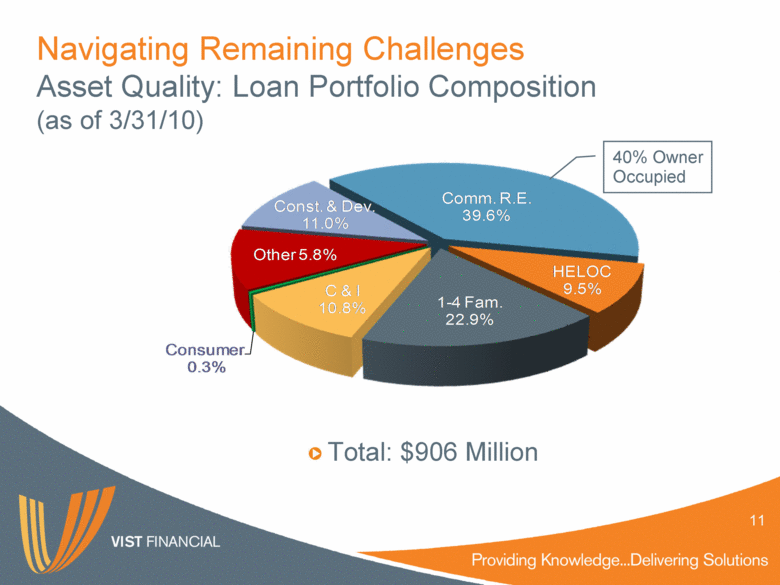
Navigating Remaining Challenges Asset Quality: Loan Portfolio Composition (as of 3/31/10) Total: $906 Million 11 40% Owner Occupied Comm. R.E. 39.6% HELOC 9.5% 1 - 4 Fam. 22.9% C & I 10.8% Consumer 0.3% Other 5.8% Const. & Dev. 11.0% |
|
|
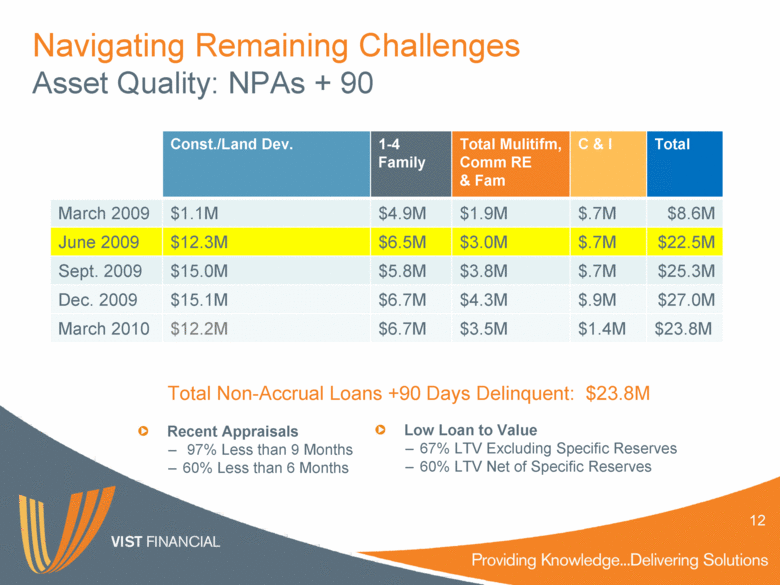
Navigating Remaining Challenges Asset Quality: NPAs + 90 Const./Land Dev. 1-4 Family Total Mulitifm, Comm RE & Fam C & I Total March 2009 $1.1M $4.9M $1.9M $.7M $8.6M June 2009 $12.3M $6.5M $3.0M $.7M $22.5M Sept. 2009 $15.0M $5.8M $3.8M $.7M $25.3M Dec. 2009 $15.1M $6.7M $4.3M $.9M $27.0M March 2010 $12.2M $6.7M $3.5M $1.4M $23.8M Recent Appraisals 97% Less than 9 Months 60% Less than 6 Months Total Non-Accrual Loans +90 Days Delinquent: $23.8M Low Loan to Value 67% LTV Excluding Specific Reserves 60% LTV Net of Specific Reserves 12 |
|
|
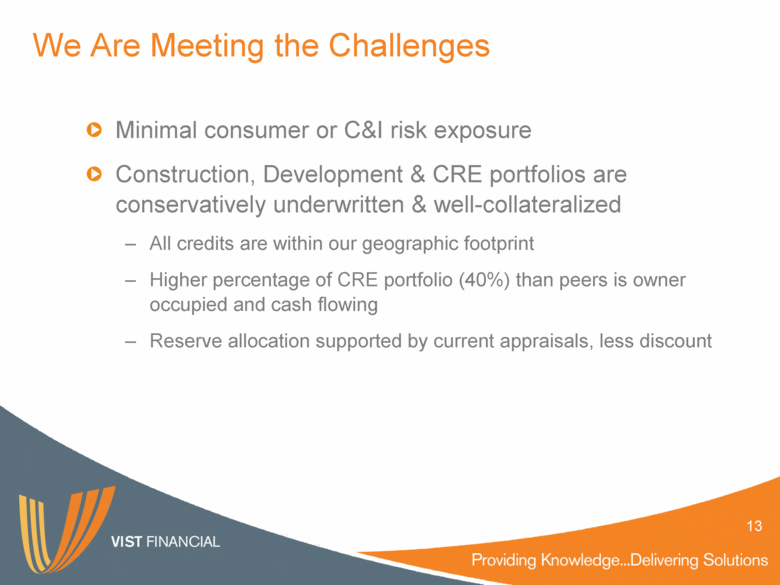
Minimal consumer or C&I risk exposure Construction, Development & CRE portfolios are conservatively underwritten & well-collateralized All credits are within our geographic footprint Higher percentage of CRE portfolio (40%) than peers is owner occupied and cash flowing Reserve allocation supported by current appraisals, less discount We Are Meeting the Challenges 13 |
|
|
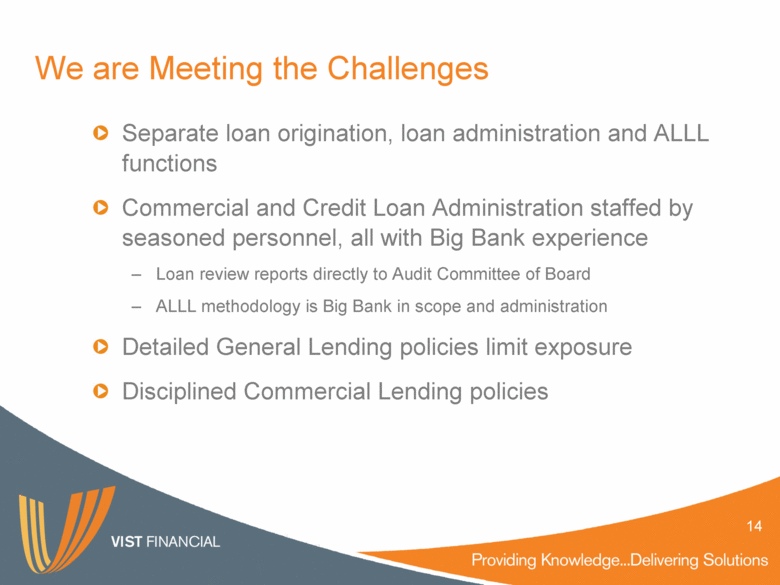
Separate loan origination, loan administration and ALLL functions Commercial and Credit Loan Administration staffed by seasoned personnel, all with Big Bank experience Loan review reports directly to Audit Committee of Board ALLL methodology is Big Bank in scope and administration Detailed General Lending policies limit exposure Disciplined Commercial Lending policies We are Meeting the Challenges 14 |
|
|
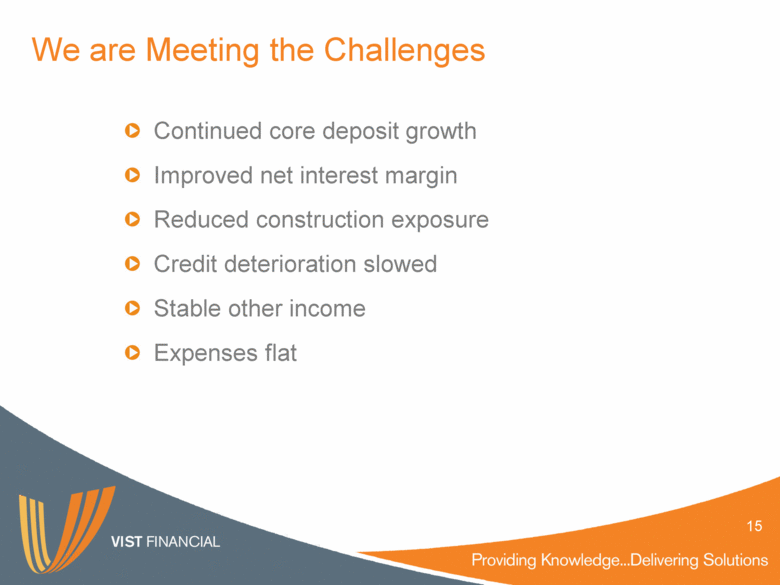
We are Meeting the Challenges Continued core deposit growth Improved net interest margin Reduced construction exposure Credit deterioration slowed Stable other income Expenses flat 15 |
|
|
Financial Performance Edward C. Barrett Executive Vice President, Chief Financial Officer 16 |
|
|
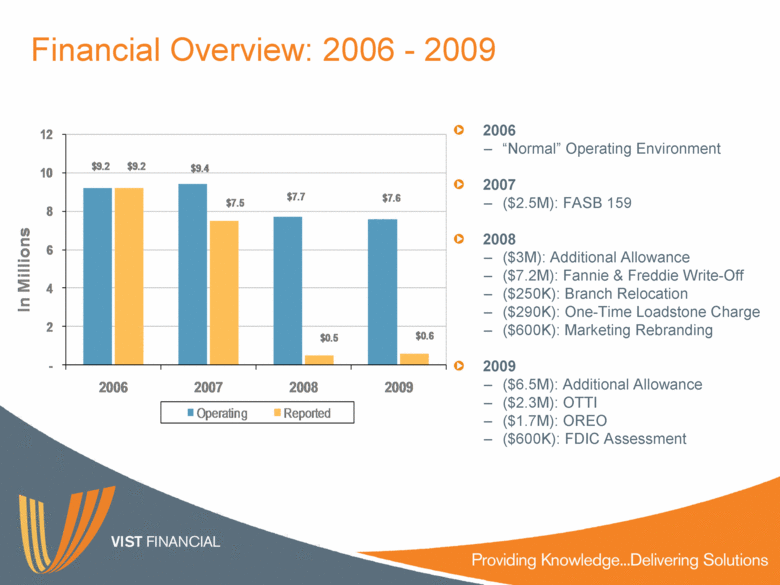
Financial Overview: 2006 - 2009 2006 “Normal” Operating Environment 2007 ($2.5M): FASB 159 2008 ($3M): Additional Allowance ($7.2M): Fannie & Freddie Write-Off ($250K): Branch Relocation ($290K): One-Time Loadstone Charge ($600K): Marketing Rebranding 2009 ($6.5M): Additional Allowance ($2.3M): OTTI ($1.7M): OREO ($600K): FDIC Assessment $9.2 $9.4 $7.7 $7.6 $9.2 $7.5 $0.5 $0.6 - 2 4 6 8 10 12 2006 2007 2008 2009 In Millions Operating Reported |
|
|
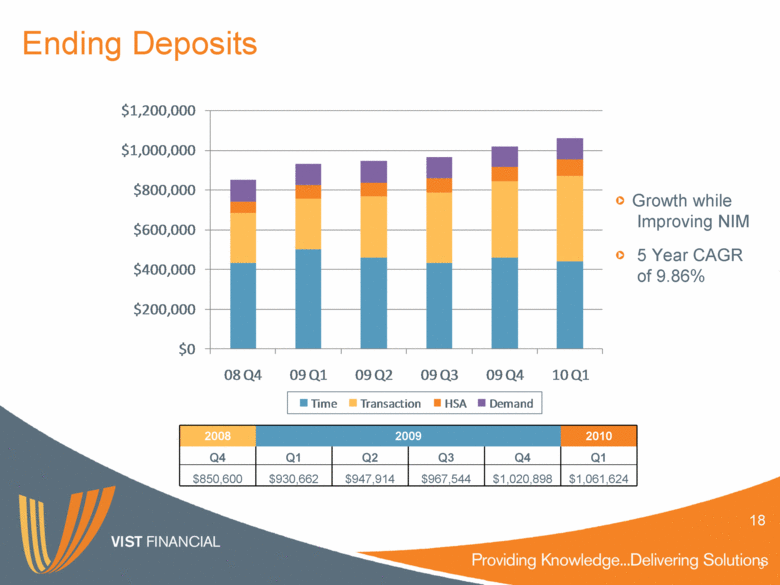
Ending Deposits 3 2008 2009 2010 Q4 Q1 Q2 Q3 Q4 Q1 $850,600 $930,662 $947,914 $967,544 $1,020,898 $1,061,624 Growth while Improving NIM 5 Year CAGR of 9.86% 18 $0 $200,000 $400,000 $600,000 $800,000 $1,000,000 $1,200,000 08 Q4 09 Q1 09 Q2 09 Q3 09 Q4 10 Q1 Time Transaction HSA Demand |
|
|
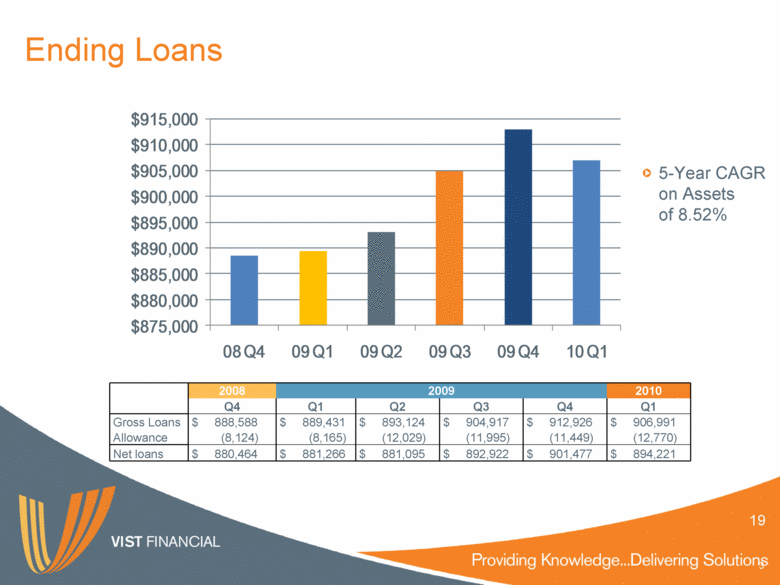
2008 2009 2010 Q4 Q1 Q2 Q3 Q4 Q1 Gross Loans $ 888,588 $ 889,431 $ 893,124 $ 904,917 $ 912,926 $ 906,991 Allowance (8,124) (8,165) (12,029) (11,995) (11,449) (12,770) Net loans $ 880,464 $ 881,266 $ 881,095 $ 892,922 $ 901,477 $ 894,221 Ending Loans 5-Year CAGR on Assets of 8.52% 19 $875,000 $880,000 $885,000 $890,000 $895,000 $900,000 $905,000 $910,000 $915,000 08 Q4 09 Q1 09 Q2 09 Q3 09 Q4 10 Q1 |
|
|
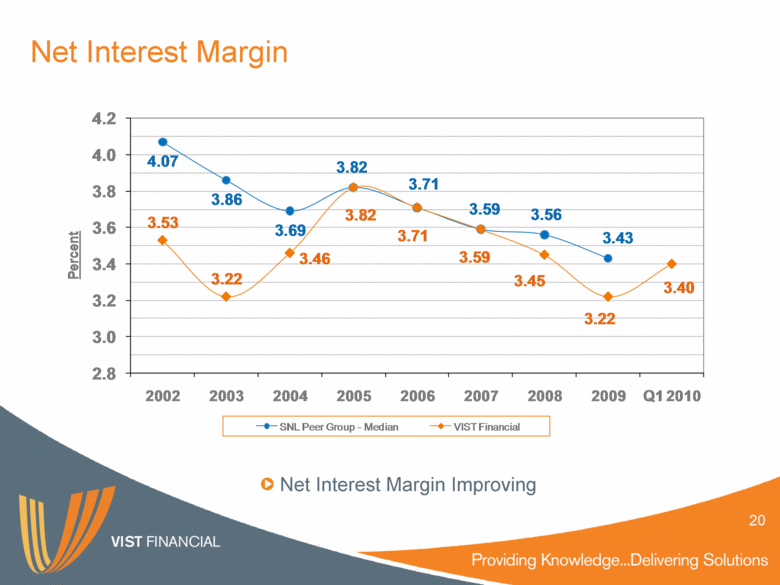
Net Interest Margin Net Interest Margin Improving 20 4.07 3.86 3.69 3.82 3.71 3.59 3.56 3.43 3.53 3.22 3.46 3.82 3.71 3.59 3.45 3.22 3.40 2.8 3.0 3.2 3.4 3.6 3.8 4.0 4.2 2002 2003 2004 2005 2006 2007 2008 2009 Q12010 Percent SNL Peer Group - Median VIST Financial |
|
|
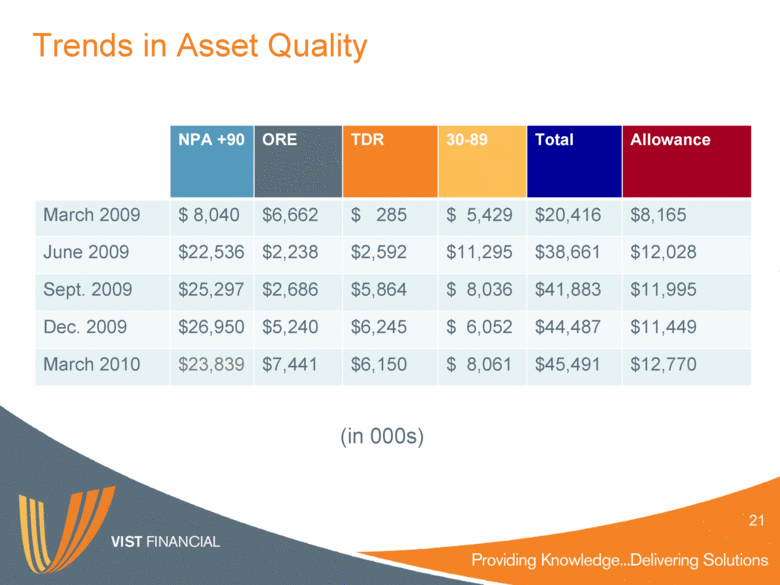
Trends in Asset Quality NPA +90 ORE TDR 30-89 Total Allowance March 2009 $ 8,040 $6,662 $ 285 $ 5,429 $20,416 $8,165 June 2009 $22,536 $2,238 $2,592 $11,295 $38,661 $12,028 Sept. 2009 $25,297 $2,686 $5,864 $ 8,036 $41,883 $11,995 Dec. 2009 $26,950 $5,240 $6,245 $ 6,052 $44,487 $11,449 March 2010 $23,839 $7,441 $6,150 $ 8,061 $45,491 $12,770 (in 000s) 21 |
|
|
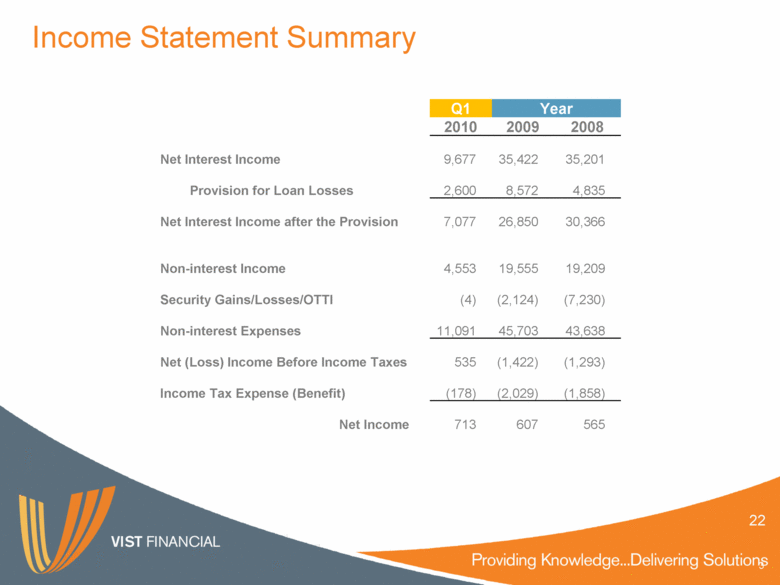
Income Statement Summary Q1 Year 2010 2009 2008 Net Interest Income 9,677 35,422 35,201 Provision for Loan Losses 2,600 8,572 4,835 Net Interest Income after the Provision 7,077 26,850 30,366 Non-interest Income 4,553 19,555 19,209 Security Gains/Losses/OTTI (4) (2,124) (7,230) Non-interest Expenses 11,091 45,703 43,638 Net (Loss) Income Before Income Taxes 535 (1,422) (1,293) Income Tax Expense (Benefit) (178) (2,029) (1,858) Net Income 713 607 565 22 |
|
|
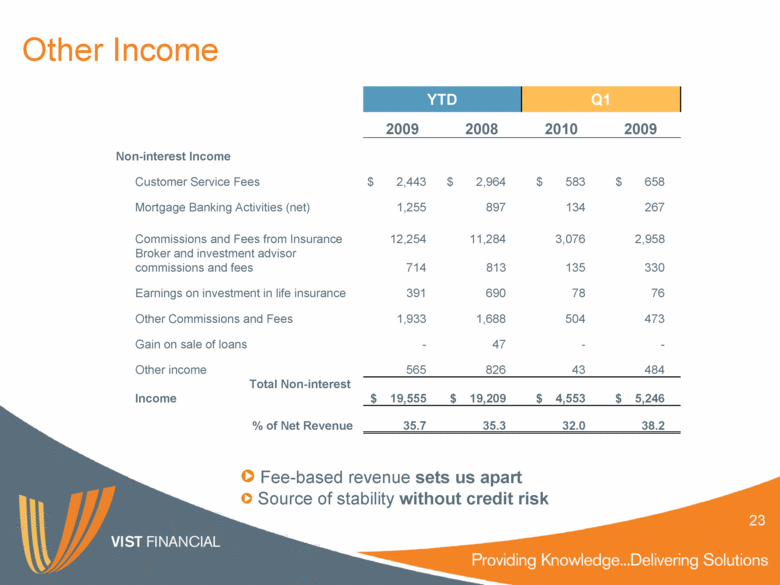
Other Income YTD Q1 2009 2008 2010 2009 Non-interest Income Customer Service Fees $ 2,443 $ 2,964 $ 583 $ 658 Mortgage Banking Activities (net) 1,255 897 134 267 Commissions and Fees from Insurance 12,254 11,284 3,076 2,958 Broker and investment advisor commissions and fees 714 813 135 330 Earnings on investment in life insurance 391 690 78 76 Other Commissions and Fees 1,933 1,688 504 473 Gain on sale of loans - 47 - - Other income 565 826 43 484 Total Non-interest Income $ 19,555 $ 19,209 $ 4,553 $ 5,246 % of Net Revenue 35.7 35.3 32.0 38.2 Fee-based revenue sets us apart Source of stability without credit risk 23 |
|
|
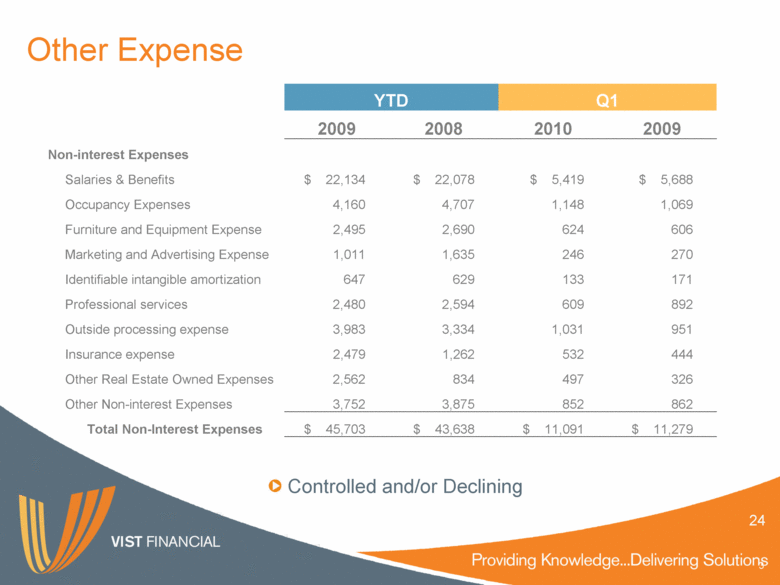
Other Expense YTD Q1 2009 2008 2010 2009 Non-interest Expenses Salaries & Benefits $ 22,134 $ 22,078 $ 5,419 $ 5,688 Occupancy Expenses 4,160 4,707 1,148 1,069 Furniture and Equipment Expense 2,495 2,690 624 606 Marketing and Advertising Expense 1,011 1,635 246 270 Identifiable intangible amortization 647 629 133 171 Professional services 2,480 2,594 609 892 Outside processing expense 3,983 3,334 1,031 951 Insurance expense 2,479 1,262 532 444 Other Real Estate Owned Expenses 2,562 834 497 326 Other Non-interest Expenses 3,752 3,875 852 862 Total Non-Interest Expenses $ 45,703 $ 43,638 $ 11,091 $ 11,279 Controlled and/or Declining 24 |
|
|
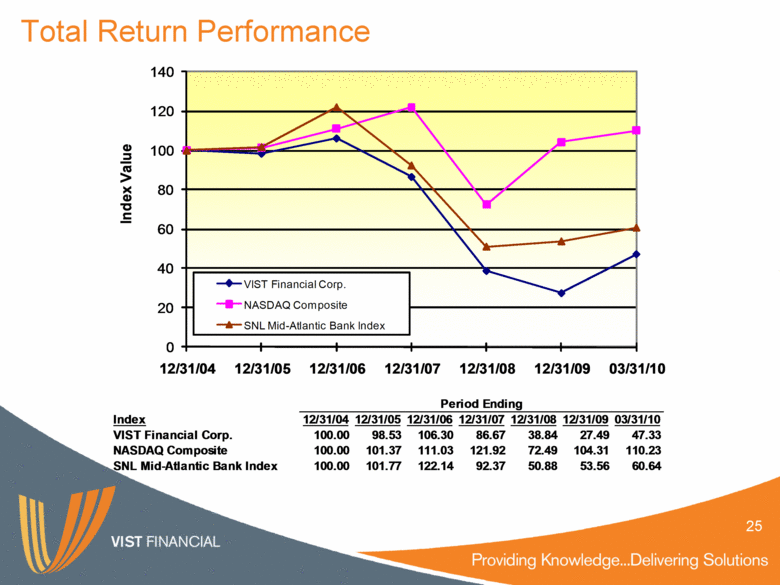
Total Return Performance 25 Period Ending Index 12/31/04 12/31/05 12/31/06 12/31/07 12/31/08 12/31/09 03/31/10 VIST Financial Corp. 100.00 98.53 106.30 86.67 38.84 27.49 47.33 NASDAQ Composite 100.00 101.37 111.03 121.92 72.49 104.31 110.23 SNL Mid-Atlantic Bank Index 100.00 101.77 122.14 92.37 50.88 53.56 60.64 0 20 40 60 80 100 120 140 12 / 31 / 04 12 / 31 / 05 12 / 31 / 06 12 / 31 / 07 12 / 31 / 08 12 / 31 / 09 03 / 31 / 10 Index Value VIST Financial Corp. NASDAQ Composite SNL Mid - Atlantic Bank Index |
|
|
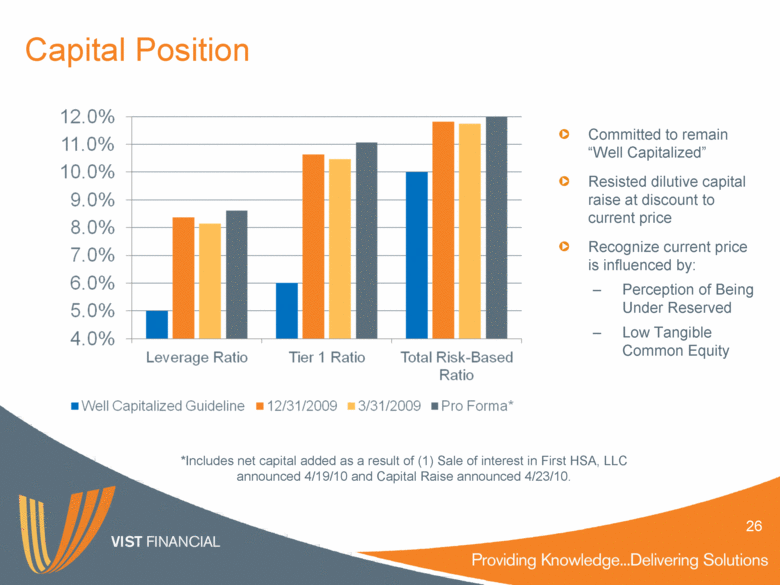
Capital Position Committed to remain “Well Capitalized” Resisted dilutive capital raise at discount to current price Recognize current price is influenced by: Perception of Being Under Reserved Low Tangible Common Equity 26 *Includes net capital added as a result of (1) Sale of interest in First HSA, LLC announced 4/19/10 and Capital Raise announced 4/23/10. |
|
|
ROBERT D. DAVIS President & Chief Executive Officer 27 |
|
|
From Challenges Come Opportunities 28 |
|
|
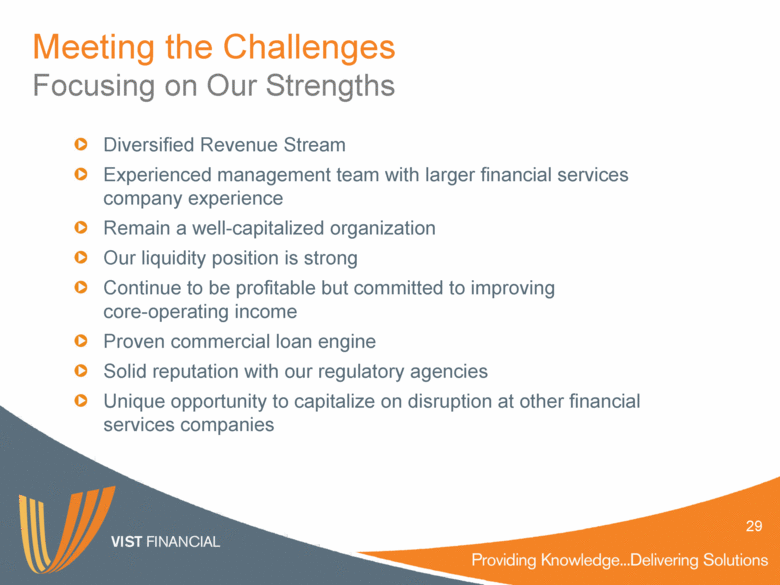
Diversified Revenue Stream Experienced management team with larger financial services company experience Remain a well-capitalized organization Our liquidity position is strong Continue to be profitable but committed to improving core-operating income Proven commercial loan engine Solid reputation with our regulatory agencies Unique opportunity to capitalize on disruption at other financial services companies Meeting the Challenges Focusing on Our Strengths 29 |
|
|
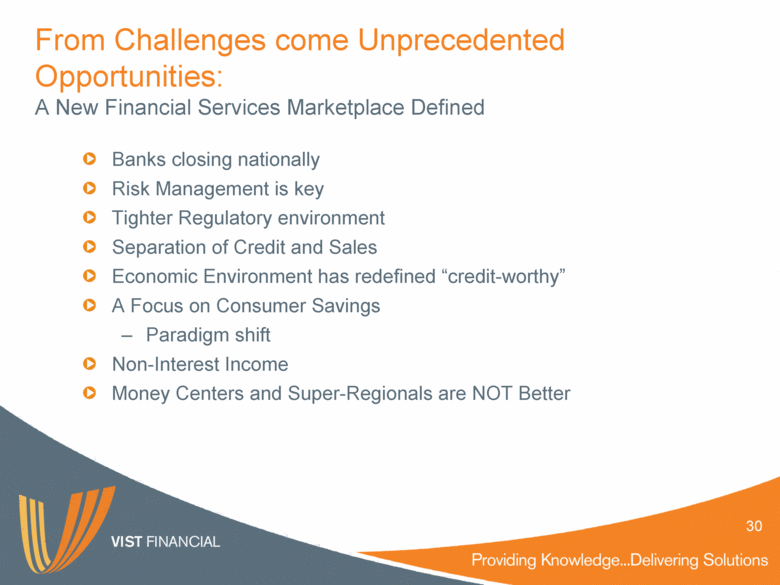
Banks closing nationally Risk Management is key Tighter Regulatory environment Separation of Credit and Sales Economic Environment has redefined “credit-worthy” A Focus on Consumer Savings Paradigm shift Non-Interest Income Money Centers and Super-Regionals are NOT Better From Challenges come Unprecedented Opportunities: A New Financial Services Marketplace Defined 30 |
|
|
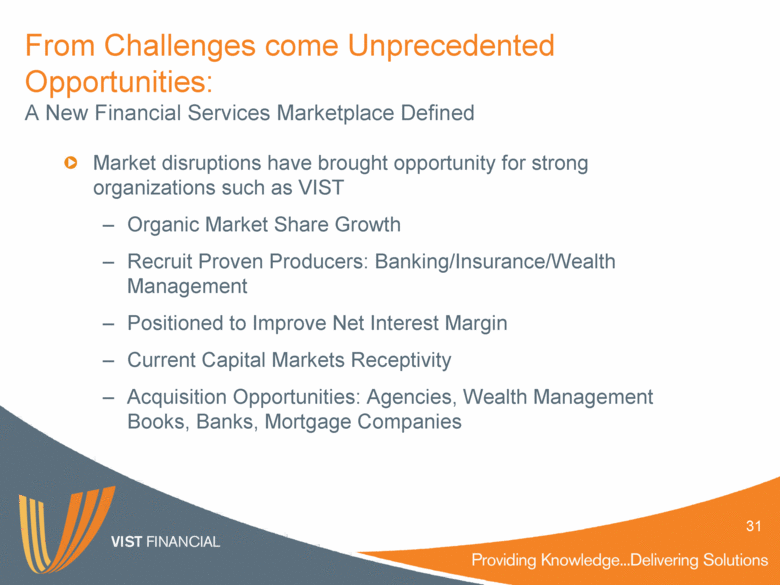
Market disruptions have brought opportunity for strong organizations such as VIST Organic Market Share Growth Recruit Proven Producers: Banking/Insurance/Wealth Management Positioned to Improve Net Interest Margin Current Capital Markets Receptivity Acquisition Opportunities: Agencies, Wealth Management Books, Banks, Mortgage Companies From Challenges come Unprecedented Opportunities: A New Financial Services Marketplace Defined 31 |
|
|
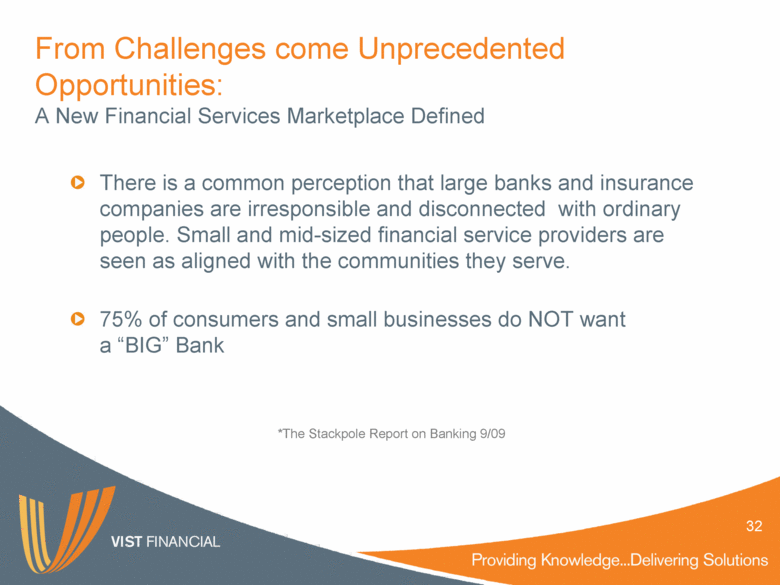
There is a common perception that large banks and insurance companies are irresponsible and disconnected with ordinary people. Small and mid-sized financial service providers are seen as aligned with the communities they serve. 75% of consumers and small businesses do NOT want a “BIG” Bank *The Stackpole Report on Banking 9/09 From Challenges come Unprecedented Opportunities: A New Financial Services Marketplace Defined 32 |
|
|
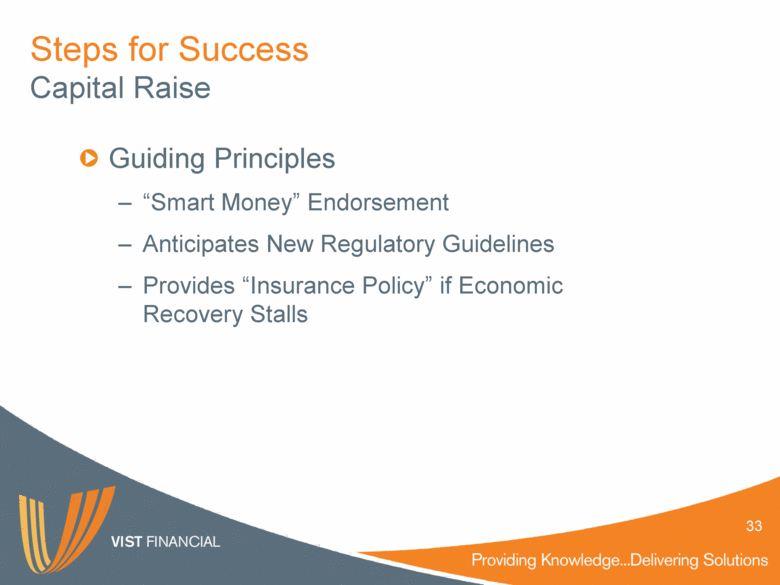
Steps for Success Capital Raise Guiding Principles “Smart Money” Endorsement Anticipates New Regulatory Guidelines Provides “Insurance Policy” if Economic Recovery Stalls 33 |
|
|
$2 Billion to $3 Billion in assets through organic growth and acquisition Fee-Based business growth strategy will make us more attractive to investors The Future is Bright Our Vision Hasn’t Changed 34 |
|
|
ALFRED J. WEBER Chairman of the Board 35 |
|
|
Questions and Answers. 36 |
|
|
Thank You for Your Confidence, Business and Attendance. 37 |

