Attached files
| file | filename |
|---|---|
| 8-K - FORM 8-K - SYNOVUS FINANCIAL CORP | g23084e8vk.htm |
Exhibit 99.1

| Emergining Stronger Monday, April 26, 2010 |
| Forward-Looking Statements This slide presentation and certain of our other 3lings with the Securities and Exchange Commission contain statements that constitute “forward-looking statements” within the meaning of the Securities Act of 1933 and the Securities Exchange Act of 1934 as amended by the Private Securities Litigation Reform Act of 1995. These forward-looking statements include, among others, our statements regarding (1) our pro forma capital position and ratios following the execution of our capital plan, (2) the assumptions used in our capital analysis, (3) the hypothetical year-end 2011 capital position under illustrative loss scenarios, (4) our expectations on asset dispositions during the 3rst half of 2010, (5) our potential earnings power following the execution of our capital plan, (6) our assumptions for building our pre-tax, pre-credit costs income and illustrative earnings, (7) the expected bene3ts of our charter consolidation, (8) our 2010 outlook on NPL in3ows and provision expense, expense management and an opportunity to return to pro3tability at some point during 2010 and (9) the assumptions underlying our expectations. Prospective investors are cautioned that any such forward-looking statements are not guarantees of future performance and involve risks and uncertainties, and that actual results may di3er materially from those contemplated by such forward-looking statements. A number of important factors could cause actual results to di3er materially from those contemplated by the forward-looking statements in this slide presentation and our 3lings with the Securities and Exchange Commission. Many of these factors are beyond Synovus’ ability to control or predict. Factors that could cause actual results to di3er materially from those contemplated in this slide presentation and our 3lings with the Securities and Exchange Commission include the other factors set forth in Synovus’ 3lings with the Securities and Exchange Commission, including its Annual Report on Form 10-K/A, quarterly reports on Form 10-Q and current reports on Form 8-K. We believe these forward-looking statements are reasonable; however, undue reliance should not be placed on any forward-looking statements, which are based on current expectations. We do not assume any obligation to update any forward-looking statements as a result of new information, future developments or otherwise. Monday, April 26, 2010 2 |
| Use of Non-GAAP Financial Measures This slide presentation contains certain non-GAAP 3nancial measures determined by methods other than in accordance with generally accepted accounting principles. Such non-GAAP 3nancial measures include the following: pre-tax, pre-credit costs income; core expense levels; fundamental G&A expenses; core deposits; net interest margin excluding negative impact of non-performing assets; fundamental non-interest expense; the ratio of pre-tax, pre-credit costs income to risk weighted assets, and the tangible common equity to tangible assets ratio. The most comparable GAAP measures to these measures are loss from continuing operations before income taxes; total G&A expenses; total non-interest expense; total deposits; net interest margin; total non-interest expense; and the ratio of total equity to total assets, respectively. Management uses these non-GAAP 3nancial measures to assess the performance of Synovus’ core business and the strength of its capital position. Synovus believes that these non-GAAP 3nancial measures provide meaningful additional information about Synovus to assist investors in evaluating Synovus’ operating results, 3nancial strength and capitalization. The non-GAAP measures should be considered as additional views of the way our 3nancial measures are a3ected by signi3cant charges for credit costs and other factors. The tangible common equity ratio to tangible assets ratio and tangible common equity to risk-weighted assets ratio are used by management to assess the strength of our capital position. Core deposits are a measure used by management and investment analysts to evaluate organic growth of deposits and the quality of deposits as a funding source. Pre-tax, pre-credit costs income is a measure used by management to evaluate core operating results exclusive of credit costs as well as certain non-core expenses such as goodwill impairment charges, restructuring charges, and Visa litigation expense (recovery). Fundamental non-interest expense is a measure utilized by management to measure the success of expense management initiatives focused on reducing recurring controllable operating costs. These non-GAAP 3nancial measures should not be considered as a substitute for operating results determined in accordance with GAAP and may not be comparable to other similarly titled measures of other companies. The computations of the non-GAAP 3nancial measures used in this slide presentation are set forth in the Appendix to this slide presentation. Monday, April 26, 2010 3 |
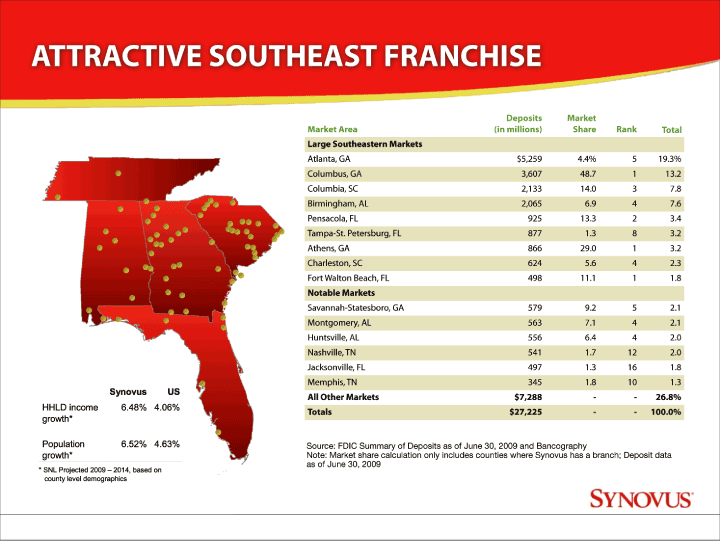
| ATTRACTIVE SOUTHEAST FRANCHISE Deposits Market Market Area (in millions) Share Rank Total Large Southeastern Markets Atlanta, GA $5,259 4.4% 5 19.3% Columbus, GA 3,607 48.7 1 13.2 Columbia, SC 2,133 14.0 3 7.8 Birmingham, AL 2,065 6.9 4 7.6 Pensacola, FL 925 13.3 2 3.4 Tampa-St. Petersburg, FL 877 1.3 8 3.2 Athens, GA 866 29.0 1 3.2 Charleston, SC 624 5.6 4 2.3 Fort Walton Beach, FL 498 11.1 1 1.8 Notable Markets Savannah-Statesboro, GA 579 9.2 5 2.1 Montgomery, AL 563 7.1 4 2.1 Huntsville, AL 556 6.4 4 2.0 Nashville, TN 541 1.7 12 2.0 Jacksonville, FL 497 1.3 16 1.8 Memphis, TN 345 1.8 10 1.3 All Other Markets $7,288 — - 26.8% Totals $27,225 — - 100.0% Source: FDIC Summary of Deposits as of June 30, 2009 and Bancography Note: Market share calculation only includes counties where Synovus has a branch; Deposit data as of June 30, 2009 Monday, April 26, 2010 7 |
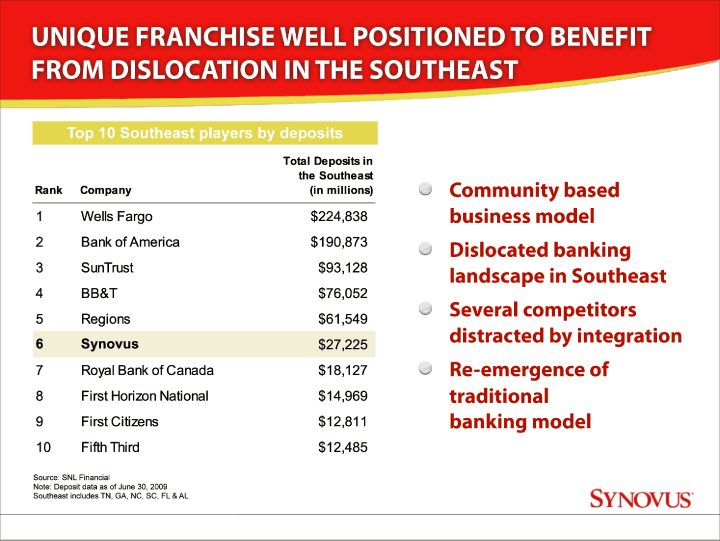
| UNIQUE FRANCHISE WELL POSITIONED TO BENEFIT FROM DISLOCATION IN THE SOUTHEAST Top 10 Southeast players by deposits Community based business model Dislocated banking landscape in Southeast Several competitors distracted by integration Re-emergence of traditional banking3model Source: SNL Financial Note: Deposit data as of June 30, 2009 Southeast includes TN, GA, NC, SC, FL & AL Monday, April 26, 2010 8 |

| Capital Plan Monday, April 26, 2010 9 |
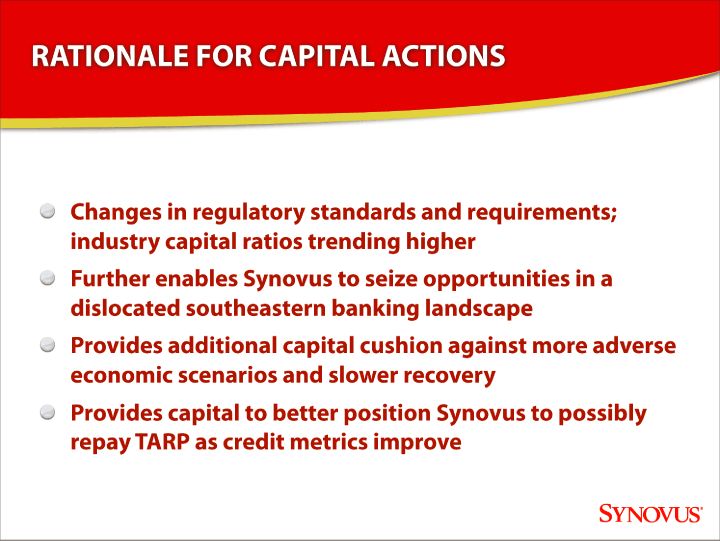
| RATIONALE FOR CAPITAL ACTIONS Changes in regulatory standards and requirements; industry capital ratios trending higher Further enables Synovus to seize opportunities in a dislocated southeastern banking landscape Provides additional capital cushion against more adverse economic scenarios and slower recovery Provides capital to better position Synovus to possibly repay TARP as credit metrics improve Monday, April 26, 2010 12 |
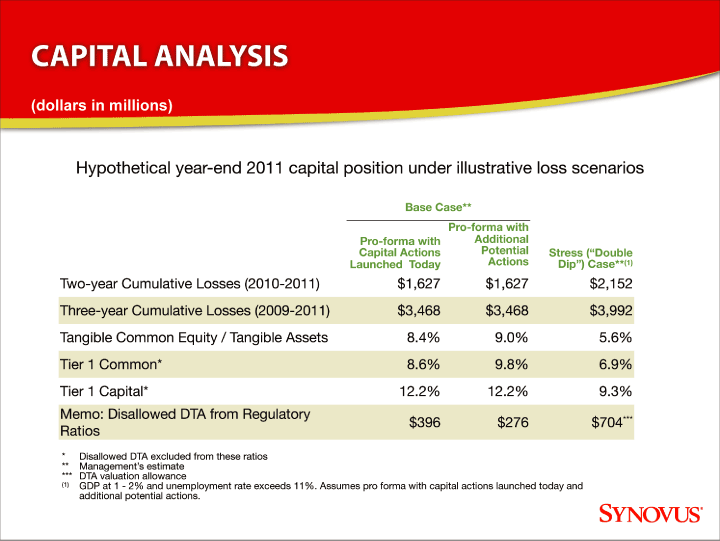
| CAPITAL ANALYSIS (dollars in millions) Hypothetical year-end 2011 capital position under illustrative loss scenarios Base Case** Pro-forma with Pro-forma with Additional Capital Actions Potential Stress (“Double Launched Today Actions Dip”) Case**(1) |
| Two-year Cumulative Losses (2010-2011) $1,627 $1,627 $2,152 Three-year Cumulative Losses (2009-2011) $3,468 $3,468 $3,992 Tangible Common Equity / Tangible Assets 8.4% 9.0% 5.6% Tier 1 Common* 8.6% 9.8% 6.9% Tier 1 Capital* 12.2% 12.2% 9.3% Memo: Disallowed DTA from Regulatory $396 $276 $704*** Ratios |
| * Disallowed DTA excluded from these ratios ** Management’s estimate *** DTA valuation allowance (1) GDP at 1 — 2% and unemployment rate exceeds 11%. Assumes pro forma with capital actions launched today and additional potential actions. 13 Monday, April 26, 2010 13 |

| Credit Update Monday, April 26, 2010 14 |
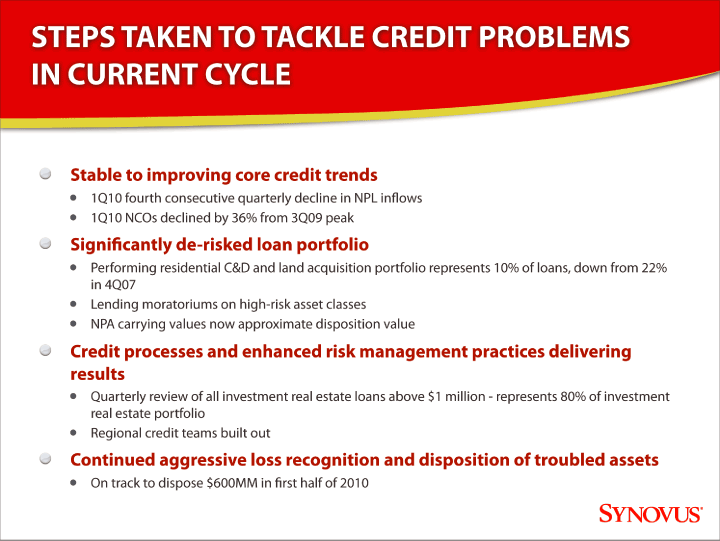
| STEPS TAKEN TO TACKLE CREDIT PROBLEMS IN CURRENT CYCLE Stable to improving core credit trends • 1Q10 fourth consecutive quarterly decline in NPL in3ows • 1Q10 NCOs declined by 36% from 3Q09 peak Signi3cantly de-risked loan portfolio • Performing residential C&D and land acquisition portfolio represents 10% of loans, down from 22% in 4Q07 • Lending moratoriums on high-risk asset classes • NPA carrying values now approximate disposition value Credit processes and enhanced risk management practices delivering results • Quarterly review of all investment real estate loans above $1 million — represents 80% of investment real estate portfolio • Regional credit teams built out Continued aggressive loss recognition and disposition of troubled assets • On track to dispose $600MM in 3rst half of 2010 Monday, April 26, 2010 15 |
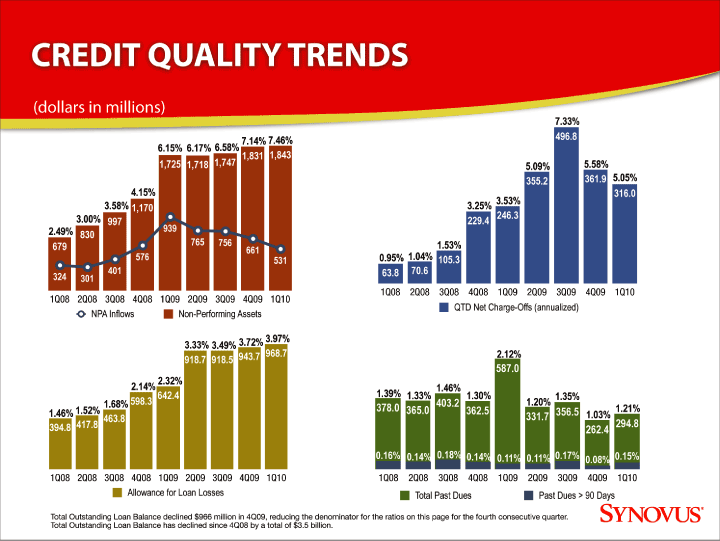
| CREDIT QUALITY TRENDS (dollars in millions) |
| 7.33% 7.14% 7.46% 496.8 6.15% 6.17% 6.58% 1,725 1,718 1,747 1,831 1,843 5.09% 5.58% 355.2 361.9 5.05% 4.15% 316.0 3.58% 3.25% 3.53% 1,170 3.00% 246.3 997 229.4 2.49% 939 830 679 765 756 1.53% 661 576 531 0.95% 1.04% 105.3 401 63.8 70.6 324 301 1Q08 2Q08 3Q08 4Q08 1Q09 2Q09 3Q09 4Q09 1Q10 1Q08 2Q08 3Q08 4Q08 1Q09 2Q09 3Q09 4Q09 1Q10 QTD Net Charge-Offs (annualized) NPA Inflows Non-Performing Assets 3.72% 3.97% 3.33% 3.49% 943.7 968.7 2.12% 918.7 918.5 587.0 2.14% 2.32% 642.4 1.39% 1.33% 1.46% 1.30% 1.68% 598.3 403.2 1.20% 1.35% |
| 1.52% 378.0 365.0 362.5 356.5 1.21% 1.46% 331.7 1.03% 463.8 294.8 394.8 417.8 262.4 0.16% 0.14% 0.18% 0.14% 0.11% 0.11% 0.17% 0.08% 0.15% 1Q08 2Q08 3Q08 4Q08 1Q09 2Q09 3Q09 4Q09 1Q10 1Q08 2Q08 3Q08 4Q08 1Q09 2Q09 3Q09 4Q09 1Q10 Allowance for Loan Losses Total Past Dues Past Dues > 90 Days Total Outstanding Loan Balance declined $966 million in 4Q09, reducing the denominator for the ratios on this page for the fourth consecutive quarter. Total Outstanding Loan Balance has declined since 4Q08 by a total of $3.5 billion. Monday, April 26, 2010 16 |
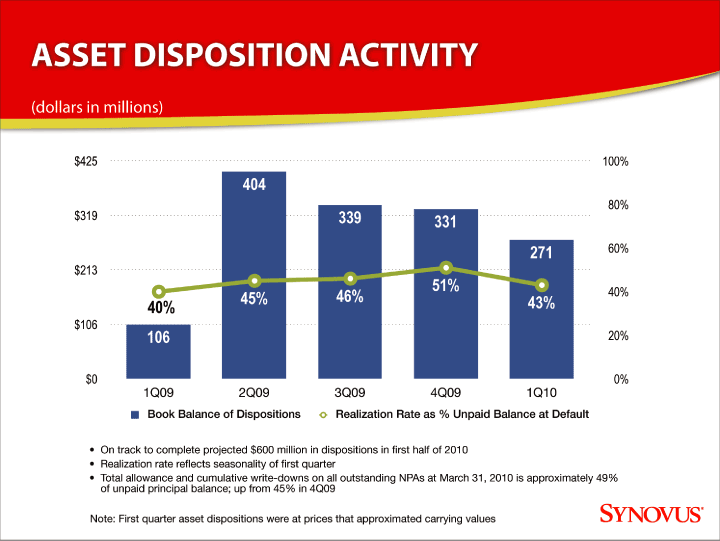
| ASSET DISPOSITION ACTIVITY (dollars in millions) $425 100% 404 80% $319 339 331 271 60% $213 |
| 51% 40% 45% 46% 43% 40% $106 106 20% $0 0% 1Q09 2Q09 3Q09 4Q09 1Q10 Book Balance of Dispositions Realization Rate as % Unpaid Balance at Default • On track to complete projected $600 million in dispositions in first half of 2010 • Realization rate reflects seasonality of first quarter • Total allowance and cumulative write-downs on all outstanding NPAs at March 31, 2010 is approximately 49% of unpaid principal balance; up from 45% in 4Q09 Note: First quarter asset dispositions were at prices that approximated carrying values Monday, April 26, 2010 17 |
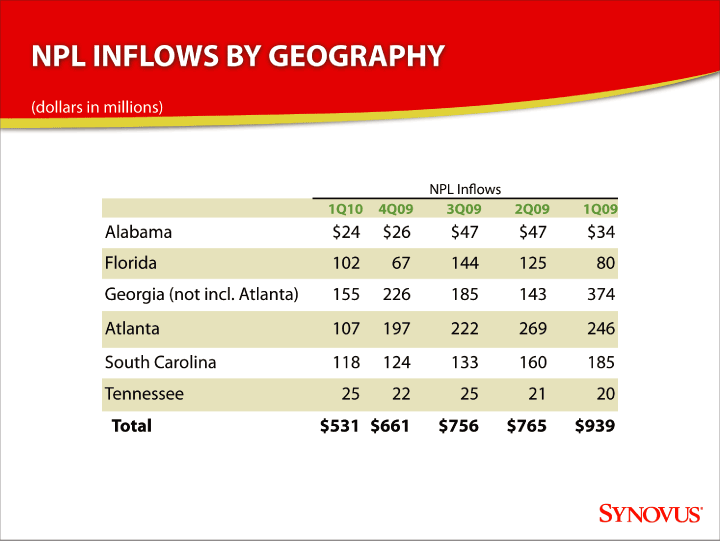
| NPL INFLOWS BY GEOGRAPHY (dollars in millions) NPL In3ows 1Q10 4Q09 3Q09 2Q09 1Q09 Alabama $24 $26 $47 $47 $34 Florida 102 67 144 125 80 Georgia (not incl. Atlanta) 155 226 185 143 374 Atlanta 107 197 222 269 246 South Carolina 118 124 133 160 185 Tennessee 25 22 25 21 20 Total $531 $661 $756 $765 $939 Monday, April 26, 2010 18 |
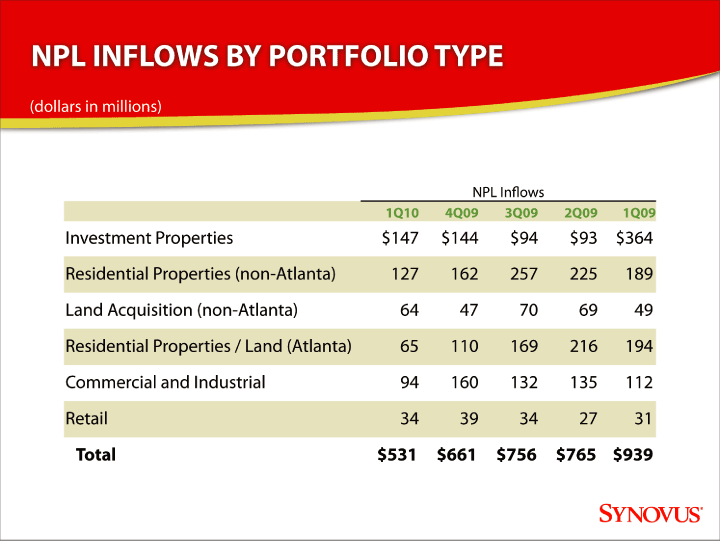
| NPL INFLOWS BY PORTFOLIO TYPE (dollars in millions) NPL In3ows 1Q10 4Q09 3Q09 2Q09 1Q09 Investment Properties $147 $144 $94 $93 $364 Residential Properties (non-Atlanta) 127 162 257 225 189 Land Acquisition (non-Atlanta) 64 47 70 69 49 Residential Properties / Land (Atlanta) 65 110 169 216 194 Commercial and Industrial 94 160 132 135 112 Retail 34 39 34 27 31 Total $531 $661 $756 $765 $939 Monday, April 26, 2010 19 |
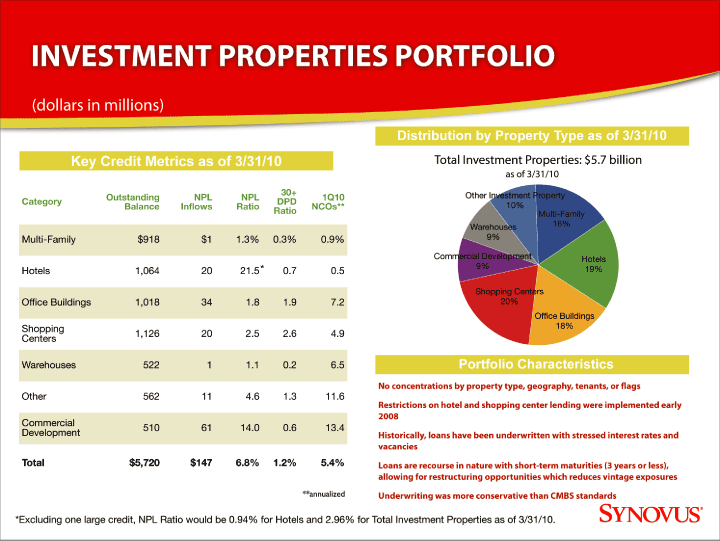
| INVESTMENT PROPERTIES PORTFOLIO (dollars in millions) Distribution by Property Type as of 3/31/10 Key Credit Metrics as of 3/31/10 Total Investment Properties: $5.7 billion as of 3/31/10 30+ Other Investment Property Category Outstanding NPL NPL DPD 1Q10 Balance Inflows Ratio NCOs** 10% Ratio Multi-Family Warehouses 16% Multi-Family $918 $1 1.3% 0.3% 0.9% 9% Commercial Development Hotels Hotels 1,064 20 21.5* 0.7 0.5 9% 19% Shopping Centers Office Buildings 1,018 34 1.8 1.9 7.2 20% Office Buildings |
| Shopping 18% 1,126 20 2.5 2.6 4.9 Centers Warehouses 522 1 1.1 0.2 6.5 Portfolio Characteristics No concentrations by property type, geography, tenants, or 3ags Other 562 11 4.6 1.3 11.6 Restrictions on hotel and shopping center lending were implemented early 2008 Commercial 510 61 14.0 0.6 13.4 |
| Development Historically, loans have been underwritten with stressed interest rates and vacancies Total $5,720 $147 6.8% 1.2% 5.4% Loans are recourse in nature with short-term maturities (3 years or less), allowing for restructuring opportunities which reduces vintage exposures **annualized Underwriting was more conservative than CMBS standards *Excluding one large credit, NPL Ratio would be 0.94% for Hotels and 2.96% for Total Investment Properties as of 3/31/10. Monday, April 26, 2010 20 |
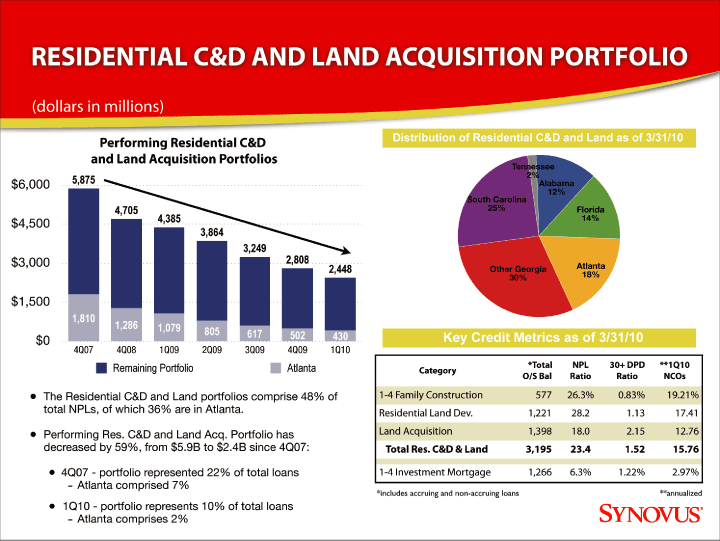
| RESIDENTIAL C&D AND LAND ACQUISITION PORTFOLIO (dollars in millions) Performing Residential C&D Distribution of Residential C&D and Land as of 3/31/10 and Land Acquisition Portfolios Tennessee 5,875 2% |
| $6,000 Alabama 12% South Carolina 4,705 25% Florida $4,500 4,385 14% 3,864 3,249 $3,000 2,808 2,448 Other Georgia Atlanta 30% 18% $1,500 1,810 1,286 1,079 805 617 502 430 Key Credit Metrics as of 3/31/10 $0 4Q07 4Q08 1Q09 2Q09 3Q09 4Q09 1Q10 Remaining Portfolio Atlanta *Total NPL 30+ DPD **1Q10 Category O/S Bal Ratio Ratio NCOs • The Residential C&D and Land portfolios comprise 48% of 1-4 Family Construction 577 26.3% 0.83% 19.21% total NPLs, of which 36% are in Atlanta. Residential Land Dev. 1,221 28.2 1.13 17.41 • Performing Res. C&D and Land Acq. Portfolio has Land Acquisition 1,398 18.0 2.15 12.76 decreased by 59%, from $5.9B to $2.4B since 4Q07: Total Res. C&D & Land 3,195 23.4 1.52 15.76 • 4Q07 — portfolio represented 22% of total loans 1-4 Investment Mortgage 1,266 6.3% 1.22% 2.97% - Atlanta comprised 7% *includes accruing and non-accruing loans **annualized • 1Q10 — portfolio represents 10% of total loans - Atlanta comprises 2% Monday, April 26, 2010 21 |
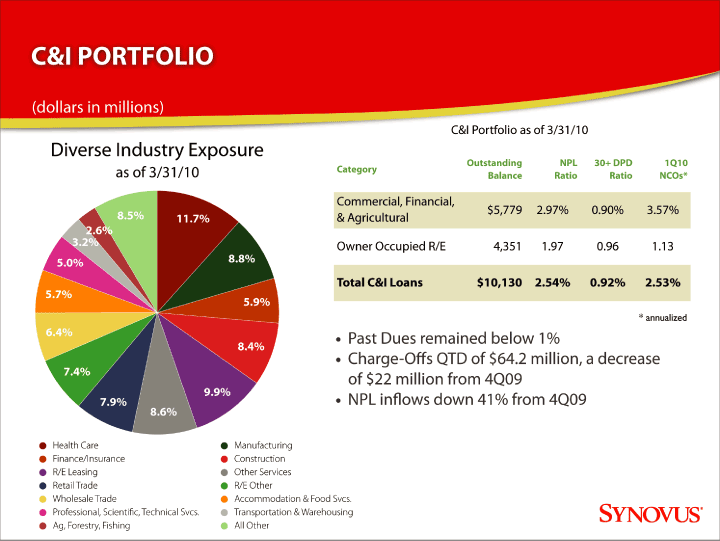
| C&I PORTFOLIO (dollars in millions) C&I Portfolio as of 3/31/10 Diverse Industry Exposure Outstanding NPL 30+ DPD 1Q10 as of 3/31/10 Category Balance Ratio Ratio NCOs* Commercial, Financial, 8.5% $5,779 2.97% 0.90% 3.57% 11.7% & Agricultural 2.6% 3.2% Owner Occupied R/E 4,351 1.97 0.96 1.13 5.0% 8.8% Total C&I Loans $10,130 2.54% 0.92% 2.53% 5.7% 5.9% * annualized 6.4% • Past Dues remained below 1% 8.4% |
| • Charge-O3s QTD of $64.2 million, a decrease 7.4% of $22 million from 4Q09 9.9% NPL in3ows down 41% from 4Q09 7.9% • 8.6% Health Care Manufacturing Finance/Insurance Construction R/E Leasing Other Services Retail Trade R/E Other Wholesale Trade Accommodation & Food Svcs. Professional, Scienti3c, Technical Svcs. Transportation & Warehousing Ag, Forestry, Fishing All Other Monday, April 26, 2010 22 |
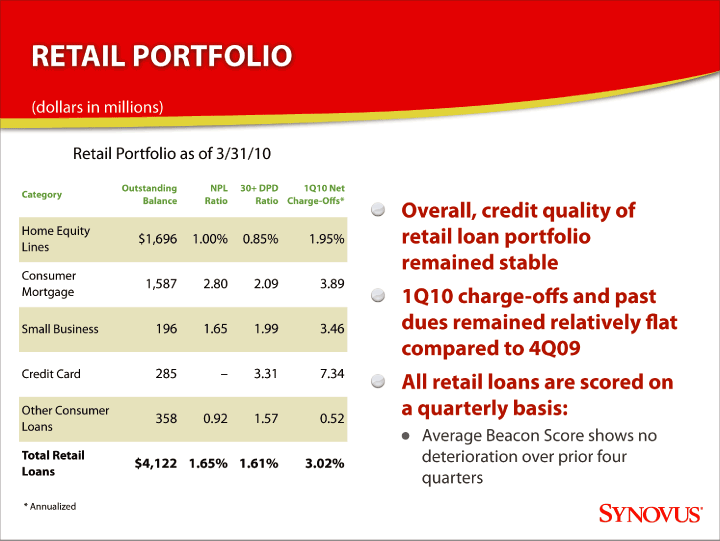
| RETAIL PORTFOLIO (dollars in millions) Retail Portfolio as of 3/31/10 Outstanding NPL 30+ DPD 1Q10 Net Category Balance Ratio Ratio Charge-O3s* Overall, credit quality of Home Equity $1,696 1.00% 0.85% 1.95% retail loan portfolio Lines remained stable Consumer 1,587 2.80 2.09 3.89 |
| Mortgage 1Q10 charge-o3s and past Small Business 196 1.65 1.99 3.46 dues remained relatively 3at compared to 4Q09 Credit Card 285 — 3.31 7.34 All retail loans are scored on Other Consumer a quarterly basis: 358 0.92 1.57 0.52 Loans • Average Beacon Score shows no Total Retail deterioration over prior four $4,122 1.65% 1.61% 3.02% Loans quarters |
| * Annualized Monday, April 26, 2010 23 |

| Core Earnings Power Monday, April 26, 2010 24 |
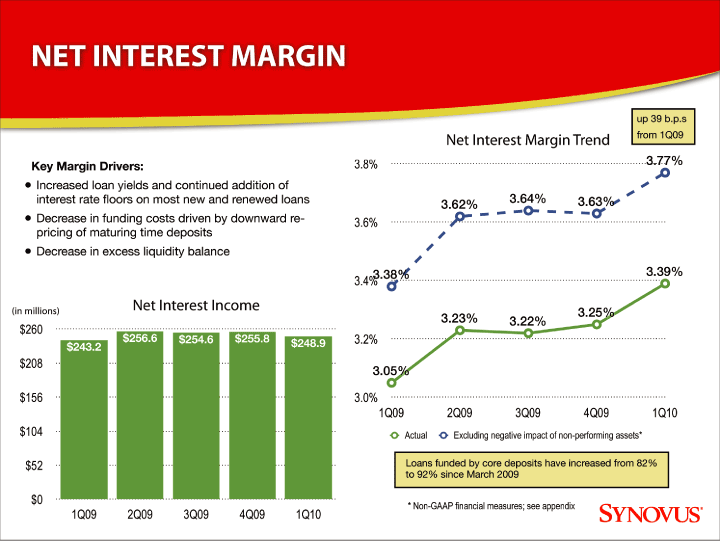
| NET INTEREST MARGIN up 39 b.p.s Net Interest Margin Trend from 1Q09 Key Margin Drivers: 3.8% 3.77% • Increased loan yields and continued addition of interest rate floors on most new and renewed loans 3.62% 3.64% 3.63% • Decrease in funding costs driven by downward re- 3.6% pricing of maturing time deposits • Decrease in excess liquidity balance 3.38% 3.39% 3.4% (in millions) Net Interest Income |
| 3.23% 3.25% 3.22% $260 $256.6 $254.6 $255.8 $248.9 3.2% $243.2 $208 3.05% $156 3.0% 1Q09 2Q09 3Q09 4Q09 1Q10 $104 Actual Excluding negative impact of non-performing assets* $52 Loans funded by core deposits have increased from 82% to 92% since March 2009 $0 |
| * Non-GAAP financial measures; see appendix 1Q09 2Q09 3Q09 4Q09 1Q10 Monday, April 26, 2010 25 |
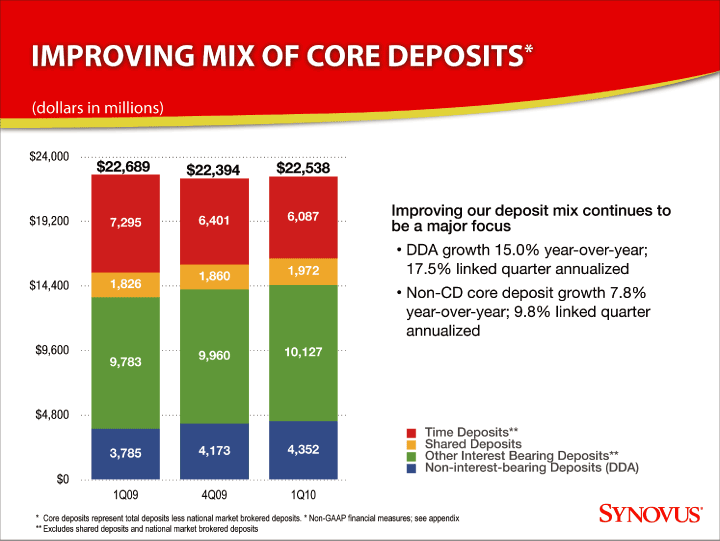
| IMPROVING MIX OF CORE DEPOSITS* (dollars in millions) $24,000 $22,689 $22,394 $22,538 6,087 Improving our deposit mix continues to $19,200 7,295 6,401 be a major focus • DDA growth 15.0% year-over-year; 1,972 17.5% linked quarter annualized 1,860 $14,400 1,826 • Non-CD core deposit growth 7.8% year-over-year; 9.8% linked quarter annualized $9,600 9,960 10,127 9,783 $4,800 Time Deposits** 4,352 Shared Deposits |
| 3,785 4,173 Other Interest Bearing Deposits** Non-interest-bearing Deposits (DDA) $0 1Q09 4Q09 1Q10 26 * Core deposits represent total deposits less national market brokered deposits. * Non-GAAP financial measures; see appendix ** Excludes shared deposits and national market brokered deposits Monday, April 26, 2010 26 |
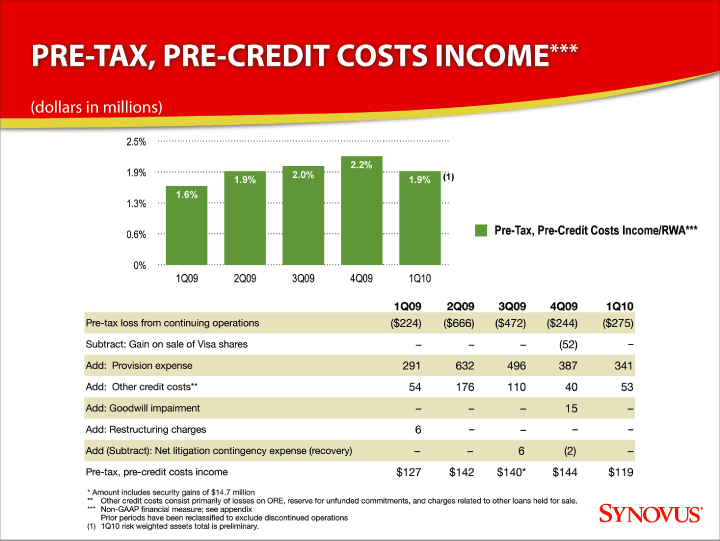
| PRE-TAX, PRE-CREDIT COSTS INCOME*** (dollars in millions) 2.5% 2.2% 1.9% 2.0% (1) 1.9% 1.9% 1.6% 1.3% 0.6% Pre-Tax, Pre-Credit Costs Income/RWA*** 0% 1Q09 2Q09 3Q09 4Q09 1Q10 1Q09 2Q09 3Q09 4Q09 1Q10 Pre-tax loss from continuing operations ($224) ($666) ($472) ($244) ($275) Subtract: Gain on sale of Visa shares — — — (52) -Add: Provision expense 291 632 496 387 341 Add: Other credit costs** 54 176 110 40 53 Add: Goodwill impairment — — — 15 -Add: Restructuring charges 6 - - — -Add (Subtract): Net litigation contingency expense (recovery) — — 6 (2) -Pre-tax, pre-credit costs income $127 $142 $140* $144 $119 *___Amount includes security gains of $14.7 million ** _Other credit costs consist primarily of losses on ORE, reserve for unfunded commitments, and charges related to other loans held for sale. ***___Non-GAAP financial measure; see appendix 27 ___Prior periods have been reclassified to exclude discontinued operations (1)___1Q10 risk weighted assets total is preliminary. Monday, April 26, 2010 27 |
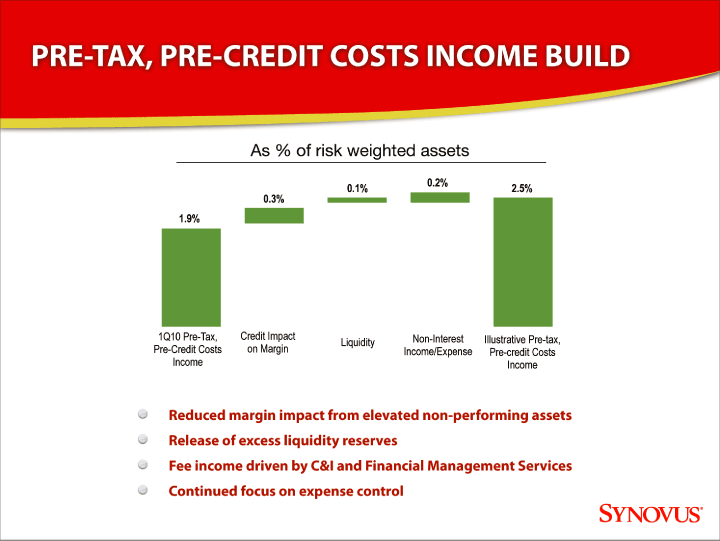
| PRE-TAX, PRE-CREDIT COSTS INCOME BUILD As % of risk weighted assets 0.2% |
| 0.1% 2.5% 0.3% 1.9% 1Q10 Pre-Tax, Credit Impact Non-Interest Illustrative Pre-tax, Liquidity Pre-Credit Costs on Margin Income/Expense Pre-credit Costs Income Income Reduced margin impact from elevated non-performing assets Release of excess liquidity reserves Fee income driven by C&I and Financial Management Services Continued focus on expense control Monday, April 26, 2010 28 |
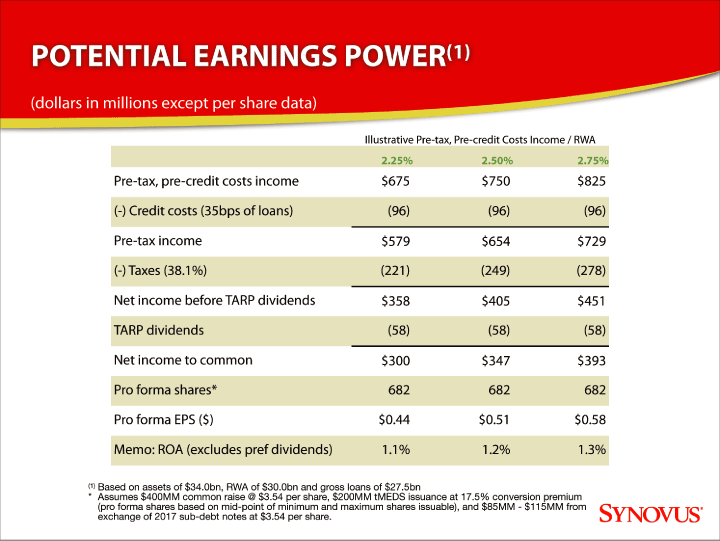
| POTENTIAL EARNINGS POWER(1) (dollars in millions except per share data) Illustrative Pre-tax, Pre-credit Costs Income / RWA 2.25% 2.50% 2.75% Pre-tax, pre-credit costs income $675 $750 $825 (-) Credit costs (35bps of loans) (96) (96) (96) Pre-tax income $579 $654 $729 (-) Taxes (38.1%) (221) (249) (278) Net income before TARP dividends $358 $405 $451 TARP dividends (58) (58) (58) Net income to common $300 $347 $393 Pro forma shares* 682 682 682 Pro forma EPS ($) $0.44 $0.51 $0.58 Memo: ROA (excludes pref dividends) 1.1% 1.2% 1.3% (1) Based on assets of $34.0bn, RWA of $30.0bn and gross loans of $27.5bn |
| * Assumes $400MM common raise @ $3.54 per share, $200MM tMEDS issuance at 17.5% conversion premium (pro forma shares based on mid-point of minimum and maximum shares issuable), and $85MM — $115MM from exchange of 2017 sub-debt notes at $3.54 per share. Monday, April 26, 2010 29 |
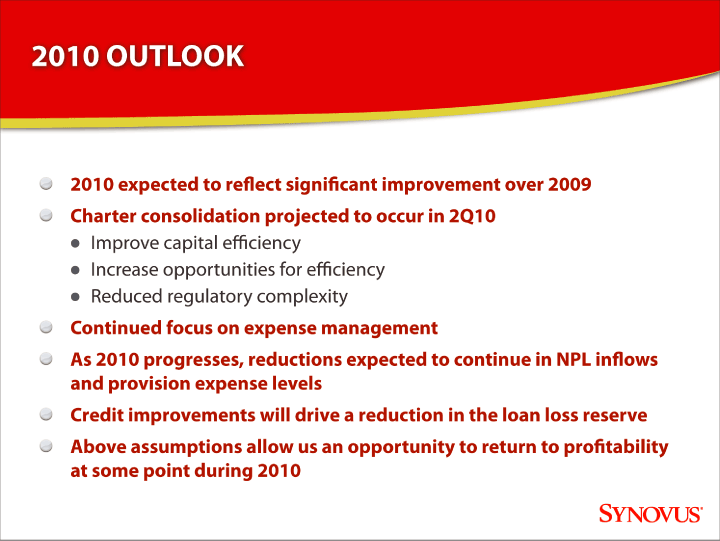
| 2010 OUTLOOK 2010 expected to re3ect signi3cant improvement over 2009 Charter consolidation projected to occur in 2Q10 • Improve capital e3ciency • Increase opportunities for e3ciency • Reduced regulatory complexity Continued focus on expense management As 2010 progresses, reductions expected to continue in NPL in3ows and provision expense levels Credit improvements will drive a reduction in the loan loss reserve Above assumptions allow us an opportunity to return to pro3tability at some point during 2010 Monday, April 26, 2010 30 |

| APPENDIX Monday, April 26, 2010 31 |
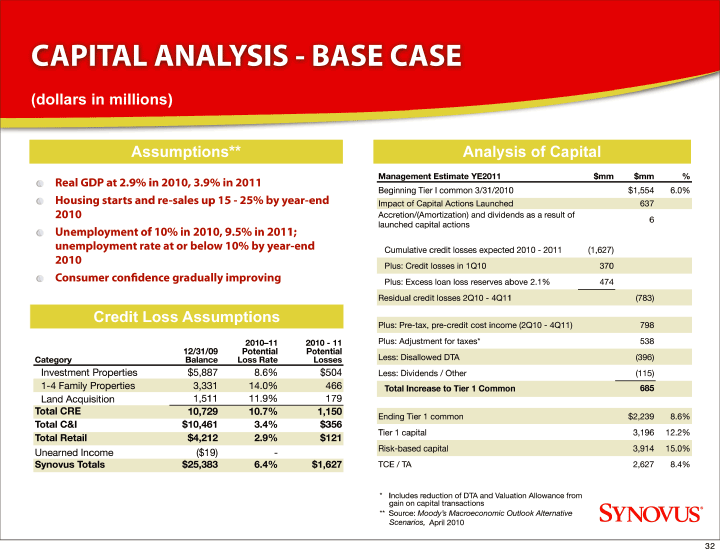
| CAPITAL ANALYSIS — BASE CASE (dollars in millions) Assumptions** Analysis of Capital Real GDP at 2.9% in 2010, 3.9% in 2011 Management Estimate YE2011 $mm $mm % Beginning Tier I common 3/31/2010 $1,554 6.0% Housing starts and re-sales up 15 — 25% by year-end Impact of Capital Actions Launched 637 2010 Accretion/(Amortization) and dividends as a result of 6 launched capital actions Unemployment of 10% in 2010, 9.5% in 2011; unemployment rate at or below 10% by year-end Cumulative credit losses expected 2010 — 2011 (1,627) 2010 Plus: Credit losses in 1Q10 370 Consumer con3dence gradually improving Plus: Excess loan loss reserves above 2.1% 474 Residual credit losses 2Q10 — 4Q11 (783) Credit Loss Assumptions Plus: Pre-tax, pre-credit cost income (2Q10 — 4Q11) 798 2010-11 2010 — 11 Plus: Adjustment for taxes* 538 12/31/09 Potential Potential Category Balance Loss Rate Losses Less: Disallowed DTA (396) Investment Properties $5,887 8.6% $504 Less: Dividends / Other (115) 1-4 Family Properties 3,331 14.0% 466 Total Increase to Tier 1 Common 685 Land Acquisition 1,511 11.9% 179 Total CRE 10,729 10.7% 1,150 Ending Tier 1 common $2,239 8.6% Total C&I $10,461 3.4% $356 Tier 1 capital 3,196 12.2% Total Retail $4,212 2.9% $121 Unearned Income ($19) — Risk-based capital 3,914 15.0% Synovus Totals $25,383 6.4% $1,627 TCE / TA 2,627 8.4% *_Includes reduction of DTA and Valuation Allowance from ___gain on capital transactions ** ___Source: Moody’s Macroeconomic Outlook Alternative 32 ___Scenarios, April 2010 Monday, April 26, 2010 32 |
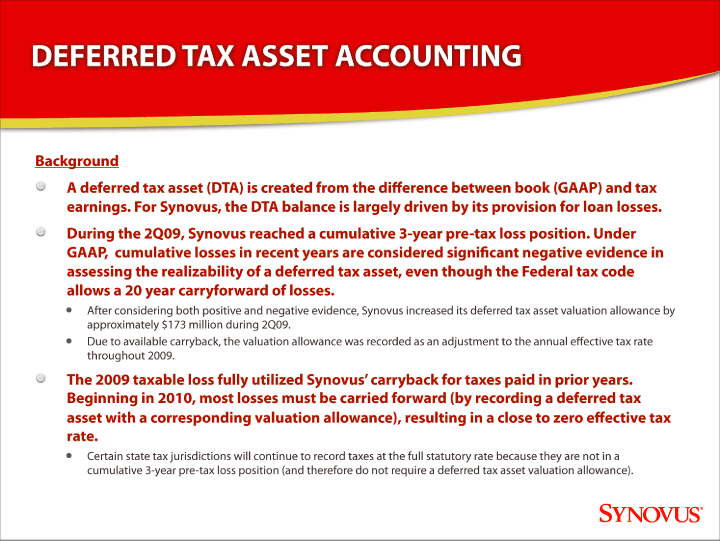
| DEFERRED TAX ASSET ACCOUNTING Background A deferred tax asset (DTA) is created from the di3erence between book (GAAP) and tax earnings. For Synovus, the DTA balance is largely driven by its provision for loan losses. During the 2Q09, Synovus reached a cumulative 3-year pre-tax loss position. Under GAAP, cumulative losses in recent years are considered signi3cant negative evidence in assessing the realizability of a deferred tax asset, even though the Federal tax code allows a 20 year carryforward of losses. • After considering both positive and negative evidence, Synovus increased its deferred tax asset valuation allowance by approximately $173 million during 2Q09. • Due to available carryback, the valuation allowance was recorded as an adjustment to the annual e3ective tax rate throughout 2009. The 2009 taxable loss fully utilized Synovus’ carryback for taxes paid in prior years. Beginning in 2010, most losses must be carried forward (by recording a deferred tax asset with a corresponding valuation allowance), resulting in a close to zero e3ective tax rate. • Certain state tax jurisdictions will continue to record taxes at the full statutory rate because they are not in a cumulative 3-year pre-tax loss position (and therefore do not require a deferred tax asset valuation allowance). Monday, April 26, 2010 33 |
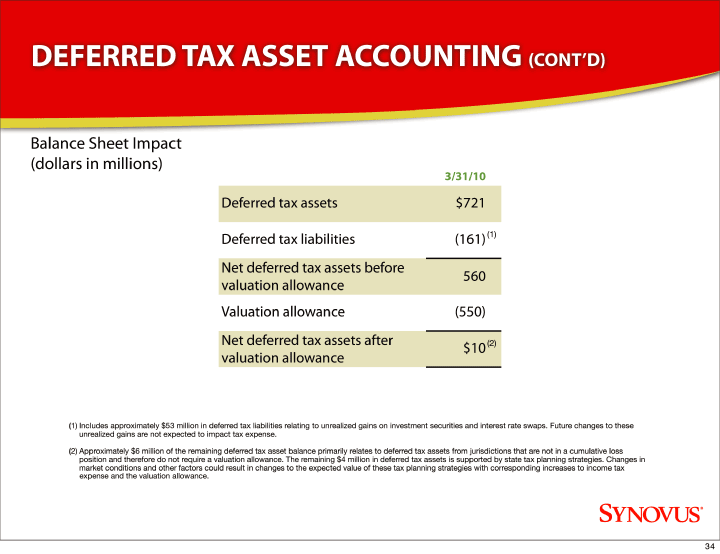
| DEFERRED TAX ASSET ACCOUNTING (CONT’D) Balance Sheet Impact (dollars in millions) 3/31/10 Deferred tax assets $721 |
| Deferred tax liabilities (161)(1) Net deferred tax assets before 560 valuation allowance Valuation allowance (550) Net deferred tax assets after (2) $10 valuation allowance (1) Includes approximately $53 million in deferred tax liabilities relating to unrealized gains on investment securities and interest rate swaps. Future changes to these unrealized gains are not expected to impact tax expense. (2) Approximately $6 million of the remaining deferred tax asset balance primarily relates to deferred tax assets from jurisdictions that are not in a cumulative loss position and therefore do not require a valuation allowance. The remaining $4 million in deferred tax assets is supported by state tax planning strategies. Changes in market conditions and other factors could result in changes to the expected value of these tax planning strategies with corresponding increases to income tax expense and the valuation allowance. Monday, April 26, 2010 34 |
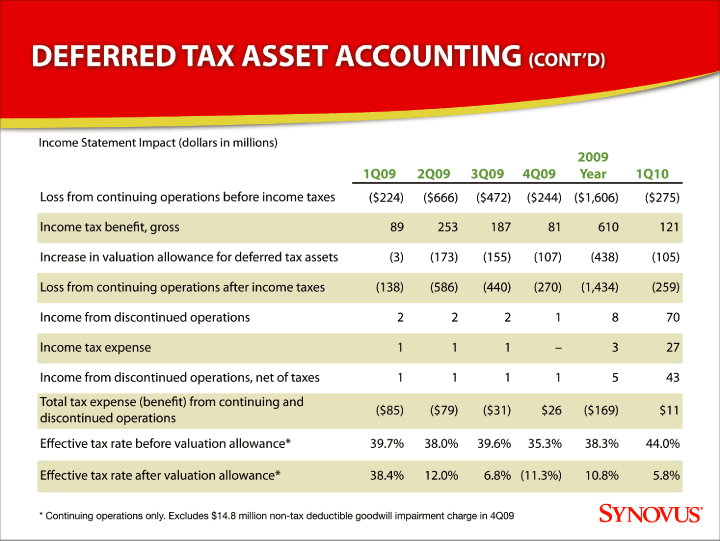
| DEFERRED TAX ASSET ACCOUNTING (CONT’D) Income Statement Impact (dollars in millions) 2009 1Q09 2Q09 3Q09 4Q09 Year 1Q10 Loss from continuing operations before income taxes ($224) ($666) ($472) ($244) ($1,606) ($275) Income tax bene3t, gross 89 253 187 81 610 121 Increase in valuation allowance for deferred tax assets (3) (173) (155) (107) (438) (105) Loss from continuing operations after income taxes (138) (586) (440) (270) (1,434) (259) Income from discontinued operations 2 2 2 1 8 70 Income tax expense 1 1 1 — 3 27 Income from discontinued operations, net of taxes 1 1 1 1 5 43 Total tax expense (bene3t) from continuing and ($85) ($79) ($31) $26 ($169) $11 discontinued operations E3ective tax rate before valuation allowance* 39.7% 38.0% 39.6% 35.3% 38.3% 44.0% E3ective tax rate after valuation allowance* 38.4% 12.0% 6.8% (11.3%) 10.8% 5.8% |
| * Continuing operations only. Excludes $14.8 million non-tax deductible goodwill impairment charge in 4Q09 Monday, April 26, 2010 35 |
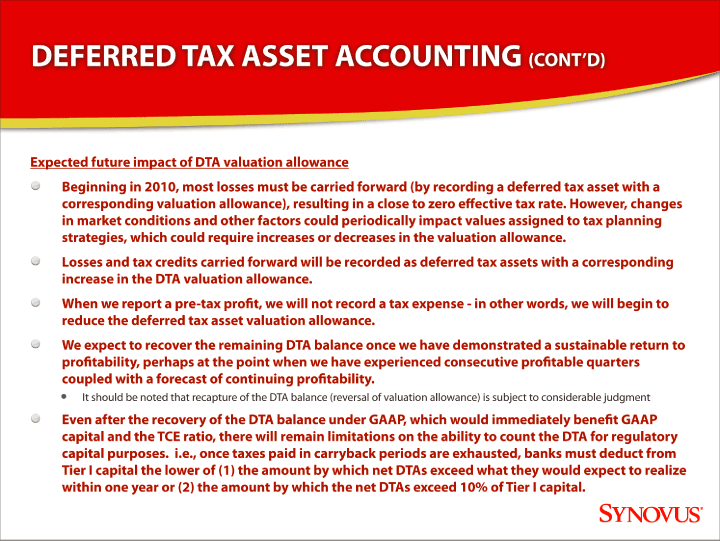
| DEFERRED TAX ASSET ACCOUNTING (CONT’D) Expected future impact of DTA valuation allowance Beginning in 2010, most losses must be carried forward (by recording a deferred tax asset with a corresponding valuation allowance), resulting in a close to zero e3ective tax rate. However, changes in market conditions and other factors could periodically impact values assigned to tax planning strategies, which could require increases or decreases in the valuation allowance. Losses and tax credits carried forward will be recorded as deferred tax assets with a corresponding increase in the DTA valuation allowance. When we report a pre-tax pro3t, we will not record a tax expense — in other words, we will begin to reduce the deferred tax asset valuation allowance. We expect to recover the remaining DTA balance once we have demonstrated a sustainable return to pro3tability, perhaps at the point when we have experienced consecutive pro3table quarters coupled with a forecast of continuing pro3tability. • It should be noted that recapture of the DTA balance (reversal of valuation allowance) is subject to considerable judgment Even after the recovery of the DTA balance under GAAP, which would immediately bene3t GAAP capital and the TCE ratio, there will remain limitations on the ability to count the DTA for regulatory capital purposes. i.e., once taxes paid in carryback periods are exhausted, banks must deduct from Tier I capital the lower of (1) the amount by which net DTAs exceed what they would expect to realize within one year or (2) the amount by which the net DTAs exceed 10% of Tier I capital. Monday, April 26, 2010 36 |
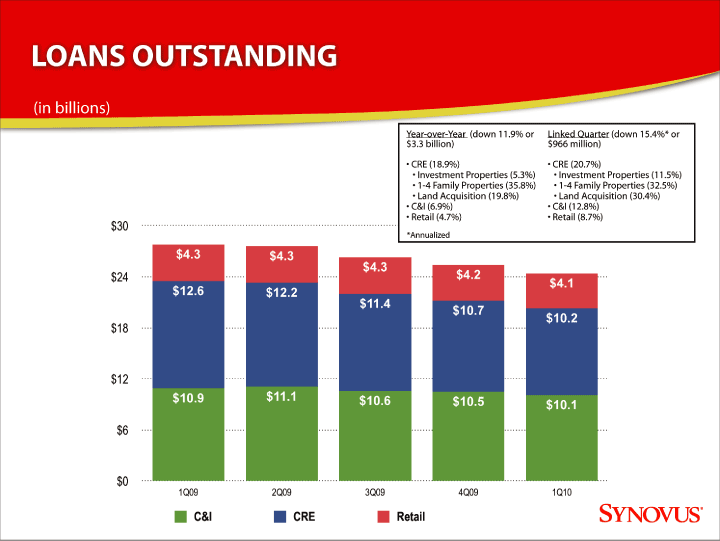
| LOANS OUTSTANDING (in billions) Year-over-Year (down 11.9% or Linked Quarter (down 15.4%* or $3.3 billion) $966 million) • CRE (18.9%) • CRE (20.7%) |
| • Investment Properties (5.3%) • Investment Properties (11.5%) • 1-4 Family Properties (35.8%) • 1-4 Family Properties (32.5%) • Land Acquisition (19.8%) • Land Acquisition (30.4%) • C&I (6.9%) • C&I (12.8%) • Retail (4.7%) • Retail (8.7%) $30 *Annualized $4.3 $4.3 $4.3 |
| $24 $4.2 $4.1 $12.6 $12.2 $11.4 $10.7 $10.2 $18 $12 $10.9 $11.1 $10.6 $10.5 $10.1 $6 $0 1Q09 2Q09 3Q09 4Q09 1Q10 C&I CRE Retail Monday, April 26, 2010 37 |
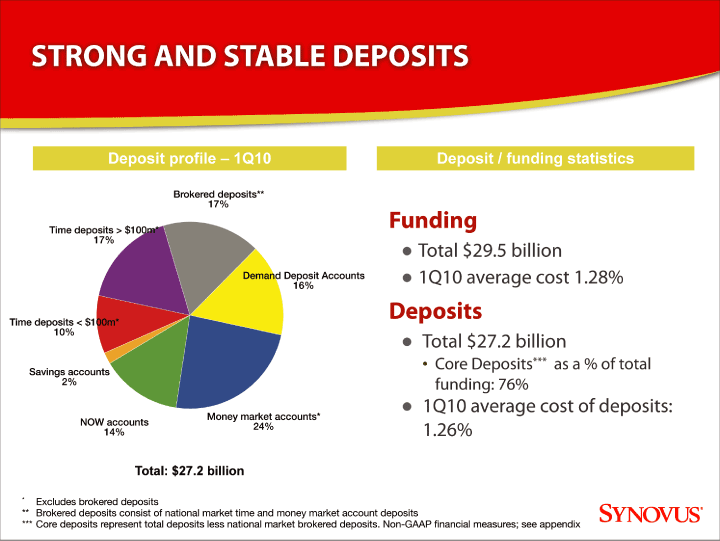
| STRONG AND STABLE DEPOSITS Deposit profile — 1Q10 Deposit / funding statistics Brokered deposits** 17% Funding Time deposits > $100m* 17% • Total $29.5 billion Demand Deposit Accounts • 1Q10 average cost 1.28% 16% Deposits Time deposits < $100m* 10% • Total $27.2 billion • Core Deposits*** as a % of total Savings accounts 2% funding: 76% • 1Q10 average cost of deposits: Money market accounts* NOW accounts 24% 14% 1.26% Total: $27.2 billion *___Excludes brokered deposits ** Brokered deposits consist of national market time and money market account deposits *** Core deposits represent total deposits less national market brokered deposits. Non-GAAP financial measures; see appendix Monday, April 26, 2010 38 |
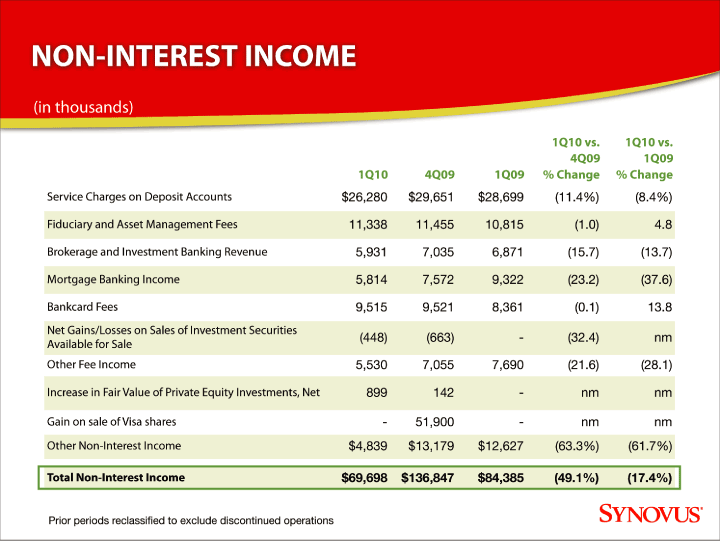
| NON-INTEREST INCOME (in thousands) 1Q10 vs. 1Q10 vs. 4Q09 1Q09 1Q10 4Q09 1Q09% Change % Change Service Charges on Deposit Accounts $26,280 $29,651 $28,699 (11.4%) (8.4%) Fiduciary and Asset Management Fees 11,338 11,455 10,815 (1.0) 4.8 Brokerage and Investment Banking Revenue 5,931 7,035 6,871 (15.7) (13.7) Mortgage Banking Income 5,814 7,572 9,322 (23.2) (37.6) Bankcard Fees 9,515 9,521 8,361 (0.1) 13.8 Net Gains/Losses on Sales of Investment Securities (448) (663) — (32.4) nm Available for Sale Other Fee Income 5,530 7,055 7,690 (21.6) (28.1) Increase in Fair Value of Private Equity Investments, Net 899 142 — nm nm Gain on sale of Visa shares — 51,900 — nm nm Other Non-Interest Income $4,839 $13,179 $12,627 (63.3%) (61.7%) Total Non-Interest Income $69,698 $136,847 $84,385 (49.1%) (17.4%) Prior periods reclassified to exclude discontinued operations Monday, April 26, 2010 39 |
| NON-INTEREST EXPENSE (in thousands) |
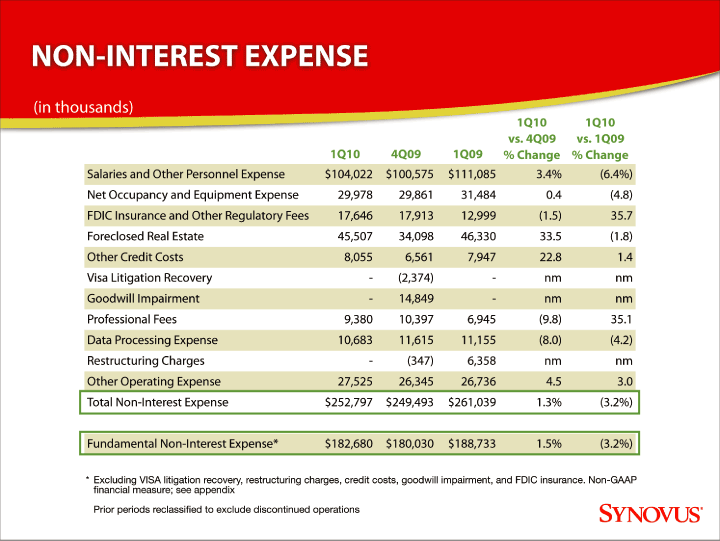
| 1Q10 1Q10 vs. 4Q09 vs. 1Q09 1Q10 4Q09 1Q09% Change % Change Salaries and Other Personnel Expense $104,022 $100,575 $111,085 3.4% (6.4%) Net Occupancy and Equipment Expense 29,978 29,861 31,484 0.4 (4.8) FDIC Insurance and Other Regulatory Fees 17,646 17,913 12,999 (1.5) 35.7 Foreclosed Real Estate 45,507 34,098 46,330 33.5 (1.8) Other Credit Costs 8,055 6,561 7,947 22.8 1.4 Visa Litigation Recovery — (2,374) — nm nm Goodwill Impairment — 14,849 - nm nm Professional Fees 9,380 10,397 6,945 (9.8) 35.1 Data Processing Expense 10,683 11,615 11,155 (8.0) (4.2) Restructuring Charges — (347) 6,358 nm nm Other Operating Expense 27,525 26,345 26,736 4.5 3.0 Total Non-Interest Expense $252,797 $249,493 $261,039 1.3% (3.2%) Fundamental Non-Interest Expense* $182,680 $180,030 $188,733 1.5% (3.2%) |
| * Excluding VISA litigation recovery, restructuring charges, credit costs, goodwill impairment, and FDIC insurance. Non-GAAP financial measure; see appendix Prior periods reclassified to exclude discontinued operations Monday, April 26, 2010 40 |
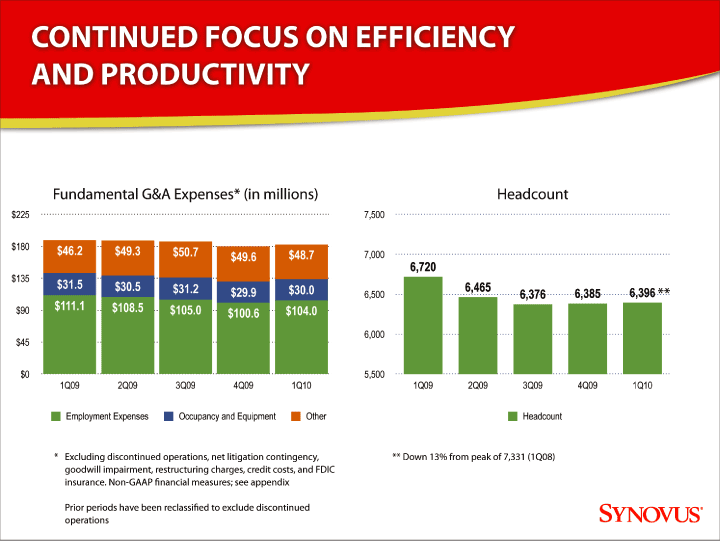
| CONTINUED FOCUS ON EFFICIENCY AND PRODUCTIVITY Fundamental G&A Expenses* (in millions) Headcount $225 7,500 $180 $46.2 $49.3 $50.7 $49.6 $48.7 7,000 |
| 6,720 $135 $31.5 $30.5 $31.2 $29.9 $30.0 6,465 6,500 6,376 6,385 6,396 ** $90 $111.1 $108.5 $105.0 $104.0 $100.6 6,000 $45 $0 5,500 1Q09 2Q09 3Q09 4Q09 1Q10 1Q09 2Q09 3Q09 4Q09 1Q10 Employment Expenses Occupancy and Equipment Other Headcount |
| * Excluding discontinued operations, net litigation contingency, ** Down 13% from peak of 7,331 (1Q08) goodwill impairment, restructuring charges, credit costs, and FDIC insurance. Non-GAAP 3nancial measures; see appendix Prior periods have been reclassi3ed to exclude discontinued operations Monday, April 26, 2010 41 |
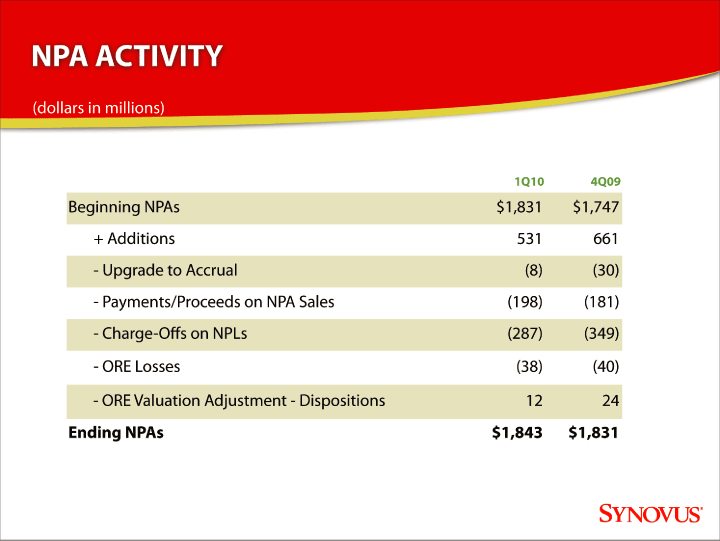
| NPA ACTIVITY (dollars in millions) 1Q10 4Q09 Beginning NPAs $1,831 $1,747 + Additions 531 661 — Upgrade to Accrual (8) (30) - Payments/Proceeds on NPA Sales (198) (181) — Charge-O3s on NPLs (287) (349) — ORE Losses (38) (40) — ORE Valuation Adjustment — Dispositions 12 24 Ending NPAs $1,843 $1,831 Monday, April 26, 2010 42 |
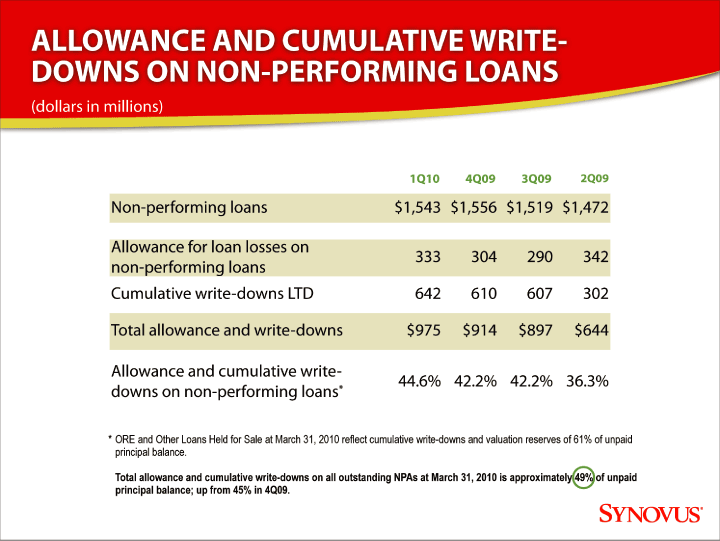
| ALLOWANCE AND CUMULATIVE WRITE-DOWNS ON NON-PERFORMING LOANS (dollars in millions) 1Q10 4Q09 3Q09 2Q09 Non-performing loans $1,543 $1,556 $1,519 $1,472 Allowance for loan losses on 333 304 290 342 non-performing loans Cumulative write-downs LTD 642 610 607 302 Total allowance and write-downs $975 $914 $897 $644 Allowance and cumulative write- 44.6% 42.2% 42.2% 36.3% downs on non-performing loans* |
| * ORE and Other Loans Held for Sale at March 31, 2010 reflect cumulative write-downs and valuation reserves of 61% of unpaid principal balance. Total allowance and cumulative write-downs on all outstanding NPAs at March 31, 2010 is approximately 49% of unpaid principal balance; up from 45% in 4Q09. Monday, April 26, 2010 43 |
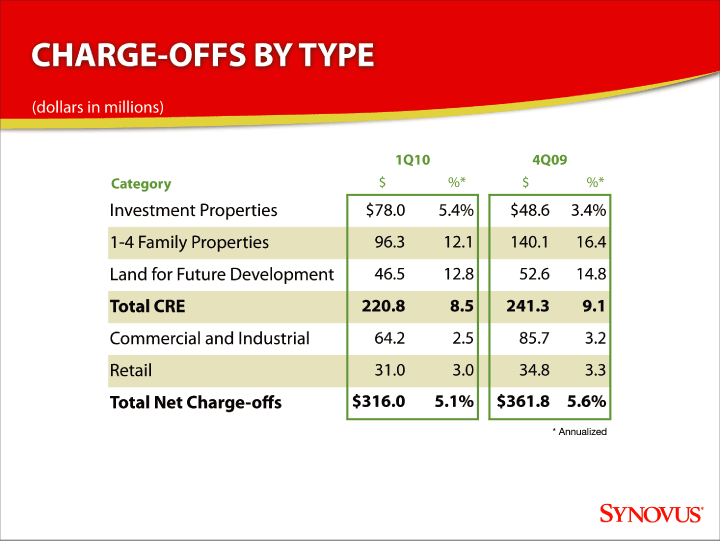
| CHARGE-OFFS BY TYPE (dollars in millions) 1Q10 4Q09 Category $ %* $ %* Investment Properties $78.0 5.4% $48.6 3.4% 1-4 Family Properties 96.3 12.1 140.1 16.4 Land for Future Development 46.5 12.8 52.6 14.8 Total CRE 220.8 8.5 241.3 9.1 Commercial and Industrial 64.2 2.5 85.7 3.2 Retail 31.0 3.0 34.8 3.3 Total Net Charge-o3s $316.0 5.1% $361.8 5.6% |
| * Annualized Monday, April 26, 2010 44 |
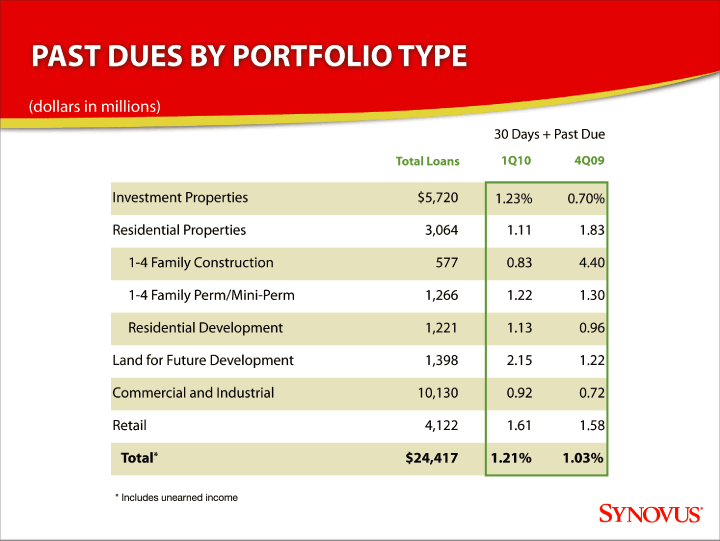
| PAST DUES BY PORTFOLIO TYPE (dollars in millions) 30 Days + Past Due Total Loans 1Q10 4Q09 Investment Properties $5,720 1.23% 0.70% Residential Properties 3,064 1.11 1.83 1-4 Family Construction 577 0.83 4.40 1-4 Family Perm/Mini-Perm 1,266 1.22 1.30 Residential Development 1,221 1.13 0.96 Land for Future Development 1,398 2.15 1.22 Commercial and Industrial 10,130 0.92 0.72 Retail 4,122 1.61 1.58 Total* $24,417 1.21% 1.03% |
| * Includes unearned income Monday, April 26, 2010 45 |
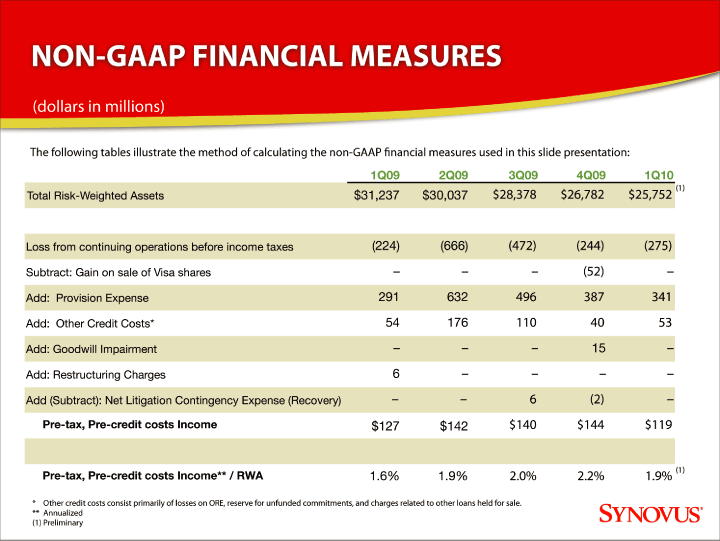
| NON-GAAP FINANCIAL MEASURES (dollars in millions) The following tables illustrate the method of calculating the non-GAAP 3nancial measures used in this slide presentation: 1Q09 2Q09 3Q09 4Q09 1Q10 $28,378 $26,782 $25,752 (1) Total Risk-Weighted Assets $31,237 $30,037 Loss from continuing operations before income taxes (224) (666) (472) (244) (275) Subtract: Gain on sale of Visa shares — — — (52) -Add: Provision Expense 291 632 496 387 341 Add: Other Credit Costs* 54 176 110 40 53 Add: Goodwill Impairment — — — 15 -Add: Restructuring Charges 6 — — — -Add (Subtract): Net Litigation Contingency Expense (Recovery) — — 6 (2) - Pre-tax, Pre-credit costs Income $127 $142 $140 $144 $119 Pre-tax, Pre-credit costs Income** / RWA 1.6% 1.9% 2.0% 2.2% 1.9% (1) |
| * Other credit costs consist primarily of losses on ORE, reserve for unfunded commitments, and charges related to other loans held for sale. ** Annualized (1) Preliminary Monday, April 26, 2010 46 |
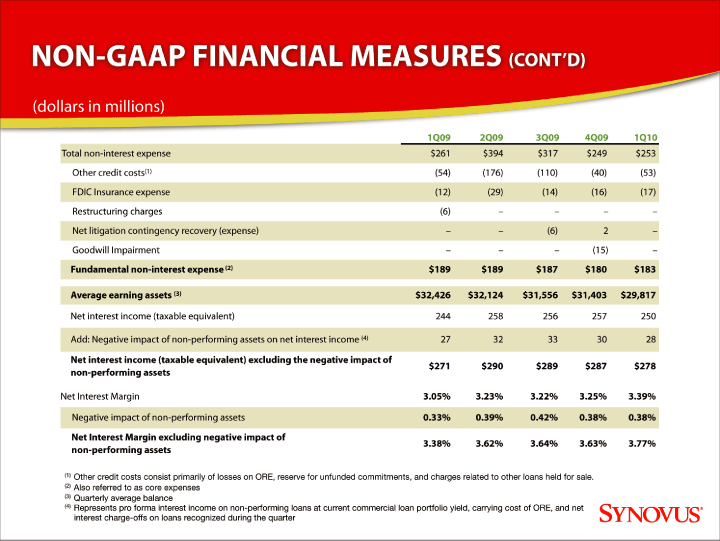
| NON-GAAP FINANCIAL MEASURES (CONT’D) (dollars in millions) 1Q09 2Q09 3Q09 4Q09 1Q10 Total non-interest expense $261 $394 $317 $249 $253 Other credit costs(1) (54) (176) (110) (40) (53) FDIC Insurance expense (12) (29) (14) (16) (17) Restructuring charges (6) — - — -Net litigation contingency recovery (expense) — - (6) 2 -Goodwill Impairment — - — (15) - Fundamental non-interest expense (2) $189 $189 $187 $180 $183 Average earning assets (3) $32,426 $32,124 $31,556 $31,403 $29,817 Net interest income (taxable equivalent) 244 258 256 257 250 Add: Negative impact of non-performing assets on net interest income (4) 27 32 33 30 28 |
| Net interest income (taxable equivalent) excluding the negative impact of $271 $290 $289 $287 $278 non-performing assets Net Interest Margin 3.05% 3.23% 3.22% 3.25% 3.39% |
| Negative impact of non-performing assets 0.33% 0.39% 0.42% 0.38% 0.38% Net Interest Margin excluding negative impact of 3.38% 3.62% 3.64% 3.63% 3.77% non-performing assets (1) Other credit costs consist primarily of losses on ORE, reserve for unfunded commitments, and charges related to other loans held for sale. (2) Also referred to as core expenses (3) Quarterly average balance (4) Represents pro forma interest income on non-performing loans at current commercial loan portfolio yield, carrying cost of ORE, and net interest charge-offs on loans recognized during the quarter Monday, April 26, 2010 47 |
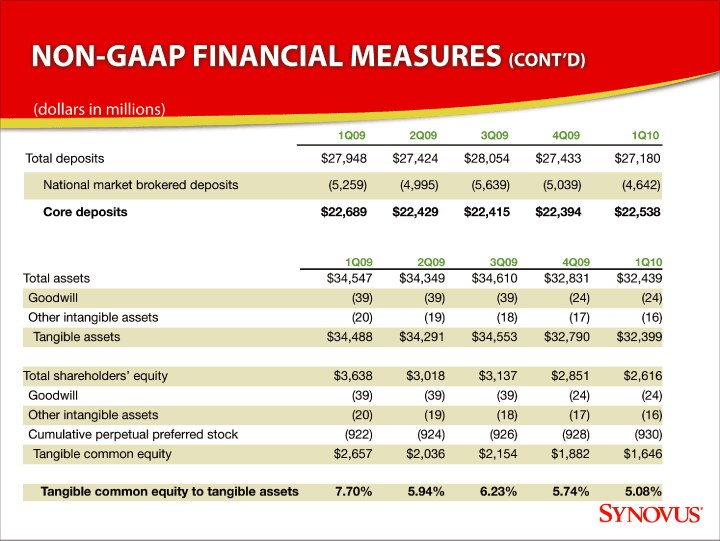
| NON-GAAP FINANCIAL MEASURES (CONT’D) (dollars in millions) 1Q09 2Q09 3Q09 4Q09 1Q10 Total deposits $27,948 $27,424 $28,054 $27,433 $27,180 National market brokered deposits (5,259) (4,995) (5,639) (5,039) (4,642) Core deposits $22,689 $22,429 $22,415 $22,394 $22,538 1Q09 2Q09 3Q09 4Q09 1Q10 Total assets $34,547 $34,349 $34,610 $32,831 $32,439 Goodwill (39) (39) (39) (24) (24) Other intangible assets (20) (19) (18) (17) (16) Tangible assets $34,488 $34,291 $34,553 $32,790 $32,399 Total shareholders’ equity $3,638 $3,018 $3,137 $2,851 $2,616 Goodwill (39) (39) (39) (24) (24) Other intangible assets (20) (19) (18) (17) (16) Cumulative perpetual preferred stock (922) (924) (926) (928) (930) Tangible common equity $2,657 $2,036 $2,154 $1,882 $1,646 Tangible common equity to tangible assets 7.70% 5.94% 6.23% 5.74% 5.08% Monday, April 26, 2010 48 |
