Attached files
| file | filename |
|---|---|
| EX-23.1 - EXHIBIT 23.1 - Convio, Inc. | a2198106zex-23_1.htm |
| EX-1.1 - EXHIBIT 1.1 - Convio, Inc. | a2198206zex-1_1.htm |
As filed with the Securities and Exchange Commission on April 23, 2010.
Registration No. 333-164491
UNITED STATES
SECURITIES AND EXCHANGE COMMISSION
Washington, D.C. 20549
Amendment No. 5
to
Form S-1
REGISTRATION STATEMENT UNDER
THE SECURITIES ACT OF 1933
Convio, Inc.
(Exact name of registrant as specified in its charter)
| Delaware (State or other Jurisdiction of Incorporation or Organization) |
7372 (Primary Standard Industrial Classification Code Number) |
74-2935609 (I.R.S. Employer Identification No.) |
11501 Domain Drive, Suite 200
Austin, Texas 78758
Telephone: (512) 652-2600
(Address, including zip code, and telephone number,
including area code, of registrant's principal executive offices)
Gene Austin
Chief Executive Officer
11501 Domain Drive, Suite 200
Austin, TX 78758
Telephone: (512) 652-2600
(Name, address, including zip code, and telephone number, including area code, of agent for service)
Copies to:
| John J. Gilluly III, P.C. Ariane A. Chan, P.C. DLA Piper LLP (US) 401 Congress Avenue, Suite 2500 Austin, Texas 78701 (512) 457-7000 |
Eric C. Jensen, Esq. John T. McKenna, Esq. Cooley LLP Five Palo Alto Square 3000 El Camino Real Palo Alto, California 94306 (650) 843-5000 |
Approximate date of commencement of proposed sale to the public:
As soon as practicable after the effective date of this Registration Statement.
If any of the securities being registered on this Form are to be offered on a delayed or continuous basis pursuant to Rule 415 under the Securities Act of 1933, check the following box. o
If this Form is filed to register additional securities for an offering pursuant to Rule 462(b) under the Securities Act, please check the following box and list the Securities Act registration statement number of the earlier effective registration statement for the same offering. o
If this Form is a post-effective amendment filed pursuant to Rule 462(c) under the Securities Act, check the following box and list the Securities Act registration statement number of the earlier effective registration statement for the same offering. o
If this form is a post-effective amendment filed pursuant to Rule 462(d) under the Securities Act, check the following box and list the Securities Act registration statement number of the earlier effective registration statement for the same offering. o
Indicate by check mark whether the registrant is a large accelerated filer, an accelerated filer, a non-accelerated filer, or a smaller reporting company. See the definitions of "large accelerated filer," "accelerated filer" and "smaller reporting company" in Rule 12b-2 of the Exchange Act. (Check one):
| Large accelerated filer o | Accelerated filer o | Non-accelerated filer ý (Do not check if a smaller reporting company) |
Smaller reporting company o |
The registrant hereby amends this registration statement on such date or dates as may be necessary to delay its effective date until the registrant shall file a further amendment which specifically states that this registration statement shall thereafter become effective in accordance with section 8(a) of the Securities Act of 1933 or until the registration statement shall become effective on such date as the Commission acting pursuant to said section 8(a), may determine.
The information in this preliminary prospectus is not complete and may be changed. These securities may not be sold until the registration statement filed with the Securities and Exchange Commission is effective. This preliminary prospectus is not an offer to sell nor does it seek an offer to buy these securities in any jurisdiction where the offer or sale is not permitted.
SUBJECT TO COMPLETION. DATED APRIL 23, 2010.
IPO PRELIMINARY PROSPECTUS

5,132,728 Shares
Common Stock
$ per share
Convio, Inc. is selling 3,636,364 shares of our common stock and the selling stockholders identified in this prospectus are selling additional 1,496,364 shares. We will not receive any of the proceeds from the sale of the shares being sold by the selling stockholders. We have granted the underwriters a 30-day option to purchase up to an additional 769,909 shares from us to cover over-allotments, if any.
This is an initial public offering of our common stock. We currently expect the initial public offering price to be between $10.00 and $12.00 per share. We have applied for the listing of our common stock on the NASDAQ Global Market under the symbol "CNVO."
INVESTING IN OUR COMMON STOCK INVOLVES RISKS. SEE "RISK FACTORS" BEGINNING ON PAGE 10
| |
Per Share |
Total |
|||
|---|---|---|---|---|---|
| Initial public offering price | $ | $ | |||
| Underwriting discount | $ | $ | |||
| Proceeds, before expenses, to Convio | $ | $ | |||
| Proceeds, before expenses, to the selling stockholders | $ | $ | |||
Neither the Securities and Exchange Commission nor any state securities commission has approved or disapproved of these securities or passed upon the accuracy or adequacy of this prospectus. Any representation to the contrary is a criminal offense.
| Thomas Weisel Partners LLC | Piper Jaffray |
William Blair & Company
JMP Securities
Pacific Crest Securities
The date of this prospectus is , 2010.

Neither we nor any of the underwriters or selling stockholders has authorized anyone to provide information different from that contained in this prospectus or in any free writing prospectus that we file with the Securities and Exchange Commission, or the SEC. When you make a decision about whether to invest in our common stock, you should not rely upon any information other than the information in this prospectus or in any free writing prospectus that we file with the SEC. Neither the delivery of this prospectus nor the sale of our common stock means that information contained in this prospectus is correct after the date of this prospectus. This prospectus is not an offer to sell or solicitation of an offer to buy these shares of common stock in any circumstances under which the offer or solicitation is unlawful.
Through and including , 2010 (the 25th day after the date of this prospectus), all dealers effecting transactions in these securities, whether or not participating in this offering, may be required to deliver a prospectus. This is in addition to a dealer's obligation to deliver a prospectus when acting as an underwriter and with respect to an unsold allotment or subscription.
You should read the following summary together with the more detailed information concerning our company, the common stock being sold in this offering and our financial statements appearing in this prospectus and in the documents incorporated by reference in this prospectus. Because this is only a summary, you should read the rest of this prospectus, including the documents incorporated by reference in this prospectus, before you invest in our common stock. Read this entire prospectus carefully, especially the risks described under "Risk Factors."
Overview
We are a leading provider of on-demand constituent engagement solutions that enable nonprofit organizations, or NPOs, to more effectively raise funds, advocate for change and cultivate relationships with donors, activists, volunteers, alumni and other constituents. We serve approximately 1,300 NPOs of all sizes including 29 of the 50 largest charities as ranked by contributions in the November 2009 Forbes article entitled "The 200 Largest U.S. Charities." During 2009, our clients used our solutions to raise over $920 million and deliver over 3.8 billion emails to over 154 million email addresses to accomplish their missions.
Our integrated solutions include our Convio Online Marketing platform, or COM, and Common Ground, our constituent relationship management application. COM enables NPOs to harness the full potential of the Internet and social media as new channels for constituent engagement and fundraising. Common Ground delivers next-generation donor management capabilities, integrates marketing activities across online and offline channels and is designed to increase operational efficiency. Our software is built on an open, configurable and flexible architecture that enables our clients and partners to customize and extend its functionality. Our solutions are enhanced by a portfolio of value-added services tailored to our clients' specific needs.
Our revenue has grown in the last five years to $63.1 million in 2009 from $13.3 million in 2005. Our clients pay us recurring subscription fees with agreement terms that typically range between one and three years. Our subscription fees grow as our clients grow their constituent bases and purchase additional modules of COM and additional seats of Common Ground. We also receive transaction fees that include a percentage of funds raised for special events such as runs, walks and rides. Our clients grew their online fundraising using our solutions by 14% in 2008, despite a decline in total public contributions in the United States of 2% according to Giving USA Foundation in its "Annual Report on Philanthropy for the Year 2008." Total charitable giving in the United States was $307 billion in 2008 according to this report.
Nonprofit Industry Background
Large and Evolving Nonprofit Sector
The nonprofit sector is a large and vital part of the economy. The missions of NPOs span many aspects of our society including animal welfare, arts and culture, disaster relief, education, environment, healthcare, international development, professional and trade associations, public policy, religion and social and youth services. According to the National Center of Charitable Statistics, in 2009 there were over 973,000 public charities in the United States.
We define our target market as public charities that raise more than $50,000 in contributions annually, of which there were over 71,000 in 2009 in the United States according to GuideStar USA, Inc. We categorize our target market into enterprise NPOs that raise more than $10 million annually and mid-market NPOs that raise between $50,000 and $10 million annually. Many enterprise NPOs are comprised of multiple sites or chapters and have more staff resources, greater technical and functional
1
requirements and more complex operating environments. Mid-market NPOs are commonly more resource-constrained, seek more guidance and generally place a greater premium on ease-of-use and price. We estimate that the charities we target spend an estimated $25 billion annually on fundraising, of which we estimate $2.5 billion to be addressable by our solutions.
Challenges Facing Nonprofit Organizations
NPOs face unique challenges that center upon the need to reach new constituents and to engage effectively with a large and diverse number of existing constituents. In particular, NPOs struggle with the following challenges:
- •
- the high cost of fundraising;
- •
- outdated and inflexible donor management systems;
- •
- limited ability to act rapidly and quickly mobilize constituents;
- •
- higher expectations from constituents;
- •
- difficulty in sharing data across operational silos; and
- •
- limited technical and marketing resources.
NPOs spend large amounts of money on fundraising, advocacy and donor management. Many NPOs have adopted legacy donor databases to support their offline activities but have only recently begun to leverage online marketing as a mission-critical channel to reach and cultivate constituents. The emergence of the online channel has accentuated NPOs' struggles to integrate their online and offline communications and fundraising efforts. We believe the Internet and the increasing adoption of social media and mobile technologies are enabling NPOs to raise funds, advocate for change and cultivate relationships with their constituents in more cost-effective and engaging ways.
Our Solutions
We provide on-demand constituent engagement solutions to NPOs that enable them to more effectively raise funds, advocate for change and cultivate relationships with their constituents. COM enables NPOs to harness the full potential of the Internet and social media as new channels for constituent engagement and fundraising. Common Ground delivers next-generation donor management capabilities, integrates marketing activities across online and offline channels and is designed to increase operational efficiency. Our solutions are enhanced by a portfolio of value-added services tailored to our clients' specific needs.
With our solutions NPOs can:
- •
- extend their reach and raise more funds at a lower cost;
- •
- engage constituents more effectively;
- •
- act rapidly to mobilize constituents;
- •
- eliminate data and process silos;
- •
- easily adapt our solutions using our open platform;
- •
- reduce burden on limited resources; and
- •
- access best practices, knowledge and guidance based on our experience.
2
Business Strengths
We pioneered the delivery of software-as-a-service, or SaaS, online marketing solutions to NPOs, launching the first version of our solution in 2000. We have maintained an exclusive focus on NPOs which has enabled us to develop deep nonprofit industry expertise. We are a leading provider of on-demand constituent engagement solutions to NPOs, and we believe the following business strengths are key to our success:
- •
- leading online marketing solution for NPOs;
- •
- disruptive model for donor management market;
- •
- loyal clients producing predictable recurring revenue that scales with client growth;
- •
- marquee clients providing referrals and references that can shorten sales cycles;
- •
- nonprofit industry thought leadership;
- •
- ability to acquire and effectively serve NPOs of all sizes; and
- •
- portfolio of value-added services designed to enhance client success.
Our Strategy
Our objective is to be the leading worldwide provider of constituent engagement solutions for NPOs while continuing to lead the market in innovation, best practices and client service. Key elements of our strategy include:
- •
- continue to grow our client base;
- •
- retain and grow revenue from our existing client base;
- •
- disrupt the donor management market with Common Ground;
- •
- make complementary acquisitions; and
- •
- expand geographically.
Recent Developments (Unaudited)
Three Months Ended March 31, 2010
Our consolidated financial statements for the quarter ended March 31, 2010, our first fiscal quarter, are not yet available. Our expectations with respect to our unaudited results for the period discussed below are based upon management estimates and are the responsibility of Convio. Our independent registered public accounting firm has not audited, reviewed or performed any procedures with respect to these preliminary financial data and, accordingly, does not express an opinion or any other form of assurance with respect thereto. This summary is not meant to be a comprehensive statement of our unaudited financial results for this quarter and our actual results may differ from these estimates.
We are providing the following preliminary results as of and for the quarter ended March 31, 2010:
- •
- revenue of approximately $16.7 million;
- •
- net income of approximately $182,000;
- •
- cash and cash equivalents of approximately $16.2 million; and
- •
- net cash provided by operating activities of approximately $451,000.
3
Internal Use Software and Website Development Costs
We capitalize costs to develop software for internal use incurred during the application development stage as well as costs to develop significant upgrades or enhancements to existing internal use software. These costs are amortized on a straight-line basis over an estimated useful life of three years. Costs incurred to improve or enhance our products in 2007, 2008 and 2009 were expensed as incurred as these costs did not qualify as significant upgrades or enhancements. For the quarter ended March 31, 2010, we expect to capitalize approximately $225,000 of costs incurred to upgrade and enhance our internal use software. Our capitalization of similar costs in future periods could cause our financial results to fluctuate and be more difficult to predict.
Risks Associated With Our Business
We are subject to a number of risks of which you should be aware before you buy our common stock. These risks are discussed more fully in the section titled "Risk Factors" beginning on page 10. Some of these risks include:
- •
- we have a history of losses and we may not achieve profitability in the future, limiting growth;
- •
- our financial results will fluctuate, which could affect our stock price;
- •
- NPOs may not adopt our solutions, which would adversely impact our revenue and operating results;
- •
- our competitors may take actions that harm our business;
- •
- if clients do not renew and expand their subscriptions for our solutions, our revenue will be reduced; and
- •
- NPOs are price-sensitive, which could adversely affect our margins and harm our operating results.
Corporate Information
We were incorporated in Delaware in October 1999 under the original name of "ShowSupport.com, Inc." We acquired GetActive Software, Inc. in February 2007. We have been headquartered in Austin, Texas since inception. Our principal executive offices are located at 11501 Domain Drive, Suite 200, Austin, Texas 78758, and our telephone number is (512) 652-2600. Our corporate website address is www.convio.com. We do not incorporate the information contained on, or accessible through, our website into this prospectus, and you should not consider it part of this prospectus.
For convenience in this prospectus, Convio, we, us, and our refer to Convio, Inc. and its subsidiary, taken as a whole, unless otherwise noted. "GetActive" refers to GetActive Software, Inc., our wholly owned subsidiary, unless otherwise noted. "Convio," "Convio Online Marketing," "Constituent360," "Common Ground," "TeamRaiser," "GetActive" and other trademarks and service marks are the property of Convio. This prospectus contains additional trade names, trademarks and service marks of other companies. We do not intend for our use or display of other companies' trade names, trademarks or service marks to imply a relationship with, or endorsement or sponsorship of us, by these other companies.
4
| Common stock offered by Convio | 3,636,364 shares (or 4,406,273 shares if the underwriters exercise their option to purchase additional shares in full). | |
Common stock offered by the selling stockholders |
1,496,364 shares. |
|
Common stock to be outstanding after this offering |
16,279,507 shares (or 17,049,416 shares if the underwriters exercise their option to purchase additional shares in full). |
|
Option to purchase additional shares |
769,909 shares from us. |
|
Use of proceeds |
We intend to use the net proceeds from this offering for working capital and other general corporate purposes and to repay our credit facilities. We may also acquire other businesses, products or technologies. We do not, however, have agreements or commitments for any specific repayments or acquisitions at this time. We will not receive any proceeds from the sale of shares by the selling stockholders. See the section titled "Use of Proceeds." |
|
Risk factors |
You should read the section titled "Risk Factors" for a discussion of factors that you should consider carefully before deciding whether to purchase shares of our common stock. |
|
NASDAQ Global Market symbol |
CNVO |
The number of shares of common stock to be outstanding after this offering is based on 12,643,143 shares outstanding as of December 31, 2009. Such number of shares excludes:
- •
- 252,665 shares of common stock issuable upon the exercise of warrants outstanding as of December 31, 2009 to
acquire our common stock with a weighted average exercise price of $4.55 per share;
- •
- 3,128,602 shares of common stock issuable upon the exercise of options outstanding as of December 31, 2009
with a weighted average exercise price of $3.10 per share; and
- •
- 580,096 shares reserved for future issuance, and any automatic increases in the shares reserved for future issuance, under our 2009 Stock Incentive Plan.
Unless otherwise indicated, the information in this prospectus reflects and assumes:
- •
- a reverse split of each outstanding share of preferred stock and common stock into 0.352 of a share of preferred stock or
common stock, respectively, prior to the effectiveness of the registration statement of which this prospectus is a part;
- •
- the conversion of all outstanding shares of preferred stock and common stock into a single class of common stock
immediately prior to the closing of this offering;
- •
- the filing of our amended and restated certificate of incorporation and adoption of our amended and restated bylaws
immediately prior to the closing of the offering;
- •
- no exercise of options or warrants outstanding after December 31, 2009; and
- •
- no exercise by the underwriters of their option to purchase up to an additional 769,909 shares from us.
5
SUMMARY HISTORICAL FINANCIAL DATA
The summary historical consolidated statements of operations and other operating data for the years ended December 31, 2007, 2008 and 2009 and balance sheet data as of December 31, 2009 are derived from our audited financial statements included elsewhere in this prospectus. You should read this summary historical financial data in conjunction with the consolidated financial statements and related notes and the information under the sections titled "Selected Financial Data" and "Management's Discussion and Analysis of Financial Condition and Results of Operations" appearing elsewhere in this prospectus. See note 2 to our financial statements for a description of the calculation of basic and diluted net loss per share. Our historical results are not necessarily indicative of results for any future period.
| |
Year Ended December 31, | ||||||||||
|---|---|---|---|---|---|---|---|---|---|---|---|
| |
2007 | 2008 | 2009 | ||||||||
| |
(in thousands, except per share amounts) |
||||||||||
Statements of Operations Data: |
|||||||||||
Revenue: |
|||||||||||
Subscription and services |
$ | 38,754 | $ | 50,103 | $ | 54,900 | |||||
Usage |
4,329 | 6,877 | 8,186 | ||||||||
Total revenue |
43,083 | 56,980 | 63,086 | ||||||||
Cost of revenue |
18,716 |
22,911 |
24,779 |
||||||||
Gross profit |
24,367 | 34,069 | 38,307 | ||||||||
Operating expenses: |
|||||||||||
Sales and marketing |
19,428 | 21,432 | 21,556 | ||||||||
Research and development |
7,189 | 8,754 | 10,041 | ||||||||
General and administrative |
4,456 | 5,883 | 6,034 | ||||||||
Amortization of other intangibles |
1,271 | 1,452 | 1,400 | ||||||||
Write off of deferred stock offering costs |
— | 1,524 | — | ||||||||
Restructuring expenses |
284 | — | — | ||||||||
Total operating expenses |
32,628 | 39,045 | 39,031 | ||||||||
Loss from operations |
(8,261 |
) |
(4,976 |
) |
(724 |
) |
|||||
Interest income |
279 |
115 |
6 |
||||||||
Interest expense |
(883 | ) | (691 | ) | (355 | ) | |||||
Other income (expense) |
(1,644 | ) | 1,808 | (803 | ) | ||||||
Net loss before income taxes |
(10,509 | ) | (3,744 | ) | (1,876 | ) | |||||
Provision for income taxes |
— |
— |
219 |
||||||||
Net loss |
$ | (10,509 | ) | $ | (3,744 | ) | $ | (2,095 | ) | ||
Net loss per share—basic and diluted |
$ | (1.69 | ) | $ | (0.52 | ) | $ | (0.29 | ) | ||
Weighted average number of shares—basic and diluted |
6,257 | 7,257 | 7,313 | ||||||||
6
| |
Year Ended December 31, | ||||||||||
|---|---|---|---|---|---|---|---|---|---|---|---|
| |
2007 | 2008 | 2009 | ||||||||
| |
(in thousands, except per share amounts) |
||||||||||
Pro forma net loss per common share (unaudited): |
|||||||||||
Net loss attributable to common stockholders |
$ | (2,095 | ) | ||||||||
Change in value of convertible preferred stock warrant liability |
814 | ||||||||||
Net loss used to compute pro forma net loss per common share (unaudited) |
$ | (1,281 | ) | ||||||||
Basic and diluted weighted average shares used above |
7,313 |
||||||||||
Assumed reverse stock split and conversion of convertible preferred stock after effect of change in capital structure (unaudited) |
5,316 | ||||||||||
Pro forma weighted average number of shares—basic and diluted(1) (unaudited) |
12,629 | ||||||||||
Pro forma net loss per share—basic and diluted(1)(unaudited) |
$ |
(0.10 |
) |
||||||||
Other Operating Data: |
|||||||||||
Adjusted EBITDA(2)(unaudited) |
$ | (3,378 | ) | $ | 1,405 | $ | 6,581 | ||||
Net cash provided by (used in) operating activities |
(1,225 | ) | 2,862 | 6,791 | |||||||
- (1)
- Pro
forma weighted average shares outstanding reflects the reverse stock split and conversion of our convertible preferred stock (using the if-converted
method) into common stock as though the reverse stock split and conversion had occurred on the original dates of issuance.
- (2)
- We define Adjusted EBITDA as net income (loss) less interest income and gain (loss) on preferred stock warrant revaluation plus interest expense, provision for taxes, depreciation expense, amortization expense and stock-based compensation expense. Please see "Adjusted EBITDA" for more information and for a reconciliation of Adjusted EBITDA to our net income (loss) calculated in accordance with U.S. generally accepted accounting principles, or GAAP.
The amounts shown in the statements of operations data above include amortization of acquired technology and stock-based compensation expense as follows:
| |
Year Ended December 31, | |||||||||
|---|---|---|---|---|---|---|---|---|---|---|
| |
2007 | 2008 | 2009 | |||||||
| |
(in thousands) |
|||||||||
Amortization of acquired technology: |
||||||||||
Cost of revenue |
$ | 887 | $ | 1,016 | $ | 1,016 | ||||
Stock-based compensation: |
||||||||||
Cost of revenue |
$ | 164 | $ | 383 | $ | 583 | ||||
Sales and marketing |
300 | 585 | 742 | |||||||
Research and development |
85 | 235 | 343 | |||||||
General and administrative |
142 | 353 | 834 | |||||||
7
| |
As of December 31, 2009 | |||||||||
|---|---|---|---|---|---|---|---|---|---|---|
| |
Actual | Pro Forma(1) |
Pro Forma As Adjusted(2)(3) |
|||||||
| |
(in thousands) |
|||||||||
Balance Sheet Data: |
||||||||||
Cash and cash equivalents |
$ | 16,662 | $ | 16,662 | $ | 49,151 | ||||
Working capital |
2,379 | 3,754 | 37,106 | |||||||
Total assets |
41,344 | 41,344 | 73,833 | |||||||
Preferred stock warrant liability |
1,375 | — | — | |||||||
Long-term obligations, net of current portion |
1,348 | 1,348 | — | |||||||
Convertible preferred stock |
33,869 | — | — | |||||||
Total stockholders' equity (deficit) |
(18,909 | ) | 16,335 | 51,035 | ||||||
- (1)
- The
pro forma column in the balance sheet data table above reflects (i) the reverse split of each outstanding share of preferred stock and common
stock into 0.352 of a share of preferred stock or common stock, respectively, (ii) the conversion of all outstanding shares of preferred stock and common stock into an aggregate of 12,643,143
shares of a single class of common stock and (iii) the reclassification of the preferred stock warrant liability to common stock and additional paid-in capital immediately prior to
the closing of this offering.
- (2)
- The
pro forma as adjusted column in the balance sheet data table above reflects (i) the reverse split of each outstanding share of preferred stock
and common stock into 0.352 of a share of preferred stock or common stock, respectively, (ii) the conversion of all outstanding shares of preferred stock and common stock into an aggregate of
12,643,143 shares of a single class of common stock, (iii) the reclassification of the preferred stock warrant liability to common stock and additional paid-in capital immediately
prior to the closing of this offering, (iv) our sale of 3,636,364 shares of common stock in this offering, at an assumed initial public offering price of $11.00 per share and after
deducting the estimated underwriting discount and estimated offering expenses payable by us and the application of our net proceeds from this offering and (v) our repayment of approximately
$2.2 million outstanding under our credit facilities.
- (3)
- A $1.00 increase (decrease) in the assumed initial public offering price of $11.00 per share would increase (decrease) cash and cash equivalents, working capital, total assets and total stockholders' equity after this offering by approximately $3.4 million, assuming the number of shares offered by us, as set forth on the cover page of this prospectus, remains the same and after deducting the estimated underwriting discount and estimated offering expenses payable by us.
Adjusted EBITDA
We define Adjusted EBITDA as net income (loss) less interest income and gain (loss) on preferred stock warrant revaluation plus interest expense and provision for taxes, depreciation expense, amortization expense and stock-based compensation expense. We include Adjusted EBITDA in this prospectus because (i) we believe Adjusted EBITDA and similar measures are widely used by investors, securities analysts and other interested parties in our industry as a measure of financial performance and (ii) our management uses Adjusted EBITDA to monitor the performance of our business.
We also believe Adjusted EBITDA facilitates operating performance comparisons from period to period by excluding potential differences caused by variations in capital structures affecting interest income (expense), tax positions such as the impact of changes in effective tax rates, and the impact of depreciation and amortization expense.
8
Our use of Adjusted EBITDA has limitations as an analytical tool, and you should not consider it in isolation or as a substitute for analysis of our results as reported under GAAP. Some of these limitations are:
- •
- although depreciation and amortization are non-cash charges, the assets being depreciated and amortized may
have to be replaced in the future, and Adjusted EBITDA does not reflect cash capital expenditure requirements for such replacements;
- •
- Adjusted EBITDA does not reflect changes in, or cash requirements for, our working capital needs;
- •
- Adjusted EBITDA does not consider the potentially dilutive impact of equity-based compensation;
- •
- Adjusted EBITDA does not reflect the interest expense or the cash requirements necessary to service interest or principal
payments on our indebtedness;
- •
- Adjusted EBITDA does not reflect tax payments that may represent a reduction in cash available to us; and
- •
- other companies, including companies in our industry, may calculate Adjusted EBITDA differently, which reduces its usefulness as a comparative measure.
Because of these limitations, you should consider Adjusted EBITDA alongside other financial performance measures, including various cash flow metrics, net loss and our other GAAP results. The following table presents a reconciliation of Adjusted EBITDA to net loss, the most comparable GAAP measure, for each of the periods indicated:
| |
Year Ended December 31, | |||||||||
|---|---|---|---|---|---|---|---|---|---|---|
| |
2007 | 2008 | 2009 | |||||||
| |
(in thousands) |
|||||||||
Reconciliation of Adjusted EBITDA to net loss: |
||||||||||
Net loss |
$ | (10,509 | ) | $ | (3,744 | ) | $ | (2,095 | ) | |
Interest income (expense) |
604 | 576 | 349 | |||||||
Depreciation and amortization |
4,175 | 4,821 | 4,792 | |||||||
Stock-based compensation |
691 | 1,556 | 2,502 | |||||||
Gain (loss) on warrant revaluation |
1,661 | (1,804 | ) | 814 | ||||||
Provision for income taxes |
— | — | 219 | |||||||
Adjusted EBITDA |
$ | (3,378 | ) | $ | 1,405 | $ | 6,581 | |||
9
Investing in our common stock involves a high degree of risk. Before you decide to purchase shares of our common stock, you should consider carefully the risks described below together with the other information contained in this prospectus. If any of the following risks actually occur, our business, financial condition, results of operations and prospects could be materially and adversely affected. In such case, the trading price of our common stock could decline and you could lose part or all of your investment.
Risks Related to Our Business
We have a history of losses, and we may not achieve profitability in the future which could limit the growth of our business.
We have had operating losses each year since our inception in October 1999. We expect to incur additional costs and operating expenditures as we further develop and expand our operations. In addition, as a public company, we will incur additional legal, accounting and other expenses that we did not incur as a private company. While our revenue has grown in recent periods, this growth may not be sustainable, and we may not achieve sufficient revenues to achieve profitability in the future. Our operating expenses, which include sales and marketing, research and development and general and administrative expenses, are based on our expectations of future revenue and are, to a large extent, fixed in the short term. In addition, we may elect to spend more to grow our business in the future without certainty of near-term returns. Accordingly, we may not achieve profitability, and we may incur losses in the future, which could affect the market price of our common stock or harm our ability to raise additional capital.
Our financial results will fluctuate, and if we fail to meet the expectations of analysts or investors, our stock price and the value of your investment could decline substantially.
Our results of operations are difficult to forecast. We have experienced and expect to continue to experience fluctuations in revenue and operating results from quarter to quarter. In particular, our usage revenue is difficult to predict because it is derived from our clients' usage of our solutions for special events such as runs, walks and rides, and we recognize the associated revenue in the period reported and billed to the client. The growth, if any, and amount of usage revenue vary based on the number of events, the percent of funds raised online for these events, the growth and success of events and our signing of new clients for events. These factors are very difficult to predict, and our usage revenue fluctuates significantly as a result.
Our usage revenue reflects the general seasonality of special events which are held more often in the spring and fall. Therefore, we recognize a majority of our usage revenue in the second and third quarters. We recognized 67% and 63% of our annual usage revenue in the combined second and third quarters of 2008 and 2009, respectively. Usage revenue in the second and third quarters represented between 15% and 16% of total revenue for those periods in 2008 and 2009, respectively; whereas, usage revenue in the first and fourth quarters represented between 8% and 10% of total revenue for those periods in 2008 and 2009, respectively. Furthermore, although we experience seasonally lower usage revenue from special events during the first and fourth fiscal quarters, our operating expenses experience less of a reduction during those periods.
In addition, we experienced seasonality in our sales in the third quarter of 2008 and 2009, and as a result accrued lower commissions during those quarters. Such seasonality causes our quarterly operating results to fluctuate and be difficult to predict.
10
Other reasons for these fluctuations include but are not limited to:
- •
- our ability during any period or over time to sell our products and services to existing and new clients and to satisfy
our clients' requirements;
- •
- the addition or loss of clients, particularly enterprise clients, and our inability to forecast the timing and size of
larger deals;
- •
- changes in our pricing policies, whether independent or in reaction to a change by our competitors;
- •
- client renewal rates and unexpected early contract terminations or concessions;
- •
- the impact of general economic conditions on our clients and their ability to pay us in a timely manner;
- •
- the changing mix in our client base and revenue per client;
- •
- the amount and timing of our sales and marketing expenses, in particular commission and referral payments;
- •
- the impact of significant occurrences, such as natural disasters, on fundraising by NPOs, including those with missions
unrelated to these occurrences;
- •
- the expansion and increasing complexity of our multiple solutions and our business generally;
- •
- the timing of project and milestone achievements under our services arrangements and the related revenue recognition;
- •
- the amount and timing of third-party contracting fees;
- •
- the impact of any security incidents or service interruptions;
- •
- the timing and significance of the introduction of new products and services by us and our competitors;
- •
- our regulatory compliance costs;
- •
- any impairment of our intangible assets;
- •
- any introduction of new accounting rules; and
- •
- future costs related to acquisitions of technologies or businesses and their integration.
We believe that our results of operations, including the levels of our revenue and operating expenses, will vary in the future and that period-to-period comparisons of our operating results may not be meaningful. If our financial results fall below the expectations of securities analysts or investors, our stock price and the value of your investment could decline substantially. You should not rely on the results of any one quarter as an indication of future performance.
If NPOs do not adopt our solutions, our revenue and operating results will be adversely impacted.
Our ability to generate revenue and achieve profitability depends on the adoption of our solutions by NPOs of all sizes. We cannot be certain that the demand of NPOs for solutions such as ours will continue to develop and grow at its historic rates, if at all. We also do not know to what extent NPOs will be successful utilizing our solutions to engage constituents and generate funds. The less they are able to do so, the less revenue we will generate.
We initially began our business with one solution and now offer multiple products and services. As we grow, we plan on offering new solutions and services in the future. We cannot be certain that NPOs will elect to use our solutions or want or need the functionality of our new solutions and service offerings. As a result, as NPOs become more comfortable and sophisticated in their use of technology for their
11
constituent relationship needs, we may fail to develop and offer solutions and services that meet NPOs' needs in this area, and our revenue may not grow.
Factors that may affect market adoption of our solutions, some of which are beyond our control, include:
- •
- reluctance by NPOs to adopt on-demand solutions;
- •
- the price and performance of our solutions;
- •
- our ability to integrate with other solutions used by NPOs;
- •
- the impact of the economic downturn on NPOs, their fundraising and their spending on technology and services;
- •
- the purchasing cycles of NPOs;
- •
- the level of customization we can offer;
- •
- the availability, performance and price of competing products and services, including internally developed solutions and
general solutions not designed specifically for NPOs;
- •
- the breadth and quality of our service offerings;
- •
- the concerns related to security and the reluctance by NPOs to trust third parties to store and manage their internal
data; and
- •
- any adverse publicity about us, our solutions or the viability, reliability or security of on-demand software solutions generally from third-party reviews, industry analyst reports and adverse statements made by clients and competitors.
While no one client accounted for more than 10% of our revenue in 2009, our enterprise clients can contribute substantially to our revenue from quarter to quarter. If NPOs, especially enterprise NPOs, do not continue to adopt and renew their subscriptions to our solutions, our revenues will experience volatility and our stock price could fall.
Our business depends on our clients' renewing and expanding their subscriptions for our solutions. Any decline in our client renewals and expansions would reduce our revenue.
We sell solutions pursuant to agreements that are generally three years in length for Convio Online Marketing and one year in length for Common Ground. Our clients have no obligation to renew their subscriptions for our solutions after the expiration of their initial subscription period. Our client renewal rates may decline or fluctuate and our client cancellation rates may increase or fluctuate as a result of a number of factors, including the following:
- •
- a client switches to a competitor;
- •
- a client terminates its agreement with us due to employee turnover in the client organization;
- •
- a client is dissatisfied with our agreement terms;
- •
- a client encounters financial difficulties;
- •
- our solutions do not continue to fit a client's needs as they evolve; and
- •
- our client has a poor service experience with our partners or us.
If clients do not renew their agreements, our revenue will decline and our operating results will be adversely affected.
12
We seek to grow our business by expanding the products and services our clients buy from us as their needs evolve. However, if our clients fail to buy additional products and services from us, the growth of our business will be harmed. Further, if our clients elect to subscribe to a fewer number of products upon renewal with us, our business will be harmed.
Some of our agreements also provide that our clients may terminate their agreements for convenience after a specified period of time. Some of our agreements allow a client to cancel during the first year of such client's initial subscription for our solutions for performance-related reasons. If our clients terminate their agreements with us, our revenue will grow more slowly than expected or even decline, and we may not be able to achieve profitability. Further, if a client seeks to terminate its agreement with us, we may not be successful in enforcing, or we may not elect to enforce, our agreement with the client.
We serve a broad range of NPOs, the less established of whom may be subject to a higher rate of insolvency or may have limited durations due to the underlying causes that they support, such as political campaigns. We are generally not able to perform financial due diligence on the creditworthiness of our prospective clients, and we may not accurately predict a client's creditworthiness. As a result, if we are unable to collect from our clients, our revenue and cash flows could be less than what we expect.
Many NPOs are price sensitive, and if the prices we charge for our solutions are unacceptable to NPOs, our operating results will be harmed.
Many NPOs are price sensitive. As the market for our solutions matures, or as new competitors introduce new products or services that compete with ours, we may be unable to renew our agreements with existing clients or attract new clients at prices that sustain historical margins.
In addition, poor general economic conditions have led to our offering sales promotions and to our clients' renegotiating their pricing and contract terms as well as requesting other concessions, especially during their contract's renewal period. These promotions and concessions can adversely impact our operating results. These general economic conditions can also lead our competitors to aggressively price their product offerings, further intensifying the pricing pressure on our solutions. Furthermore, demand for our more comprehensive and higher-priced solutions may decline. As a result, our revenue, gross margin and operating results may be adversely affected.
Because we expense commissions associated with sales of our solutions immediately upon execution of a subscription agreement with a client and generally recognize the revenue associated with such sale over the term of the agreement, our operating income in any period may not be indicative of our financial health and future performance.
We expense commissions paid to our sales personnel in the period in which we enter into an agreement for the sale of our solutions. In contrast, we generally recognize the revenue associated with a sale of our solutions ratably over the term of the subscription agreement, which is typically three years for COM and one year for Common Ground. Although we believe increased sales is a positive indicator of the long-term health of our business, increased sales, particularly sales to enterprise clients, would increase our operating expenses and decrease earnings in any particular period. Thus, we may report poor operating results due to higher sales commissions in a period in which we experience strong sales of our solutions. Alternatively, we may report better operating results due to the reduction of sales commissions in a period in which we experience a slowdown in sales. Therefore, you should not rely on our operating income during any one quarter as an indication of our financial health and future performance.
13
Because we generally recognize revenue from sales of our products and services ratably over the term of our agreements, downturns or upturns in sales may not be immediately reflected in our operating results.
We generally recognize revenue on a subscription basis, meaning we recognize the revenue ratably over the terms of our clients' agreements. We typically do not invoice clients the full contract amount at the time of the execution of an agreement. Rather, we invoice our clients periodically based on our arrangement with each client. We record deferred revenue when we invoice a client and only with respect to the invoiced amount for such period, but we only recognize the corresponding revenue ratably over the term of the agreement. As a result, deferred revenue is not an effective determinant of sales or predictor of revenue in any particular period, and much of the revenue we recognize in any quarter may be from deferred revenue from previous quarters. A decline in new or renewed subscriptions in any one quarter may not result in a decrease in revenue in such quarter but will negatively affect our revenue in future quarters. We may be unable to adjust our cost structure to reflect these reduced revenues. Accordingly, downturns in sales or renewals of our products and services will adversely impact revenue and operating results on an on-going basis in future periods.
We anticipate that our new Common Ground application will help us to grow our business, but if NPOs do not adopt Common Ground, the growth in our revenue could be limited and our business harmed.
We introduced our Common Ground application in September 2008. As of December 31, 2009, over 170 NPOs had adopted Common Ground. We expect to increase our spending on research and development and sales and marketing to expand the number of Common Ground clients and the revenue we generate from these clients.
Common Ground is a new product, and if NPOs do not adopt Common Ground, then our business will have difficulty growing and will be harmed. We believe Common Ground's acceptance and adoption by NPOs will be dependent upon, among other things, Common Ground's functional breadth, quality, ease of use, performance, reliability, and cost effectiveness. Even if the advantages of Common Ground over legacy solutions are established, we are unable to predict to what extent Common Ground will be adopted in the marketplace.
We plan on releasing more functionality for our Common Ground application. The introduction of these new features may replace sales of our Convio Online Marketing solution, thereby offsetting the benefit of a successful feature introduction. This could harm our operating results by decreasing sales of our higher priced solution, exposing us to greater risk of decreased revenues. Any or all of the above occurrences could harm our business and results of operations.
We do not have any control over the availability or performance of salesforce.com's Force.com platform, and if we or our clients encounter problems with it, we may be required to replace Force.com with another platform, which would be difficult and costly.
Common Ground runs on salesforce.com's Force.com platform, and we do not have any control over the Force.com platform or the prices salesforce.com charges our NPO clients. salesforce.com may discontinue or modify Force.com. salesforce.com could also increase its fees or modify its pricing incentives for NPOs. If salesforce.com takes any of these actions, we may suffer lower sales, increased operating costs and loss of revenue from Common Ground until equivalent technology is either developed by us, or, if available, is identified, obtained and integrated.
In addition, we do not control the performance of Force.com. If Force.com experiences an outage, Common Ground will not function properly, and our clients may be dissatisfied with our Common Ground application. If salesforce.com has performance or other problems with its Force.com platform,
14
they will reflect poorly on us and the adoption and renewal of our Common Ground application and our business may be harmed.
We encounter long sales cycles, particularly for our largest clients, which could have an adverse effect on the size, timing and predictability of our revenue and cash flows.
Generally, our sales cycles last between three and nine months, but in the case of enterprise NPOs our sales cycle can last longer. Potential clients, particularly our larger clients, generally commit significant resources to an evaluation of available technologies and require us to expend substantial time, effort and money educating them as to the value of our solutions. We may expend significant funds and management resources during a sales cycle and ultimately fail to close the sale. The sales cycle for our solutions is subject to significant risks and delays over which we have little or no control, including:
- •
- our clients' budgetary constraints;
- •
- the timing of our clients' budget cycles and approval processes;
- •
- our competitors' offerings and sales activities;
- •
- our clients' willingness to replace their current methods or solutions;
- •
- our clients' employee turnover rates; and
- •
- our need to educate potential clients about the uses and benefits of our solutions.
If we are unsuccessful in closing sales after expending significant funds and management resources or if we experience delays in our sales cycles, the size, timing and predictability of our revenue and cash flows could be harmed.
Interruptions, delays or security breaches at third-party datacenters or by our payment processors could impair the delivery of our solutions and harm our reputation and business.
We host our solutions and serve all of our clients from two third-party datacenters, one located in Austin, Texas and the other in Sacramento, California. Any interruptions or problems at either datacenter would likely result in significant disruptions in our solutions hosted at such site. We do not control the operation of these datacenters, and each is vulnerable to damage or interruption from earthquakes, floods, fires, power loss, telecommunications failures and similar events. Each datacenter is also subject to break-ins, sabotage, intentional acts of vandalism and similar misconduct. Despite precautions at each datacenter, the occurrence of a natural disaster or an act of terrorism, a decision to close a datacenter without adequate notice or other unanticipated problems such as work stoppages at a datacenter could result in interruptions or delays in our solutions and our failure to meet our service level commitments to our clients. Neither datacenter is currently configured to provide failover services to the other datacenter in the event services at a facility are interrupted. Each datacenter has no obligation to renew its agreement with us on commercially reasonable terms, or at all. If we are unable to renew our agreement with a datacenter on commercially reasonable terms, we may experience costs or downtime in connection with the transfer to a new third-party datacenter.
In addition, we rely on third-party providers for payment processing of funds contributed to our clients by their constituents. Such third-party providers have experienced significant downtime in the past due to high transaction volumes and may experience similar downtime in the future. Although substantially all of our subscription agreements do not provide service level commitments relating to payment processing services provided by third parties, any interruptions in our solutions may cause harm to our reputation, cause clients to terminate their subscription agreements and harm our renewal rates.
15
We provide service level commitments to our clients, which could cause us to issue credits for future products and services if the stated service levels are not met for a given period and could significantly harm our reputation and operating results.
We provide service level commitments in our subscription agreements. Our transaction volumes are erratic, and our volumes spike significantly during large special events or major occurrences such as natural disasters. High transaction volumes can cause delays in response times. If we are unable to meet stated service level commitments, we may be contractually obligated or choose to provide clients with refunds or credits for future products and services. We may not be able to recover from our third-party datacenters any refunds or credits that we provide to our clients. Our revenue could also be adversely affected if we suffer unscheduled downtime that exceeds the allowed downtimes under our agreements with our clients. Any service outages could harm our reputation, decrease our revenue and increase our operating costs.
If we are not able to develop enhancements to, and new features for, our existing solutions or acceptable new products and services that keep pace with technological developments, we may lose clients or fail to sell our solutions to new clients.
We intend to develop or license enhancements to and new features for our solutions to keep pace with rapid technological developments and to improve our solutions. The success of such enhancements, new features and services depends on several factors, including their timely completion, the license on acceptable terms of software from third parties and the introduction and market acceptance of such enhancements, features or services. Failure in this regard may significantly impair our ability to compete effectively and cause us to lose existing clients or fail to sell our solutions to new clients. In addition, because the software underlying our solutions is designed to operate on a variety of network hardware and software platforms using a standard browser, we will need to continuously modify and enhance our solutions to keep pace with changes in Internet-related hardware, software, communication, browser and database technologies. We may not be successful in either developing these modifications and enhancements or bringing them to market in a timely manner. Furthermore, uncertainties about the timing and nature of new network platforms or technologies, or modifications to existing platforms or technologies could increase our research and development expenses. Any failure of our solutions to operate effectively with future network platforms and technologies could reduce the demand for our solutions.
Our solutions, and in particular our new Common Ground application, may contain errors or defects, negatively affecting their adoption which may cause us to lose clients and reimburse fees.
Our solutions are novel and complex and, accordingly, may contain undetected errors or failures when first introduced or as new enhancements are released. This may result in the loss of, or delay in, market acceptance of our new solutions. We have in the past discovered software errors in our solutions and new solutions after their introduction. We have experienced delays in release, lost revenues and customer frustration during the period required to correct these errors. We may in the future discover errors and scalability limitations in new solutions, such as Common Ground, after they become available or be required to compensate customers for such limitations or errors. In addition, our clients may use our solutions in unanticipated ways that may cause a disruption in our solutions for other clients. Since our clients use our solutions for mission-critical processes, any errors, defects or disruptions in, or other performance problems with, the software underlying our solutions could harm our reputation and may damage our clients' activities. If that occurs, clients could elect not to renew or delay or withhold payment to us, we could lose future sales and clients may make claims against us.
16
If our solutions do not scale to accommodate a high volume of traffic and transactions, we may experience client dissatisfaction and fail to grow our revenue.
We seek to generate a higher volume of website traffic and other electronic transactions for our clients as part of our product and service offerings. Our transaction volumes are erratic, and our volumes spike significantly during large special events and major occurrences such as natural disasters. In addition, high transaction volumes can cause delays in response times. The satisfactory performance, reliability and availability of our solutions, including our network infrastructure, are critical to our reputation and our ability to attract and retain new clients. Any system interruptions that result in the unavailability or under-performance of our solutions would reduce the volume of traffic and transactions processed on our system for our clients and may also diminish the attractiveness of our solutions to our clients. Furthermore, our inability to add software and hardware or to develop and further upgrade our existing technology or network infrastructure to accommodate increased traffic or increased transaction volume may cause unanticipated system disruptions, slower response times, degradation in levels of client service and impaired quality of the users' experience. We expect to continue to upgrade our solutions, but we may be unable to upgrade and expand our solutions effectively or to integrate efficiently any new technologies with our existing solutions. Any inability to do so would harm our reputation, ability to maintain our client relationships and growth of our business.
In addition, most of our subscription agreements provide for higher revenue as the volume of client traffic and transactions increase over the term of the agreement. If we are unable to scale our solutions to effectively accommodate a higher volume of traffic and transactions, we will not be able to realize an increase in our revenue.
The market in which we operate is intensely competitive, and our failure to compete successfully would cause our revenue and market share to decline.
The market in which we operate is fragmented, competitive and rapidly evolving, and there are limited barriers to entry for some aspects of this market. Competitive pressures can adversely impact our business by limiting the prices we can charge our clients and making the adoption and renewal of our solutions more difficult. With Convio Online Marketing, we compete with several online marketing solutions and a variety of point applications targeted at tasks such as email marketing, content management and fundraising event management. With Common Ground, we compete with generic database providers, as well as industry-specific donor management solutions. Some of our competitors are focused exclusively on the nonprofit industry while others sell to NPOs among a broader set of target industries. Our primary competitors are Blackbaud, Inc., The Sage Group plc and SunGard Data Systems, Inc. In addition, we compete with a variety of smaller, private companies, and also with custom web development providers, which provide custom in-house applications. Any of these competitors could take actions that adversely affect our business.
Other larger potential competitors, such as Microsoft Corporation, Oracle Corporation and salesforce.com, Inc., could make acquisitions or develop solutions to establish or expand their presence in the nonprofit market. Smaller competitors, such as those providing open source solutions, web development services and content management, email marketing and other point tools, may strengthen their offerings through internal development or acquisitions and enhance their respective ability to compete. Other competitors have established or strengthened cooperative relationships with strategic partners serving the nonprofit market, thereby limiting our ability to promote our solutions and the number of partners available to help market our products and services. These competitive pressures could cause our revenue and market share to decline.
17
If we are not able to manage our anticipated growth effectively, our operating costs may increase and our operating margins may decrease.
We will need to grow our infrastructure to address potential market opportunities. Our growth has placed, and will continue to place, to the extent that we are able to sustain such growth, a significant strain on our management, administrative, operational and financial infrastructure. We anticipate that further growth will be required to address increases in our client base, as well as our planned expansion into new geographic areas. If we continue to grow our operations, we may not be effective in enlarging our physical facilities and our systems and our procedures or controls may not be adequate to support such expansion or our business generally. If we are unable to manage our growth, our operating costs may increase and our operating margins may decrease.
If we do not migrate GetActive's clients, we may not realize the expected benefits of our acquisition of GetActive, and our business may be harmed.
In February 2007, we acquired GetActive to enhance and broaden our service offerings. Since the closing of the acquisition, we have been migrating former GetActive clients to our COM platform, and we intend to phase-out the GetActive platform by the end of 2010. If our remaining migration activities are unsuccessful, our reputation could be harmed, our revenue could decrease and our operating costs could increase.
We depend on our direct sales force and our partner network for sales and deployments of our solutions and, if we do not attract and retain our sales personnel or maintain our partner relationships, our revenue may not grow and our business could be harmed.
We depend primarily on our direct sales force to obtain new clients and to manage our client base. There is significant competition for direct sales personnel with the advanced sales skills and technical knowledge that sales of our solutions require. Our ability to achieve significant revenue growth in the future will depend, in large part, on our success in recruiting, training and retaining sufficient numbers of direct sales personnel.
We complement our direct sales personnel with a network of over 55 partners serving the nonprofit market, including interactive agencies, direct marketing agencies, public affairs firms and complementary technology companies. Our partner network helps us grow our client base and, we believe, enables us to provide more complete solutions for our clients. If our partners fail to increase awareness of our solutions or to assist us in gaining access to decision-makers at NPOs, then we may need to increase our marketing expenses, change our marketing strategy or enter into marketing relationships with different parties, any of which could impair our ability to generate increased revenue. Our typical partner agreement is not exclusive and our partners may choose not to promote sales of our solutions. If we do not maintain and increase our partner relationships, our revenue may not grow and could decline.
We also rely on third-party implementation providers whom we recommend to our clients to deploy COM and Common Ground. In the case of Common Ground, to date we have relied solely on third-party implementation providers to provide deployment services. Any failure to perform, unprofessional conduct, delays or difficulties with the deployment on the part of such third-party implementation providers may reflect poorly on our reputation and the marketability of our solutions, which could harm our business and results of operations. Our agreements with these third-party implementation providers do not obligate them to continue to deploy our solutions. Generally our clients enter into agreements directly with the third-party implementation providers, so we have limited ability to seek recourse from them if deployment issues arise with clients.
18
We rely on third-party software in our solutions that may be difficult or costly to replace or which could cause errors or failures and harm our reputation.
We rely on software licensed from third parties in order to offer our solutions, including database software from Oracle Corporation. The third-party software may not continue to be available on commercially reasonable terms, or at all. Any loss of the right to use any necessary third-party software could result in delays in the provisioning of our solutions until equivalent technology is either developed by us, or, if available, is identified, obtained and integrated, which could harm our reputation and increase our operating costs. Any errors or defects in third-party software could result in errors or a failure of our solutions which could harm our reputation and be costly to correct. Many of our third-party providers attempt to impose limitations on their liability for errors, defects, or failures in their hardware, software, or services, which we are required to pass through to our clients. Those limitations may or may not be enforceable, and we may have liability to our clients or providers that could harm our reputation and increase our operating costs.
If we fail to retain key personnel or if we fail to attract additional qualified personnel or if newly hired personnel fail to reach productivity as anticipated, we may not be able to achieve our anticipated level of growth, our revenue may decrease and our operating costs may increase.
Our future success depends upon the continued service of our officers and other key finance, sales and marketing, research and development and professional services staff. In addition, our future success will depend in large part on our ability to attract a sufficient number of highly qualified personnel, and there can be no assurance that we will be able to do so. Competition for qualified personnel can be intense, and we might not be successful in attracting and retaining them. The pool of qualified personnel with experience working with or selling to NPOs is limited overall and specifically in Austin, Texas, Washington, D.C., and Berkeley, California, where a significant portion of our operations are located. If we fail to retain key personnel or attract a sufficient number of highly qualified personnel, we may expend more resources in an effort to recruit qualified personnel and our operating costs would increase. In addition, the diversion of management's attention to recruiting efforts may cause our sales and revenue to decrease.
Our ability to maintain and expand our finance, sales and marketing, research and development and professional services teams will depend on our ability to recruit, train and retain top quality people with advanced skills who understand sales to, and the specific needs of, NPOs. For these reasons, we have from time to time in the past experienced, and we expect to continue to experience in the future, difficulty in hiring and retaining highly skilled employees with appropriate qualifications for our business. In addition, it takes time for our new sales and services personnel to become productive, particularly with respect to obtaining and supporting enterprise clients. If we are unable to hire or retain qualified personnel, or if newly hired personnel fail to develop the necessary skills or reach productivity slower than anticipated, it would be more difficult for us to sell our solutions and provide services to our clients, and we could experience a shortfall in revenue and may not achieve our planned growth.
Various private spam blacklists have in the past reduced, and may in the future reduce, the effectiveness of our solutions and our ability to conduct our business, which may cause demand for our solutions to decline.
We depend on email to market to and communicate with our clients, and our clients rely on email to communicate with their constituents. Various private entities attempt to limit the use of email for commercial solicitation. These entities often advocate standards of conduct or practice that exceed current legal requirements in the United States and classify certain email solicitations that comply with current legal requirements as spam. Some of these entities maintain "blacklists" of companies and individuals, and the websites, Internet service providers and Internet protocol addresses associated with those entities or individuals that do not adhere to those standards of conduct or practices for commercial
19
email solicitations that the blacklisting entity believes are appropriate. If a company's Internet protocol addresses are listed by a blacklisting entity, emails sent from those addresses may be blocked by servers that receive or route email and subscribe to the blacklisting entity's service or purchase its blacklist. Any blocking of email communications generated by clients using our solutions will reduce the effectiveness of our solutions and our ability to conduct our business, which may cause demand for our solutions to decline and increase non-renewals.
Government regulation could increase our compliance expenses, subject us to fines or penalties of non-compliance or adversely affect the marketability of our solutions.
We are subject not only to laws and regulations applicable to businesses generally, but also to laws and regulations directly applicable to electronic commerce and fundraising activities. In addition, our clients are subject to United States and foreign laws and regulations governing the collection, use and disclosure of personal information obtained from individuals, which restrict how our clients use our solutions. There are many laws and regulations related to electronic commerce and online fundraising, and state, federal and foreign governments may adopt or enforce additional laws and regulations applicable to our business and to our clients' use of our solutions. If the burdens or costs of our clients' compliance with additional regulations increase, NPOs may decide not to use our solutions. Further, our failure to comply with any such laws or regulations could subject us to fines, penalties or other damages that could harm our reputation and increase our operating costs.
The promulgation, amendment or enforcement of any laws or regulations in the following areas could increase our compliance expenses:
- •
- charitable fundraising and related services;
- •
- campaign finance;
- •
- user privacy and notification statutes;
- •
- the transmission and storage of personal data;
- •
- the pricing and taxation of products and services offered over the Internet;
- •
- money laundering;
- •
- transactions or sales to terrorist organizations or to nations which sponsor terrorist activities;
- •
- the content of websites;
- •
- patents, copyrights, trade secrets, trademarks and other areas of intellectual property;
- •
- consumer protection, including the potential application of "do not call" registry requirements on our clients;
- •
- freedom of speech and expression;
- •
- the online distribution of specific material or content over the Internet;
- •
- the characteristics and quality of products and services offered over the Internet; and
- •
- federal, state or local taxation, particularly with respect to charitable giving, research and development activities, employee compensation and other activities generally pertaining to our business.
We are also subject to certain state registration and periodic filing requirements related to companies that provide fundraising consulting services. States' regulations vary and the application of these regulations to our business is unclear. Our clients rely in part on our registrations in states that require registration to conduct our clients' national fundraising campaigns. As of December 31, 2009, we were
20
registered in five states and had registrations pending in nine others. If we fail to comply with any of these regulations, our registrations could be revoked or we may be prevented from registering, and our clients could terminate their agreements with us if we do not meet their fundraising needs in those states. In addition, we could incur fines, penalties or other damages that could harm our reputation and increase our operating costs, and we may be obligated to file client agreements that may disclose competitively sensitive information. Furthermore, the states in which we are registered may impose new requirements and additional states may adopt registration requirements that may increase our compliance expenses.
Evolving privacy concerns and laws or other domestic or foreign regulations may reduce the effectiveness of our solutions, which could reduce overall demand for our solutions and increase operating costs.
Our clients can use our solutions to store personal or identifying information regarding their constituents. Federal, state and foreign government bodies and agencies, however, have adopted or are considering adopting laws and regulations regarding the collection, use and disclosure of personal information obtained from consumers and other individuals. For instance, as part of the American Recovery and Reinvestment Act of 2009, Congress passed the Health Information Technology for Economic and Clinical Health Act, or HI-TECH Act. The HI-TECH Act expands the reach of data privacy and security requirements of the Health Insurance Portability and Accountability Act, or HIPAA, to service providers. HIPAA and associated United States Department of Health and Human Services regulations permit our clients in the healthcare industry to use certain demographic protected health information (such as name, email or physical address and dates of service) for fundraising purposes and to disclose that subset of protected health information to their service providers for fundraising. We may be included in this service provider group under the revised HIPAA regulations by virtue of our service provider relationship with our clients in the healthcare industry. In general, we are seeking to prohibit contractually our healthcare industry clients from uploading other types of health information of their clients into our systems because HIPAA does not permit this information to be used for fundraising without certain permissions, but we believe that monitoring our healthcare clients' compliance with such prohibitions is not legally required of service providers and would be cost prohibitive. The law and regulations under HI-TECH are new and still subject to change or interpretation by legal authorities who could cause additional compliance burdens.
The costs of compliance with, and other burdens imposed by, HIPAA, the HI-TECH Act and such other laws and regulations that are applicable to the businesses of our clients may limit the use and adoption of our solutions, reduce overall demand for our solutions and increase our operating costs, and we may be unable to pass along those costs to our clients in the form of increased fees.
In addition to government activity, privacy advocacy groups and the technology and other industries are considering various new, additional or different self-regulatory standards that may place additional burdens on us. If regulatory burdens related to collection and use of personal information increase, our solutions would be less effective, which may reduce demand for our solutions and harm our business.
United States federal legislation entitled Controlling the Assault of Non-Solicited Pornography and Marketing Act of 2003 imposes certain obligations on the senders of commercial emails, which could minimize the effectiveness of our email product and establishes financial penalties for non-compliance, which could increase the costs of our business.
In December 2003, Congress enacted Controlling the Assault of Non-Solicited Pornography and Marketing Act of 2003, or the CAN-SPAM Act, which establishes civil penalties for failure to meet certain requirements for commercial email messages (which may include email messages sent by NPOs that advertise a commercial product or service) and specifies criminal and civil penalties for the transmission of commercial email messages that are intended to deceive the recipient as to source, transmission path or content. The CAN-SPAM Act, among other things, obligates the sender of commercial emails to identify
21
their recipients with the ability to opt out of receiving future emails from the sender. In addition, some states have passed laws regulating commercial email practices that are significantly more punitive and difficult to comply with than the CAN-SPAM Act. For example, Utah and Michigan have enacted do-not-email registries listing minors who do not wish to receive unsolicited commercial email that markets certain covered content, such as products that minors are prohibited from purchasing. Some portions of these state laws may not be preempted by the CAN-SPAM Act. The ability of our clients' constituents to opt out of receiving commercial emails may minimize the effectiveness of our email product. Moreover, non-compliance with the CAN-SPAM Act can involve significant financial penalties. In addition, European Union member state laws typically prohibit sending promotional email messages outside of an established business relationship with the recipient unless the recipient has opted into receipt of such messages and require honoring opt-out requests by recipients. Such laws largely prevent the use of email to new prospects in the European Union, and similar laws have been adopted in some countries. Although our agreements prohibit violations of these laws, if we were found to be in violation of the CAN-SPAM Act, applicable state laws not preempted by the CAN-SPAM Act, or European Union or foreign laws regulating the distribution of commercial email, whether as a result of violations by our clients or if we were deemed to be directly subject to and in violation of these requirements by the future interpretation of such laws by a court of law or regulatory agency, we could be required to pay penalties or we may be required to change one or more aspects of the way we operate our business, which could impair our ability to attract and retain clients or increase our operating costs.
We may be subject to legal costs and liabilities for content and activities of our clients and their constituents, which could harm our reputation and increase our operating costs.
We host content provided by our clients and their constituents and provide products and services that enable them to exchange information, conduct business and engage in various online activities. From time to time, we are requested to provide information or otherwise become involved in legal and other matters involving our clients' online activities. While we require our clients to agree to comply with acceptable usage policies and other content restrictions, clients and their constituents may provide content or undertake activities that could require us to conduct investigations or defend claims by private persons and entities or governmental entities that may be with or without merit and may subject us to legal costs and liabilities to our third-party suppliers and others, which could harm our reputation and increase our operating costs.
If existing clients and prospective clients refuse to adopt or renew our solutions, or we choose not to engage a prospective client, because of conflicts over ideological missions, our revenue will not grow at our anticipated rate.
Our clients have a wide range of ideological missions. Many NPOs focus upon and support ideological causes that may conflict with the ideological causes of our other clients. A few prospective clients in the past have hesitated or refused to use our solutions because of our relationship with NPOs with ideologies that directly conflict with the ideologies of such prospective clients. If the number of our clients grow, the potential for such conflict will increase. We have adopted a policy of working with NPOs supporting a wide range of ideological missions other than those that promote violence, hatred, or racial or religious intolerance. We will exercise our judgment in determining whether an organization violates the spirit of these client engagement principles. Based on these principles, we have and may continue in the future to choose not to engage prospective client NPOs. If our prospective clients refuse to adopt our solutions, if we choose not to engage a prospective client, or if our existing clients do not renew or otherwise terminate their use of our solutions due to such conflicts, our revenue may be adversely affected and our reputation may be harmed.
22
Changes in financial accounting standards or practices may cause adverse, unexpected financial reporting fluctuations and harm our operating results.
A change in accounting standards or practices could harm our operating results and may affect our reporting of transactions completed before the change is effective. New accounting pronouncements and varying interpretations of accounting pronouncements have occurred and may occur in the future. Changes to existing rules or the questioning of current practices may harm our operating results or the way we conduct our business.
We may incur significant expenses to defend against or settle claims that we infringe upon third parties' intellectual property rights.
Litigation regarding intellectual property rights is common in the software industry. We expect that our solutions may be increasingly subject to third-party infringement claims as the number of competitors in our industry segment grows and the functionality of products and services in different industry segments overlaps. We have encountered and may encounter in the future disputes over rights and obligations concerning intellectual property. In the past, we have been involved in litigation with Kintera, Inc., which was acquired by Blackbaud, Inc. Third parties may seek to bring claims against us in the future. Such claims may be with or without merit. Any litigation to defend against claims of infringement or invalidity could result in substantial costs and diversion of resources. Furthermore, a party making such a claim could secure a judgment that requires us to pay substantial damages. A judgment could also include an injunction or other court order that could prevent us from selling our solutions. Our operating costs may increase or our revenue may decline if any of these events occurred.
In addition, we generally indemnify our clients against certain claims that our solutions infringe upon the intellectual property rights of others. We could incur substantial costs in defending ourselves and our clients against infringement claims and paying any resulting damage awards or settlements. In the event of a claim of infringement, we and our clients might be required to obtain one or more licenses from third parties. We, or our clients, might be unable to obtain necessary licenses from third parties at a reasonable cost, if at all. We, or our clients, might become subject to an injunction that prevents use of the allegedly infringing technology. Any intellectual property rights claim against us or our clients, with or without merit, could be time-consuming, expensive to litigate or settle and could divert management attention and financial resources. An adverse determination also could prevent us from offering our solutions to our clients and may require that we procure or develop a substitute solution that does not infringe.
For any intellectual property rights claim against us or our clients, we may have to pay damages or stop using technology found to be in violation of a third party's rights. We may have to seek a license for the technology, which may not be available on reasonable terms, if at all, may significantly increase our operating expenses or may require us to restrict our business activities in one or more respects. As a result, we may also be required to develop alternative non-infringing technology, which could require significant effort and expense. Defense of any lawsuit, the cost of any damages or settlements, failure to obtain any such required licenses or issuance of an injunction would increase our operating costs and may reduce our revenue.
If the security of the software or systems underlying our solutions is breached, our reputation could be harmed and our operating costs could increase.
Fundamental to the use of our products and services is the secure collection, storage and transmission of constituent information. Unauthorized third parties have periodically attempted to attack our system, and we have had security breaches in the past. We regularly upgrade our security technologies, policies and programs. However, we expect third parties to continue to attempt to attack our system in the future with increasing sophistication. If a third party breaches our security, that of our clients or that of our
23
third-party datacenters and payment processing partners, our business could be harmed. It could result in misappropriation of proprietary information or interruptions in operations. We might be liable to our clients or their constituents for damages from breaches of security, and clients could seek to terminate their agreements with us. A breach could also harm our reputation and increase our operating costs, particularly any breach resulting in the imposition of liability that is not covered by insurance or is in excess of insurance coverage. We might be required to expend significant capital and other resources to notify and communicate with state and federal regulatory agencies and affected clients and their constituents, provide credit monitoring or other protections, protect further against security breaches or to rectify problems caused by any security breach. Any of these results would be harmful to our business.
We rely upon trademark, copyright and trade secret laws to protect our proprietary rights, which might not provide us with adequate protection, and we may therefore be unable to compete effectively.
Our success and ability to compete depend to a significant degree upon the protection of our software and other proprietary technology rights. We might not be successful in protecting our proprietary technology, and our proprietary rights might not provide us with a meaningful competitive advantage. To protect our proprietary technology, we rely on a combination of trademark, copyright and trade secret laws, as well as nondisclosure agreements, each of which affords only limited protection. We have no patents on our proprietary technology and, accordingly, have no way to exclude others from practicing inventions relating to similar technologies, unless wrongfully misappropriated from us in violation of trade secret law or any non-disclosure agreements. Any inability to protect our intellectual property rights could harm our ability to compete effectively, which would reduce our revenue. Such harm includes but is not limited to the following:
- •
- without any patents of our own to counter assert, there is a greater risk that current and future competitors who may have
patented similar technologies that cover our products and services would seek damages and a prohibition on the use and sale of such products and services;
- •
- our trademarks may not be protected in those jurisdictions in which such trademarks have not been registered, and in such
jurisdictions others may be able to use confusingly similar marks or prevent our use of such trademarks; and
- •
- current and future competitors may independently develop similar technologies or duplicate our solutions.
Despite the measures taken by us, it may be possible for a third party to copy or otherwise obtain and use our proprietary technology and information without authorization. Policing unauthorized use of our solutions is difficult, and litigation could become necessary in the future to enforce our intellectual property rights. Any litigation could be time consuming and expensive to prosecute or resolve and could result in substantial diversion of management attention and resources.
We use open source software in the software underlying our solutions that may subject our software to general release or require us to re-engineer such solutions, which could reduce our revenue or increase our operating costs.
We use open source software in the software underlying our solutions and plan to use more open source software in the future. From time to time, there have been claims against companies that distribute or use open source software in their products and services, asserting that open source software infringes the claimants' intellectual property rights. We could be subject to suits by parties claiming infringement of intellectual property rights resulting from our use of open source software in accordance with the terms of the license under which we received such open source software. Use and distribution of open source software can lead to greater risks than use of third-party commercial software, as open source licensors generally do not provide warranties or other contractual protections regarding
24
infringement claims or the quality of the code. Some open source licenses contain requirements that we make available source code for modifications or derivative works we create based upon the open source software and that we license such modifications or derivative works under the terms of a particular open source license or other license granting third parties certain rights of further use, modification and distribution. If we combine our proprietary software with open source software in a certain manner, we could, under certain of the open source licenses, be required to release the source code of our proprietary software and license such proprietary software under the terms of the open source license for free or for a nominal fee. Open source license terms may be ambiguous and many of the risks associated with usage of open source software cannot be eliminated and could, if not properly addressed, negatively affect our business. If we were found to have inappropriately used open source software or failed to comply with the terms of the open source licenses, in addition to the potential that we license modifications or derivative works we create under open source license terms, we may be subject to suits by licensors claiming infringement of intellectual property rights related to such open source software and required to re-engineer our software underlying our solution, discontinue the sale of our solutions in the event re-engineering cannot be accomplished on a timely basis, take other remedial action that may divert resources away from our development efforts or be subject to an injunction or damage award or settlement, any of which could reduce our revenue or increase our operating costs.
We may enter into acquisitions that may be difficult to integrate, fail to achieve our strategic objectives, disrupt our business, dilute stockholder value or divert management attention.
We currently do not have any agreements with respect to any acquisitions, but in the future we may pursue acquisitions of businesses to complement our existing business. We cannot assure you that any acquisition we make in the future will provide us with the benefits we anticipated in entering into the transaction. Acquisitions are typically accompanied by a number of risks, including:
- •
- difficulties in retaining key employees and clients and in integrating the operations and personnel of the acquired
companies;
- •
- difficulties in maintaining acceptable standards, controls, procedures and policies;
- •
- potential disruption of ongoing business and distraction of management;
- •
- inability to maintain relationships with clients of the acquired business;
- •
- impairment of relationships with employees and clients as a result of any integration of new management and other
personnel;
- •
- difficulties in incorporating acquired technology and rights into our products and services;
- •
- unexpected expenses resulting from the acquisition; and
- •
- potential unknown liabilities associated with acquired businesses.
In addition, acquisitions may result in the incurrence of debt, restructuring charges and write-offs, such as write-offs of acquired in-process research and development. We also may not be able to recognize as revenue the deferred revenue of an acquired company. Acquisitions may result in goodwill and other intangible assets that are subject to impairment tests, which could result in future impairment charges. Furthermore, if we finance future acquisitions by issuing convertible debt or equity securities, our existing stockholders may be diluted and earnings per share may decrease. To the extent we finance future acquisitions with debt, such debt could include financial or operational covenants that restrict our business operations.
We may enter into negotiations for acquisitions that are not ultimately consummated. Those negotiations could result in diversion of management time and significant out-of-pocket costs. If we fail to evaluate and execute acquisitions successfully, we may not be able to realize the benefits of these acquisitions, and our operating results could be harmed.
25
Our ability to raise capital in the future may be limited, and our failure to raise capital when needed could prevent us from executing our growth strategy.
We intend to continue to make investments to support our growth and believe that our existing cash and cash equivalents and our cash flow from future operating activities will be sufficient to meet our anticipated cash needs for the next twelve months. We may, however, require additional capital from equity or debt financings in the future to fund our operations or respond to competitive pressures or strategic opportunities. In addition, we may require additional financing to fund the purchase price of future acquisitions. Additional financing may not be available on terms favorable to us, or at all. Any additional capital raised through the sale of equity or convertible debt securities may dilute your percentage ownership of our common stock. Furthermore, any new debt or equity securities we issue could have rights, preferences and privileges superior to our common stock. Capital raised through debt financings could require us to make periodic interest payments and could impose potentially restrictive covenants on the conduct of our business. If we are unable to obtain adequate financing or financing on terms satisfactory to us, our ability to continue to support our business growth and to respond to business challenges could be significantly limited.
If we expand our operations outside of the United States, our expansion may subject us to risks that may increase our operating costs.
An element of our growth strategy is to expand our international operations and develop a worldwide client base. To date, we have not realized a material portion of our revenue from clients outside the United States. Operating in international markets requires significant resources and management attention and will subject us to regulatory, economic and political risks that are different from those in the United States. Because of our limited experience with international operations, we cannot assure you that our international expansion efforts will be successful. In addition, we will face risks in doing business internationally that could increase our operating costs, including:
- •
- economic conditions in various parts of the world;
- •
- unexpected and more restrictive laws and regulations, including those laws governing Internet activities, email messaging,
collection and use of personal information, ownership of intellectual property, solicitation of charitable contributions and other activities important to our online business practices;
- •
- new and different sources of competition;
- •
- multiple, conflicting and changing tax laws and regulations that may affect both our international and domestic tax
liabilities and result in increased complexity and costs;
- •
- if we were to establish international offices, the difficulty of managing and staffing such international offices and the
increased travel, infrastructure and legal compliance costs associated with multiple international locations;
- •
- difficulties in enforcing contracts and collecting accounts receivable, especially in developing countries;
- •
- if contracts become denominated in local currency, fluctuations in exchange rates; and
- •
- tariffs and trade barriers, import/export controls and other regulatory or contractual limitations on our ability to sell or develop our products in certain foreign markets.
If we decide to expand our business globally, our success will depend, in part, on our ability to anticipate and effectively manage these and other risks associated with future international operations. Our failure to manage any of these risks successfully could increase our operating costs.
26
We will incur increased costs as a result of operating as a public company, and our management will be required to devote substantial time to new compliance initiatives, which will increase our operating costs.
As a public company, we will incur legal, accounting and other expenses that we did not incur as a private company. In addition, the Sarbanes-Oxley Act, as well as rules subsequently implemented by the Securities and Exchange Commission, or SEC, and the NASDAQ Listing Rules, impose additional requirements on public companies, including requiring changes in corporate governance practices. For example, the listing requirements of the NASDAQ Global Market require that we satisfy certain corporate governance requirements relating to independent directors, audit committees, distribution of annual and interim reports, stockholder meetings, stockholder approvals, solicitation of proxies, conflicts of interest, stockholder voting rights and codes of conduct. Our management and other personnel will need to devote a substantial amount of time to these compliance initiatives. Moreover, these rules and regulations will increase our legal and financial compliance costs and will make some activities more time-consuming and costly. For example, we expect these rules and regulations to make it more difficult and more expensive for us to obtain director and officer liability insurance, and we may be required to accept reduced policy limits and coverage or incur substantial additional costs to maintain the same or similar coverage. These rules and regulations could also make it more difficult for us to attract and retain qualified persons to serve on our board of directors, our board committees or as executive officers.
In addition, United States securities laws require, among other things, that we maintain effective internal control over financial reporting and disclosure controls and procedures. In particular, for the year ending December 31, 2011, we must perform system and process evaluation and testing of our internal control over financial reporting to allow management and our independent registered public accounting firm to report on the effectiveness of our internal control over financial reporting, as required by Section 404 of the Sarbanes-Oxley Act. Our testing, or the subsequent testing by our independent registered public accounting firm, may reveal deficiencies in our internal control over financial reporting that are deemed to be material weaknesses. Our compliance with Section 404 will require that we incur substantial accounting expense and expend significant management time on compliance-related issues. Moreover, if we are not able to comply with the requirements of Section 404 in a timely manner, or if we or our independent registered public accounting firm identify deficiencies in our internal control over financial reporting that are deemed to be material weaknesses, the market price of our stock could decline, and we could be subject to potential delisting by the NASDAQ Global Market and review by the NASDAQ Stock Market, the SEC, or other regulatory authorities which would require additional financial and management resources.
Risks Relating to this Offering and Ownership of Our Common Stock
The trading price of our common stock is likely to be volatile, and you might not be able to sell your shares at or above the initial public offering price.
The trading prices of the securities of technology companies have been highly volatile. Further, our common stock has no prior trading history. Factors affecting the trading price of our common stock will include:
- •
- variations in our quarterly and annual operating results;
- •
- announcements of technological innovations, new products, services or enhancements, strategic alliances or agreements by
us or by our competitors;
- •
- the gain or loss of clients;
- •
- recruitment or departure of key personnel;
27
- •
- changes in the estimates of our operating results or changes in recommendations by any securities analysts that elect to
follow our common stock;
- •
- sales of common stock or other securities by us in the future;
- •
- market conditions in our industry, the industries of our clients and the economy as a whole; and
- •
- adoption or modification of regulations, policies, procedures or programs applicable to our business.
In addition, if the market for technology stocks or the stock market in general experiences loss of investor confidence, the trading price of our common stock could decline for reasons unrelated to our business, financial condition or operating results. The trading price of our common stock might also decline in reaction to events that affect other companies in our industry even if these events do not directly affect us. Each of these factors, among others, could harm the value of your investment in our common stock. Some companies that have had volatile market prices for their securities have had securities class action lawsuits filed against them. If a suit were filed against us, regardless of its merits or outcome, it could result in substantial costs and divert management's attention and resources.
Our securities have no prior market, and our stock price may decline after the offering.
Prior to this offering, there has been no public market for shares of our common stock. Although we have applied to have our common stock listed on the NASDAQ Global Market, an active public trading market for our common stock may not develop or, if it develops, may not be maintained after this offering. We and the representatives of the underwriters will negotiate to determine the initial public offering price. The initial public offering price may be higher than the trading price of our common stock following this offering. As a result, you could lose all or part of your investment.
Future sales of shares by existing stockholders could cause our stock price to decline.
If our existing stockholders sell, or indicate an intention to sell, substantial amounts of our common stock in the public market after the 180-day contractual lock-up, which period may be extended in certain limited circumstances, and other legal restrictions on resale discussed in this prospectus lapse, the trading price of our common stock could decline below the initial public offering price. Based on shares outstanding as of December 31, 2009, upon the closing of this offering, we will have 16,279,507 outstanding shares of common stock, assuming no exercise of the underwriters' over-allotment option. Of these shares, only the 5,132,728 shares of common stock sold in this offering will be freely tradable, without restriction, in the public market. Thomas Weisel Partners LLC and Piper Jaffray & Co. may, in their sole discretion, permit our officers, directors, employees and current stockholders who are subject to the contractual lock-up to sell shares prior to the expiration of the lock-up agreements.
After the lock-up agreements pertaining to this offering expire 180 days from the date of this prospectus, which period may be extended in certain limited circumstances, up to an additional 11,146,779 shares will be eligible for sale in the public market 8,381,725 of which are held by directors, executive officers and other affiliates and will be subject to volume limitations under Rule 144 under the Securities Act of 1933, as amended, or the Securities Act, and various vesting agreements. In addition, as of December 31, 2009, the 252,665 shares subject to outstanding warrants, the 3,128,602 shares that are subject to outstanding options and the 580,096 shares reserved for future issuance under our equity plans upon the closing of this offering, will become eligible for sale in the public market to the extent permitted by the provisions of various vesting agreements, the lock-up agreements and Rules 144 and 701 under the Securities Act. If these additional shares are sold, or if it is perceived that they will be sold, in the public market, the trading price of our common stock could decline.
Some of our existing stockholders have contractual demand or piggyback rights to require us to register with the SEC up to 11,334,891 shares of our common stock. If we register these shares of
28
common stock, the stockholders would be able to sell those shares freely in the public market. All of these shares are subject to lock-up agreements restricting their sale for 180 days after the date of this prospectus, which period may be extended in certain limited circumstances.
After this offering, we intend to register approximately 3,708,698 shares of our common stock that we have issued or may issue under our equity plans. Once we register these shares, they can be freely sold in the public market upon issuance, subject to the lock-up agreements, if applicable, described above.
If securities or industry analysts do not publish research or publish misleading or unfavorable research about our business, our stock price and trading volume could decline.
The trading market for our common stock will depend in part on the research and reports that securities or industry analysts publish about us or our business. We do not currently have and may never obtain research coverage by securities and industry analysts. If no or few securities or industry analysts commence coverage of us, the trading price for our stock would be negatively impacted. In the event we obtain securities or industry analyst coverage, if one or more of the analysts who covers us downgrades our stock or publishes misleading or unfavorable research about our business, our stock price would likely decline. If one or more of these analysts ceases coverage of us or fails to publish reports on us regularly, demand for our stock could decrease, which could cause our stock price or trading volume to decline.
Insiders will continue to have substantial control over us after this offering, which may limit our stockholders' ability to influence corporate matters and delay or prevent a third party from acquiring control over us.
Upon the closing of this offering, our directors and executive officers and their affiliates will own, in the aggregate, approximately 41% of our outstanding common stock, assuming no exercise of the underwriters' over-allotment option, compared to 22% represented by the shares sold by us in this offering, assuming no exercise of the underwriters' over-allotment option. As a result, these stockholders will be able to exercise influence over all matters requiring stockholder approval, including the election of directors and approval of corporate transactions, such as a merger or other sale of our company or our assets. This concentration of ownership could limit your ability to influence corporate matters and delay or prevent a third party from acquiring control over us. For information regarding the ownership of our outstanding stock by our executive officers and directors and their affiliates, please see the section titled "Principal and Selling Stockholders."
As a new investor, you will experience substantial dilution as a result of this offering and future equity issuances.
The assumed initial public offering price per share is substantially higher than the pro forma net tangible book value per share of our common stock outstanding prior to this offering. As a result, investors purchasing common stock in this offering will experience immediate substantial dilution of $8.51 per share. In addition, we have issued options and warrants to acquire common stock at prices below the assumed initial public offering price. To the extent outstanding options and warrants are ultimately exercised, there will be further dilution to investors in this offering. This dilution is due in large part to the fact that our earlier stockholders paid substantially less than the assumed initial public offering price when they acquired their shares of common stock and securities convertible or exercisable for common stock. In addition, if the underwriters exercise their over-allotment option, or if we issue additional equity securities, you will experience additional dilution.
29
Anti-takeover provisions in our charter documents and Delaware law could discourage, delay or prevent a change of control of our company and may affect the trading price of our common stock.
We are a Delaware corporation and the anti-takeover provisions of the Delaware General Corporation Law, which apply to us, may discourage, delay or prevent a change of control by prohibiting us from engaging in a business combination with an interested stockholder for a period of three years after the person becomes an interested stockholder, even if a change of control would be beneficial to our existing stockholders. For more information, see the section titled "Description of Capital Stock—Anti-Takeover Effects of Our Charter and Bylaws and Delaware Law." In addition, our amended and restated certificate of incorporation and amended and restated bylaws may discourage, delay or prevent a change in our management or control over us that stockholders may consider favorable. Our amended and restated certificate of incorporation and amended and restated bylaws, which will be in effect as of the closing of this offering:
- •
- authorize the issuance of "blank check" preferred stock that could be issued by our board of directors to thwart a
takeover attempt;
- •
- establish a classified board of directors, as a result of which the successors to the directors whose terms have expired
will be elected to serve from the time of election and qualification until the third annual meeting following their election;
- •
- require that directors only be removed from office for cause and only upon a supermajority stockholder vote;
- •
- require that a supermajority vote be obtained to amend or repeal certain provisions of our certificate of incorporation;
- •
- require that stockholders provide advance notice of any stockholder nominations of directors or any proposal of new
business to be considered at any meeting of stockholders;
- •
- provide that vacancies on the board of directors, including newly-created directorships, may be filled only by a majority
vote of directors then in office rather than by stockholders;
- •
- prevent stockholders from calling special meetings; and
- •
- prohibit stockholder action by written consent, requiring all actions to be taken at a meeting of the stockholders.
Our management will have broad discretion over the use of the proceeds we receive in this offering and might not apply the proceeds in ways that increase the value of your investment.
Our management will have broad discretion to use the net proceeds from this offering, and you will be relying on the judgment of our management regarding the application of these proceeds. Our management might not apply the net proceeds of this offering in ways that increase the value of your investment. We expect to use the net proceeds from this offering to possibly repay our credit facilities and for general corporate purposes, including working capital and capital expenditures, which may in the future include investments in, or acquisitions of, complementary businesses, services or technologies. We have not allocated these net proceeds for any specific purposes. Our management might not be able to yield a significant return, if any, on any investment of these net proceeds. You will not have the opportunity to influence our decisions on how the net proceeds from this offering are used.
30
SPECIAL NOTE REGARDING
FORWARD-LOOKING STATEMENTS
We have made statements under the captions "Prospectus Summary," "Risk Factors," "Management's Discussion and Analysis of Financial Condition and Results of Operations," "Business," "Management" and "Executive Compensation" and in other sections of this prospectus that are forward-looking statements. In some cases, you can identify these statements by forward-looking words such as "anticipate," "believe," "continue," "could," "estimate," "expect," "intend," "may," "might," "plan," "potential," "predict," "should," "will" or the negative or plural of these words and other comparable terminology. Forward-looking statements made herein include, but are not limited to, statements about:
- •
- anticipated trends and challenges in our business and the nonprofit market in which we operate;
- •
- our ability to address the needs of NPOs or develop new or enhanced solutions to meet those needs;
- •
- expected adoption and renewal of our solutions by our existing and potential clients;
- •
- our ability to compete in our industry;
- •
- our ability to grow our revenue and achieve and maintain profitability;
- •
- our ability to protect our confidential information and intellectual property rights;
- •
- our ability to manage our growth and anticipated expansion into new markets;
- •
- if necessary, our ability to obtain funding in the future on acceptable terms; and
- •
- our expectations regarding the use of the net proceeds from this offering.
These forward-looking statements, which are subject to risks, uncertainties and assumptions about us, are based largely on our current expectations and projections about future events and financial trends that we believe may affect our financial condition, operating results, business strategy, short-term and long-term business operations and objectives and financial needs. The occurrence of the events described and the achievement of the expected results, depend on many events, some or all of which are not predictable or within our control. Actual results may differ materially from expected results. You should specifically consider the numerous risks outlined under "Risk Factors" and elsewhere in this prospectus for a more complete discussion of these risks, assumptions and uncertainties and for other risks and uncertainties. These risks, assumptions and uncertainties are not necessarily all of the important factors that could cause actual results to differ materially from those expressed in any of our forward-looking statements. Other unknown or unpredictable factors also could harm our results. In light of these risks, uncertainties and assumptions, the forward-looking events discussed in this prospectus might not occur. We undertake no obligation, and specifically decline any obligation, to update publicly or revise any forward-looking statements, whether as a result of new information, future events or otherwise.
This prospectus also contains estimates and other information concerning our industry, including market size, which are based on industry publications, surveys and forecasts.
You should read this prospectus and the documents that we reference in this prospectus and have filed as exhibits to the registration statement on Form S-1, of which this prospectus is a part, that we have filed with the Securities and Exchange Commission, completely and with the understanding that our actual future results, levels of activity, performance and achievements may be materially different from what we expect. We qualify all of our forward-looking statements by these cautionary statements.
31
We estimate that the net proceeds we will receive from this offering will be approximately $34.7 million, based on the assumed initial public offering price of $11.00 per share and after deducting the estimated underwriting discounts and estimated offering expenses payable by us. If the underwriters' option to purchase additional shares in this offering is exercised in full we estimate that our net proceeds will be approximately $40.3 million. We will not receive any proceeds from the sale of shares of our common stock by the selling stockholders. A $1.00 increase (decrease) in the assumed initial public offering price of $11.00 per share would increase (decrease) the net proceeds to us from this offering by approximately $3.4 million, assuming the number of shares offered by us, as set forth on the cover page of this prospectus, remains the same and after deducting the estimated underwriting discounts and estimated offering expenses payable by us.
Our principal purposes for this offering are, in order of priority, to obtain working capital for general corporate purposes, establish a public market for our common stock, repay debt and facilitate our future access to public capital markets. We intend to use the net proceeds from this offering for general corporate purposes, including the enhancement of our software and service offerings, sales and marketing activities, capital expenditures and the costs of operating as a public company. We do not have agreements or commitments for any specific repayments related to our credit facilities upon completion of this offering, but we intend to use a portion of the net proceeds of this offering to repay our outstanding debt, including the following:
- •
- up to $975,000 outstanding as of December 31, 2009 under our revolving line of credit with Comerica Bank dated
October 26, 2007, as amended, that has a maturity date of April 26, 2011 and bears interest at a rate equal to LIBOR, not less than 2%, plus a margin of 3%, or 5% at December 31,
2009; and
- •
- up to $1.1 million outstanding as of December 31, 2009 under our term loan with Comerica Bank dated October 26, 2007 that has a maturity date of September 30, 2011 and bears interest at a rate equal to LIBOR, not less than 2%, plus a margin of 3%, or 5% at December 31, 2009.
We may also use a portion of the proceeds to expand our current business through acquisitions or investments in other complementary businesses, particularly those with similar clients and adjacent products or technologies. We have no agreements or commitments with respect to any acquisitions at this time.
Pending the use of the net proceeds from this offering described above, we intend to invest the net proceeds in short and intermediate term interest bearing obligations, investment-grade instruments, certificates of deposit or direct or guaranteed obligations of the United States government.
The amount and timing of what we actually spend may vary significantly and will depend on a number of factors, including our future revenue and cash generated by operations as well as the other factors described in the section titled "Risk Factors."
32
We have never declared or paid cash dividends on our capital stock. We currently intend to retain all available funds and any future earnings to support the operation of and to finance the growth and development of our business. We do not anticipate paying any cash dividends in the foreseeable future. Any future determination to declare cash dividends will be made at the discretion of our board of directors, subject to compliance with any covenants under our credit facilities that restrict or limit our ability to pay dividends, and will depend on our financial condition, operating results, capital requirements, general business conditions and other factors that our board of directors may deem relevant.
33
The following table sets forth our cash and cash equivalents and capitalization as of December 31, 2009, on:
- •
- an actual basis;
- •
- on a pro forma basis after giving effect to (i) the reverse split of each outstanding share of preferred stock and
common stock into 0.352 of a share of preferred stock or common stock, respectively, (ii) the conversion of all outstanding shares of preferred stock and common stock into an aggregate of
12,643,143 shares of a single class of common stock and (iii) the reclassification of the preferred stock warrant liability to common stock and additional paid-in capital
immediately prior to the closing of this offering; and
- •
- on a pro forma as adjusted basis to give effect to (i) our filing of an amended and restated certificate of incorporation, (ii) the reverse split of each outstanding share of preferred stock and common stock into 0.352 of a share of preferred stock or common stock, respectively, (iii) the conversion of all outstanding shares of preferred stock and common stock into an aggregate of 12,643,143 shares of a single class of common stock (iv) the reclassification of the convertible preferred stock warrant liability to common stock and additional paid-in-capital immediately prior to the closing of this offering; (v) our receipt of the estimated net proceeds from the sale by us of 3,636,364 shares of common stock in this offering at an assumed initial public offering price of $11.00 per share and after deducting the estimated underwriting discount and estimated offering expenses payable by us; and (vi) the application of our proceeds from this offering to repay approximately $2.2 million in indebtedness.
You should read the following table in conjunction with the sections titled "Selected Financial Data," "Management's Discussion and Analysis of Financial Condition and Results of Operations" and our financial statements and related notes.
34
| |
As of December 31, 2009 | |||||||||||
|---|---|---|---|---|---|---|---|---|---|---|---|---|
| |
Actual | Pro Forma | Pro Forma As Adjusted(1) |
|||||||||
| |
(in thousands, except share and per share amounts) (unaudited) |
|||||||||||
Cash and cash equivalents |
$ | 16,662 | $ | 16,662 | $ | 49,151 | ||||||
Long-term debt and capital lease obligations, including current portion |
$ | 2,211 | $ | 2,211 | $ | — | ||||||
Convertible preferred stock warrant liability |
1,375 | — | — | |||||||||
Convertible preferred stock, $0.001 par value, 5,440,474 shares authorized and issuable in series, 5,316,037 shares designated, issued and outstanding, actual; no shares authorized, no shares designated, issued or outstanding, pro forma and pro forma as adjusted |
33,869 | — | — | |||||||||
Stockholders' equity (deficit): |
||||||||||||
Preferred stock, $0.001 par value, 5,000,000 shares authorized and issuable in series, no shares designated, issued or outstanding, actual and pro forma; 5,000,000 shares authorized, no shares designated, issued or outstanding, pro forma as adjusted |
— | — | — | |||||||||
Common stock, $0.001 par value, 40,000,000 authorized and issuable in series, 7,327,106 shares designated, issued and outstanding, actual; 40,000,000 shares authorized, 12,643,143 shares issued and outstanding, pro forma; 40,000,000 shares authorized, 16,279,507 shares issued and outstanding, pro forma as adjusted |
7 | 13 | 16 | |||||||||
Additional paid-in capital |
37,340 | 72,578 | 107,275 | |||||||||
Accumulated deficit |
(56,256 | ) | (56,256 | ) | (56,256 | ) | ||||||
Total stockholders' equity (deficit) |
(18,909 | ) | 16,335 | 51,035 | ||||||||
Total capitalization |
$ | 18,546 | $ | 18,546 | $ | 51,035 | ||||||
- (1)
- A $1.00 increase (decrease) in the assumed initial public offering price of $11.00 per share would increase (decrease) cash and cash equivalents, additional paid-in capital, total stockholders' equity and total capitalization by approximately $3.4 million, assuming the number of shares offered by us, as set forth on the cover page of this prospectus, remains the same and after deducting the estimated underwriter discount and estimated offering expenses payable by us.
This table excludes the following shares:
- •
- 252,665 shares of common stock issuable upon the exercise of warrants outstanding as of December 31, 2009 to
acquire our common stock with a weighted average exercise price of $4.55 per share;
- •
- 3,128,602 shares of common stock issuable upon the exercise of options outstanding as of December 31, 2009
with a weighted average exercise price of $3.10 per share; and
- •
- 580,096 shares reserved for future issuance under our 2009 Stock Incentive Plan.
35
Our pro forma net tangible book value as of December 31, 2009 was approximately $5.8 million, or $0.46 per share of our common stock. Our pro forma net tangible book value per share represents our total tangible assets less total liabilities plus the reclassification of the preferred stock warrant liability to common stock, divided by the number of shares of our common stock outstanding on December 31, 2009 after giving effect to the reverse split and subsequent conversion of each outstanding share of preferred stock and common stock into 0.352 of a share of common stock and additional paid-in capital prior to the closing of this offering.
Pro forma as adjusted net tangible book value dilution per share represents the difference between the amount per share paid by purchasers of shares of common stock in this offering and the net tangible book value per share of common stock immediately after the closing of this offering at an assumed initial public offering price of $11.00 per share. Without taking into account any changes in net tangible book value after December 31, 2009, other than to give effect to the sale of 3,636,364 shares of our common stock in this offering by us, after deducting the estimated underwriting discounts and estimated offering expenses payable by us, our pro forma as adjusted net tangible book value as of December 31, 2009 would have been approximately $40.5 million, or $2.49 per share of our common stock. This amount represents an immediate increase in net tangible book value of $2.03 per share to our existing stockholders and an immediate dilution in net tangible book value of $8.51 per share to new investors purchasing shares in this offering. The following table illustrates the dilution in net tangible book value per share to new investors.
Assumed initial public offering price per share |
$ | 11.00 | ||||||
Pro forma net tangible book value per share as of December 31, 2009 |
$ | 0.46 | ||||||
Increase in pro forma net tangible book value per share attributable to new investors |
2.03 | |||||||
Pro forma as adjusted net tangible book value per share |
2.49 | |||||||
Dilution per share to new investors in this offering |
$ | 8.51 | ||||||
If the underwriters exercise their option to purchase additional shares of our common stock from us in full in this offering, the pro forma as adjusted net tangible book value per share after the offering would be $2.84 per share, the increase in pro forma as adjusted net tangible book value per share to existing stockholders would be $2.38 per share and the dilution to new investors purchasing shares in this offering would be $8.16 per share.
If all of the outstanding options and warrants were exercised, the net tangible book value as of December 31, 2009 would have been $51.4 million and the pro forma as adjusted net tangible book value after this offering would have been $2.61 per share, causing dilution to new investors of $8.39 per share.
A $1.00 increase (decrease) in the assumed initial public offering price of $11.00 per share would increase (decrease) our pro forma as adjusted net tangible book value as of December 31, 2009 by approximately $3.4 million, the pro forma as adjusted net tangible book value per share after this offering by $0.21 per share and the dilution in pro forma as adjusted net tangible book value per share to new investors in this offering by $0.79 per share, assuming the number of shares offered by us, as set forth on the cover page of this prospectus, remains the same and after deducting the estimated underwriter discount and estimated offering expenses payable by us.
The following table summarizes, as of December 31, 2009 on a pro forma as adjusted basis described above, the number of shares of our common stock purchased from us, the total consideration paid to us,
36
and the average price per share paid to us by existing stockholders and to be paid by new investors purchasing shares of our common stock in this offering.
| |
Shares Purchased | Total Consideration | |
||||||||||||||
|---|---|---|---|---|---|---|---|---|---|---|---|---|---|---|---|---|---|
| |
Average Price Per Share |
||||||||||||||||
| |
Number | Percent | Amount | Percent | |||||||||||||
Existing stockholders |
12,643,143 | 78 | % | $ | 65,104,795 | 62 | % | $ | 5.15 | ||||||||
New investors(1) |
3,636,364 | 22 | 40,000,004 | 38 | 11.00 | ||||||||||||
Total |
16,279,507 | 100 | % | $ | 105,104,799 | 100 | % | ||||||||||
- (1)
- A $1.00 increase (decrease) in the assumed initial public offering price of $11.00 per share would increase (decrease) total consideration paid to us by investors participating in this offering by approximately $3.4 million, assuming the number of shares offered by us, as set forth on the cover page of this prospectus, remains the same and after deducting the estimated underwriter discount and estimated offering expenses payable by us.
The sale of 1,496,364 shares of common stock to be sold by the selling stockholders in this offering will reduce the number of shares held by existing stockholders to 11,146,779 shares, or 68% of the total shares outstanding, and will increase the number of shares held by investors participating in this offering to 5,132,728 shares, or 32% of the total shares outstanding.
As of December 31, 2009, there were options outstanding to purchase a total of 3,128,602 shares of common stock at a weighted average exercise price of $3.10 per share. As of December 31, 2009, there were warrants outstanding to purchase 252,665 shares of common stock with a weighted average exercise price of $4.55 per share. The above discussion and table assumes no exercise of stock options or warrants outstanding as of December 31, 2009. If all of these options and warrants were exercised, our existing stockholders, including the holders of these options and warrants, would own 82% of the total number of shares of our common stock outstanding upon the closing of this offering and our new investors would own 18% of the total number of shares of our common stock upon the closing of this offering.
37
The following tables set forth selected financial data. We derived the consolidated statements of operations and other operating data for the years ended December 31, 2007, 2008 and 2009 and balance sheet data as of December 31, 2008 and 2009 from our audited financial statements included elsewhere in this prospectus. We derived the consolidated statements of operations and other operating data for the years ended December 31, 2005 and 2006 and balance sheet data as of December 31, 2005, 2006 and 2007 from our audited financial statements which have not been included in this prospectus. You should read this selected financial data in conjunction with the financial statements and related notes and the information in the section titled "Management's Discussion and Analysis of Financial Condition and Results of Operations." See note 2 to our financial statements for a description of the calculation of basic and diluted net loss per share. The historical results set forth below are not necessarily indicative of results of operations to be expected in any future period.
38
| |
Year Ended December 31, | ||||||||||||||||
|---|---|---|---|---|---|---|---|---|---|---|---|---|---|---|---|---|---|
| |
2005 | 2006 | 2007 | 2008 | 2009 | ||||||||||||
| |
(in thousands, except per share amounts) |
||||||||||||||||
Statements of Operations Data: |
|||||||||||||||||
Revenue: |
|||||||||||||||||
Subscription and services |
$ | 11,093 | $ | 18,051 | $ | 38,754 | $ | 50,103 | $ | 54,900 | |||||||
Usage |
2,158 | 3,407 | 4,329 | 6,877 | 8,186 | ||||||||||||
Total revenue |
13,251 | 21,458 | 43,083 | 56,980 | 63,086 | ||||||||||||
Cost of revenue |
5,005 |
7,934 |
18,716 |
22,911 |
24,779 |
||||||||||||
Gross profit |
8,246 | 13,524 | 24,367 | 34,069 | 38,307 | ||||||||||||
Operating expenses: |
|||||||||||||||||
Sales and marketing |
9,596 | 12,171 | 19,428 | 21,432 | 21,556 | ||||||||||||
Research and development |
2,582 | 3,488 | 7,189 | 8,754 | 10,041 | ||||||||||||
General and administrative |
1,936 | 2,351 | 4,456 | 5,883 | 6,034 | ||||||||||||
Amortization of other intangibles |
— | — | 1,271 | 1,452 | 1,400 | ||||||||||||
Write off of deferred stock offering costs |
— | — | — | 1,524 | — | ||||||||||||
Restructuring expenses |
— | — | 284 | — | — | ||||||||||||
Total operating expenses |
14,114 | 18,010 | 32,628 | 39,045 | 39,031 | ||||||||||||
Loss from operations |
(5,868 | ) | (4,486 | ) | (8,261 | ) | (4,976 | ) | (724 | ) | |||||||
Interest income |
211 |
138 |
279 |
115 |
6 |
||||||||||||
Interest expense |
(136 | ) | (724 | ) | (883 | ) | (691 | ) | (355 | ) | |||||||
Other income (expense) |
— | 93 | (1,644 | ) | 1,808 | (803 | ) | ||||||||||
Loss before income taxes |
(5,793 | ) | (4,979 | ) | (10,509 | ) | (3,744 | ) | (1,876 | ) | |||||||
Provision for income taxes |
— |
— |
— |
— |
219 |
||||||||||||
Net loss |
$ | (5,793 | ) | $ | (4,979 | ) | $ | (10,509 | ) | $ | (3,744 | ) | $ | (2,095 | ) | ||
Net loss per share—basic and diluted |
$ | (17.34 | ) | $ | (7.68 | ) | $ | (1.69 | ) | $ | (0.52 | ) | $ | (0.29 | ) | ||
Weighted average number of shares—basic and diluted |
334 | 648 | 6,257 | 7,257 | 7,313 | ||||||||||||
Pro forma net loss per common share (unaudited): |
|||||||||||||||||
Net loss attributable to common stockholders |
$ | (2,095 | ) | ||||||||||||||
Change in value of convertible preferred stock warrant liability |
814 | ||||||||||||||||
Net loss used to compute pro forma net loss per common share (unaudited) |
$ | (1,281 | ) | ||||||||||||||
Basic and diluted weighted average shares used above |
7,313 |
||||||||||||||||
Assumed reverse stock split and conversion after effect of change in capital structure (unaudited) |
5,316 | ||||||||||||||||
Pro forma weighted average number of shares—basic and diluted(1) (unaudited) |
12,629 | ||||||||||||||||
Pro forma net loss per share—basic and diluted(1)(unaudited) |
$ | (0.10 | ) | ||||||||||||||
Pro forma net loss per share (as adjusted)—basic and diluted(2)(unaudited) |
$ | (0.09 | ) | ||||||||||||||
Other Operating Data: |
|||||||||||||||||
Adjusted EBITDA(3)(unaudited) |
$ | (5,103 | ) | $ | (3,450 | ) | $ | (3,378 | ) | $ | 1,405 | $ | 6,581 | ||||
Net cash provided by (used in) operating activities |
(3,998 | ) | (1,211 | ) | (1,225 | ) | 2,862 | 6,791 | |||||||||
- (1)
- Pro
forma weighted average shares outstanding reflects the conversion of our convertible preferred stock (using the if-converted method) into common stock
as though the conversion had occurred on the original dates of issuance.
- (2)
- We plan to use $2.2 million of the proceeds of this offering for debt reduction. "Pro forma net loss per share (as-adjusted) basic and diluted" reflects pro forma net loss per share giving effect to our use of
39
proceeds from the offering to repay debt. The pro forma calculation assumes the sale of 200,000 shares of common stock offered by us used for this debt reduction at an assumed initial public offering price of $11.00 per share, the midpoint of the range set forth on the cover page of this prospectus. Pro forma net loss per share (as-adjusted) was computed as follows: pro forma net loss of $1.3 million was decreased by approximately $123,000 for the year ended December 31, 2009, representing the pro forma reduction in interest expense resulting from the use of net offering proceeds to reduce debt, utilizing the interest rates in effect as of December 31, 2009 of 5.0%, and excluding income tax effects. Pro forma weighted average common shares outstanding (as adjusted) was computed as follows: pro forma weighted average number of shares—basic and diluted of 12,628,781 plus 200,000 shares, reflecting the sale of shares of common stock offered by us and expected to be used for debt reduction as of the beginning of the period presented.
- (3)
- We define Adjusted EBITDA as net income (loss) less interest income and gain (loss) on preferred stock warrant revaluation plus interest expense, provision for taxes, depreciation expense, amortization expense and stock-based compensation expense.
| |
Year Ended December 31, | |||||||||||||||||
|---|---|---|---|---|---|---|---|---|---|---|---|---|---|---|---|---|---|---|
| |
2005 | 2006 | 2007 | 2008 | 2009 | |||||||||||||
| |
(in thousands) |
|||||||||||||||||
Reconciliation of Adjusted EBITDA to net loss: |
||||||||||||||||||
Net loss |
$ | (5,793 | ) | $ | (4,979 | ) | $ | (10,509 | ) | $ | (3,744 | ) | $ | (2,095 | ) | |||
Interest (income) expense, net |
(75 | ) | 586 | 604 | 576 | 349 | ||||||||||||
Depreciation and amortization |
691 | 971 | 4,175 | 4,821 | 4,792 | |||||||||||||
Stock-based compensation |
74 | 65 | 691 | 1,556 | 2,502 | |||||||||||||
Gain (loss) on warrant revaluation |
— | (93 | ) | 1,661 | (1,804 | ) | 814 | |||||||||||
Provision for income taxes |
— | — | — | — | 219 | |||||||||||||
Adjusted EBITDA |
$ | (5,103 | ) | $ | (3,450 | ) | $ | (3,378 | ) | $ | 1,405 | $ | 6,581 | |||||
The amounts shown above in the consolidated statements of operations data include amortization of acquired technology and stock-based compensation as follows:
| |
Year Ended December 31, | |||||||||||||||
|---|---|---|---|---|---|---|---|---|---|---|---|---|---|---|---|---|
| |
2005 | 2006 | 2007 | 2008 | 2009 | |||||||||||
| |
(in thousands) |
|||||||||||||||
Amortization of acquired technology: |
||||||||||||||||
Cost of revenue |
$ | — | $ | — | $ | 887 | $ | 1,016 | $ | 1,016 | ||||||
Stock-based compensation: |
||||||||||||||||
Cost of revenue |
$ | — | $ | 13 | $ | 164 | $ | 383 | $ | 583 | ||||||
Sales and marketing |
27 | 25 | 300 | 585 | 742 | |||||||||||
Research and development |
— | 4 | 85 | 235 | 343 | |||||||||||
General and administrative |
47 | 23 | 142 | 353 | 834 | |||||||||||
40
| |
As of December 31, | |||||||||||||||||||||
|---|---|---|---|---|---|---|---|---|---|---|---|---|---|---|---|---|---|---|---|---|---|---|
| |
2005 | 2006 | 2007 | 2008 | 2009 | Pro Forma(1) | Pro Forma As Adjusted(2)(3) |
|||||||||||||||
| |
(in thousands) |
|||||||||||||||||||||
Balance Sheet Data: |
||||||||||||||||||||||
Cash and cash equivalents |
$ | 8,783 | $ | 8,514 | $ | 14,600 | $ | 13,828 | $ | 16,662 | $ | 16,662 | $ | 49,151 | ||||||||
Working capital |
5,140 | (1,139 | ) | 322 | (1,260 | ) | 2,379 | 3,754 | 37,106 | |||||||||||||
Total assets |
14,299 | 16,343 | 44,156 | 40,873 | 41,344 | 41,344 | 73,833 | |||||||||||||||
Preferred stock warrant liability |
691 | 705 | 2,366 | 562 | 1,375 | — | — | |||||||||||||||
Long-term obligations, net of current portion |
3,959 | 2,998 | 3,384 | 1,205 | 1,348 | 1,348 | — | |||||||||||||||
Convertible preferred stock |
37,274 | 37,274 | 33,869 | 33,869 | 33,869 | — | — | |||||||||||||||
Total stockholders' equity (deficit) |
(34,366 | ) | (38,864 | ) | (17,337 | ) | (19,357 | ) | (18,909 | ) | 16,335 | 51,035 | ||||||||||
- (1)
- The
pro forma column in the balance sheet data table above reflects (i) the reverse split of each outstanding share of preferred stock and common
stock into 0.352 of a share of preferred stock or common stock, respectively, (ii) the conversion of all outstanding shares of preferred stock and common stock into an aggregate of
12,643,143 shares of a single class of common stock and (iii) the reclassification of the preferred stock warrant liability to common stock and additional paid-in capital
immediately prior to the closing of this offering.
- (2)
- The
pro forma as adjusted column in the balance sheet data table above reflects (i) the reverse split of each outstanding share of preferred stock
and common stock into 0.352 of a share of preferred stock or common stock, respectively, (ii) the conversion of all outstanding shares of preferred stock and common stock into an aggregate of
12,643,143 shares of a single class of common stock and (iii) the reclassification of the preferred stock warrant liability to common stock and additional paid-in capital
immediately prior to the closing of this offering, (iv) our sale of 3,636,364 shares of common stock in this offering, at an assumed initial public offering price of $11.00 per share and
after deducting the estimated underwriting discount and estimated offering expenses payable by us and the application of our net proceeds from this offering and (v) our repayment of
approximately $2.2 million outstanding under our credit facilities.
- (3)
- A $1.00 increase (decrease) in the assumed initial public offering price of $11.00 per share would increase (decrease) cash and cash equivalents, working capital, total assets and total stockholders' equity after this offering by approximately $3.4 million, assuming the number of shares offered by us, as set forth on the cover page of this prospectus, remains the same and after deducting the estimated underwriting discount and estimated offering expenses payable by us.
41
MANAGEMENT'S DISCUSSION AND ANALYSIS
OF FINANCIAL CONDITION AND RESULTS OF OPERATIONS
The following discussion and analysis of our financial condition and results of our operations should be read in conjunction with the financial statements and related notes and the other financial information appearing elsewhere in this prospectus. This discussion and analysis contains forward looking statements that involve risk, uncertainties and assumptions. Our actual results could differ materially from those anticipated in the forward looking statements as a result of many factors, including those discussed in "Risk Factors" and elsewhere in this prospectus.
Overview
We are a leading provider of on-demand constituent engagement solutions that enable nonprofit organizations, or NPOs, to more effectively raise funds, advocate for change and cultivate relationships with donors, activists, volunteers, alumni and other constituents. We serve approximately 1,300 NPOs of all sizes, and during 2009, our clients used our solutions to raise over $920 million and deliver over 3.8 billion emails to over 154 million email addresses to accomplish their missions.
We were incorporated in Delaware in October 1999, and we offered our first commercially available online marketing solution in 2000. We acquired GetActive Software, Inc. in February 2007. Our integrated solutions now include our Convio Online Marketing platform, or COM, and Common Ground, our constituent relationship management application. COM enables NPOs to harness the full potential of the Internet and social media as new channels for constituent engagement and fundraising. Common Ground delivers next-generation donor management capabilities, integrates marketing activities across online and offline channels and is designed to increase operational efficiency. Our solutions are enhanced by a portfolio of value-added services tailored to our clients' specific needs.
Our Business Approach
We sell our solutions through a direct sales force complemented by our partner network. Our sales force is increasing its focus on acquiring a higher number of mid-market clients.
Our revenue has increased to $63.1 million in 2009 from $13.3 million in 2005, and our net loss has decreased to $2.1 million in 2009 from $5.8 million in 2005. Our net cash provided by (used in) operations has increased to $6.8 million in 2009 from $(4.0) million in 2005. We recognize subscription and services revenue ratably over the term of our client agreements beginning on the date such products and services become available for use by the client, or the activation date. The terms of our agreements are typically three years for COM and one year for Common Ground.
We currently derive the substantial majority of our revenue from subscriptions to our COM solution. Pricing for our COM solution is based on the number of modules licensed, the email list size and any related services. We also recognize usage revenue from our clients as a percentage of funds raised at special events, such as runs, walks and rides, and based on additional fees for their increased use of our COM solution.
Pricing for Common Ground is based on the number of seats licensed. We typically do not derive revenue from deployment services for Common Ground as deployment activities are generally handled by third-party implementation providers. Common Ground is built on salesforce.com's Force.com platform. Common Ground clients enter into a license agreement with us and separately enter into a license agreement with salesforce.com for use of its solution.
We believe the nonprofit market for on-demand constituent engagement solutions is large and underserved, and we plan to continue to invest in our business to pursue this opportunity. In particular, we expect to incur significant sales and marketing expenses to increase the number of clients on our COM platform and Common Ground application. We also expect to make substantial investments in
42
research and development, primarily on new features, platform extensibility and Common Ground. We anticipate increased operating expenses as a result of becoming a public company and more generally as we seek to grow our business domestically and outside of the United States. We expect the percentage of revenue generated from clients outside the United States to increase.
Opportunities, Trends and Uncertainties
We have noted several opportunities, trends and uncertainties that we believe are significant to an understanding of our financial results:
- •
- Increasing Adjusted EBITDA. Our management and board of
directors use Adjusted EBITDA to monitor the performance of our business. Our Adjusted EBITDA was $(3.4) million, $1.4 million and $6.6 million in 2007, 2008 and 2009,
respectively. The growth in Adjusted EBITDA in 2009 was the result of the growth in our revenue and the improved productivity and scale of our business, combined with cost-saving measures
we introduced as a result of the economic slowdown. We elected not to increase base salaries for most employees, including all executive officers, during 2009; however, we expect to increase base
salaries and headcount in the future as we grow our business. We expect Adjusted EBITDA to continue to grow in absolute dollars, but we expect its growth as a percentage of revenue to be slower.
Adjusted EBITDA is not determined in accordance with GAAP and is not a substitute for or superior to financial measures determined in accordance with GAAP. For further discussion regarding Adjusted
EBITDA and a reconciliation of Adjusted EBITDA to net income, see "Use of Non-GAAP Financial Measures" below.
- •
- Growth and investment in Convio Go! and Common Ground. We
introduced Convio Go!, our mid-market COM offering, in the first quarter of 2008 and Common Ground in the third quarter of 2008. We believe these solutions have been very well received by
NPOs. Both Convio Go! and Common Ground are targeted primarily at mid-market NPOs and have had lower average pricing than our broader COM solution. Common Ground has higher gross margins
than our COM solution because Common Ground is hosted on the Force.com platform and deployment services are typically provided by third parties. We intend to continue to invest significantly in Convio
Go! and Common Ground research and development and sales and marketing. As a result, we expect the number of our mid-market clients to increase, and we expect our revenue from these
clients to grow in 2010. However, these solutions are new, and it is difficult for us to predict whether NPOs will continue to adopt these solutions or what impact these solutions will have on our
business.
- •
- Seasonality and fluctuations in usage revenue. A
significant portion of our usage revenue is derived from funds raised by our COM clients at special events. The growth and amount of usage revenue vary based on the number of events, the percent of
funds raised online for these events, the growth and success of events and our signing of new clients for events. We recognize the usage revenue from these events when we bill our clients. Usage
revenue is seasonal as events are typically held in the spring and fall. As a result, our usage revenue will be higher during the second and third quarters. In addition,
period-over-period comparisons may be impacted significantly by the addition or loss of any special events of our enterprise clients.
- •
- Sales commissions expensed upon sale. We expense sales
commissions in the period in which we sign our agreements, but we generally recognize the related revenue over the terms of those agreements. We may report poor operating results due to higher sale
commissions in a period in which we experience strong sales of our solutions, particularly sales to enterprise clients. Alternatively, we may report better operating results due to lower sales
commissions in a period in which we experience a slowdown in sales. As a result, our sales and marketing expenses are difficult to predict and fluctuate as a percentage of revenue.
- •
- Churn. Our management uses churn to monitor the satisfaction of our clients, to evaluate the effectiveness of our business strategies and as a factor in executive compensation. We define churn as the amount of any lost software monthly recurring revenue and usage revenue in a period,
43
divided by our software monthly recurring revenue at the beginning of the year plus our average usage revenue of the prior year. Despite the economic slowdown in 2009, we had annual churn of less than 10% which was lower than our churn in 2007 and 2008. However, our churn is variable, and we cannot predict our churn rate in future periods. Our use of churn has limitations as an analytical tool, and you should not consider it in isolation. Other companies in our industry may calculate churn differently, which reduces its usefulness as a comparative measure.
- •
- Impact of economic conditions. The downturn in economic conditions has caused many NPOs to be more cautious and to delay their purchases of technology and related services. During 2009, we faced increased pricing pressure on our COM solution, and sales of our COM solution to new clients declined. However, COM sales to existing clients increased. To incentivize NPOs to purchase our solutions, we invested heavily in the sales and marketing of our lower-priced Convio Go! and Common Ground solutions which resulted in higher sales of these solutions. We also offered short-term promotional sales programs. We will continue to evaluate our solutions and our sales and marketing programs based on general market conditions.
Discussion of Financial Information
The following discussion of our financial information is based upon our results of operations for the periods presented.
Revenue
We derive revenue from sales of our solutions to clients and their usage of these solutions. Our subscription and services revenue is comprised of fees from clients licensing our on-demand software modules and purchasing our consulting and other professional services. Our usage revenue is derived from agreements in which we receive a percentage of funds raised in connection with special events and also from additional fees received for increased use of our COM solution.
No single client accounted for more than 10% of our total revenue in 2007, 2008 or 2009. We derived approximately 18%, 22% and 22% of our total revenue from our top 10 clients in 2007, 2008 and 2009, respectively.
Subscription and Services Revenue. We derive a substantial amount of our revenue from multi-year subscription agreements with clients for licenses of our on-demand solutions. Substantially all of our agreements are for a fixed term. The terms of our agreements are typically three years for COM and one year for Common Ground. Generally, our agreements are also noncancellable although some of our agreements provide that our clients may terminate their agreements for convenience after a specified period of time. Some of our agreements also provide for the ability of a client to cancel its initial subscription for our solutions for performance-related reasons.
For COM, we typically agree to fees based on the number of modules licensed, email list size and any related services. For Common Ground, we agree to fees based on the number of seats purchased by the client. Subscription and services revenue is recognized ratably over the contract term beginning on the activation date.
We typically do not invoice clients the full contract amount at the time of signing an agreement. Rather, we invoice our clients periodically based on the terms of our agreements. We recognize deferred revenue at the time of our invoicing a client and only with respect to the invoiced amount for such period.
We also generate revenue from sales of our consulting and other services and recognize this revenue according to the manner of sale of the underlying services. If we sell our services with a subscription of on-demand software, we recognize the revenue derived from such services ratably over the term of the related agreement. When sold separately, we recognize the revenue derived from time-and-material contracts as the services are rendered, and we recognize the revenue derived from fixed price contracts as milestones are achieved and, if applicable, accepted by the client. We expect the revenue derived from
44
our services to continue to increase on an absolute dollar basis as we grow our client base, and continue to develop our professional services.
Usage Revenue. We have agreements in which we charge a percentage of funds raised by clients from their special events such as runs, walks and rides. Usage revenue typically does not include a percentage of funds raised online that are unrelated to these special events. Usage revenue is determined when donations are made online and is recognized when reported and billed to the client, which is normally done on a monthly basis. Due to the seasonality of these special events, we recognize the majority of our usage revenue in the second and third quarters. The growth and amount of usage revenue vary based on the number of events, the percent of funds raised online for these events, the growth in the events and our signing of new clients for events.
In addition to revenue from special events, we also derive usage revenue from increased use of our COM solution by our clients. We typically enter into subscription agreements that require payment of additional fees for usage of our COM solution above the levels included in the subscription fee set forth in the agreement. These fees are recognized when the usage amounts are reported and billed to clients.
Cost of Revenue
Cost of revenue includes costs related to hosting our on-demand solutions and providing our services. These costs consist of the salaries, incentive payments, bonuses and stock-based compensation of our consulting, deployment, client support, client education and information technology personnel and their related travel expenses. These costs also include third-party datacenter hosting fees, outside service provider costs, depreciation expense related to the hosting of our datacenters and allocated overhead.
In connection with our acquisition of GetActive, we recorded $3.0 million in acquired technology and are amortizing this amount as cost of revenue on a straight-line basis over three years ending in February 2010.
Our cost of revenue has generally increased in absolute dollars, and we expect that it will continue to increase as we grow our client base, sell more COM to our clients, manage additional online activity by our clients, use more third-party service providers and grow our services business. We expect that increased sales of Common Ground will not materially increase cost of revenue because Common Ground is hosted on the Force.com platform and deployment services are typically provided by third parties. As our client base grows, we intend to invest additional resources in technology, infrastructure and personnel to deliver our solutions to support our clients. The timing of these additional expenses could affect our cost of revenue, both in terms of absolute dollars and as a percentage of revenue, in any particular quarterly or annual period.
Cost of revenue as a percentage of revenue will fluctuate from period to period based on the seasonality of our usage revenue, but we generally expect cost of revenue to decrease as a percentage of revenue as we grow our client base, as we complete our migration of former GetActive clients to our COM platform, recognize a higher percentage of revenue from renewals and increase sales of Common Ground.
Operating Expenses
Each operating expense category, including cost of revenue, reflects an overhead expense allocation. We allocate overhead such as rent, employee benefits, insurance and information technology costs and depreciation on equipment other than our equipment at our datacenters, to all departments based on relative headcount. We expect our aggregate overhead expense to increase in absolute dollars as we grow our business, increase headcount, occupy additional space and incur higher fees from employee benefit providers. Allocated overhead may also fluctuate in future periods if we are required to make payments under our self-insured benefit plans.
45
Sales and Marketing. Sales and marketing expenses consist of salaries, commissions, incentive payments, bonuses and stock-based compensation of our sales, marketing, account management and business development personnel. These expenses also include travel expenses, marketing programs, client events, corporate communications, partner referral fees and allocated overhead.
We expense commissions in the period of a sale of our solutions. As we generally recognize revenue over the terms of our agreement, we incur commission expenses prior to recognizing the underlying revenue. As a result, our sales and marketing expenses have historically fluctuated as a percentage of revenue, and we expect such fluctuations to occur in the future.
We expect our sales and marketing expenses to increase in absolute dollars as we sell more solutions and incur related commissions, continue to hire additional personnel in these areas and increase the level of marketing activities to grow our business and brand. We believe that sales and marketing expenses as a percentage of revenue will generally decrease as our revenue base grows, sales and marketing personnel become more effective and usage revenue and revenue from renewals and upsells increase.
Research and Development. Research and development expenses consist of salaries, incentive payments, bonuses and stock-based compensation of our software development and quality assurance personnel. We expense all research and development costs as they are incurred. We expect our research and development expenses to increase in absolute dollars and as a percentage of revenue as we continue to invest in new features, platform extensibility and Common Ground.
General and Administrative Expenses. General and administrative expenses consist of salaries, incentive payments, bonuses and stock-based compensation of our executive, finance and accounting, human resources and legal personnel. These expenses also include legal fees, audit and tax fees and other general corporate expenses. We expect general and administrative expenses to increase as we continue to add personnel and incur additional expenses as we grow our business and comply with the requirements of operating as a public company, which we expect to be at least $1.0 million per year.
Amortization of Other Intangibles. Other intangible assets consist of customer relationships, tradenames and agreements not to compete acquired in connection with the GetActive acquisition. We recorded $9.0 million in other identifiable intangible assets in connection with the acquisition, and we amortize these amounts on a straight-line basis over their estimated useful lives as follows:
| |
Allocated Amount |
Estimated Useful Life |
|||
|---|---|---|---|---|---|
| |
(in thousands) |
||||
Customer relationships |
$ | 7,007 | 9 years | ||
Tradenames |
1,850 | 3 years | |||
Agreements not to compete |
110 | 2 years | |||
The agreements not to compete were fully amortized in February 2009, and the tradenames will be fully amortized in February 2010.
Critical Accounting Policies
Our consolidated financial statements are prepared in accordance with generally accepted accounting principles in the United States, or GAAP. The preparation of these consolidated financial statements requires management to make estimates and assumptions that affect the reported amounts of assets and liabilities and disclosure of contingent assets and liabilities as of the date of the financial statements and reported amounts of revenues and expenses during the reporting periods. We base our estimates on historical experience and on various other assumptions management believes to be reasonable under the circumstances. Management could have reasonably used different accounting estimates, and in other instances changes in the accounting estimates are reasonably likely to occur from period to period.
46
Accordingly, actual results could differ significantly from those estimates. To the extent that such differences are material, our future financial statement presentation, financial condition, results of operations and cash flows may be affected.
In many cases, the accounting treatment of a particular transaction is specifically dictated by GAAP and does not require management's judgment in its application, while in other cases, management's judgment is required in selecting among available alternative accounting standards that allow different accounting treatment for similar transactions. We believe that our significant accounting policies, which are described in note 2 to our audited financial statements, and the accounting policies discussed below are critical to understanding our historical and future performance, as these policies relate to the more significant areas involving management's judgments and estimates. Our management has reviewed these critical accounting policies, our use of estimates and the related disclosures with our audit committee.
Revenue Recognition
We derive our revenue from subscriptions, services and usage. We recognize revenue under the applicable accounting guidance, as prescribed in ASC Topic 985, for software revenue recognition. We provide our software as a service, and our subscription agreements do not provide clients the right to take possession of the software at any time. As an on-demand software provider, our arrangements do not contain general rights of return. We recognize revenue when all of the following conditions are met:
- •
- there is persuasive evidence of an arrangement;
- •
- the service has been provided to the client;
- •
- the collection of fees is reasonably assured; and
- •
- the amount of fees to be paid by the client is fixed or determinable.
Subscription and services revenue is recognized ratably over the term of the agreement beginning on the activation date. Amounts that have been invoiced are recorded in accounts receivable and in deferred revenue or revenue depending on whether the revenue recognition criteria have been met.
Services revenues, when sold with a subscription of our modules, do not qualify for separate accounting as we do not have objective and reliable evidence of fair value of the undelivered subscription service. Therefore, we recognize services revenue ratably over the term of the related subscription agreement.
When we sell services other than with the subscription of our modules, we consider the following factors to determine the proper accounting:
- •
- availability of the services from other vendors;
- •
- whether objective and reliable evidence for fair value exists for the undelivered elements;
- •
- the nature of the services;
- •
- the timing of when the services agreement was signed in comparison to the subscription service start date; and
- •
- the contractual dependence of the subscription service on the client's satisfaction with the services.
When we sell services other than with the subscription of our modules, we recognize revenue under time-and-material contracts as the services are rendered, and we recognize revenue from fixed price agreements as milestones are achieved and, if applicable, accepted by the client.
Certain clients have agreements that provide for a percentage of donations received online through our modules to be paid to us in place of or in conjunction with the standard monthly subscription fee. In addition, certain clients have contracts which require payment of additional fees for usage above the
47
levels included in their agreements. These additional fees are recognized as revenue when the usage amounts are determined and reported and billed to the client.
Allowance for Doubtful Accounts
Based on a review of the current status of our existing accounts receivable and historical collection experience, we have established an estimate of our allowance for doubtful accounts. We make judgments as to our ability to collect outstanding receivables and provide allowances for the portion of receivables when collection becomes doubtful. Provisions are made based on a consideration of the aging of the accounts receivable balances, historical write-off experience, current economic conditions and client-specific information. For those invoices not specifically reviewed, provisions are provided based on our collection history and current economic trends. As a result, if our actual collections are lower than expected, additional allowances for doubtful accounts may be needed and our future results of operations and cash flows could be negatively affected. Write-offs of accounts receivable and recoveries were insignificant during each of 2007, 2008 and 2009. A one percent change in our allowance for doubtful accounts would not have a material effect on our consolidated financial statements.
Valuation of Goodwill and Identifiable Intangible Assets
We apply ASC Topic 350 in accounting for the valuation of goodwill and identifiable intangible assets. In accordance with this guidance, we replaced the ratable amortization of goodwill and other indefinite-lived intangible assets with a periodic review and analysis for possible impairment. We assess our goodwill on October 1 of each year or more frequently if events or changes in circumstances indicate that goodwill might be impaired. The events and circumstances that we consider include deterioration in the performance of the acquired business, adverse market conditions, adverse changes in applicable laws or regulations, including changes that restrict the activities of the acquired business, and a variety of other circumstances. Because we operate in a single segment, we perform the impairment test at the consolidated entity level by comparing the estimated fair value of the company to the carrying value of the goodwill. Our goodwill impairment test requires the use of fair-value techniques which are inherently subjective.
We determine fair value using a combination of the income approach, which utilizes a discounted cash flow model, and the market value approach. Both of these approaches are developed from the perspective of a market participant. Under the income approach, we calculate the fair value of the company unit based on the present value of estimated future cash flows. Under the market approach, we estimate the fair value based on market multiples of revenue and earnings for comparable publicly-traded companies or comparable sales transactions of similar companies. The estimates and assumptions used in our calculations include revenue growth rates, expense growth rates, expected capital expenditures to determine projected cash flows, expected tax rates, and an estimated discount rate to determine present value of expected cash flows. These estimates are based on historical experiences, our projections of future operating activity and our weighted average cost of capital.
Both of these approaches include inherent uncertainties. With the income approach there are uncertainties around our estimates of the future cash flows of our company; the most significant of which include our estimates of future revenue growth, operating expense growth, and projected cash flows from operations. In making these estimates, we have considered factors important to our business, including gross bookings, pricing, market penetration, competition, seasonality, and customer churn. With the market approach, uncertainties exist around future market valuations of comparable publicly-traded companies. Significant changes in these estimates or their related assumptions in the future for the income and market approaches could result in an impairment charge related to our goodwill.
In addition, we periodically review the estimated useful lives of our identifiable intangible assets, taking into consideration any events or circumstances that might result in either a diminished fair value or revised useful life, using a two-step approach. The first step screens for impairment and, if impairment is indicated, we will employ a second step to measure the impairment. If we determine that an
48
impairment has occurred, we will record a write-down of the carrying value and charge the impairment as an operating expense in the period the determination is made. Although we believe goodwill and intangible assets are appropriately stated in our consolidated financial statements, changes in strategy or market conditions could significantly impact these judgments and require an adjustment to the recorded balance.
Preferred Stock Warrants
Freestanding warrants related to shares that are redeemable are accounted for in accordance with the applicable guidance in ASC Topic 480. Under the provisions of this guidance, we classify the freestanding warrants that are related to our convertible preferred stock as a liability on our balance sheet. The warrants are subject to re-measurement at each balance sheet date, and we recognize any change in fair value as a component of other income (expense). We will continue to adjust the liability for changes in fair value until the earlier of (1) the exercise or expiration of the warrants or (2) the completion of a liquidation event, including the completion of an initial public offering, at which time all preferred stock warrants will be converted into warrants to purchase common stock and the liability will be reclassified to additional paid-in capital.
We estimate the fair value of the preferred stock warrant liability using the Black-Scholes valuation method which requires us to make a number of estimates and assumptions. For the valuation inputs to the Black-Scholes valuation model, we utilized the following assumptions: (1) estimated fair value of preferred stock—the fair value of our common stock; (2) exercise price—the exercise price of the warrant units; (3) expected life—the remaining term of the warrant units; (4) risk-free interest rate—the U.S. Treasury yield curve in place at each quarterly measurement date; (5) dividend yield—zero; (6) forfeiture rate—zero; and (7) volatility—the same as used for the common stock option grants made during the quarter of each measurement.
| |
Three Months Ended | ||||||||||||
|---|---|---|---|---|---|---|---|---|---|---|---|---|---|
| |
Mar 31 2007 |
Jun 30 2007 |
Sep 30 2007 |
Dec 31 2007 |
|||||||||
Weighted-average fair value of warrants outstanding |
$ | 3.72 | $ | 6.31 | $ | 8.92 | $ | 9.72 | |||||
Risk-free interest rate |
4.70 | % | 4.94 | % | 4.03 | % | 3.44 | % | |||||
Expected volatility |
0.59 | 0.54 | 0.54 | 0.54 | |||||||||
Weighted-average expected life in years |
6.35 | 6.10 | 5.85 | 5.81 | |||||||||
Dividend yield |
— | — | — | — | |||||||||
| |
Three Months Ended | ||||||||||||
|---|---|---|---|---|---|---|---|---|---|---|---|---|---|
| |
Mar 31 2008 |
Jun 30 2008 |
Sep 30 2008 |
Dec 31 2008 |
|||||||||
Weighted-average fair value of warrants outstanding |
$ | 5.03 | $ | 3.52 | $ | 3.72 | $ | 2.30 | |||||
Risk-free interest rate |
2.47 | % | 3.68 | % | 2.87 | % | 2.84 | % | |||||
Expected volatility |
0.56 | 0.57 | 0.56 | 0.60 | |||||||||
Weighted-average expected life in years |
5.56 | 5.31 | 5.06 | 4.81 | |||||||||
Dividend yield |
— | — | — | — | |||||||||
49
| |
Three Months Ended | ||||||||||||
|---|---|---|---|---|---|---|---|---|---|---|---|---|---|
| |
Mar 31 2009 |
Jun 30 2009 |
Sep 30 2009 |
Dec 31 2009 |
|||||||||
Weighted-average fair value of warrants outstanding |
$ | 3.01 | $ | 3.24 | $ | 3.64 | $ | 5.65 | |||||
Risk-free interest rate |
1.92 | % | 2.87 | % | 2.29 | % | 2.29 | % | |||||
Expected volatility |
0.66 | 0.66 | 0.65 | 0.64 | |||||||||
Weighted-average expected life in years |
4.56 | 4.31 | 4.28 | 4.02 | |||||||||
Dividend yield |
— | — | — | — | |||||||||
In estimating the fair value of the Series A convertible preferred stock, we consider the following factors, among others: market transactions with preferred stockholders; quarterly valuation results for the common stock as determined by the Board of Directors; the rights and privileges of the Series A convertible preferred stockholders in comparison to the common stockholders and expectations of the Series A convertible preferred stockholders regarding future possible liquidity events of ours. There have been limited market transactions with preferred stockholders, and therefore we have placed a higher consideration on the other noted factors. In considering the above factors, we concluded that the estimated fair value of our common stock was the best indicator of the fair value of the Series A convertible preferred stock and thus utilized the fair value of the common stock as a reasonable estimate of the fair value of the Series A convertible preferred stock. Significant judgment is required in determining the expected volatility of our common stock. The expected volatility of the stock is determined based on our peer group in the industry in which we do business because we do not have sufficient historical volatility data for our own stock. In the future, as we gain historical data for volatility in our own stock, expected volatility may change which could substantially change the measurement date fair value and ultimately the other income (expense) we record.
Stock-Based Compensation
Prior to January 1, 2006, we accounted for employee stock options using the intrinsic value method in accordance with Accounting Principles Board Opinion No. 25, "Accounting for Stock Issued to Employees", or APB No. 25, and Financial Accounting Standards Board, or FASB, Interpretation No. 44, "Accounting for Certain Transactions Involving Stock Compensation, an Interpretation of APB No. 25." The intrinsic value represents the difference between the per share market price of the stock on the date of grant and the per share exercise price of the respective stock option. We generally grant stock options to employees for a fixed number of shares with an exercise price equal to the fair value of the shares on the date of grant. Under APB No. 25, no compensation expense was recorded for employee stock options granted at an exercise price equal to the market price of the underlying stock on the date of grant.
On January 1, 2006, we adopted the provisions of the applicable guidance under ASC Topic 718 for share-based payment transactions. Under the provision of this guidance, stock-based compensation costs for employees is measured on the grant date, based on the estimated fair value of the award on that date, and is recognized as expense over the employee's requisite service period, which is generally over the vesting period, on a straight-line basis. We adopted this guidance using the prospective transition method. Under this transition method, non-vested option awards outstanding at January 1, 2006, continue to be accounted for under the minimum value method, and all awards granted, modified or settled after the date of adoption are accounted for using the measurement, recognition and attribution provisions of this guidance.
Under the provisions of this guidance, we make a number of estimates and assumptions. The estimation of stock awards that will ultimately vest requires judgment, and to the extent actual results differ from our estimates, such amounts will be recorded as an adjustment in the period estimates are revised. Actual results may differ substantially from these estimates. In valuing share-based awards under this guidance, significant judgment is required in determining the expected volatility of our common stock and the expected term individuals will hold their share-based awards prior to exercising. Expected
50
volatility of the stock is based on our peer group in the industry in which we do business because we do not have sufficient historical volatility data for our own stock. The expected term of options granted represents the period of time that options granted are expected to be outstanding and is calculated based on historical information. In the future, as we gain historical data for volatility in our own stock and more data on the actual term employees hold our options, expected volatility and expected term may change which could substantially change the grant-date fair value of future awards of stock options and ultimately the expense we record.
During 2008, 2009 and the first quarter of 2010, we granted options to purchase our common stock as follows:
| Grant Date | Shares(1) | Per Share Exercise Price |
Black-Scholes Per Share Fair Value |
Aggregate Fair Value |
||||||||||
|---|---|---|---|---|---|---|---|---|---|---|---|---|---|---|
| |
(in thousands, except per share amounts) |
|||||||||||||
2008: |
||||||||||||||
First quarter |
74 | $ | 9.20 | $ | 4.418 | $ | 325 | |||||||
Second quarter |
432 | 7.81 | 3.892 | 1,681 | ||||||||||
Third quarter |
5 | 5.99 | 2.926 | 15 | ||||||||||
Fourth quarter |
31 | 6.39 | 3.273 | 101 | ||||||||||
2009: |
||||||||||||||
First quarter |
139 | $ | 4.57 | $ | 2.452 | $ | 341 | |||||||
Second quarter |
385 | 5.40 | 2.818 | 1,085 | ||||||||||
Third quarter |
14 | 5.71 | 3.011 | 42 | ||||||||||
Fourth quarter |
6 | 6.31 | 3.244 | 19 | ||||||||||
2010: |
||||||||||||||
First quarter |
239 | 8.75 | $ | 4.434 | $ | 1,061 | ||||||||
- (1)
- Excludes options exercisable for 1,145,726 shares of our common stock that were issued in March 2009 pursuant to an exchange offer and have an exercise price of $4.57 per share, which was the estimated fair market value of our common stock as of the date of issuance. These options had Black-Scholes option fair values ranging from $0.2830 to $2.5477. In accordance with ASC Topic 718, we incurred a one-time stock-based compensation charge of $435,000 which represented the incremental value of the vested exchanged options. In addition, we recorded an additional incremental value of $155,000 related to the unvested exchanged options, which will be amortized over their remaining vesting periods.
The ASC Topic 718 Black-Scholes fair value of each grant was estimated using the following assumptions:
| Grant Date | Estimated Fair Market Value |
Dividend Yield |
Volatility | Expected Life (Years) |
Forfeitures | Risk-Free Interest Rate |
||||||||||
|---|---|---|---|---|---|---|---|---|---|---|---|---|---|---|---|---|
2008: |
||||||||||||||||
First quarter |
$ | 9.20 | — | 0.55 - 0.56 | 4.6 | 20 | % | 2.47% - 2.63% | ||||||||
Second quarter |
7.81 | — | 0.57 | 4.6 | 20 | 3.06 - 3.68 | ||||||||||
Third quarter |
5.99 | — | 0.56 | 4.6 | 20 | 2.87 | ||||||||||
Fourth quarter |
6.39 | — | 0.60 | 4.6 | 20 | 2.84 | ||||||||||
2009: |
||||||||||||||||
First quarter |
$ | 4.57 | — | 0.65 - 0.66 | 4.5 - 4.6 | 20 | % | 1.89 - 1.92 | ||||||||
Second quarter |
5.40 | — | 0.66 | 4.2 - 4.3 | 20 | 2.02 - 2.87 | ||||||||||
Third quarter |
5.71 | — | 0.65 | 4.3 | 20 | 2.29 - 2.66 | ||||||||||
Fourth quarter |
6.31 | — | 0.64 | 4.3 | 20 | 2.29 | ||||||||||
2010: |
||||||||||||||||
First quarter |
8.75 | — | 0.63 | 4.3 | 20 | 2.29 | ||||||||||
51
Based on the foregoing, as of December 31, 2009 we had approximately $3.9 million of unrecognized stock-based compensation expense that will be expensed over a weighted average period of approximately 2.5 years.
The table below shows the intrinsic value of our outstanding vested and unvested options as of December 31, 2009 based upon an assumed initial public offering price of $11.00 per share.
| |
Number of Shares Underlying Options |
Aggregate Intrinsic Value |
|||||
|---|---|---|---|---|---|---|---|
| |
(in thousands) |
||||||
Total vested options outstanding |
2,067 | $ | 18,160 | ||||
Total unvested options outstanding |
1,062 | 6,562 | |||||
Total options outstanding |
3,129 | 24,722 | |||||
Significant Factors, Assumptions and Methodologies Used in Determining Fair Value.
In valuing our common stock, our board utilizes a probability weighted expected return method to estimate the value of our common stock based upon an analysis of expected future cash flows considering possible future liquidity events, as well as the rights and preferences of each share class. In determining the value of our common stock, our board and management considered three possible scenarios: (i) an acquisition by another company, or an acquisition scenario, (ii) the completion of an initial public offering, or an IPO Scenario, and (iii) remaining private, or a private scenario.
In valuing our common stock in the acquisition scenario, we determine a business enterprise value of our company using an income approach which estimates the present value of future estimated debt-free cash flows, based upon forecasted revenue and costs. Our board adds these discounted cash flows to the present value of our estimated enterprise terminal value, the multiple of which is derived from comparable company market data. Our board discounts these future cash flows to their present values using a rate corresponding to our estimated weighted average cost of capital.
In valuing our common stock in the IPO Scenario, we utilize a market approach which estimates the fair value of a company by applying to that company the market multiples of publicly-traded companies. Based on the range of these observed multiples, we apply judgment in determining an appropriate multiple to apply to our metrics in order to derive an indication of value.
In valuing our common stock in the private scenario, we apply the income approach utilizing a terminal period value calculated using the Gordon growth model and a residual revenue growth rate of 5% in the terminal year based on our expectation of long-term growth.
First Quarter 2008. From February 2008 to March 2008, in our determination of fair value, our board analyzed the factors above, the events since the grant of options in December 2007, the current status and proposed timing of our initial public offering and a contemporaneous valuation report, dated January 31, 2008, to arrive at a fair value of our common stock of $9.20 per share.
In connection with the acquisition scenario, our board determined fair value using an income approach utilizing discounted net cash flows from January 31, 2008 through October 1, 2008, plus an exit value at October 1, 2008 based upon acquisition multiples. In connection with the IPO Scenario, our board determined fair value using discounted net cash flows from January 31, 2008 through October 1, 2008, plus an exit value at October 1, 2008 based upon comparable company 2008 forward revenue multiples. Our board concluded that equity value to revenue would yield the most appropriate indication of value for us because we did not have positive income from operations or net income. To arrive at the fair value of our common stock under the private scenario, we applied the income approach utilizing discounted net cash flows. However, rather than utilizing an eight-month discrete period as in
52
the acquisition scenario, the private scenario utilized a four-year and eleven-month discrete period with a terminal period growth rate of 5.0%.
Using the income approach for the acquisition scenario, our board determined an equity value of $196.1 million. Using the Guideline Public Company Method, our board determined an equity value of $176.6 million. Using the income approach for the private scenario, our board determined an equity value of $54.2 million. Our board then estimated the probability of the future liquidity event being our initial public offering at 70% and each of the other alternatives were estimated to have 15% probabilities. Using the probability weighted expected return method the board arrived at a fair value of our common stock of $9.20.
Second Quarter 2008. From April 2008 through June 2008, U.S. financial and stock markets declined and the economy slowed as evidenced by the deceleration in gross domestic product and the United States housing market decline. During this time, our board determined a fair value of our common stock of $7.81 per share. Our board analyzed the factors above, the events since the grant of options in March 2008, the current status and proposed timing of our initial public offering as well as a contemporaneous valuation report, dated March 31, 2008, to arrive at a fair value of our common stock of $7.81 per share.
In connection with the acquisition scenario, our board determined fair value using an income approach utilizing discounted net cash flows from March 31, 2008 through March 31, 2009, plus an exit value at March 31, 2009 based upon acquisition multiples. In connection with the IPO Scenario, our board determined fair value using discounted net cash flows from March 31, 2008 through October 1, 2008, plus an exit value at October 1, 2008 based upon comparable company 2008 forward revenue multiples. Our board concluded that equity value to revenue would yield the most appropriate indication of value for us because we had not yet experienced positive income from operations or net income. To arrive at the fair value of our common stock under the private scenario, we applied the income approach utilizing discounted net cash flows. However, rather than utilizing an approximately one-year discrete period as in the acquisition scenario, the private scenario utilized a four-year and nine-month discrete period with a terminal period growth rate of 5.0%.
Using the income approach for the acquisition scenario, our board determined an equity value of $142.7 million. Using the Guideline Public Company Method, our board determined an equity value of $150.0 million. Using the income approach for the private scenario, our board determined an equity value of $58.7 million. Our board then estimated the probability of the future liquidity event being our initial public offering at 70% and each of the other alternatives were estimated to have 15% probabilities. Using the probability weighted expected return method the board arrived at a fair value of our common stock of $7.81.
Third Quarter 2008. From June 2008 through September 2008, the United States economy declined further and U.S. financial and stock markets worsened. During this time, our board determined a fair value of common stock of $5.99 per share. On August 5, 2008, we filed a request with the Securities and Exchange Commission to withdraw our Registration Statement on Form S-1. Our board analyzed the factors above, the events since the grant of options in June 2008, the fact that we had filed to withdraw our proposed initial public offering as well as a contemporaneous valuation report, dated June 30, 2008, to arrive at a fair value of our common stock of $5.99 per share.
In connection with the acquisition scenario, our board determined fair value using an income approach utilizing discounted net cash flows from June 30, 2008 through December 31, 2009, plus an exit value at December 31, 2009 based upon acquisition multiples. In connection with the IPO Scenario, our board determined fair value using discounted net cash flows from June 30, 2008 through December 31, 2009, plus an exit value at December 31, 2009 based upon comparable company 2009 forward revenue multiples. Our board concluded that equity value to revenue would yield the most appropriate indication of value for us because we had not yet experienced positive income from
53
operations or net income. To arrive at the fair value of our common stock under the private scenario, we applied the income approach utilizing discounted net cash flows. However, rather than utilizing an approximately one-year and three-month discrete period as in the acquisition scenario, the private scenario utilized a four-year and six-month discrete period with a terminal period growth rate of 5.0%.
Using the income approach for the acquisition scenario, our board determined an equity value of $159.5 million. Using the Guideline Public Company Method, our board determined an equity value of $147.7 million. Using the income approach for the private scenario, our board determined an equity value of $82.9 million. Our board then estimated the probability of each of the alternatives to be 33%. Using the probability weighted expected return method the board arrived at a fair value of our common stock of $5.99.
Fourth Quarter 2008. From September 2008 through October 2008, our board analyzed the factors above, the events since the grant of options in September 2008, the state of the United States capital markets as well as a contemporaneous valuation report, dated September 30, 2008, to arrive at a fair value of our common stock of $6.39 per share.
In connection with the acquisition scenario, our board determined fair value using an income approach utilizing discounted net cash flows from September 30, 2008 through June 30, 2010, plus an exit value at June 30, 2010 based upon acquisition multiples. In connection with the IPO Scenario, our board determined fair value using discounted net cash flows from September 30, 2008 through June 30, 2010, plus an exit value at June 30, 2010 based upon comparable company 2009 forward revenue multiples. Our board concluded that equity value to revenue would yield the most appropriate indication of value for us because we had not yet experienced positive income from operations or net income. To arrive at the fair value of our common stock under the private scenario, we applied the income approach utilizing discounted net cash flows. However, rather than utilizing an approximately one-year and nine-month discrete period as in the acquisition scenario, the private scenario utilized a four-year and three-month discrete period with a terminal period growth rate of 5.0%.
Using the income approach for the acquisition scenario, our board determined an equity value of $173.1 million. Using the Guideline Public Company Method, our board determined an equity value of $156.8 million. Using the income approach for the private scenario, our board determined an equity value of $90.6 million. Our board then estimated the probability of each of the alternatives to be 33%. Using the probability weighted expected return method the board arrived at a fair value of our common stock of $6.39.
First Quarter 2009. From October 2008 through March 2009, United States financial and stock markets fell into crisis and the economic downturn deepened in the U.S and the world. U.S. stock markets declined significantly during the last two months of 2008, and a new administration and government proposals to provide economic stimulus caused high levels of uncertainty. The enterprise value of many of our publicly-traded peers fell sharply during this period and our projected revenue growth decreased significantly in the short term. Our board analyzed the factors above, the events since the grant of options in October 2008, the state of the U.S. capital markets and their impact on comparable publicly-traded peers as well as a contemporaneous valuation report, dated December 31, 2008, to arrive at a fair value of our common stock of $4.57 per share.
In connection with the acquisition scenario, our board determined fair value using an income approach utilizing discounted net cash flows from December 31, 2008 through June 30, 2010, plus an exit value at June 30, 2010 based upon acquisition multiples. In connection with the IPO Scenario, our board determined fair value using discounted net cash flows from December 31, 2008 through June 30, 2010, plus an exit value at June 30, 2010 based upon comparable company 2009 forward revenue multiples. Our board concluded that equity value to revenue would yield the most appropriate indication of value for us because we had not yet experienced positive income from operations or net income. To arrive at the fair value of our common stock under the private scenario, we applied the
54
income approach utilizing discounted net cash flows. However, rather than utilizing an approximately one-year and six-month discrete period as in the acquisition scenario, the private scenario utilized a five-year discrete period with a terminal period growth rate of 5.0%.
Using the income approach for the acquisition scenario, our board determined an equity value of $149.6 million. Using the Guideline Public Company Method, our board determined an equity value of $80.6 million. Using the income approach for the private scenario, our board determined an equity value of $86.6 million. Our board then estimated the probability of each of the alternatives to be 33%. Using the probability weighted expected return method the board arrived at a fair value of our common stock of $4.57.
Second Quarter 2009. From March 2009 through June 2009, the United States economy continued to be weak and access to the capital and debt markets remained challenging, but the United States financial and stock markets began to make a slow recovery after March 2009 and the enterprise value of our publicly-traded peers began to recover during this period. Our board analyzed the factors above, the events since the grant of options in March 2009, the slight recovery of the U.S. capital markets and their impact on comparable publicly-traded peers as well as a contemporaneous valuation report, dated March 31, 2009, to arrive at a fair value of our common stock of $5.40 per share.
In connection with the acquisition scenario, our board determined fair value using an income approach utilizing discounted net cash flows from March 31, 2009 through June 30, 2010, plus an exit value at June 30, 2010 based upon acquisition multiples. In connection with the IPO Scenario, our board determined fair value using discounted net cash flows from March 31, 2009 through June 30, 2010, plus an exit value at June 30, 2010 based upon comparable company 2010 forward revenue multiples. Our board concluded that equity value to revenue would yield the most appropriate indication of value for us because we had not yet experienced positive income from operations or net income. To arrive at the fair value of our common stock under the private scenario, we applied the income approach utilizing discounted net cash flows. However, rather than utilizing an approximately one-year and three-month discrete period as in the acquisition scenario, the private scenario utilized a four-year and nine-month discrete period with a terminal period growth rate of 5.0%.
Using the income approach for the acquisition scenario, our board determined an equity value of $157.8 million. Using the Guideline Public Company Method, our board determined an equity value of $109.5 million. Using the income approach for the private scenario, our board determined an equity value of $103.9 million. Our board then estimated the probability of each of the alternatives to be 33%. Using the probability weighted expected return method the board arrived at a fair value of our common stock of $5.40.
Third Quarter 2009. From June 2009 through September 2009, the United States economy began to stabilize, U.S. stock markets improved and access to capital and debt markets began to improve. Our board analyzed the factors above, the events since the grant of options in June 2009, the continued recovery of the U.S. capital markets and the opening of capital markets as well as a contemporaneous valuation report, dated June 30, 2009, to arrive at a fair value of our common stock of $5.71 per share.
In connection with the acquisition scenario, our board determined fair value using an income approach utilizing discounted net cash flows from June 30, 2009 through June 30, 2010, plus an exit value at June 30, 2010 based upon acquisition multiples. In connection with the IPO Scenario, our board determined fair value using discounted net cash flows from June 30, 2009 through June 30, 2010, plus an exit value at June 30, 2010 based upon comparable company 2010 forward revenue multiples. Our board concluded that equity value to revenue would yield the most appropriate indication of value for us because we had not yet experienced positive income from operations or net income. To arrive at the fair value of our common stock under the private scenario, we applied the income approach utilizing discounted net cash flows. However, rather than utilizing an approximately one-year discrete period as in
55
the acquisition scenario, the private scenario utilized a four-year and six-month discrete period with a terminal period growth rate of 5.0%.
Using the income approach for the acquisition scenario, our board determined an equity value of $147.1 million. Using the Guideline Public Company Method, our board determined an equity value of $155.0 million. Using the income approach for the private scenario, our board determined an equity value of $82.2 million. Our board then estimated the probability of each of the alternatives to be 33%. Using the probability weighted expected return method the board arrived at a fair value of our common stock of $5.71.
Fourth Quarter 2009. From September 2009 through October 2009, our sales performance showed considerable improvement and our outlook under various initial public offering and acquisition scenarios improved as did the enterprise value of comparable publicly-traded peers. Our board analyzed the factors above, the events since the grant of options in September 2009, the continued recovery of the U.S. capital markets and the opening of capital markets as well as a contemporaneous valuation report, dated September 30, 2009, to arrive at a fair value of our common stock of $6.31 per share.
In connection with the acquisition scenario, our board determined fair value using an income approach utilizing discounted net cash flows from September 30, 2009 through June 30, 2010, plus an exit value at June 30, 2010 based upon acquisition multiples. In connection with the IPO Scenario, our board determined fair value using discounted net cash flows from September 30, 2009 through June 30, 2010, plus an exit value at June 30, 2010 based upon comparable company 2010 forward revenue multiples. Our board concluded that equity value to revenue would yield the most appropriate indication of value for us because we had not yet experienced positive income from operations or net income. To arrive at the fair value of our common stock under the private scenario, we applied the income approach utilizing discounted net cash flows. However, rather than utilizing an approximately nine-month discrete period as in the acquisition scenario, the private scenario utilized a four-year and three-month discrete period with a terminal period growth rate of 5.0%.
Using the income approach for the acquisition scenario, our board determined an equity value of $135.5 million. Using the Guideline Public Company Method, our board determined an equity value of $165.9 million. Using the income approach for the private scenario, our board determined an equity value of $111.9 million. Our board then estimated the probability of the future liquidity event being our initial public offering at 40%, the probability of the future liquidity event being an acquisition at 20% and the probability of staying private at 40%. Using the probability weighted expected return method the board arrived at a fair value of our common stock of $6.31.
First Quarter 2010. From December 2009 through March 2010, our sales performance continued to improve, and in December 2009, we commenced our IPO process. Our board considered these factors and the events since the grant of options in October 2009, including the filing of our registration statement in connection with the continued recovery and opening of the capital markets as well as a contemporaneous valuation report dated December 31, 2009, to arrive at a fair value of our common stock of $8.75 per share after giving effect to an 18.5% marketability discount. Our board applied this marketability discount due to several qualitative considerations such as the lack of a ready market for our shares and the continuing uncertainties in the initial public offering market, our diverse capitalization structure, growth and prospects for future growth. The discount rate was determined for the initial public offering and merger and acquisition scenarios using a Black-Scholes methodology that sought to determine the cost of providing portfolio insurance for the current value of the shares. For the private company scenario, our board relied on several marketability studies to quantify a value.
In connection with the acquisition scenario, our board determined fair value using an income approach utilizing discounted net cash flows from December 31, 2009 through June 30, 2010, plus an exit value at June 30, 2010 based upon acquisition multiples. In connection with the IPO Scenario, our board determined fair value using discounted net cash flows from December 31, 2009 through June 30,
56
2010, plus an exit value at June 30, 2010 based upon comparable company 2010 forward revenue multiples. Our board concluded that equity value to revenue would yield the most appropriate indication of value for us because we had not yet experienced positive income from operations or net income. To arrive at the fair value of our common stock under the private scenario, we applied the income approach utilizing discounted net cash flows. However, rather than utilizing an approximately six-month discrete period as in the acquisition scenario, the private scenario utilized a five-year discrete period with a terminal period growth rate of 5.0%.
Using the income approach for the acquisition scenario, our board determined an equity value of $172.9 million. Using the Guideline Public Company Method, our board determined an equity value of $181.2 million. Using the income approach for the private scenario, our board determined an equity value of $103.7 million. Our board then estimated the probability of the future liquidity event being our initial public offering at 70% and each of the other alternatives were estimated to have 15% probabilities. Using the probability weighted expected return method the board arrived at a fair value of our common stock of $8.75, which reflected an 18.5% marketibility discount from $10.74 a share. Our board issued options to acquire 234,456 shares of our common stock on February 4, 2010 and options to acquire 4,892 shares of our common stock on March 11, 2010 with exercise prices equal to $8.75 after applying the 18.5% marketibility discount.
On March 23, 2010, our underwriters communicated to us an estimated valuation range of $10.00 to $12.00 per share of common stock to be sold in our initial public offering, assuming an offering is completed within one month. We considered the valuation range proposed by the underwriters relative to our financial results and the current economic conditions. Specifically, our underwriters noted a significant increase in the market values of comparable public companies beginning in mid-February 2010. In addition, we filed amendments on March 1 and March 19, 2010 to our registration statement. The amendments signaled that an initial public offering was becoming more likely, which would result in liquidity for the common stock and elimination of the superior rights and preferences of the preferred stock. These factors positively affected assumptions of the expected type, timing and likelihood of possible liquidity scenarios. Furthermore, our prospects and our expectations of growth continued to improve and our outlook regarding the fair market value of our common stock under various IPO and acquisition scenarios improved.
Our board of directors also took into account that the estimated initial public offering price range necessarily assumed that the initial public offering had occurred, a public market for our common stock had been created and that our preferred stock had been reclassified into common stock in connection with the initial public offering, and therefore excluded any marketability or illiquidity discount for our common stock and excluded the superior rights and preferences of our preferred stock. After considering the estimated valuation range and these other factors, our board of directors concluded that the midpoint of the range provided by our underwriters of $11.00 per share is a reasonable estimate of the fair value of our common stock at March 23, 2010.
The midpoint of the estimated range of $11.00 per share is greater than the estimated fair market values of our common stock based on the stock options granted to our employees and non-employee members of our board of directors since January 2008. These differences are explained by the factors noted above and below. Between October 2008 and October 2009, adverse changes in global financial and stock markets and deteriorating business conditions in the United States resulted in a freezing of capital and credit conditions, and the United States and global economies fell into a deep recession and economic contraction, before the United States financial and stock markets began to recover in March 2009 and the United States economy began to stabilize in the third quarter of 2009. The United States gross domestic product declined during this period, before beginning to recover slightly in the third quarter of 2009. The United States unemployment rate increased significantly throughout this period. A new presidential administration and government proposals to provide economic stimulus in 2009 caused further uncertainty. Donations to NPOs decreased, and NPOs were more cautious and delayed
57
their spending on technology during this period in order to conserve cash. The enterprise values of many of our publicly-traded peers fell sharply during this period before beginning to recover during the second and third quarters of 2009. We continued to incur expenses for product development, new product introduction and sales and marketing. During this challenging period, our revenues and growth were affected, visibility into our projected revenue and cash flows declined. The factors noted above more than offset any positive financial results and adversely affected our assumptions of the expected type, timing and likelihood of possible liquidity scenarios, and reduced the fair market value of our common stock under various IPO and acquisition scenarios as determined by our board of directors before improving in the third quarter of 2009. As a result, the fair market value of our common stock decreased significantly during this period before recovering in part during the third and fourth quarters of 2009.
In addition, since 2008 our board of directors has been comprised of a majority of non-employee directors with collective experience in the software industry. We believe that the composition of our board of directors resulted in a fair and reasonable view of the stock value and, together with the board's cumulative knowledge of, and experience with, similar companies, resulted in a fair valuation of our common stock. The fair market values of the common stock underlying stock options granted during 2008 and 2009 were estimated by the board, which intended all options granted to be exercisable at a price per share not less than the per share fair market value of our common stock underlying those options on the date of grant. Given the absence of a public trading market, in accordance with the American Institute of Certified Public Accountants Practice Aid, our board exercised its reasonable judgment in using the "best estimate" method and considered numerous objective and subjective factors to determine the best estimate of the fair market value of our common stock at each meeting at which stock option grants were approved. These factors included, but were not limited to, the following: developments in our business, the rights and preferences of our convertible preferred stock relative to our common stock, contemporaneous valuations of our common stock, the lack of marketability of our common stock, and the likelihood of achieving a liquidity event, such as our initial public offering or acquisition, given prevailing market conditions. If we had made different assumptions and estimates, the amount of our recognized and to be recognized stock-based compensation expense could have been materially different. We believe that the board used reasonable methodologies, approaches and assumptions in determining the fair market value of our common stock.
Stock Option Exchange. In February 2009, our board of directors approved a proposal to offer current employees, consultants or directors the opportunity to exchange outstanding eligible stock options for new options. Other than a reduced exercise price, the exchanged stock options had the same terms and conditions as prior to the repricing. The offer was made to eligible option holders on February 16, 2009 and expired on March 16, 2009. Unexercised options that were granted under our 1999 Stock Option/Stock Issuance Plan on or after May 9, 2007 and which had an exercise price equal to or greater than $4.57 per share were eligible under this program. Pursuant to the exchange, we subsequently canceled options for 1.1 million shares of our common stock and issued an equivalent number of new stock options to eligible holders on March 16, 2009 at an exercise price of $4.57 per share. The incremental $590,000 of compensation due to the exchange was allocated between options vested at the date of issuance and unvested options at the date of issuance. The $435,000 related to vested options was expensed on the date of issuance and the remaining $155,000 related to unvested options will be expensed over the remaining vesting period of the option.
Use of Non-GAAP Financial Measures
We define Adjusted EBITDA as net income (loss) less interest income and gain (loss) on preferred stock warrant revaluation plus interest expense, provision for taxes, depreciation expense, amortization expense and stock-based compensation expense. We have included Adjusted EBITDA in this prospectus because (i) we believe Adjusted EBITDA and similar measures are widely used by investors, securities analysts and other interested parties in our industry as a measure of financial performance and (ii) our management uses Adjusted EBITDA to monitor the performance of our business.
58
We also believe Adjusted EBITDA facilitates operating performance comparisons from period to period by excluding potential differences caused by variations in capital structures affecting interest income and expense, tax positions, such as the impact of changes in effective tax rates and the impact of depreciation and amortization expense.
Our use of Adjusted EBITDA has limitations as an analytical tool, and you should not consider it in isolation or as a substitute for analysis of our results as reported under GAAP. Some of these limitations are:
- •
- although depreciation and amortization are non-cash charges, the assets being depreciated and amortized may
have to be replaced in the future, and Adjusted EBITDA does not reflect cash capital expenditure requirements for such replacements;
- •
- Adjusted EBITDA does not reflect changes in, or cash requirements for, our working capital needs;
- •
- Adjusted EBITDA does not consider the potentially dilutive impact of equity-based compensation;
- •
- Adjusted EBITDA does not reflect the interest expense or the cash requirements necessary to service interest or principal
payments on our indebtedness;
- •
- Adjusted EBITDA does not reflect tax payments that may represent a reduction in cash available to us; and
- •
- other companies, including companies in our industry, may calculate Adjusted EBITDA differently, which reduces its usefulness as a comparative measure.
Because of these limitations, you should consider Adjusted EBITDA alongside other financial performance measures, including various cash flow metrics, net loss and our other GAAP results. The following table presents a reconciliation of Adjusted EBITDA to net loss, the most comparable GAAP measure, for each of the periods indicated:
| |
Year Ended December 31, | |||||||||
|---|---|---|---|---|---|---|---|---|---|---|
| |
2007 | 2008 | 2009 | |||||||
| |
(in thousands) |
|||||||||
Reconciliation of Adjusted EBITDA to net loss: |
||||||||||
Net loss |
$ | (10,509 | ) | $ | (3,744 | ) | $ | (2,095 | ) | |
Interest (income) expense, net |
604 | 576 | 349 | |||||||
Depreciation and amortization |
4,175 | 4,821 | 4,792 | |||||||
Stock-based compensation |
691 | 1,556 | 2,502 | |||||||
(Gain) loss on warrant revaluation |
1,661 | (1,804 | ) | 814 | ||||||
Provision for income taxes |
— | — | 219 | |||||||
Adjusted EBITDA |
$ | (3,378 | ) | $ | 1,405 | $ | 6,581 | |||
59
Results of Operations
The following table sets forth our results of operations for the periods indicated:
| |
Year Ended December 31, | ||||||||||
|---|---|---|---|---|---|---|---|---|---|---|---|
| |
2007 | 2008 | 2009 | ||||||||
| |
(in thousands) |
||||||||||
Statements of Operations Data: |
|||||||||||
Revenue: |
|||||||||||
Subscription and services |
$ | 38,754 | $ | 50,103 | $ | 54,900 | |||||
Usage |
4,329 | 6,877 | 8,186 | ||||||||
Total revenue |
43,083 | 56,980 | 63,086 | ||||||||
Cost of revenue |
18,716 |
22,911 |
24,779 |
||||||||
Gross profit |
24,367 | 34,069 | 38,307 | ||||||||
Operating expenses: |
|||||||||||
Sales and marketing |
19,428 | 21,432 | 21,556 | ||||||||
Research and development |
7,189 | 8,754 | 10,041 | ||||||||
General and administrative |
4,456 | 5,883 | 6,034 | ||||||||
Amortization of other intangibles |
1,271 | 1,452 | 1,400 | ||||||||
Write-off of deferred stock offering costs |
— | 1,524 | — | ||||||||
Restructuring expenses |
284 | — | — | ||||||||
Total operating expenses |
32,628 | 39,045 | 39,031 | ||||||||
Loss from operations |
(8,261 | ) | (4,976 | ) | (724 | ) | |||||
Interest income |
279 |
115 |
6 |
||||||||
Interest expense |
(883 | ) | (691 | ) | (355 | ) | |||||
Other income (expense) |
(1,644 | ) | 1,808 | (803 | ) | ||||||
Loss before income taxes |
(10,509 | ) | (3,744 | ) | (1,876 | ) | |||||
Provision for income taxes |
— |
— |
219 |
||||||||
Net loss |
$ | (10,509 | ) | $ | (3,744 | ) | $ | (2,095 | ) | ||
Other Operating Data: |
|||||||||||
Adjusted EBITDA(1)(unaudited) |
$ | (3,378 | ) | $ | 1,405 | $ | 6,581 | ||||
- (1)
- We define Adjusted EBITDA as net income (loss) less interest income and gain (loss) on preferred stock warrant revaluation plus interest expense, provision for taxes, depreciation expense, amortization expense and stock-based compensation expense.
60
The following table sets forth our results of operations expressed as a percentage of total revenue for each of the periods indicated:
| |
Year Ended December 31, | ||||||||||
|---|---|---|---|---|---|---|---|---|---|---|---|
| |
2007 | 2008 | 2009 | ||||||||
Statements of Operations Data: |
|||||||||||
Revenue: |
|||||||||||
Subscription and services |
90 | % | 88 | % | 87 | % | |||||
Usage |
10 | 12 | 13 | ||||||||
Total revenue |
100 | 100 | 100 | ||||||||
Cost of revenue |
43 |
40 |
39 |
||||||||
Gross margin |
57 | 60 | 61 | ||||||||
Operating expenses: |
|||||||||||
Sales and marketing |
45 | 38 | 34 | ||||||||
Research and development |
17 | 15 | 16 | ||||||||
General and administrative |
10 | 10 | 10 | ||||||||
Amortization of other intangibles |
3 | 3 | 2 | ||||||||
Write-off of deferred stock offering costs |
— | 3 | — | ||||||||
Restructuring expenses |
1 | — | — | ||||||||
Total operating expenses |
76 | 69 | 62 | ||||||||
Loss from operations |
(19 | ) | (9 | ) | (1 | ) | |||||
Interest income |
1 |
0 |
0 |
||||||||
Interest expense |
(2 | ) | (1 | ) | (1 | ) | |||||
Other income (expense) |
(4 | ) | 3 | (1 | ) | ||||||
Loss before income taxes |
(24 | ) | (7 | ) | (3 | ) | |||||
Provisions for income taxes |
— |
— |
0 |
||||||||
Net loss |
(24 |
)% |
(7 |
)% |
(3 |
)% |
|||||
Other Operating Data: |
|||||||||||
Adjusted EBITDA(1) (unaudited) |
(8 | )% | 2 | % | 10 | % | |||||
- (1)
- We define Adjusted EBITDA as net income (loss) less interest income and gain (loss) on preferred stock warrant revaluation plus interest expense, provision for taxes, depreciation expense, amortization expense and stock-based compensation expense.
Year Ended December 31, 2009 Compared to Year Ended December 31, 2008 and Year Ended December 31, 2008 Compared to Year Ended December 31, 2007
The following discussion of our results of operations is based upon actual results of operations for each of the years ended December 31, 2007, 2008 and 2009. Dollar information provided in the tables below is in thousands.
Revenue
| |
Year Ended December 31, | ||||||||||
|---|---|---|---|---|---|---|---|---|---|---|---|
| |
2007 | 2008 | 2009 | ||||||||
Subscription and services |
$ | 38,754 | $ | 50,103 | $ | 54,900 | |||||
Percent of total revenue |
90.0 | % | 87.9 | % | 87.0 | % | |||||
Usage |
$ | 4,329 | $ | 6,877 | $ | 8,186 | |||||
Percent of total revenue |
10.0 | % | 12.1 | % | 13.0 | % | |||||
61
Subscription and Services Revenue
2009 to 2008 Comparison. Subscription and services revenue increased $4.8 million, or 9.6%, in 2009 as compared to 2008. The increase in our subscription and services revenue was attributable to an increase in revenue from existing clients of 11.3% and sales to new clients.
2008 to 2007 Comparison. Subscription and services revenue increased $11.3 million, or 29.3%, in 2008 as compared to 2007. The increase in subscription and services revenue was attributable to an increase in revenue from existing clients of 32.2% and sales to new clients.
Usage Revenue
2009 to 2008 Comparison. Usage revenue increased $1.3 million, or 19.0%, in 2009 as compared to 2008. The increase was attributable to a $1.1 million increase in revenue from special events and a $189,000 increase in additional fees for client usage above the levels included in monthly subscription fees.
2008 to 2007 Comparison. Usage revenue increased $2.5 million, or 58.9%, in 2008 as compared to 2007. The growth in usage revenue was attributable to a $2.4 million increase in revenue from special events and an $80,000 increase in additional fees for client usage above the levels included in monthly subscription fees. Approximately $1.7 million of the increase was related to a large new special event.
Cost of Revenue
| |
Year Ended December 31, | ||||||||||
|---|---|---|---|---|---|---|---|---|---|---|---|
| |
2007 | 2008 | 2009 | ||||||||
Cost of revenue |
$ | 18,716 | $ | 22,911 | $ | 24,779 | |||||
Gross profit |
$ | 24,367 | $ | 34,069 | $ | 38,307 | |||||
Gross margin |
56.6 | % | 59.8 | % | 60.7 | % | |||||
2009 to 2008 Comparison. Cost of revenue increased $1.9 million, or 8.3%, in 2009 as compared to 2008. The increase was due to an $840,000 increase in personnel costs, a $499,000 increase in allocated overhead, a $482,000 increase in contracting expense and a $168,000 increase in transaction fees. The increase in personnel costs was primarily attributable to a $545,000 increase in cash compensation, a $199,000 increase in stock-based compensation expense and a $165,000 increase in benefits expense as a result of increased services personnel, primarily related to GetActive migrations. The increase in allocated overhead was due to an increase in the relative headcount of our services personnel and a corresponding increase in aggregate overhead as a result of costs associated with our leasing additional office space in Austin, Texas, and Washington, D.C. The increase in contracting expense is primarily due to an increase in subcontracting to third party service partners. The increase in transaction fees was related to the corresponding increase in the volume of online transactions processed by outside service providers.
2008 to 2007 Comparison. Cost of revenue increased $4.2 million, or 22.4%, in 2008 as compared to 2007. The increase was due to a $3.2 million increase in personnel costs, a $580,000 increase in third-party datacenter hosting and service provider costs, a $230,000 increase in depreciation expense and a $129,000 increase in amortization of acquired technology. The increase in personnel costs was attributable to a $2.6 million increase in cash compensation, a $218,000 increase in payroll taxes and a $165,000 increase in benefits expense as a result of our increased services personnel, as well as a $220,000 increase in stock-based compensation. The increase in datacenter and service provider costs was related to the corresponding increase in volumes of online transactions processed by our outside service providers. The increase in amortization was due to a full year of amortization expense in 2008,
62
compared to ten months in 2007, on the acquired technology that we recorded in connection with the GetActive acquisition.
Sales and Marketing
| |
Year Ended December 31, | ||||||||||
|---|---|---|---|---|---|---|---|---|---|---|---|
| |
2007 | 2008 | 2009 | ||||||||
Sales and marketing |
$ | 19,428 | $ | 21,432 | $ | 21,556 | |||||
Percent of total revenue |
45.1 | % | 37.6 | % | 34.2 | % | |||||
2009 to 2008 Comparison. Sales and marketing expenses increased $124,000, or 0.7%, in 2009 as compared to 2008. The increase was primarily attributable to a $379,000 increase in marketing expense and a $168,000 increase in allocated overhead offset by a $78,000 decrease in personnel costs, a $176,000 decrease in travel and entertainment expense and a $138,000 decrease in recruiting and relocation costs. The increase in marketing expense was related to an increase in market research and marketing programs in 2009 in order to drive new client acquisitions as well as marketing for Common Ground and Convio Go!. The increase in allocated overhead was the result of the increase in our aggregate overhead costs. The decrease in personnel costs was attributable to a $409,000 decrease in cash compensation offset by a $158,000 increase in stock-based compensation expense, a $100,000 increase in benefits as a result of higher fees from employee benefit providers and a $73,000 increase in payroll taxes. The decrease in cash compensation was primarily due to a decrease in commission expense resulting from a change in our commission plan structure in 2009. The decrease in travel and entertainment expense resulted from general cost-saving initiatives implemented during 2009. Recruiting and relocation costs were higher in 2008 as compared to 2009 due to the recruitment and relocation of our chief marketing officer in 2008.
2008 to 2007 Comparison. Sales and marketing expenses increased $2.0 million, or 10.3%, in 2008 as compared to 2007. The increase was attributable to a $1.2 million increase in personnel costs, a $497,000 increase in marketing expenses, a $157,000 increase in contracting expense and a $139,000 increase in recruiting and relocation expenses for our chief marketing officer hired in 2008. The increase in personnel costs was attributable to an $841,000 increase in cash compensation and $285,000 increase in stock-based compensation as a result of increased sales and marketing personnel. The increase in marketing expense was attributable to an increase in marketing programs in 2008 in order to drive new client acquisition as well as to market the launch of Common Ground.
Research and Development
| |
Year Ended December 31, | ||||||||||
|---|---|---|---|---|---|---|---|---|---|---|---|
| |
2007 | 2008 | 2009 | ||||||||
Research and development |
$ | 7,189 | $ | 8,754 | $ | 10,041 | |||||
Percent of total revenue |
16.7 | % | 15.4 | % | 15.9 | % | |||||
2009 to 2008 Comparison. Research and development expenses increased $1.3 million, or 14.9%, in 2009 as compared to 2008. The increase was attributable to a $1.3 million increase in personnel costs and a $354,000 increase in allocated overhead offset by a $279,000 decrease in contracting expense. The increase in personnel costs was attributable to an $875,000 increase in cash compensation, a $174,000 increase in benefits, a $118,000 increase in payroll taxes and a $108,000 increase in stock-based compensation, all of which was due to an increase in personnel. The increase in allocated overhead was due to an increase in the relative number of research and development personnel and a corresponding increase in aggregate overhead. The decrease in contractor fees is attributable to the termination of our offshore India-based independent contractors which we replaced with personnel in Austin.
63
2008 to 2007 Comparison. Research and development expenses increased $1.6 million, or 21.8%, in 2008 as compared to 2007. The increase was attributable to a $1.6 million increase in personnel costs, offset by a $186,000 decrease in contracting expense as we began ramping down our use of India-based independent contractors. The increase in personnel costs was attributable to a $1.4 million increase in cash compensation, a $88,000 increase in benefits and a $151,000 increase in stock-based compensation, all of which was due to an increase in personnel.
General and Administrative
| |
Year Ended December 31, | ||||||||||
|---|---|---|---|---|---|---|---|---|---|---|---|
| |
2007 | 2008 | 2009 | ||||||||
General and administrative |
$ | 4,456 | $ | 5,883 | $ | 6,034 | |||||
Percent of total revenue |
10.3 | % | 10.3 | % | 9.6 | % | |||||
2009 to 2008 Comparison. General and administrative expenses increased $151,000, or 2.6%, in 2009 as compared to 2008. The increase was due primarily to a $435,000 increase in personnel costs offset by a $235,000 decrease in bad debt expense. The increase in personnel costs was attributable to a $480,000 increase in stock-based compensation and a $52,000 increase in benefits expense offset by an $87,000 decrease in cash compensation as a result of reduced bonuses in 2009. The decrease in bad debt expense is related to normal operations. Bad debt expense as a percentage of revenue decreased by less than 1% to 0.4% of revenue.
2008 to 2007 Comparison. General and administrative expenses increased $1.4 million, or 32.0%, in 2007 as compared to 2008. The increase was due to an $848,000 increase in personnel costs, a $213,000 increase in miscellaneous expenses, a $187,000 increase in bad debt expense and a $117,000 increase in contracting expense. The increase in personnel costs was attributable to a $611,000 increase in cash compensation as a result of an increase in headcount and a $212,000 increase in stock-based compensation. The increase in miscellaneous expense was partially attributable to our implementation of board member compensation. The increase in bad debt expense was related to normal operations. Bad debt expense as a percentage of revenue increased by less than 1% to 0.8% of revenue. The increase in contracting expense was related to an increase in legal fees.
Amortization of Other Intangibles
| |
Year Ended December 31, | ||||||||||
|---|---|---|---|---|---|---|---|---|---|---|---|
| |
2007 | 2008 | 2009 | ||||||||
Amortization of other intangibles |
$ | 1,271 | $ | 1,452 | $ | 1,400 | |||||
Percent of total revenue |
3.0 | % | 2.5 | % | 2.2 | % | |||||
These amounts represent the amortization of intangibles recorded in connection with our acquisition of GetActive in February 2007 and are being amortized on a straight-line basis over the estimated useful lives.
Write-off of Deferred Stock Offering Costs
| |
Year Ended December 31, | ||||||||||
|---|---|---|---|---|---|---|---|---|---|---|---|
| |
2007 | 2008 | 2009 | ||||||||
Write-off of deferred stock offering costs |
$ | — | $ | 1,524 | $ | — | |||||
Percent of total revenue |
— | % | 2.7 | % | — | % | |||||
In August 2008, we withdrew our Form S-1 Registration Statement on file with the Securities and Exchange Commission due to weak market conditions. As a result, $1.5 million of prepaid stock offering
64
costs were written off in August 2008. These costs consisted primarily of legal and accounting fees incurred in connection with the drafting, review and filing of the Form S-1.
Restructuring Expenses
| |
Year Ended December 31, | ||||||||||
|---|---|---|---|---|---|---|---|---|---|---|---|
| |
2007 | 2008 | 2009 | ||||||||
Restructuring expenses |
$ | 284 | $ | — | $ | — | |||||
Percent of total revenue |
0.7 | % | — | % | — | % | |||||
In connection with the GetActive acquisition, we implemented a restructuring plan in 2007 to reduce the number of personnel and infrastructure costs and to consolidate our operations with GetActive.
Interest Income (Expense)
| |
Year Ended December 31, | ||||||||||
|---|---|---|---|---|---|---|---|---|---|---|---|
| |
2007 | 2008 | 2009 | ||||||||
Interest income |
$ | 279 | $ | 115 | $ | 6 | |||||
Interest expense |
(883 | ) | (691 | ) | (355 | ) | |||||
Total interest income (expense) |
(604 | ) | $ | (576 | ) | (349 | ) | ||||
Percent of total revenue |
(1.4 | )% | (1.0 | )% | (0.6 | )% | |||||
2009 to 2008 Comparison. Interest income decreased $109,000, or 94.8%, in 2009 as compared to 2008 due to the decrease in interest rates during 2009. Interest expense decreased $336,000, or 48.6%, in 2009 as compared to 2008. The decrease was due to a decrease in our average outstanding debt.
2008 to 2007 Comparison. Interest income decreased $164,000, or 58.8%, in 2008 as compared to 2007 due to a decrease in the average cash balances in interest bearing accounts of approximately $700,000. Interest expense decreased $192,000, or 21.7%, in 2008 as compared to 2007 due to a decrease in our average outstanding debt.
Other Income (Expense)
| |
Year Ended December 31, | ||||||||||
|---|---|---|---|---|---|---|---|---|---|---|---|
| |
2007 | 2008 | 2009 | ||||||||
Other income (expense) |
$ | (1,644 | ) | $ | 1,808 | $ | (803 | ) | |||
Percent of total revenue |
(3.8 | )% | 3.2 | % | (1.3 | )% | |||||
We issued warrants exercisable for our convertible preferred stock in 2005. In 2009, we recorded expense of $814,000 as the liability with respect to the warrants increased, and we recorded the corresponding increase in fair value. In 2008, we recorded income of $1.8 million as the liability with respect to the warrants decreased, and we recorded the corresponding decrease in fair value. In 2007, we recorded expense of $1.6 million as the liability with respect to the warrants increased and we recorded the corresponding increase in fair value.
Provision for Income Taxes
We use the liability method of accounting for income taxes as set forth in the authoritative guidance for income taxes. Under this method, we recognize deferred tax liabilities and assets for the expected future tax consequences of temporary differences between the respective carrying amounts and tax bases of our assets and liabilities.
In July 2006, guidance on accounting for uncertainty in income taxes clarified the accounting for uncertainty in income taxes recognized in an entity's financial statements and prescribes a recognition
65
threshold and measurement attribute for financial statement disclosure of tax positions taken or expected to be taken on a tax return. We adopted this guidance on January 1, 2007, and the adoption did not have a material impact on our financial statements.
This guidance requires us to identify, evaluate and measure all uncertain tax positions taken or to be taken on tax returns and to record liabilities for the amount of these positions that may not be sustained, or may only partially be sustained, upon examination by the relevant taxing authorities. Although we believe that our estimates and judgments are reasonable, actual results may differ from these estimates. Some or all of these judgments are subject to review by the taxing authorities.
We establish valuation allowances when necessary to reduce deferred tax assets to the amounts expected to be realized. We evaluate the need for, and the adequacy of, valuation allowances based on the expected realization of our deferred tax assets. The factors used to assess the likelihood of realization include our latest forecast of future taxable income and available tax planning strategies that could be implemented to realize the net deferred tax assets.
We accrue interest and penalties related to unrecognized tax benefits as a component of income tax expense. As of the adoption date of this guidance, there were no accrued interest or penalties. As of December 31, 2008 and 2009, there were no accrued interest or penalties.
66
Quarterly Results of Operations
The following tables set forth Convio's unaudited consolidated statements of operations data and other operating data for each of the eight quarters ended December 31, 2009. The data has been prepared on the same basis as the audited consolidated financial statements and related notes included in this prospectus. The data includes all necessary adjustments, consisting only of normal recurring adjustments, that we consider necessary for a fair presentation of this data. Historical results are not necessarily indicative of the results to be expected in future periods. You should read this data together with our financial statements and the related notes included elsewhere in this prospectus.
| |
Three Months Ended | |||||||||||||||||||||||||
|---|---|---|---|---|---|---|---|---|---|---|---|---|---|---|---|---|---|---|---|---|---|---|---|---|---|---|
| |
Mar 31, 2008 |
Jun 30, 2008 |
Sep 30, 2008 |
Dec 31, 2008 |
Mar 31, 2009 |
Jun 30, 2009 |
Sep 30, 2009 |
Dec 31, 2009 |
||||||||||||||||||
| |
(in thousands) |
|||||||||||||||||||||||||
Statements of Operations Data: |
||||||||||||||||||||||||||
Revenue: |
||||||||||||||||||||||||||
Subscription and services |
$ | 11,780 | $ | 12,288 | $ | 12,706 | $ | 13,329 | $ | 13,283 | $ | 13,502 | $ | 13,953 | $ | 14,162 | ||||||||||
Usage |
1,171 | 2,422 | 2,156 | 1,128 | 1,377 | 2,906 | 2,281 | 1,622 | ||||||||||||||||||
Total revenue |
12,951 | 14,710 | 14,862 | 14,457 | 14,660 | 16,408 | 16,234 | 15,784 | ||||||||||||||||||
Cost of revenue |
5,551 |
5,706 |
5,817 |
5,837 |
6,196 |
6,156 |
6,191 |
6,236 |
||||||||||||||||||
Gross profit |
7,400 | 9,004 | 9,045 | 8,620 | 8,464 | 10,252 | 10,043 | 9,548 | ||||||||||||||||||
Operating expenses: |
||||||||||||||||||||||||||
Sales and marketing |
5,209 | 5,827 | 5,227 | 5,169 | 5,434 | 5,059 | 5,191 | 5,872 | ||||||||||||||||||
Research and development |
2,191 | 2,119 | 2,272 | 2,172 | 2,495 | 2,473 | 2,512 | 2,561 | ||||||||||||||||||
General and administrative |
1,397 | 1,588 | 1,415 | 1,483 | 1,660 | 1,398 | 1,318 | 1,658 | ||||||||||||||||||
Amortization of other intangibles |
363 | 363 | 363 | 363 | 356 | 348 | 348 | 348 | ||||||||||||||||||
Write-off of deferred stock offering costs |
— | — | 1,524 | — | — | — | — | — | ||||||||||||||||||
Restructuring expenses |
— | — | — | — | — | — | — | — | ||||||||||||||||||
Total operating expenses |
9,160 | 9,897 | 10,801 | 9,187 | 9,945 | 9,278 | 9,369 | 10,439 | ||||||||||||||||||
Loss from operations |
(1,760 | ) | (893 | ) | (1,756 | ) | (567 | ) | (1,481 | ) | 974 | 674 | (891 | ) | ||||||||||||
Interest income |
47 |
28 |
25 |
15 |
2 |
2 |
1 |
1 |
||||||||||||||||||
Interest expense |
(195 | ) | (180 | ) | (164 | ) | (152 | ) | (143 | ) | (95 | ) | (50 | ) | (67 | ) | ||||||||||
Other income (expense) |
1,143 | 356 | (47 | ) | 356 | (164 | ) | (53 | ) | (96 | ) | (490 | ) | |||||||||||||
Loss before income taxes |
(765 | ) | (689 | ) | (1,942 | ) | (348 | ) | (1,786 | ) | 828 | 529 | (1,447 | ) | ||||||||||||
Provision for income taxes |
— |
— |
— |
— |
25 |
25 |
54 |
115 |
||||||||||||||||||
Net income (loss) |
$ | (765 | ) | $ | (689 | ) | $ | (1,942 | ) | $ | (348 | ) | $ | (1,811 | ) | $ | 803 | $ | 475 | $ | (1,562 | ) | ||||
Other Operating Data: |
||||||||||||||||||||||||||
Adjusted EBITDA(1) |
$ | (179 | ) | $ | 667 | $ | (165 | ) | $ | 1,082 | $ | 551 | $ | 2,724 | $ | 2,388 | $ | 918 | ||||||||
Net cash provided by (used in) operating activities |
(727 | ) | 1,270 | 1,095 | 1,224 | (570 | ) | 1,756 | 3,332 | 2,273 | ||||||||||||||||
- (1)
- We define Adjusted EBITDA as net income (loss) less interest income and gain (loss) on preferred stock warrant revaluation plus interest expense, provision for taxes, depreciation expense, amortization expense and stock-based compensation expense.
67
| |
Three Months Ended | |||||||||||||||||||||||||
|---|---|---|---|---|---|---|---|---|---|---|---|---|---|---|---|---|---|---|---|---|---|---|---|---|---|---|
| |
Mar 31, 2008 |
Jun 30, 2008 |
Sep 30, 2008 |
Dec 31, 2008 |
Mar 31, 2009 |
Jun 30, 2009 |
Sep 30, 2009 |
Dec 31, 2009 |
||||||||||||||||||
| |
(in thousands) |
|||||||||||||||||||||||||
Reconciliation of Adjusted EBITDA to net loss: |
||||||||||||||||||||||||||
Net loss |
$ | (765 | ) | $ | (689 | ) | $ | (1,942 | ) | $ | (348 | ) | $ | (1,811 | ) | $ | 803 | $ | 475 | $ | (1,562 | ) | ||||
Interest (income) expense, net |
148 | 152 | 139 | 137 | 141 | 93 | 49 | 66 | ||||||||||||||||||
Depreciation and amortization |
1,166 | 1,180 | 1,226 | 1,249 | 1,219 | 1,191 | 1,181 | 1,201 | ||||||||||||||||||
Stock-based compensation |
413 | 389 | 365 | 389 | 803 | 559 | 532 | 608 | ||||||||||||||||||
Gain (loss) on warrant revaluation |
(1,141 | ) | (365 | ) | 47 | (345 | ) | 174 | 53 | 97 | 490 | |||||||||||||||
Provision for income taxes |
— | — | — | — | 25 | 25 | 54 | 115 | ||||||||||||||||||
Adjusted EBITDA |
$ | (179 | ) | $ | 667 | $ | (165 | ) | $ | 1,082 | $ | 551 | $ | 2,724 | $ | 2,388 | $ | 918 | ||||||||
68
As a percentage of total revenue:
| |
Three Months Ended | |||||||||||||||||||||||||
|---|---|---|---|---|---|---|---|---|---|---|---|---|---|---|---|---|---|---|---|---|---|---|---|---|---|---|
| |
Mar 31, 2008 |
Jun 30, 2008 |
Sep 30, 2008 |
Dec 31, 2008 |
Mar 31, 2009 |
Jun 30, 2009 |
Sep 30, 2009 |
Dec 31, 2009 |
||||||||||||||||||
Statements of Operations Data: |
||||||||||||||||||||||||||
Revenue: |
||||||||||||||||||||||||||
Subscription and services |
91 | % | 84 | % | 85 | % | 92 | % | 91 | % | 82 | % | 86 | % | 90 | % | ||||||||||
Usage |
9 | 16 | 15 | 8 | 9 | 18 | 14 | 10 | ||||||||||||||||||
Total revenue |
100 | 100 | 100 | 100 | 100 | 100 | 100 | 100 | ||||||||||||||||||
Cost of revenue |
43 |
39 |
39 |
40 |
42 |
37 |
38 |
40 |
||||||||||||||||||
Gross margin |
57 | 61 | 61 | 60 | 58 | 63 | 62 | 60 | ||||||||||||||||||
Operating expenses: |
||||||||||||||||||||||||||
Sales and marketing |
40 | 40 | 35 | 36 | 37 | 31 | 32 | 37 | ||||||||||||||||||
Research and development |
17 | 14 | 15 | 15 | 17 | 15 | 16 | 16 | ||||||||||||||||||
General and administrative |
11 | 11 | 10 | 10 | 11 | 9 | 8 | 11 | ||||||||||||||||||
Amortization of other intangibles |
3 | 2 | 2 | 3 | 2 | 2 | 2 | 2 | ||||||||||||||||||
Write-off of prepaid stock offering costs |
— | — | 10 | — | — | — | — | — | ||||||||||||||||||
Restructuring expenses |
— | — | — | — | — | — | — | — | ||||||||||||||||||
Total operating expenses |
71 | 67 | 73 | 64 | 68 | 57 | 58 | 66 | ||||||||||||||||||
Loss from operations |
(14 | ) | (6 | ) | (12 | ) | (4 | ) | (10 | ) | 6 | 4 | (6 | ) | ||||||||||||
Interest income |
0 |
0 |
0 |
0 |
0 |
0 |
0 |
0 |
||||||||||||||||||
Interest expense |
(1 | ) | (1 | ) | (1 | ) | (1 | ) | (1 | ) | — | (1 | ) | — | ||||||||||||
Other income (expense) |
9 | 2 | 0 | 2 | (1 | ) | (1 | ) | — | (3 | ) | |||||||||||||||
Loss before income taxes |
(6 | ) | (5 | ) | (13 | ) | (2 | ) | (12 | ) | 5 | 3 | (9 | ) | ||||||||||||
Provision for income taxes |
— | — | — | — | 0 | 0 | 0 | (1 | ) | |||||||||||||||||
Net income (loss) |
(6 | )% | (5 | )% | (13 | )% | (2 | )% | (12 | )% | 5 | % | 3 | % | (10 | )% | ||||||||||
Other Operating Data: |
||||||||||||||||||||||||||
Adjusted EBITDA(1) |
(1 | )% | 5 | % | (1 | )% | 7 | % | 4 | % | 16 | % | 15 | % | 6 | % | ||||||||||
- (1)
- We define Adjusted EBITDA as net income (loss) less interest income and gain (loss) on preferred stock warrant revaluation plus interest expense, provision for taxes, depreciation expense, amortization expense and stock-based compensation expense.
The above tables of our quarterly operating results for eight quarters illustrate the following key points about our quarterly results of operations:
- •
- Subscription and services revenue. Subscription and
services revenue increased year-over-year in each of the quarters presented, due to our adding new clients, renewing existing clients and selling additional modules and services to existing clients.
Period-over-period comparisons are made more volatile by the addition or loss of enterprise clients and their impact on our revenue.
- •
- Seasonality and fluctuation of usage revenue. Usage revenue increased year-over-year in each of the quarters presented due to the increase in the number of our clients' special events, the percent
69
of funds raised online for these events, the growth and success of events and our signing of new clients for their events. Special events are typically held in the spring and fall, which results in our recognizing a majority of our usage revenue in the second and third quarters. We recognized 67% and 63% of our annual usage revenue in the combined second and third quarters of 2008 and 2009, respectively. Our usage revenue in the second and third quarters represented between 15% and 16% of our total revenue during those periods in 2008 and 2009, respectively; whereas, usage revenue in the first and fourth quarters represented between 8% and 10% of total revenue during those periods in 2008 and 2009, respectively. The amount of usage revenue that we recognize during these periods is contingent upon the success of our clients' special events. As a result, the amount of usage revenue that we recognize in any period is difficult to predict.
- •
- Impact of sales commissions. We have volatility in our
sales and marketing expenses and our net income (loss) because we expense sales commissions in the period in which we sign our agreements but we do not recognize any revenue until after the activation
date. We experience significant fluctuations in our sales, particularly sales to enterprise clients, which makes period-over-period comparisons very difficult. We may report
poor operating results due to higher sales commissions in a period in which we experience strong sales of our solutions, particularly sales to enterprise clients. Alternatively, we may report better
operating results due to lower sales commissions in a period in which we experience a slowdown in sales. As a result, our sales and marketing expenses are difficult to predict and fluctuate as a
percentage of revenue.
- •
- Non-cash expenses. In connection with the
GetActive acquisition, we recorded $3.0 million in acquired technology and $9.0 million in other identifiable intangibles. We began amortizing these non-cash amounts in the
first quarter of 2007. We will complete our amortization of acquired technology during the first quarter of 2010.
- •
- Gross margin impact. Gross margin has fluctuated with the seasonality of our usage revenue but has increased year over year as we have increased sales of our solutions and decreased the relative costs related to our systems and services.
Our quarterly results of operations may fluctuate significantly in the future and the period-to-period comparisons of our operating results may not be meaningful. You should not rely on the results of any one quarter as an indication of future performance.
Liquidity and Capital Resources
To date, we have financed our operations and met our capital expenditure requirements primarily through the private sale of equity securities and debt financings. As of December 31, 2009, we had $16.7 million of cash and cash equivalents and $19.7 million of working capital excluding deferred revenue. As of December 31, 2009, we had an accumulated deficit of $56.3 million. We have funded this deficit from $47.4 million in net proceeds raised from the sale of our preferred stock. We last sold shares of our preferred stock in April 2007.
The following table sets forth a summary of our cash flows for the periods indicated:
| |
Year Ended December 31, | |||||||||
|---|---|---|---|---|---|---|---|---|---|---|
| |
2007 | 2008 | 2009 | |||||||
| |
(in thousands) |
|||||||||
Net cash provided by (used in) operating activities |
$ | (1,225 | ) | $ | 2,862 | $ | 6,791 | |||
Net cash used in investing activities |
(3,130 | ) | (2,162 | ) | (1,749 | ) | ||||
Net cash provided by (used in) financing activities |
10,441 | (1,472 | ) | (2,208 | ) | |||||
Cash and cash equivalents (end of period) |
14,600 | 13,828 | 16,662 | |||||||
70
Net Cash Provided By (Used In) Operating Activities
In 2009, we generated $6.8 million of cash from operating activities, which consisted of our net loss of $2.1 million, offset by non-cash charges of $8.1 million. In addition, cash outflows from changes in operating assets included an increase in accounts receivable of $263,000 from increased sales activities near the end of the year and a $419,000 increase in prepaid expenses as a result of increased rent related to the new Washington D.C. office lease and the additional space taken effective January 1, 2009 in Austin as well as deferred stock offering costs paid during December of 2009. Cash inflows from changes in operating liabilities included an increase in accounts payable and accrued liabilities of $921,000 due to the overall growth in our business expenses and timing of payments and an increase in deferred revenue of $538,000 resulting from the increase in our client base and timing of transactions.
In 2008, we generated $2.9 million of cash from operating activities, which consisted of our net loss of $3.7 million, offset by non-cash charges of $4.6 million. In addition, cash outflows from changes in operating assets included an increase in accounts receivable of $1.3 million driven by sales activities and revenue growth from 2007 to 2008. Cash inflows from changes in operating assets and liabilities included a decrease in prepaid expenses of $1.2 million, resulting primarily from the write off of deferred stock offering costs in conjunction with the withdrawal of our Registration Statement on Form S-1 in August of 2008 and an increase in deferred revenue of $2.1 million resulting from the increase in our client base and timing of transactions.
In 2007, we used $1.2 million in cash from operating activities, which consisted of our net loss of $10.5 million, offset by non-cash charges of $6.5 million. In addition, cash outflows from changes in operating assets included an increase in accounts receivable of $848,000 driven by sales activities and revenue growth from 2006 to 2007 and a $995,000 increase in prepaid expenses as a result of deferred stock offering costs incurred in connection with the initial public offering we filed in August 2007. Cash inflows from changes in operating liabilities included a $4.3 million increase in deferred revenue of which $1.7 million was related to our acquisition of GetActive in 2007.
Net Cash Used In Investing Activities
Net cash used in investing activities decreased $413,000 in 2009 compared to 2008 as a result of a $413,000 decrease in capital expenditures in 2009. The improvement of net cash used in investing activities from 2007 to 2008 is attributable to a decrease of $622,000 in capital expenditures and the absence of acquisition-related expenses in 2008 as compared to 2007, which included $533,000 of expenses related to our GetActive acquisition which was only partially offset by $187,000 of cash received in connection with the acquisition.
Net Cash Provided By (Used In) Financing Activities
Net cash used in financing activities increased $736,000 in 2009 compared to 2008 as a result of a $1.2 million decrease in proceeds received from long-term debt partially offset by a decrease in payments made on long-term debt and capital leases of $536,000. Net cash used in financing activities in 2008 was $1.5 million compared to net cash provided by financing activities of $10.5 million in 2007. This change in cash from financing activities is attributable to $10.1 million in net proceeds from the issuance of preferred stock in 2007 as well as a decrease of $1.9 million in proceeds received from long-term debt and capital lease obligations.
Capital Resources
We generated positive cash flow from operations in 2008 and 2009, and we expect to do so in 2010. We believe that our cash flow from operations will be sufficient to fund our operations, meet our debt service requirements and facilitate our ability to grow for at least the next 12 months.
71
Our future capital requirements will depend on many factors, including the adoption rate of our solutions, the amount and timing of collections from our clients, the rate of our sales and marketing activities and product development growth and the scope of our expansion into new geographies. We have no current acquisition plans, but in the future we may acquire technologies or businesses that we believe are beneficial to our clients and business. In the event that cash flow from operations, together with our existing cash and cash equivalents and liquidity available under our credit facility, are insufficient to fund our future activities or to make these acquisitions, we may need to raise additional funds through public or private equity or debt financing.
Contractual Obligations and Commitments
We generally do not enter into long-term purchase commitments. Our principal commitments, in addition to those related to our credit facilities discussed below, consist of obligations under capital leases for equipment and furniture, operating leases for office space and fees for third-party datacenters. The following table summarizes our commitments and contractual obligations as of December 31, 2009:
| |
Payments Due by Period as of December 31, 2009 | ||||||||||||||||
|---|---|---|---|---|---|---|---|---|---|---|---|---|---|---|---|---|---|
| |
Less than 1 year |
1 - 3 years | 4 - 5 years | More than 5 years |
Total | ||||||||||||
| |
(in thousands) |
||||||||||||||||
Contractual Obligations: |
|||||||||||||||||
Operating leases |
$ | 2,446 | $ | 6,592 | $ | 1,579 | $ | 3,048 | $ | 13,665 | |||||||
Capital leases |
96 | 17 | — | — | 113 | ||||||||||||
Credit facilities |
773 | 1,332 | — | — | 2,105 | ||||||||||||
Third-party datacenter fees |
1,073 | 634 | — | — | 1,707 | ||||||||||||
Total |
$ | 4,388 | $ | 8,575 | $ | 1,579 | $ | 3,048 | $ | 17,590 | |||||||
In January 2010, we entered into a sublease agreement pursuant to which we will sublet approximately 12,000 square feet of our office facility located in Austin, Texas. The sublease has a term of 44 months. As a result of this new sublease agreement, future minimum payments under operating lease obligations will be offset by $199,000 in 2010 and an aggregate of $624,000 in 2011 through 2013 to be paid by the subtenant.
Credit Facilities
On July 31, 2009, we amended our credit facility with Comerica Bank to a $10.0 million revolving line of credit plus an existing term loan. As of December 31, 2009, we had $975,000 outstanding under the revolving line of credit and $1.1 million outstanding under the term loan. Under our revolving line of credit, $1.0 million is available on a non-formula basis. The remaining $9.0 million is formula-based and capped at 80% of eligible accounts receivable. Amounts outstanding under this revolving line of credit bear interest at the greater of the daily adjusting LIBOR (floor of 2%) plus 300 basis points or the daily adjusted LIBOR plus 325 basis points. Any amounts borrowed under this facility may be repaid and reborrowed at any time prior to April 26, 2011, at which time the entire principal balance outstanding becomes due and payable. The term loan bears interest at the same rate as the revolving line of credit above. This facility is secured by substantially all of our assets, including intellectual property.
In conjunction with the April 3, 2009 execution of our Washington D.C. operating lease, we were required to provide a $350,000 standby letter of credit with Comerica for the benefit of the landlord to secure the office space per the lease agreement. In addition, we still have a standby letter of credit in the amount of $2.3 million for the benefit of the landlord of our Austin, Texas facility, resulting in a total standby letter of credit of $2.6 million of the formula-based $9.0 million line of credit.
72
In addition to the above agreement, we entered into a capital lease agreement with ATEL Ventures on March 15, 2006 to fund certain purchases of equipment. The ability to borrow under this lease agreement expired on March 31, 2007. As of December 31, 2009, our outstanding capital lease obligation was $65,000.
We intend to pay off the amounts outstanding under our credit facilities with the proceeds of this offering. We are in compliance with all the related financial covenants and restrictions included in these agreements.
Off-Balance Sheet Arrangements
During 2007, 2008 and 2009, we did not have any relationships with unconsolidated entities or financial partnerships, such as entities often referred to as structured finance or special purpose entities, which would have been established for the purpose of facilitating off-balance sheet arrangements or other contractually narrow or limited purposes.
Recent Accounting Pronouncements
In September 2009, we adopted the FASB ASC. The FASB established the ASC as the single source of authoritative non-governmental GAAP, superseding various existing authoritative accounting pro-nouncements. It eliminates the previous GAAP hierarchy and establishes one level of authoritative GAAP. All other literature is considered non-authoritative. The FASB will not issue new standards in the form of Statements, FASB Staff Positions or Emerging Issues Task Force Abstracts. Instead, it will issue an Accounting Standards Update ("ASU"). The FASB will not consider ASUs as authoritative in their own right. ASUs will serve only to update the ASC, provide background information about the guidance and provide the bases for conclusions on the change(s) in the ASC.
In October 2009, the FASB issued an ASU that amended the accounting rules addressing revenue recognition for multiple-deliverable revenue arrangements by eliminating the currently existing criteria that objective and reliable evidence of fair value for the undelivered products or services exist in order to be able to separately account for deliverables. Additionally the ASU provides for elimination of the use of the residual method of allocating arrangement consideration and requires that arrangement consideration be allocated at the inception of the arrangement to all deliverables that can be accounted for separately based on their relative selling price. A hierarchy for estimating such selling price is included in the update. This ASU will be effective prospectively for revenue arrangements entered into or materially modified in fiscal years beginning on or after June 15, 2010. Early adoption is permitted. We are currently evaluating the impact this update will have on our consolidated financial statements.
In October 2009, the FASB issued an ASU that changes the criteria for determining when an entity should account for transactions with customers using the revenue recognition guidance applicable to the selling or licensing of software. This ASU is effective prospectively for revenue arrangements entered into or materially modified in fiscal years beginning on or after June 15, 2010. Early adoption is permitted. We do not believe this update will have a material impact on our consolidated financial statements.
In September 2009, the FASB issued an ASU providing clarification for measuring the fair value of a liability when a quoted price in an active market for the identical liability is not available. It also clarifies that when estimating the fair value of a liability, a reporting entity is not required to include a separate input or adjustment to other inputs relating to the existence of a restriction that prevents the transfer of the liability. This ASU is effective for fiscal periods beginning after August 27, 2009. We do not believe this update will have a material impact on our consolidated financial statements.
In December 2007, the FASB issued guidance regarding business combinations, which significantly changes the principles and requirements for how the acquirer of a business recognizes and measures in its financial statements the identifiable assets acquired, the liabilities assumed, any non-controlling
73
interest in the acquiree, and the goodwill acquired. This statement is effective prospectively, except for certain retrospective adjustments to deferred tax balances, for fiscal years beginning after December 15, 2008. The impact of adopting this statement will be dependent on the future business combinations that we may pursue.
Quantitative and Qualitative Disclosures about Market Risk
Interest Rate Risk
We had cash and cash equivalents of $14.6 million, $13.8 million and $16.7 million at December 31, 2007, 2008 and 2009, respectively. These amounts are held primarily in cash or money market funds. We do not hold any auction-rate securities. Cash and cash equivalents are held for working capital purposes. Due to the short-term nature of these investments, we believe that we do not have any material exposure to changes in the fair value of our investment portfolio as a result of changes in interest rates. Any declines in interest rates will reduce future interest income. If overall interest rates fell by 10% in 2009, our interest income would not have been materially affected.
Our exposure to interest rates also relates to the increase or decrease in the amount of interest we must pay on our outstanding debt. Outstanding borrowings under our term loan and line of credit bear a variable rate of interest based upon the LIBOR rate and is adjusted monthly. As of December 31, 2009, we had $2.1 million of debt outstanding under our term loan and line of credit, which bore interest at LIBOR (not less than 2%) plus 3%, or 5%. If overall interest rates had increased by 10% in 2009, our interest expense would have increased by approximately $13,000.
Foreign Currency Risk
Our results of operations and cash flows are not subject to fluctuations due to changes in foreign currency exchange rates. We bill our clients in U.S. dollars and receive payment in U.S. dollars, and substantially all of our operating expenses are denominated in U.S. dollars. If we grow sales of our solutions outside the United States, our contracts with foreign clients may not be denominated in dollars and we may become subject to changes in currency exchange rates.
74
Overview
We are a leading provider of on-demand constituent engagement solutions that enable nonprofit organizations, or NPOs, to more effectively raise funds, advocate for change and cultivate relationships with donors, activists, volunteers, alumni and other constituents. We serve approximately 1,300 NPOs of all sizes including 29 of the 50 largest charities as ranked by contributions in the November 2009 Forbes article entitled "The 200 Largest U.S. Charities." During 2009, our clients used our solutions to raise over $920 million and deliver over 3.8 billion emails to over 154 million email addresses to accomplish their missions.
Our integrated solutions include our Convio Online Marketing platform, or COM, and Common Ground, our constituent relationship management application. COM enables NPOs to harness the full potential of the Internet and social media as new channels for constituent engagement and fundraising. Common Ground delivers next-generation donor management capabilities, integrates marketing activities across online and offline channels and is designed to increase operational efficiency. Our software is built on an open, configurable and flexible architecture that enables our clients and partners to customize and extend its functionality. Our solutions are enhanced by a portfolio of value-added services tailored to our clients' specific needs.
Our revenue has grown in the last five years to $63.1 million in 2009, from $13.3 million in 2005. Our clients pay us recurring subscription fees with agreement terms that typically range between one and three years. Our subscription fees grow as our clients grow their constituent bases and purchase additional modules of COM and additional seats of Common Ground. We also receive transaction fees that include a percentage of funds raised for special events such as runs, walks and rides. Our clients grew their online fundraising using our solutions by 14% in 2008, despite a decline in total contributions in the United States of 2% according to Giving USA Foundation in its "Annual Report on Philanthropy for the Year 2008." Total charitable giving in the United States was $307 billion in 2008 according to this report.
Nonprofit Industry Background
Large and Evolving Nonprofit Sector
The nonprofit sector is a large and vital part of the economy. The missions of NPOs span many aspects of our society including animal welfare, arts and culture, disaster relief, education, environment, healthcare, international development, professional and trade associations, public policy, religion and social and youth services. According to the National Center of Charitable Statistics, in 2009 there were over 973,000 public charities in the United States.
We define our target market as public charities that raise more than $50,000 in contributions annually, of which there were over 71,000 in 2009 in the United States according to GuideStar USA, Inc. The following table provides our categorization of our target market:
| Addressable Market | Annual Contributions |
Number of Public Charities(1) |
Aggregate Annual Contributions(1) |
Annual Fundraising Spend(2) |
Addressable Annual Fundraising Spend(3) |
||||||||||||
|---|---|---|---|---|---|---|---|---|---|---|---|---|---|---|---|---|---|
Enterprise |
$ | 10+ million | 2,200 | $ | 88 billion | $ | 13.2 billion | $ | 1.0 billion | ||||||||
Mid-Market |
$ | 50,000 - $10 million | 69,000 | $ | 57 billion | $ | 11.7 billion | $ | 1.5 billion | ||||||||
Total |
71,200 | $ | 145 billion | $ | 24.9 billion | $ | 2.5 billion | ||||||||||
- (1)
- Data from GuideStar USA, Inc.
75
- (2)
- Calculated
by applying a $0.15 per dollar raised expense for enterprise NPOs and $0.21 cents per dollar raised for mid-market NPOs based on fundraising
efficiency data from The Urban Institute as presented in a report entitled "Variations in Overhead and Fundraising Efficiency Measures."
- (3)
- Based on our experience with approximately 1,300 clients, we estimate that enterprise NPOs spend approximately 7.5% of fundraising spend on products and services addressable by our solutions, and we estimate that mid-market NPOs spend approximately 13% of fundraising spend on products and services addressable by our solutions.
Enterprise NPOs commonly have more staff resources, greater technical and functional requirements and more complex operating environments. In addition, many enterprise NPOs are comprised of multiple sites or chapters. Mid-market NPOs are more resource-constrained and typically seek more guidance and place a greater premium on ease-of-use and price.
Challenges Facing Nonprofit Organizations
NPOs face unique challenges that center upon the need to reach new constituents and to engage effectively with a large and diverse number of existing constituents. In particular, NPOs struggle with the following challenges:
- •
- High cost of fundraising. The American Institute of
Philanthropy in its "Charity Rating Guide" considers fundraising cost of $0.35 or less per dollar raised to be acceptable for most charities. In particular it costs an average of $2.20 to raise $1.00
from a new donor via the direct mail channel, according to a 2004 report entitled "A New Direction for Tomorrow's Direct Mail Fundraising" by Mal Warwick & Associates. Furthermore, NPOs
typically experience new donor attrition rates of approximately 50% in the first year following an initial gift, according to a 2010 report entitled "Building Donor Loyalty" by Mal Warwick &
Associates.
- •
- Outdated and inflexible donor management systems. Many
NPOs have legacy donor databases that are deployed on-premise, have limited extensibility and can be difficult and expensive to adapt to NPOs' evolving needs. Additionally, many of these
legacy systems focus on managing relationships with existing donors rather than the acquisition of new constituents and the management of other key business processes such as volunteer and event
management.
- •
- Limited ability to act rapidly and quickly mobilize
constituents. Major occurrences, such as the recent earthquakes in Haiti and Hurricane Katrina, and political developments can provide
opportunities for NPOs to mobilize their constituents and generate a significant number of new donors and advocates. However, many NPOs have a limited ability to act rapidly and mobilize constituents
at the grassroots level because these NPOs rely on long lead-time communications such as direct mail.
- •
- Higher expectations from constituents. We believe
constituents increasingly expect personalized communications from NPOs via the constituents' medium of choice. Many constituents are online, conversant in social media and active at events. Due to the
proliferation of communication channels, NPOs are pressured to deploy many different techniques to effectively engage their constituents. Based on our fundraising experience with approximately 1,300
NPOs, we also believe constituents increasingly expect transparency into the use of donations, which makes fundraising and constituent relationship management more difficult.
- •
- Difficulty in sharing data across operational silos. Constituent data such as giving history, interests and preferred methods of communication are often stored in separate systems, making it difficult to share the data across an organization and, in the case of enterprise NPOs, with other chapters and national offices. Additionally, non-integrated databases can result in uncoordinated communications and data inconsistencies and can limit an NPO's ability to cross-market to its constituents.
76
- •
- Limited technical and marketing resources. Many NPOs have limited in-house technical expertise and time to manage on-premise legacy systems, fully utilize the Internet as a marketing medium and integrate their online marketing programs with their traditional off-line programs and donor databases. Due in part to these limitations, marketing resources at many NPOs are constrained in their ability to create mass appeals that are personalized and effective.
NPOs spend large amounts of money on fundraising, advocacy and donor management. Many NPOs have adopted legacy donor databases to support their offline activities but have only recently begun to leverage online marketing as a mission-critical channel to reach and cultivate constituents. The emergence of the online channel has accentuated NPOs' struggles to integrate their online and offline communications and fundraising efforts. We believe the Internet and the increasing adoption of social media and mobile technologies are enabling NPOs to raise funds, advocate for change and cultivate relationships with their constituents in more cost-effective and engaging ways.
Our Solutions
We provide on-demand constituent engagement solutions to NPOs that enable them to more effectively raise funds, advocate for change and cultivate relationships with their donors, activists, volunteers, alumni and other constituents. Our integrated solutions include our Convio Online Marketing platform and Common Ground, our constituent relationship management application. Convio Online Marketing enables NPOs to harness the full potential of the Internet and social media as new channels for constituent engagement and fundraising. Common Ground delivers next-generation donor management capabilities, integrates marketing activities across online and offline channels and is designed to increase operational efficiency. Our software is built on an open, configurable and flexible architecture that enables our clients and partners to customize and extend our functionality. Our solutions are enhanced by a portfolio of value-added services tailored to our clients' specific needs.
Our solutions provide the following benefits to NPOs:
- •
- Extend reach and raise more funds at a lower cost. Our
solutions enable NPOs to reach new constituents, increase retention rates and improve the cost effectiveness of engaging with constituents. We also improve the performance of NPOs' fundraising
activities by enabling our clients to increase gift frequency and average gift size.
- •
- Engage constituents more effectively. Our solutions enable
NPOs to cultivate relationships with constituents by tracking and integrating their online and offline interactions, interests and preferences. This comprehensive constituent information enables NPOs
to engage in more personalized and meaningful ways and can lead to more active constituents who give more and help to recruit new constituents.
- •
- Act rapidly to mobilize constituents. Our solutions enable
NPOs and their constituents to quickly respond to current events such as natural disasters, which can be a catalyst for giving, advocacy and the acquisition of new constituents. Our solutions allow
NPOs to create and deploy broad-based online fundraising or advocacy campaigns within minutes of a significant development.
- •
- Eliminate data and process silos. Our solutions are
designed to manage online and offline data and processes across the entire organization and to be interoperable with an NPO's existing systems and processes. We also provide permission-based access
for chapters and national offices, which is of particular importance to enterprise NPOs. Our solutions reduce uncoordinated communications and data inconsistencies and make cross-marketing to
constituents easier.
- •
- Easily adapt our solutions using our open platform. We have developed our solutions based on open architectures that enable customization and extension of our solutions to third-party platforms such as social networks, mobile devices, collaboration tools and third-party donor databases. Our
77
open approach allows NPOs to adapt our solutions to their business processes and to address expanding communication channels and evolving constituent preferences.
- •
- Reduce burden on limited resources. Our
on-demand model enables rapid deployment of our solutions, so our clients can quickly realize value from their investment and access real-time upgrades that enable them to keep
pace with rapidly evolving technology. There is no hardware to purchase or maintain, and there are no software upgrades to manage.
- •
- Access best practices, knowledge and guidance based on our experience. We enable NPOs to access best practices through our software, services and publications that help NPOs more effectively achieve their missions. For example, we publish "The Convio Online Marketing Nonprofit Benchmark Index Study" to help NPOs understand key marketing metrics, and the relative performance of their organizations. This peer benchmark information helps NPOs better manage the performance of their marketing programs and donor management practices. This quantitative approach to measuring success enables NPOs to continually refine their tactics, improve the effectiveness of their marketing initiatives and allocate resources more efficiently.
Business Strengths
We pioneered the delivery of software-as-a-service, or SaaS, online marketing solutions to NPOs, launching the first version of our solution in 2000. We have maintained an exclusive focus on NPOs which has enabled us to develop deep nonprofit industry expertise. We are a leading provider of on-demand constituent engagement solutions to NPOs, and we believe the following business strengths are key to our success:
- •
- Leading online marketing solution for NPOs. The maturity,
breadth, depth and measurable results of our COM solution enable us to compete more effectively, attract new customers and grow our presence within existing clients. Through continuous research and
product innovation, we strive to ensure that our customers are at the forefront of online marketing.
- •
- Disruptive model for donor management market. Our Common
Ground application is an innovative constituent relationship management solution. Unlike many traditional donor databases, Common Ground allows NPOs to manage fundraising and other program operations
in a single open application built on salesforce.com's Force.com platform. Common Ground allows NPOs to improve operational efficiency and to identify new fundraising prospects. These benefits have
allowed us to quickly penetrate the donor management market.
- •
- Loyal clients producing predictable recurring revenue that scales with client
growth. We sell our software on a subscription basis which provides greater levels of recurring and predictable revenue than perpetual
license-based business models. Our subscription fees grow as our clients grow their constituent bases and purchase additional modules of COM and additional seats of Common Ground. In 2009, 25% of our
renewing clients increased their subscription revenue with us.
- •
- Marquee clients, providing referrals and references that can shorten sales
cycles. We have marquee clients in each nonprofit vertical we serve, and they provide us with a significant number of referrals and
references. The NPO community is highly networked, and client referrals and references can lead to new opportunities and shorten our sales cycles.
- •
- Nonprofit industry thought leadership. We invest in primary research to identify trends in charitable giving and constituent behavior. We also aggregate data across our clients to perform benchmarking and best practice analysis. As evidenced by the over 14,500 downloads of our industry whitepapers and benchmarking studies in 2009, NPOs recognize our thought leadership which generates sales leads and guides our product development and strategic consulting services.
78
- •
- Ability to acquire and effectively serve NPOs of all
sizes. We sell our solutions through a direct sales force and cost-effectively tailor our sales processes to the nonprofit
markets we serve. We develop and package our solutions to meet the unique needs of these markets. This approach enables us to acquire new NPO clients of all sizes.
- •
- Portfolio of value-added services. Our services are designed to help our clients achieve success through the development and execution of effective online and offline marketing and constituent engagement strategies. Our consultants assist clients in setting operational goals, developing strategies and tactics, improving user experience and analyzing online campaigns. We also offer cohort-based consulting services designed for mid-market NPOs. Our services help us acquire new clients and deepen relationships with existing clients.
Our Strategy
Our objective is to be the leading worldwide provider of constituent engagement solutions for NPOs while continuing to lead the market in innovation, best practices and client service. Key elements of our strategy include:
- •
- Continue to grow our client base. We believe the market
for our solutions is large and underpenetrated. We intend to expand our presence in the enterprise segment by increasing sales and marketing efforts and by offering an expanded services portfolio and
greater solution functionality. We plan to increase our number of mid-market clients with Convio Go!, our mid-market COM offering, and Common Ground.
- •
- Retain and grow revenue from our existing client base. Our
revenue is driven by a combination of the number of COM modules and Common Ground seats licensed and services purchased by our clients as well as their ongoing usage of our solutions. As online
marketing continues to grow relative to other channels, we believe NPOs will allocate more of their fundraising spend to online initiatives. We plan to sell additional software and services to
existing clients to help them more fully utilize our solutions and to grow their online constituent base.
- •
- Use Common Ground to disrupt the donor management market and create cross-selling
opportunities. We intend to further develop and continue to market aggressively our Common Ground application. We believe Common Ground
is disruptive to the donor management market, particularly in the mid-market where innovation has been the most limited. In addition, new Common Ground clients provide us with
opportunities to sell other solutions and services.
- •
- Make complementary acquisitions. We continuously follow
nonprofit industry developments and technology requirements and intend to evaluate and acquire technologies or businesses that we believe will complement our solutions, provide us new clients or both.
- •
- Expand geographically. In 2009, approximately 2% of our revenue was derived from clients based outside the United States. We intend to expand into additional geographic areas by leveraging our expertise developed by serving our approximately 1,300 clients in the United States.
79
Our Products
Our solutions include our Convio Online Marketing platform and Common Ground, our constituent relationship management application. Clients can license and use COM and Common Ground independently, or they can license and use both in an integrated manner. We have purpose-built our solutions for NPOs based on our interactions with our approximately 1,300 clients. We deliver our software on-demand, and our clients and their constituents access all of our software using a standard Internet browser. Our software employs an open, multi-tenant architecture that allows our clients to customize and extend our software.
The following diagram provides an overview of the core functionality of our solutions.
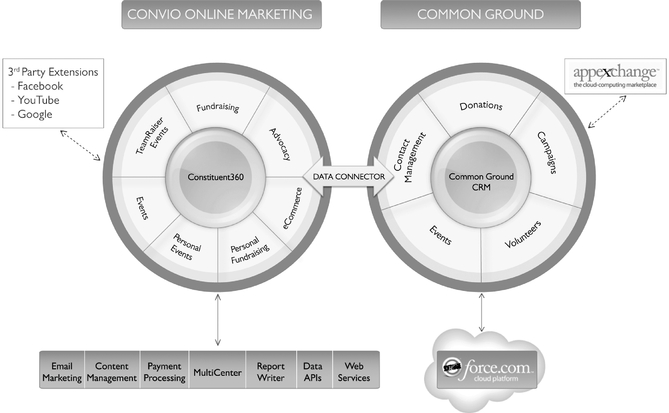
Convio Online Marketing
Our Convio Online Marketing platform contains an email marketing engine, payment processing engines, a content management system and modules that include fundraising, advocacy, special events, personal events and eCommerce. These modules are exclusively designed for NPOs and address the online marketing and fundraising requirements of NPOs of all sizes.
The foundation for our COM platform is our Constituent360 database which provides clients with a comprehensive, unified catalogue of their constituents' online interactions, interests and preferences. It also provides a robust set of query, targeting, segmentation, importing, exporting and reporting capabilities for this data. By managing data across these multiple dimensions, Constituent360 provides NPOs with rich and actionable intelligence that enables them to refine and optimize marketing and fundraising results.
80
The following table provides a description of the key functions and features of Convio Online Marketing:
| Function | Key Features | |
|---|---|---|
| Fundraising | • Enables NPOs to easily build and tailor online fundraising campaigns and quickly create specialized websites to motivate giving in response to current events; |
|
• Dynamically solicits online donations including one-time gifts, installments, sustaining gifts, honor/memorial gifts and memberships; |
||
• Provides secure, PCI-compliant payment processing with multiple payment options, including credit card, bank account debit and PayPal; and |
||
• Generates comprehensive reporting and analysis. |
||
Email Marketing |
• Provides online marketing tools that help NPOs build and manage effective email campaigns, from creation and testing to targeted delivery and follow-up, to drive higher response and increased constituent participation; |
|
• Delivers robust capabilities to generate and send branded, graphical email messages, online newsletters and electronic greeting cards; |
||
• Manages content, workflow, delivery, storage and subscriptions; and |
||
• Enables NPOs to tailor content to individual constituent interests to drive higher response and increased participation. |
||
Advocacy |
• Encourages and manages grassroots activism; |
|
• Enables NPOs to publish targeted action alert forms to be completed by constituents for delivery to legislators or media organizations; and |
||
• Includes legislator scorecards that allow NPOs to rate legislators on issues, automatically computing numerical scores based on historical voting records. |
||
TeamRaiser Events |
• Provides tools for NPOs' constituents to create personal or team fundraising web pages and send email donation appeals to their networks of family and friends in support of events such as a walks, runs and rides; |
|
• Motivates NPOs' constituents to recruit new donors and reach their fundraising goals; and |
||
• Creates a network effect that increases NPOs' fundraising results and grows their email list size. |
||
MultiCenter |
• Enables the national offices of multi-chapter NPOs to interoperate across their chapters; |
|
• Facilitates a coordinated, integrated marketing strategy across chapters; |
||
• Allows individual chapters to control their web presence including branding and content; and |
||
• Allows controlled access to shared information across multiple chapters to house constituent data, create and launch campaigns and manage administrative settings. |
81
| Function | Key Features | |
|---|---|---|
| Content Management | • Enables NPOs to create high impact websites, empowers their content contributors to become content owners, reduces the reliance on technical staff to publish changes, and creates powerful, database-driven web pages; |
|
• Provides content authoring tools, editorial workflow, personalization, search and document management; and |
||
• Addresses websites of virtually all sizes, including multiple web properties, thousands of web pages, and multiple content contributors. |
||
Personal Fundraising |
• Empowers constituents to drive fundraising for NPOs as a champion or in honor or memory of a loved one; |
|
• Enables constituents to create personalized tribute web pages and encourage friends and family to learn about NPOs' causes through easy-to-use web content and email authoring tools and templates; and |
||
• Provides an innovative means for NPOs to acquire new constituents, generate funds and create rich content and community around their websites. |
||
Events |
• Enables NPOs to promote and register participants in a variety of events using a website calendar; and |
|
• Accommodates a variety of events including simple announcements with date, time, and location, more complex events that are recurring, multi-faceted or multi-day and events requiring online RSVPs, ticketing and online registration forms. |
||
Personal Events |
• Enables constituents to organize and host different types of personal events such as dinners or house parties; and |
|
• Enables constituents to promote events, track RSVPs and solicit online donations. |
||
eCommerce |
• Combines online store capabilities with Internet tools to raise funds; |
|
• Coordinates standard hierarchical product catalogs, shopping carts, inventory management, tax and shipping calculations; and |
||
• Enables cross-promotion to boost fundraising and involvement. |
Convio Open
We provide an open platform that allows NPOs to evolve their online marketing strategies as new media and other opportunities arise. We offer application programming interfaces, or APIs, and extensions that meet the growing demand of NPOs to access the Internet, leverage popular social media sites and integrate with mobile services. This approach allows NPOs, partners and others to create external, custom-built applications that integrate with our solutions to provide a more compelling constituent experience and reach a wider audience.
Our Donations APIs enable clients to embed our donation processing in websites, web applications or mobile applications. Additionally, our open platform supports fundraising and communications in a mobile context through mobile ready donation forms, text messaging, and text based donations. Our Web Services APIs allow clients to extract Constituent360 data for use in third-party systems.
82
Our extensions enable clients to leverage social networking and Web 2.0 capabilities to engage constituents through these popular channels:
- •
- Our Facebook extension enables clients to publish their content and engagement opportunities on Facebook;
- •
- Our Google Maps extension empowers administrators, event participants and personal event hosts to include maps in their
content;
- •
- Our Flickr extension provides a user-generated event marketing opportunity for NPOs with a TeamRaiser event;
- •
- Our YouTube extension enables NPOs to include video content on any page; and
- •
- Our Plaxo extension provides a point and click method for constituents to access any of their address books and contact lists, directly from a client's Convio-powered website.
Convio Go!
Convio Go! is a structured program consisting of selected COM modules and specialized, cohort-based services designed for mid-market NPOs new to online marketing and fundraising. Convio Go! includes a one-year guided program that provides a base configuration of essential Convio Online Marketing capabilities in combination with cohort-based consulting. Our consulting specialists help Convio Go! clients build strong foundations for their online strategies by developing their proficiency in our fundraising, email marketing, and content management modules. Through our clients' execution of their online programs, our Convio Go! clients grow their constituent bases, improve constituent engagement and increase donations. Since our release of Convio Go!, our clients have raised an average of $4 online for every dollar of subscription and services revenue recognized by us.
Common Ground
Common Ground is our constituent relationship management, or CRM, application that builds stronger relationships with donors, volunteers, activists, alumni and other constituents. Common Ground is designed to serve as the foundation of an NPO's fundraising operations as well as an NPO's constituent database. Common Ground tracks constituent outreach and interactions across multiple channels including online, telephone, direct mail and in-person meetings. Since our introduction of Common Ground in September 2008, over 170 NPOs, of which 65% were new clients to us, have selected Common Ground as their CRM application.
We utilize the Force.com cloud computing application platform to develop, package, and deploy Common Ground. We have developed NPO-specific functionality including donation management, event management and volunteer management to create a CRM application tailored to the needs of NPOs.
83
The following table provides an overview of the key features and functionality of each module of Common Ground:
| Function | Key Features | |
|---|---|---|
| Donor Management | • Tracks incoming gifts, builds revenue forecasts, identifies prospective donors, and pursues major donor opportunities; and |
|
• Utilizes sophisticated gift coding approaches that facilitate effective donor stewardship and segmentation for future communications. |
||
| Contact Management | • Provides a high degree of flexibility in defining and tracking relationships between NPOs and their constituents; and |
|
• Allows creation of relationship types, definition of key relationships, and set up of rules for automatic assignment of relationships based on peer-to-peer fundraising results. |
||
| Campaign Management | • Plans and executes a variety of outreach campaigns, including direct marketing; and |
|
• Tracks participation, costs and key performance indicators. |
||
| Event Management | • Plans and manages special events such as galas and golf tournaments; |
|
• Tracks detailed event information, including invitations and sponsorships; and |
||
• Provides the capability to sell multiple ticket levels and assign various benefits associated with those ticket levels. |
||
| Volunteer Management | • Organizes volunteer opportunities with multiple shifts, locations, and required volunteer qualifications; |
|
• Provides a volunteer profile that tracks an individual's availability and skills, which can then be matched against upcoming volunteer opportunities; and |
||
• Reports on the number of prospective or registered volunteers and manages the waitlist. |
Common Ground distinguishes itself from many legacy on-premise donor databases in a variety of ways including:
- •
- Beyond Donor Management. The functionality of Common
Ground extends beyond cultivating donors and tracking gifts. For example, Common Ground's integration with salesforce.com helps NPOs manage their service delivery operations and other mission-related
programs. By integrating fundraising and program operations functionality, Common Ground is designed to enable NPOs to improve operations and to identify incremental fundraising prospects.
- •
- Organizational Efficiency. NPOs can gain efficiency by
automating processes, changing access to information based on user roles, and enabling staff to build and run custom reports. Users can access Common Ground from an Internet browser over any Internet
connection. Common Ground is also integrated with productivity applications and email programs like Microsoft Outlook.
- •
- Innovative Fundraising Strategies. Common Ground has the flexibility to facilitate a wide variety of emerging fundraising practices. Common Ground enables NPOs to tailor their fundraising strategies to leverage online marketing and social networks, which provides increased information about their constituents' online preferences and behaviors.
84
Our Services
Our services are an integral part of our solutions. We believe the scope and quality of our services, which have been developed and refined based on our experience with approximately 1,300 active clients, meaningfully differentiate us from our competitors.
We deliver services to our enterprise clients through a traditional consulting model, characterized by highly customized strategic consulting services. We believe this is the best way for our enterprise clients to achieve success in their online programs. We deliver services to many mid-market clients through Convio Go!, a structured one-year program designed to get clients up and running quickly with the help of a cohort-based approach. Clients receive regular coaching sessions with our consultants who help produce campaigns with an emphasis on fundraising and email list size growth.
In addition to Convio Go!, account management, technical support and deployment services, the following table provides an overview of the types of services we offer along with a description of the key attributes:
| Service Type | Key Attributes | |
|---|---|---|
| Strategic Planning | • Develops Internet marketing roadmaps outlining key metrics, targets, strategies, tactics and recommended resources. |
|
| Campaign Management | • Assists clients in executing on their Internet roadmap by providing campaign strategy, project management, creativity and production. |
|
| Web Design | • Helps clients effectively design their websites by using industry-recognized user experience methodologies combined with audience engagement strategies specifically designed for NPOs. |
|
| Data Analytics | • Provides robust data analytic services that highlight useful information, suggest conclusions, and support decision making. |
|
| Benchmarking | • Provides benchmarking services using standard metrics which allow clients to compare results with aggregated results from other clients. |
|
| Campaign Analytics | • Analyzes campaign results and identifies potential areas of improvement based on established benchmarks. |
|
| Data Integration | • Utilizes data connectors to synchronize essential constituent data; and |
|
• Provides custom data integration, data de-duplication, custom report builds and custom synchronization. |
||
| Training | • Provides comprehensive classroom and online training on the features and functionality of our solutions; and |
|
• Provides customized training programs at client sites. |
We complement our service offerings with a network of over 55 partners serving the nonprofit market, including interactive agencies, direct marketing agencies, public affairs firms and complementary technology companies. This partner network allows us to provide additional services and to expand our deployment capacity, including services provided by our certified Convio Solution Providers who follow our deployment methodologies.
Our solution providers are authorized partners whom we train, test and recommend to our clients for consultation and deployment services around our solutions, including Common Ground. They also provide post-deployment services that include interactive strategy and web design. These partners
85
enable us to maintain lower personnel costs and expand our deployment capacity. Our technology partners provide technologies that complement and extend the breadth of our solutions. Their offerings typically integrate with our solutions through our open APIs and include social networking, tools, mobile messaging platforms and web applications. Through these partners, we are able to attract clients who want the additional functionality and services that these partners provide to our solutions. Our referral partners refer clients to us in exchange for a percentage of the value of the referred business which we close. The commission rate is negotiated between each partner and us based on a percentage of the contract's value.
Clients
We serve approximately 1,300 NPO clients which include leading NPOs in each of the verticals we serve. We have clients of all sizes, including 29 of the 50 largest charities in the United States as listed in the November 2009 Forbes article entitled "The 200 Largest U.S. Charities." We define a client as an organization with which we have a billing relationship. In certain cases, we bill individual chapters of multi-chapter NPOs and, in other cases, we have a single billing relationship with multi-chapter NPOs.
In 2007, 2008 and 2009, substantially all of our revenue was derived from clients in the United States and all of our long-lived assets were located in the United States. No client accounted for more than 10% of our total revenue in 2007, 2008 and 2009.
The following table provides an overview of our largest clients by vertical, as measured by the email list size of each client using our COM solution:
| International Relief | Health | Environmental | ||
|---|---|---|---|---|
| American Red Cross | American Cancer Society | National Wildlife Federation | ||
| U.S. Fund for Unicef | National Multiple Sclerosis Society | World Wildlife Fund | ||
| Oxfam America | American Institute for Cancer Research | Natural Resources Defense Council | ||
| Feed The Children | Susan G. Komen for the Cure | Defenders of Wildlife | ||
| Cooperative Assistance and Relief Everywhere | Avon Products Foundation | Sierra Club |
| Animal Welfare | Associations and Unions | Public Affairs | ||
|---|---|---|---|---|
| People for the Ethical Treatment of Animals | National Association of Realtors | National Committee To Preserve Social Security and Medicare | ||
| American Society for the Prevention of Cruelty To Animals | Veterans of Foreign Wars of the United States | Rock the Vote | ||
| The Humane Society of the United States | Association of Production and Inventory Control Society | Planned Parenthood Federation of America | ||
| North Shore Animal League | American Nurses Association | NARAL Pro-Choice America | ||
| American Humane Association | National Military Family Association | American Civil Liberties Union Foundation |
86