Attached files
| file | filename |
|---|---|
| 8-K - FORM 8-K - EXELON GENERATION CO LLC | d8k.htm |
| EX-99.1 - PRESS RELEASE AND EARNINGS RELEASE ATTACHMENTS - EXELON GENERATION CO LLC | dex991.htm |
 Earnings Conference Call •
1
st
Quarter 2010
April 23, 2010
Exhibit 99.2 |
 2
Forward-Looking Statements
This presentation includes forward-looking statements within the meaning of the Private
Securities Litigation Reform Act of 1995, that are subject to risks and uncertainties. The
factors that could cause actual results to differ materially from these forward-looking
statements include those discussed herein as well as those discussed in (1) Exelon’s 2009
Annual Report on Form 10-K in (a) ITEM 1A. Risk Factors, (b) ITEM 7. Management’s
Discussion and Analysis of Financial Condition and Results of Operations and (c) ITEM 8.
Financial Statements and Supplementary Data: Note 18; (2) Exelon’s First Quarter 2010
Quarterly Report on Form 10-Q (to be filed on April 23, 2010) in (a) Part II, Other Information,
Item 1A. Risk Factors and (b) Part I, Financial Information, Item 1. Financial Statements:
Note 12 and (3) other factors discussed in filings with the Securities and Exchange Commission
(SEC) by Exelon Corporation, Commonwealth Edison Company, PECO Energy Company and
Exelon Generation Company, LLC (Companies). Readers are cautioned not to place undue
reliance on these forward-looking statements, which apply only as of the date of this
presentation. None of the Companies undertakes any obligation to publicly release any
revision to its forward-looking statements to reflect events or circumstances after the date of
this presentation.
This presentation includes references to adjusted (non-GAAP) operating earnings and non-
GAAP cash flows that exclude the impact of certain factors. We believe that these adjusted
operating earnings and cash flows are representative of the underlying operational results of
the Companies. Please refer to the appendix to this presentation for a reconciliation of
adjusted (non-GAAP) operating earnings to GAAP earnings. Please refer to the footnotes of
the following slides for a reconciliation non-GAAP cash flows to GAAP cash flows.
|
 3
2010 Operating Earnings Guidance
2010 Revised
2010 Original
$0.40 -
$0.50
$2.55 -
$2.80
$3.60 -
$4.00
(1)
ComEd
PECO
Exelon
Generation
ComEd
PECO
Exelon
Generation
Holdco
Holdco
Exelon
$0.60 -
$0.70
Exelon
$3.70 -
$4.00
(1)
$0.60 -
$0.70
$0.40 -
$0.50
$2.70 -
$2.90
Revising 2010 operating earnings guidance to $3.70
–
$4.00/share
(1)
Key Drivers of Guidance Revision
+
Higher Exelon Generation revenue
net fuel
+
Improved PECO load outlook
+
Final 2010 pension/OPEB expense
lower than anticipated
(1) Refer to Earnings Release Attachments for additional details and to the Appendix for a
reconciliation of adjusted (non-GAAP) operating EPS to GAAP EPS. |
 4
Key Financial Messages
Operating results for 1Q10
•
Operating
earnings
of
$1.00/share
(1)
•
92.3% nuclear capacity factor
•
Initial
signs
of
economic
recovery
with
improved
load
outlook
in
our
service
areas
Revising
2010
operating
earnings
guidance
to
$3.70
-
$4.00/share
(1)
•
Expect 2Q10 earnings in the range of $0.80
-
$0.90/share
•
On track to meet 2010 O&M targets
Improved
cash
flow
from
operations
for
2010
(2)
•
Anticipate using cash and debt to make an incremental pension contribution of
about $500 million
Executing
regulatory
plan
at
PECO
and
ComEd
•
PECO
filed
electric
and
gas
distribution
rate
cases
on
March
31,
2010
•
ComEd is planning to file electric distribution rate case in 2Q10
(1) Refer to Earnings Release Attachments for additional details
and to the Appendix for a reconciliation of adjusted (non-GAAP) operating EPS to GAAP EPS.
(2) Cash Flow from Operations primarily includes net cash flows
provided by operating activities (excluding counterparty collateral activity) and net cash flows used in
investing activities other than capital expenditures.
Note: Data contained on this slide is rounded. |
 5
$0.91
$0.17
$0.66
$0.17
$0.19
$0.17
2009
2010
Operating EPS
HoldCo/Other
ExGen
PECO
ComEd
1st
Quarter (1Q)
(1)
Lower ExGen margins are driving lower quarter over quarter earnings; however,
1Q10 earnings were higher than the guidance of $0.85
-
$0.95/share
(1) Refer to Earnings Release Attachments for additional details and to the
Appendix for a reconciliation of adjusted (non-GAAP) operating EPS to GAAP EPS.
$1.08
$1.13
GAAP EPS
$1.00
$1.20 |
 6
Exelon
Generation
Operating EPS Contribution
2010
2009
Key Drivers –
1Q10 vs. 1Q09
(1)
Unfavorable market/portfolio conditions:
$(0.05)
Lower energy prices under the PECO
PPA, offset at PECO: $(0.05)
Lower nuclear volume: $(0.04)
Higher O&M, primarily due to higher
nuclear outage days, partially offset by
cost management initiatives: $(0.04)
Higher nuclear fuel costs: $(0.03)
(1) Refer to the Earnings Release Attachments for additional details and to the
Appendix for a reconciliation of adjusted (non-GAAP) operating EPS to GAAP EPS.
(2) Outage days exclude Salem.
101
34
Refueling
5
13
Non-refueling
1Q10
1Q09
Outage Days
(2)
1Q
$0.91
$0.66 |
 7
0.00
2.00
4.00
6.00
8.00
10.00
12.00
14.00
16.00
2007
2008
2009
2010
2011
2012
2013
2014
Actuals
PJM Oct '09 FTR Auction
6/30/2009
12/31/2009
3/31/2010
Power Markets Update
$32.19
$30.71
$29.73
Ni-Hub ATC ($/MWh)
$43.47
$42.04
$39.69
PJM-W ATC ($/MWh)
Reference Prices
2010
2011
2012
Percentage of Expected
Generation Hedged
(1)
95-98%
79-82%
48-51%
Midwest
92-95
79-82
52-55
Mid-Atlantic
96-99
81-84
44-47
South
97-100
68-71
41-44
10,300 MW
8,700 MW
1,500 MW
RTO
EMAAC
MAAC
Capacity
by
Region
Eligible
for
2013/14
RPM
Base
Residual
Auction
(2)
(1)
See footnote 2 on page 34.
(2)
All generation values are approximate and not inclusive of wholesale
transactions. Notes: All capacity values are in installed capacity terms
(summer ratings) located in the areas. Reflects the retirements of Eddystone 1 and 2 and Cromby Station.
MAAC = Mid-Atlantic Area Council; EMAAC = Eastern MAAC; MAAC area encompasses
EMAAC 7%
50%
43%
Key drivers expected to impact clearing prices:
•
Rule change allowing existing demand response
resources to bid in above $0
•
PJM raised the forecast for demand by 1.7%
•
First Energy has joined PJM with a net load increase
•
Delay in Susquehanna-Roseland Transmission line
reduces available import capability into EMAAC
•
Net CONE increasing by 15% and 23% for RTO and
EMAAC, respectively
AEP-Dayton / NiHub ATC Energy Basis
As of March 31, 2010 |
 8
Key Drivers –
1Q10 vs. 1Q09
(1)
Uncollectible expense rider: $0.06
Lower O&M primarily due to cost
management initiatives:
$0.03
‘09 benefit from Illinois tax ruling,
which was later reversed in 3Q09:
$(0.05)
ComEd Operating EPS Contribution
(1) Refer to the Earnings Release Attachments for additional details and to the
Appendix for a reconciliation of adjusted (non-GAAP) operating EPS to GAAP EPS.
2010
2009
1Q
$0.17
$0.19
1Q10
Actual
Normal
% Change
Heating Degree Days
3,110 3,208 (3.1)% |
 9
-10.0%
-7.5%
-5.0%
-2.5%
0.0%
2.5%
5.0%
7.5%
10.0%
1Q09
2Q09
3Q09
4Q09
1Q10
2Q10E
3Q10E
4Q10E
-10.0%
-7.5%
-5.0%
-2.5%
0.0%
2.5%
5.0%
7.5%
10.0%
All Customer Classes
Large C&I
Residential
Gross Metro Product
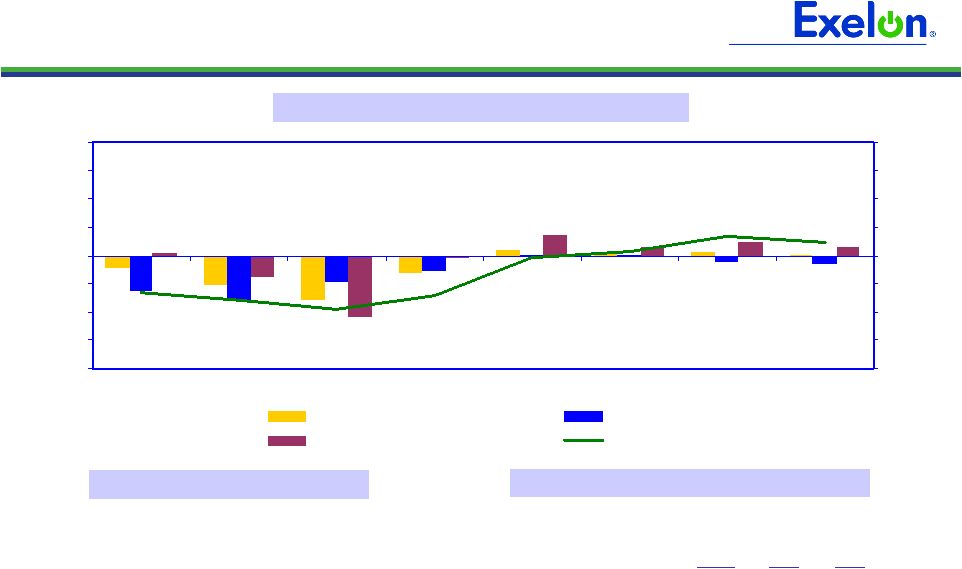
ComEd Load Trends
Weather-Normalized Load
Key Economic Indicators
Note: C&I = Commercial & Industrial
Weather-Normalized Load Year-over-Year
(4)
Chicago
Unemployment rate
(1)
10.9%
2010 annualized growth in
gross domestic/metro product
(2)
2.9%
1/10 Home price index
(3)
(4.4)%
(1) Source: Illinois Dept. of Employment Security (February 2010)
(2)
Source: Global Insight (March 2010)
(3)
Source: S&P Case-Shiller Index
(4)
Not adjusted for leap year effect
2009
(4)
1Q10 2010E
Average Customer Growth
(0.4)% (0.1)%
0.1% Average Use-Per-Customer
(1.0)%
0.2%
0.1%
Total Residential
(1.4)%
0.1% 0.2% Small C&I
(2.2)% (1.7)%
0.4% Large C&I
(6.7)% (1.1)%
1.7% All Customer Classes
(3.3)% (0.8)%
0.8% |
 10
ComEd Credit Facility
One of the largest utility bank refinancings launched to-date in 2010,
with strong participation and new benchmark pricing
Successfully closed refinancing of $1 billion revolving credit
facility
on
March
25
th
•
3-year unsecured facility; initial term to expire 3/25/13
•
Use for general corporate purposes and letters of credit
•
Replaces previous $952 million facility that was due to expire on 2/16/11
Moved the bar on market pricing
•
Undrawn fee of 0.375%; fully drawn fee of LIBOR + 2.25%
•
Refinancing
deals
for
similar
rated
utilities
launched
late
last
year
priced
approximately 0.50-0.75% higher (drawn fee)
Reflects strong relationships with large, diverse bank group
•
22 banks in facility
–
none with exposure of more than 6%
•
Syndication 1.6x oversubscribed |
 11
PECO Operating EPS Contribution
Key Drivers –
1Q10 vs. 1Q09
(1)
Lower energy prices paid to Generation
under the PPA, offset at Generation:
$0.05
Increased storm costs: $(0.01)
CTC amortization: $(0.04)
2010
2009
(1) Refer to the Earnings Release Attachments for additional details and to the
Appendix for a reconciliation of adjusted (non-GAAP) operating EPS to GAAP EPS. 1Q
$0.17
$0.17
1Q10
Actual
Normal
% Change
Heating Degree Days 2,411
2,510 (3.9)%
|
 12
PECO Load Trends
Weather-Normalized Electric Load
Key Economic Indicators
Weather-Normalized Load Year-over-Year
(3)
Philadelphia
Unemployment rate
(1)
9.2%
2010 annualized growth in
gross domestic/metro product
(2)
0.8%
(1) Source:
U.S
Dept.
of
Labor
(PHL
-
February
2010)
(2) Source: Moody’s Economy.com (March 2010)
(3) Not adjusted for leap year effect
-10.0%
-7.5%
-5.0%
-2.5%
0.0%
2.5%
5.0%
7.5%
10.0%
1Q09
2Q09
3Q09
4Q09
1Q10
2Q10E
3Q10E
4Q10E
-10.0%
-7.5%
-5.0%
-2.5%
0.0%
2.5%
5.0%
7.5%
10.0%
All Customer Classes
Large C&I
Residential
Gross Metro Product
Note: C&I = Commercial & Industrial
2009
(3)
1Q10 2010E
Average Customer Growth
(0.2)%
(0.2)% (0.0)% Average
Use-Per-Customer (2.1)%
2.1%
1.2%
Total Residential
(2.3)%
1.8% 1.1% Small
C&I (2.7)%
(0.9)% (0.2)% Large C&I
(3.0)%
0.1% (0.3)% All Customer Classes
(2.6)%
0.5% 0.3% |
 13
PECO –
Electric & Gas Distribution
Rate Case Filings
On March 31, PECO filed electric and gas distribution rate cases
•
First electric distribution rate case since 1989
–
Act 129 energy efficiency and smart meter costs recovered separately through
rider •
Last gas delivery rate case in 2008
53.18%
53.18%
Common Equity Ratio
R-2010-216-1592
R-2010-216-1575
Docket #
2010
(1)
2010
(1)
Test Year
ROE: 11.75%
ROR: 8.95%
ROE: 11.75%
ROR: 8.95%
Requested Returns
$1,100 million
$3,236 million
Rate Base
6.94%
(2)
$316
million
Electric
$44 million
Revenue Requirement Increase
5.28%
2011 Proposed Distribution Price
Increase as % of Overall Customer Bill
Gas
Rate Case Request
The PAPUC has a nine-month process for litigation of the
rate case filings
(1) With pro forma adjustments.
(2) Excluding Alternative Energy Portfolio Standards and default service surcharge.
Note: Electric and gas rate case filings available on PAPUC website or www.peco.com/know.
|
 14
2010 Projected Sources and Uses of Cash
($ millions)
Exelon
(9)
Beginning Cash Balance
(1)
$1,050
Cash Flow from Operations
(1)(2)
975
1,050
2,475
4,600
CapEx
(excluding Nuclear Fuel, Nuclear
Uprates
and Solar Project, Utility Growth
CapEx)
(675)
(400)
(775)
(1,900)
Nuclear Fuel
n/a
n/a
(850)
(850)
Dividend
(3)
(1,400)
Nuclear Uprates
and Solar Project
n/a
n/a
(350)
(350)
Utility Growth CapEx
(4)
(250)
(100)
n/a
(350)
Net Financing (excluding Dividend):
Planned Debt Issuances
(5)(6)
500
--
250
750
Planned Debt Retirements
(7)
(225)
(400)
--
(1,025)
Other
(8)
(75)
175
--
(25)
Ending Cash Balance
(1)
$500
(1)
Excludes counterparty collateral activity.
(2)
Cash Flow from Operations primarily includes net cash flows provided by operating activities and net
cash flows used in investing activities other than capital expenditures. Cash Flow from
Operations for PECO and Exelon includes $551 million for competitive transition charges.
(3)
Assumes 2010 dividend of $2.10/share. Dividends are subject to declaration by the Board of
Directors. (4)
Represents new business and smart grid/smart meter investment.
(5)
Excludes Exelon Generation’s $212 million and ComEd’s $191 million of tax-exempt bonds
that are backed by letters of credit (LOCs). Excludes PECO’s $225 million Accounts
Receivable (A/R) Agreement with Bank of Tokyo. Assumes PECO’s A/R Agreement is extended in accordance with its terms beyond September 16, 2010.
(6)
Exelon Generation’s financing includes $250 million of debt to refinance a portion of Exelon
Corp’s $400 million maturity. (7)
Excludes Exelon Generation’s and ComEd’s tax-exempt bonds. PECO’s planned
debt retirement of $400 million represents the final retirement of the PECO Energy Transition
Trust. (8)
“Other” includes PECO Parent Receivable, proceeds from options and expected changes in
short-term debt. (9)
Includes cash flow activity from Holding Company, eliminations, and other corporate entities.
|
 15
Appendix |
 16
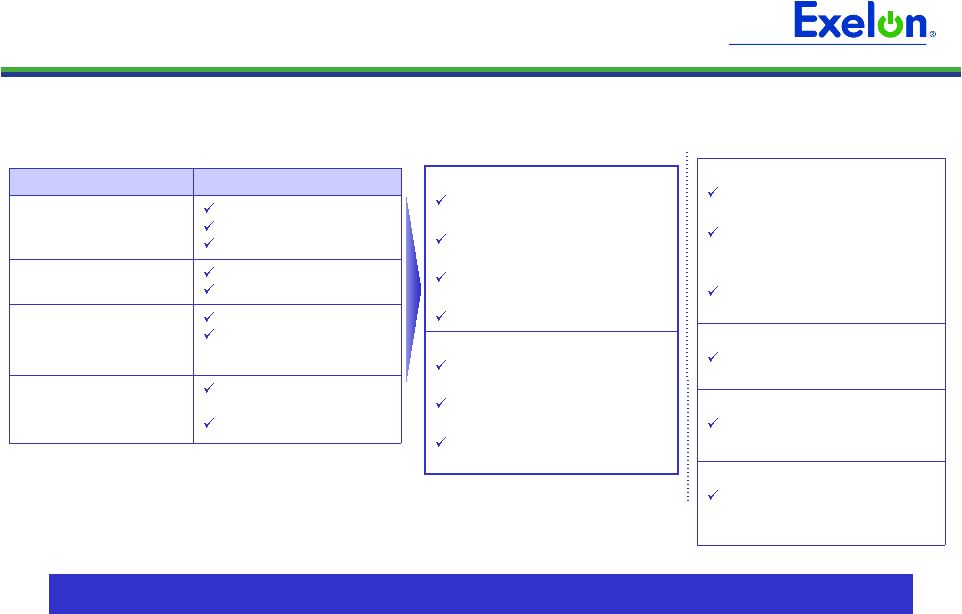
2010 Events of Interest
Q1
Q2
Q3
Q4
RPM Base Residual
Auction (May)
Uncollectibles rider
tariff (2/2)
Illinois Power Agency supply
procurement RFP (4/28, ICC
decision to follow)
Illinois Primaries
(2/2)
Pennsylvania
Primaries (5/18)
Electric and gas
distribution rate
case filings (3/31)
Procurement RFP
(May, results in June)
Procurement RFP
(Sep., results in Oct.)
Electric distribution
rate case filing (2Q)
Illinois Elections
(11/2)
Pennsylvania
Elections (11/2) |
 17
Sufficient Liquidity
(1) Excludes previous commitment from Lehman Brothers Bank and commitments
from Exelon’s Community and Minority Bank Credit Facility. (2)
Available Capacity Under Facilities represents the unused bank commitments under the borrower’s credit agreements net of outstanding letters of credit and facility
draws. The amount of commercial paper outstanding does not reduce the
available capacity under the credit agreements. (3) Includes other
corporate entities. --
--
--
--
Outstanding Facility Draws
(431)
(163)
(3)
(261)
Outstanding Letters of Credit
$7,365
$4,834
$574
$1,000
Aggregate Bank Commitments
(1)
6,934
4,671
571
739
Available Capacity Under Facilities
(2)
(164)
--
--
(164)
Outstanding Commercial Paper
$6,770
$4,671
$571
$575
Available Capacity Less Outstanding
Commercial Paper
Exelon
(3)
($ millions)
Exelon bank facilities are largely untapped
Available Capacity Under Bank Facilities as of April 15, 2010
|
 18
Projected 2010 Key Credit Measures
14.3x
9.4x
FFO / Interest
Generation /
Corp:
68%
39%
FFO / Debt
54%
68%
Rating Agency Debt Ratio
BBB
A-
A-
BBB-
S&P Credit
Ratings
(3)
BBB+
A
BBB+
BBB+
Fitch Credit
Ratings
(3)
A3
A2
Baa1
Baa1
Moody’s Credit
Ratings
(3)
4.7x
5.2x
FFO / Interest
ComEd:
23%
21%
FFO / Debt
43%
48%
Rating Agency Debt Ratio
5.1x
5.0x
FFO / Interest
PECO:
26%
23%
FFO / Debt
45%
49%
Rating Agency Debt Ratio
29%
45%
Rating Agency Debt Ratio
94%
47%
FFO / Debt
20.9x
11.4x
FFO / Interest
Generation:
47%
41%
8.0x
Without PPA &
Pension / OPEB
(2)
56%
Rating Agency Debt Ratio
30%
FFO / Debt
7.1x
FFO / Interest
Exelon
Consolidated:
With PPA & Pension /
OPEB
(1)
Notes:
Exelon
and
PECO
metrics
exclude
securitization
debt.
See
following
slide
for
FFO
(Funds
from
Operations)/Interest,
FFO/Debt
and
Adjusted
Book
Debt
Ratio
reconciliations
to GAAP.
(1)
FFO/Debt
metrics
include
the
following
standard
adjustments:
debt
equivalents
for
PV
of
Operating
Leases,
PPAs,
unfunded
Pension
and
OPEB
obligations
(after-tax),
Capital
Adequacy
for Energy Trading, and other minor debt
equivalents.
(2) Excludes items listed in note (1) above.
(3) Current senior unsecured ratings for Exelon and Exelon Generation
and senior secured ratings for ComEd and PECO as of April 20, 2010. |
 19
FFO Calculation and Ratios
+ Other Non-Cash items
(1)
-
AFUDC/Cap. Interest
-
Decommissioning activity
+/-
Change in Working Capital
FFO Calculation
= FFO
-
PECO Transition Bond Principal Paydown
Net Cash Flows provided by Operating Activities
Net Interest Expense
Adjusted Interest
FFO + Adjusted Interest
= Adjusted Interest
+ 6% interest on Present Value (PV) of Operating Leases
+ Interest on imputed debt related to PV of Purchased Power Agreements
(PPA)
+ AFUDC & Capitalized interest
-
PECO Transition Bond Interest Expense
FFO Interest Coverage
FFO
= Adjusted Debt
+ Off-balance sheet debt equivalents
(2)
-
PECO Transition Bond Principal Balance
+ STD
+ LTD
Debt:
Adjusted Debt
(3)
FFO Debt Coverage
Rating Agency Capitalization
Rating Agency Debt
Total Adjusted Capitalization
Adjusted Book Debt
= Total Rating Agency Capitalization
+ Off-balance sheet debt equivalents
(2)
Total Adjusted Capitalization
= Rating Agency Debt
+ Off-balance sheet debt equivalents
(2)
Adjusted Book Debt
= Total Adjusted Capitalization
+ Adjusted Book Debt
+ Preferred Securities of Subsidiaries
+ Total Shareholders' Equity
Capitalization:
= Adjusted Book Debt
-
Transition Bond Principal Balance
+ STD
+ LTD
Debt:
Debt to Total Cap
(1)
Reflects depreciation adjustment for PPAs and operating leases.
(2)
Metrics are calculated in presentation unadjusted and adjusted for debt equivalents for PV of
Operating Leases, PPAs, unfunded Pension and OPEB obli gations (after-tax), Capital
Adequacy for Energy Trading, and other minor debt equivalents. (3)
Uses current year-end adjusted debt balance.
|
 20
1Q GAAP EPS Reconciliation
NOTE: All amounts shown are per Exelon share and represent contributions to
Exelon's EPS. (0.05)
-
-
-
(0.05)
Unrealized losses related to nuclear decommissioning trust funds
(0.01)
(0.01)
-
-
-
NRG acquisition costs
(0.03)
-
-
-
(0.03)
2007 Illinois electric rate settlement
0.17
-
-
-
0.17
Mark-to-market adjustments from economic hedging activities
(0.20)
-
-
-
(0.20)
Impairment of certain generating assets
$1.08
$(0.06)
$0.17
$0.17
$0.80
1Q09 GAAP Earnings (Loss) Per Share
$1.20
$(0.05)
$0.17
$0.17
$0.91
2009 Adjusted (non-GAAP) Operating Earnings (Loss) Per Share
Exelon
Other
PECO
ComEd
ExGen
Three Months Ended March 31, 2009
(0.01)
-
-
-
(0.01)
Retirement of fossil generating units
0.03
-
-
-
0.03
Unrealized gains related to nuclear decommissioning trust funds
0.21
-
-
-
0.21
Mark-to-market adjustments from economic hedging activities
(0.10)
(0.02)
(0.02)
(0.02)
(0.04)
Non-cash charge resulting from healthcare legislation
$1.13
$(0.04)
$0.15
$0.17
$0.85
1Q10 GAAP Earnings (Loss) Per Share
$1.00
$(0.02)
$0.17
$0.19
$0.66
2010 Adjusted (non-GAAP) Operating Earnings (Loss) Per Share
Exelon
Other
PECO
ComEd
ExGen
Three Months Ended March 31, 2010 |
 21
Retiring Cromby Station and
Eddystone Units 1&2
•
Cromby Station
–
Placed in service in 1954-55
–
144 MW coal and 201 MW oil/gas
•
Eddystone Station Units 1&2
–
Placed in service in 1960
–
588 MW of coal capacity at units 1&2
–
Units 3&4 (760 MW oil/gas) and 4 peaking units
(60 MW) will continue to operate
•
Retirements yield ~$165-200 million incremental NPV vs. continuing to operate
the units –
Avoids ongoing operating and capital costs on aging units
–
Cromby and Eddystone have not cleared in the past two RPM capacity auctions
(2011/12 and 2012/13) –
Anticipates more stringent environmental regulations and avoids related capital
investment •
Agreed to delay deactivation of two units to maintain reliability, provided receipt
of required environmental permits and adequate cost-based compensation
–
Maintaining scheduled retirement date of 5/31/11 for Cromby
1
and Eddystone
1; delaying Cromby
2
to 5/31/12 and Eddystone
2 to 12/31/13
–
Pursuing
RMR
to
compensate
for
cost
of
maintaining
and
operating
units
beyond
5/31/11
$80
$85
$40
Capital Expenditure
Reduction
$40
$18
$24
Incremental Pre-Tax
Operating Income
45
22
0
Depreciation Savings
75
46
24
Operating O&M Savings
$(80)
$(50)
$0
Revenue Net Fuel
2012
2011
2010
($ in millions)
Smaller, less efficient coal plants are challenged by economic and
environmental considerations
Ongoing Savings Impact
Note: RMR = reliability must-run agreement |
 22
Illinois Power Agency (IPA) RFP
Procurement
•
On December 28, 2009, the Illinois
Commerce Commission approved the
IPA’s Updated Procurement Plan for the
2010/11 planning period, which includes
the procurement of:
–
Monthly peak and off-peak standard
wholesale block energy products
–
1,887,014 MWh of Renewable
Energy Credits (RECs)
–
1,400,000 MWh/year of renewable
energy and associated RECs
through 20-year contracts beginning
delivery in June 2012
Delivery
Period
Peak
Off-Peak
June 2010 -
May 2011
5,528
4,344
June 2011 -
May 2012
1,980
549
Volume to be procured in the 2010
IPA Procurement Event (GWh)
Note: Chart is for illustrative purposes only. Data on this slide is
rounded. 2009 RFP
2009 RFP
2010 RFP
2010 RFP
2011 RFP
2011 RFP
2011 RFP
2012 RFP
2012 RFP
2013 RFP
Financial
Swap
Auction
Contract
Jun 2009
Jun 2010
Jun 2011
Jun 2012
Jun 2013
Jun 2014
By May 26
By May 5
ComEd files retail generation rates
By May 24
By May 3
ICC decision on RFP results and public
release of wholesale energy prices
By May 19
By April 29
Procurement administrator submits
confidential report
May 18
April 28
Bids due
April 7 –
20
April 7 –
13
Potential bidders submit qualifying
proposals
RECs
(1)
Standard
Product
Event
2010 RFP –
Key Dates
(1) Timeline and procurement administrator for long-term PPAs has not yet been
determined by the IPA. |
 23
ComEd Customer Usage Breakdown
Customer Usage by Revenue Class
Top 380 Customer Usage by Segment
3%
Leisure & Hospitality
9%
Trade, Transportation & Utilities
11%
Finance, Professional &
Business Services
12%
Health & Educational Services
13%
Government
52%
Manufacturing
Limited survey of select Large C&I customers has indicated an increase in
production via longer production runs and additional shifts due to improved
economic conditions for customers in the steel, automotive, and plastic
industries Residential
31%
Small C&I
36%
380 Large
C&I
18%
Other Large
C&I
13%
Other
2% |
 24
PECO Procurement Results
Next
RFP
to
be
held
on
May
24,
2010,
with
results
public
30
days
thereafter
Residential
Sept ’09 RFP average price of
$79.96/MWh
(2)
June ’09 RFP average price of
$88.61/MWh
(2)
49% of full requirements product
procured
80 MW of block energy procured
Small and Medium Commercial
Sept ’09 RFP average blended
price of $85.85/MWh
(2)
24% of Small Commercial full
requirements product procured
16% of Medium Commercial full
requirements product procured
85% full requirements
15% full requirements spot
Medium Commercial
(peak demand >100 kW
but <= 500 kW)
Fixed-Priced Full
requirements
(3)
Hourly Full requirements
Large Commercial &
Industrial
(peak
demand
>500 kW)
90% full requirements
10% full requirements spot
75% full requirements
20% block energy
5% energy only spot
Products
Small Commercial
(peak demand <100 kW)
Residential
Customer Class
PECO
Procurement
Plan
(1)
2011 Supply procured to
date (including June and
September 2009 RFPs)
Large Commercial and Industrial
100% of planned Fixed -
price
full requirements contracts (12-mo
term)
Residential
23% of planned full requirements
contracts (17 and 29-mo terms)
140 MW of baseload (24x7)
block energy products (12, 24
and 60-mo duration)
40 MW of Jan-Feb 2011 on-peak
block energy
Small Commercial
36% of planned full requirements
contracts (17 and 29-mo term)
Medium Commercial
42% of planned full requirements
contracts (17-mo term)
May 24, 2010 RFP
(1)
See PECO Procurement website (http://www.pecoprocurement.com) for additional details regarding
PECO’s procurement plan and RFP results. (2)
Wholesale prices; no Small/Medium Commercial products were procured in the June RFP.
(3)
For Large C&I customers who have opted to participate in the Fixed-priced Full requirements
product. |
 25
PECO –
Timeline for Rate Cases
•
Filed: March 31, 2010
•
Opposing Parties’
Testimony: June 2010
•
Rebuttal Testimony: July 2010
•
Hearings: August 2010
•
Administrative Law Judge (ALJ) Orders: October 2010
•
Final Orders Expected: December 2010
•
New Rates Effective: January 1, 2011
Note:
Dates
are
based
on
typical
approach
to
rate
cases
but
the
Pennsylvania
Public
Utility
Commission
(PAPUC)
will
set
the actual schedule. Expect schedule to be set at pre-hearing with ALJ
around mid-May. |
 26
5.03
6.26
6.23
0.51
0.70
2.57
9.01
PECO Electric Residential Rate
Increases 2010 to 2011
January 1, 2011
January 1, 2010
Total = 14.7¢
Unit Rates (¢/kWh)
Proposed Total Bill
Increase ~11 %
Total = 16.3¢
AEPS
~0.6%
Default Service Surcharge
Mechanism based on results of
first two procurements ~1.2%
Transmission
surcharge
mechanism
~1.3% Energy /
Capacity Competitive Transition
Charge
Transmission
Distribution
Distribution rate case ~8.2%
0.38
Energy Efficiency
Surcharge
Breakdown of 2010 to 2011
~11% Increase (On Total Bill)
Notes:
•
Rates effective January 1, 2010 include Act 129 Energy Efficiency surcharge of 2%.
•
Act 129 Smart Meter surcharge will be calculated following approval of PECO’s
Smart Meter Plan expected in 2Q10. The Smart Meter surcharge,
which
will
likely
be
effective
3Q10,
is
expected
to
be
less
than
1%
and
is
not
expected
to
increase
until
2Q/3Q
of
2011.
As
a
result,
the
Smart
Meter surcharge will have a minimal impact on rate increases effective January 1,
2011. •
Low income discounted rates were subsidized in the PPA in 2010 and will be
recovered through distribution rates in 2011. 0.29
|
 27
PECO Customer Usage Breakdown
Other
3%
Other Large
C&I
24%
150 Large
C&I
17%
Small C&I
22%
Residential
34%
Customer Usage by Revenue Class
Top 150 Customer Usage by Segment
7%
Other
13%
Transportation, Communication &
Utilities
18%
Health & Educational Services
18%
Manufacturing
22%
Petroleum
2%
Retail Trade
9%
Finance, Insurance & Real Estate
12%
Pharmaceuticals
PECO’s load is relatively diversified by customer class and industry;
a slow recovery in the second half of 2010 is expected
|
 28
ComEd and PECO Accounts Receivable
ComEd Accounts
Receivable
(1)
Both ComEd and PECO continue to see an improvement in accounts receivable
aging 1Q08
1Q09
1Q10
PECO Accounts
Receivable
(1)
% of AR
$846M
$831M
$764M
(1) Accounts receivable amounts include unbilled receivables and are
gross of allowance for uncollectible accounts at ComEd and PECO and include, for PECO, pledged and
long-term receivables.
>60 days
31-60 days
0-30 days
Note: Data contained on this slide is rounded.
1Q08
1Q09
1Q10
$723M
$730M
$821M |
 29
2010 Earnings Outlook
Exelon’s 2010 adjusted (non-GAAP) operating earnings outlook
excludes the earnings effects of the following:
•
Mark-to-market adjustments from economic hedging activities
•
Unrealized gains and losses from nuclear decommissioning trust fund investments to
the extent not offset by contractual accounting as described in the notes
to the consolidated financial statements •
Significant impairments of assets, including goodwill
•
Changes in decommissioning obligation estimates
•
Costs
associated
with
the
2007
Illinois
electric
rate
settlement
agreement
•
Costs associated with ComEd’s 2007 settlement with the City of Chicago
•
Costs associated with the retirement of fossil generating units
•
Non-cash charge resulting from passage of Federal health care
legislation •
Other unusual
items
•
Significant future changes to GAAP
Operating
earnings
guidance
assumes
normal
weather
for
remainder of the year
Operating
O&M
target
excludes
the
following
items:
•
Exelon Generation: Decommissioning accretion expense
•
ComEd: Impact of riders, primarily Rider EDA (Energy Efficiency and Demand
Response Adjustment)
•
PECO: Impact of energy efficiency and smart grid/meter riders
|
 30
30
30
Important Information
The following slides are intended to provide additional information regarding the
hedging program at Exelon Generation and to serve as an aid for the purposes
of modeling Exelon Generation’s
gross
margin
(operating
revenues
less
purchased
power
and
fuel
expense).
The
information
on
the
following
slides
is
not
intended
to
represent
earnings
guidance
or
a
forecast
of
future
events.
In
fact,
many
of
the
factors
that
ultimately
will
determine
Exelon
Generation’s actual gross margin are based upon highly variable market factors
outside of our control.
The
information
on
the
following
slides
is
as
of
March
31,
2010.
Going
forward, we
plan to update the information on a quarterly basis.
Certain information on the following slides is based upon an internal simulation
model that incorporates assumptions regarding future market conditions,
including power and commodity prices, heat rates, and demand conditions, in
addition to operating performance and dispatch characteristics of our
generating fleet. Our simulation model and the assumptions therein are
subject to change. For example, actual market conditions and the dispatch
profile of our generation
fleet
in
future
periods
will
likely
differ
–
and
may
differ
significantly
–
from
the
assumptions underlying the simulation results included in the slides. In
addition, the forward- looking
information
included
in
the
following
slides
will
likely
change
over
time
due
to
continued refinement of our simulation model and changes in our views on future
market conditions. |
 31
31
31
Portfolio Management Objective
Align Hedging Activities with Financial Commitments
•
Power Team utilizes several product
types and channels to market
•
Wholesale and retail sales
•
Block products
•
Load-following products
and load auctions
•
Put/call options
•
Exelon’s hedging program is designed to
protect the long-term value of our
generating fleet and maintain an
investment-grade balance sheet
•
Hedge enough commodity risk to meet future cash
requirements if prices drop
•
Consider: financing policy (credit rating objectives,
capital structure, liquidity); spending (capital and
O&M); shareholder value return policy
•
Consider market, credit, operational risk
•
Approach to managing volatility
•
Increase hedging as delivery approaches
•
Have enough supply to meet peak load
•
Purchase fossil fuels as power is sold
•
Choose hedging products based on generation
portfolio –
sell what we own
•
Heat rate options
•
Fuel products
•
Capacity
•
Renewable credits
% Hedged
High End of Profit
Low End of Profit
Open Generation
with LT Contracts
Portfolio
Optimization
Portfolio
Management
Portfolio Management Over Time |
 32
32
32
32
Percentage of Expected
Generation Hedged
•
How many equivalent MW have been
hedged at forward market prices; all hedge
products used are converted to an
equivalent average MW volume
•
Takes ALL
hedges into account whether
they are power sales or financial products
Equivalent MWs Sold
Expected Generation
=
•
Our normal practice is to hedge commodity risk on a ratable basis
over the three years leading to the spot market
•
Carry operational length into spot market to manage forced outage and
load-following risks
•
By
using
the
appropriate
product
mix,
expected
generation
hedged
approaches
the
mid-90s percentile as the delivery period approaches
•
Participation in larger procurement events, such as utility auctions, and some
flexibility in the timing of hedging may mean the hedge program is not
strictly ratable from quarter to quarter
Exelon Generation Hedging Program |
 33
33
33
33
2010
2011
2012
Estimated Open Gross Margin ($ millions)
(1,2)
$5,050
$4,900
$4,750
Open gross margin assumes all expected generation is
sold at the Reference Prices listed below
Reference Prices
(1)
Henry Hub Natural Gas ($/MMBtu)
NI-Hub ATC Energy Price ($/MWh)
PJM-W ATC Energy Price ($/MWh)
ERCOT North ATC Spark Spread ($/MWh)
(3)
$4.48
$29.73
$39.69
$0.43
$5.34
$30.71
$42.04
$(0.42)
$5.79
$32.19
$43.47
$0.14
Exelon Generation Open Gross Margin and
Reference Prices
(1)
Based on March 31, 2010 market conditions.
(2)
Gross margin is defined as operating revenues less fuel expense and purchased power expense, excluding
the impact of decommissioning and other incidental revenues. Open gross margin is estimated
based upon an internal model that is developed by dispatching our expected generation to current market power and fossil fuel prices. Open
gross margin assumes there is no hedging in place other than fixed assumptions for capacity cleared in
the RPM auctions and uranium costs for nuclear power plants. Open gross margin contains
assumptions for other gross margin line items such as various ISO bill and ancillary revenues and costs and PPA capacity revenues and payments.
The estimation of open gross margin incorporates management discretion and modeling assumptions that
are subject to change. (3)
ERCOT North ATC spark spread using Houston Ship Channel Gas, 7,200 heat rate, $2.50 variable O&M.
|
 34
34
34
34
2010
2011
2012
Expected Generation
(GWh)
(1)
164,600
161,700
161,200
Midwest
98,600
98,100
97,000
Mid-Atlantic
58,000
56,600
56,600
South
8,000
7,000
7,600
Percentage of Expected Generation Hedged
(2)
95-98%
79-82%
48-51%
Midwest
92-95
79-82
52-55
Mid-Atlantic
96-99
81-84
44-47
South
97-100
68-71
41-44
Effective Realized Energy Price
($/MWh)
(3)
Midwest
$46.50
$44.50
$44.50
Mid-Atlantic
$36.00
$58.00
$51.50
ERCOT North ATC Spark Spread
$0.50
$0.50
$(6.50)
Generation Profile
(1)
Expected generation represents the amount of energy estimated to be generated or purchased through
owned or contracted for capacity. Expected generation is based upon a simulated dispatch
model that makes assumptions regarding future market conditions, which are calibrated to market quotes for power, fuel, load following products, and
options. Expected generation assumes 10 refueling outages in 2010 and 11 refueling outages in
2011 and 2012 at Exelon-operated nuclear plants and Salem. Expected generation
assumes capacity factors of 93.5%, 92.8% and 92.8% in 2010, 2011 and 2012 at Exelon-operated nuclear plants. These estimates of expected generation in 2011
and 2012 do not represent guidance or a forecast of future results as Exelon has not completed its
planning or optimization processes for those years. (2)
Percent of expected generation hedged is the amount of equivalent sales divided by the expected
generation. Includes all hedging products, such as wholesale and retail sales of power,
options, and swaps. Uses expected value on options. Reflects decision to permanently retire Cromby Station and Eddystone Units 1&2 as of May 31, 2011.
(3)
Effective realized energy price is representative of an all-in hedged price, on a per MWh basis,
at which expected generation has been hedged. It is developed by considering the energy
revenues and costs associated with our hedges and by considering the fossil fuel that has been purchased to lock in margin. It excludes uranium costs
and RPM capacity revenue, but includes the mark-to-market value of capacity contracted at
prices other than RPM clearing prices including our load obligations. It can be compared
with the reference prices used to calculate open gross margin in order to determine the mark-to-market value of Exelon Generation's energy hedges. |
 35
35
35
35
Gross Margin Sensitivities with Existing Hedges ($ millions)
(1)
Henry Hub Natural Gas
+ $1/MMBtu
-
$1/MMBtu
NI-Hub ATC Energy Price
+$5/MWH
-$5/MWH
PJM-W ATC Energy Price
+$5/MWH
-$5/MWH
Nuclear Capacity Factor
+1% / -1%
2010
$40
$(20)
$20
$(15)
$5
$ -
+/-
$30
2011
$125
$(110)
$125
$(115)
$75
$(70)
+/-
$40
2012
$320
$(315)
$235
$(225)
$175
$(170)
+/-
$45
Exelon Generation Gross Margin Sensitivities
(with Existing Hedges)
(1)
Based on March 31, 2010 market conditions and hedged position. Gas price sensitivities are based on an
assumed gas-power relationship derived from an internal model that is updated
periodically. Power prices sensitivities are derived by adjusting the power price assumption while keeping all other prices inputs constant. Due
to correlation of the various assumptions, the hedged gross margin impact calculated by aggregating
individual sensitivities may not be equal to the hedged gross margin impact calculated when
correlations between the various assumptions are also considered. |
 36
36
36
36
95% case
5% case
$6,500
$6,200
$4,800
$7,200
$6,300
$6,600
Exelon Generation Gross Margin Upside / Risk
(with Existing Hedges)
$3,000
$4,000
$5,000
$6,000
$7,000
$8,000
$9,000
2010
2011
2012
(1)
Represents an approximate range of expected gross margin, taking into account hedges in place, between
the 5th and 95th percent confidence levels assuming all unhedged supply is sold into the spot
market. Approximate gross margin ranges are based upon an internal simulation model and are subject to change based upon market inputs,
future transactions and potential modeling changes. These ranges of approximate gross margin in 2011
and 2012 do not represent earnings guidance or a forecast of future results as Exelon has not
completed its planning or optimization processes for those years. The price distributions that generate this range are calibrated to market quotes for
power, fuel, load following products, and options as of March 31, 2010.
|
 37
37
37
37
Midwest
Mid-Atlantic
ERCOT
Step 1
Start
with
fleetwide
open
gross
margin
$5.05 billion
Step 2
Determine the mark-to-market value
of energy hedges
98,600GWh * 93% *
($46.50/MWh-$29.73/MWh)
= $1.54 billion
58,000GWh * 97% *
($36.00/MWh-$39.69/MWh)
= $(0.21 billion)
8,000GWh * 98% *
($0.50/MWh-$0.43/MWh)
= $0.00 billion
Step 3
Estimate
hedged
gross
margin
by
adding open gross margin to mark-to-
market value of energy hedges
Open gross
margin: $5.05 billion
MTM value of energy
hedges: $1.54
billion
+
$(0.21
billion)
+
$0.00
billion
Estimated hedged gross margin:
$6.38 billion
Illustrative Example
of Modeling Exelon Generation 2010 Gross Margin
(with Existing Hedges) |
 38
38
38
38
38
38
50
55
60
65
70
75
80
85
90
4/09
5/09
6/09
7/09
8/09
9/09
10/09
11/09
12/09
1/10
2/10
3/10
20
25
30
35
40
45
50
55
4/09
5/09
6/09
7/09
8/09
9/09
10/09
11/09
12/09
1/10
2/10
3/10
35
40
45
50
55
60
65
70
75
80
85
4/09
5/09
6/09
7/09
8/09
9/09
10/09
11/09
12/09
1/10
2/10
3/10
5
5.5
6
6.5
7
7.5
8
8.5
9
4/09
5/09
6/09
7/09
8/09
9/09
10/09
11/09
12/09
1/10
2/10
3/10
38
Market Price Snapshot
Forward NYMEX Natural Gas
PJM-West and Ni-Hub On-Peak Forward Prices
PJM-West and Ni-Hub Wrap Forward Prices
2011
$5.31
2012 $5.75
Rolling 12 months, as of April 15, 2010. Source: OTC quotes and electronic trading
system. Quotes are daily. Forward NYMEX Coal
2011
$66.00
2012
$75.15
2011 Ni-Hub $38.34
2012 Ni-Hub
$40.07
2012 PJM-West $51.68
2011 PJM-West
$50.21
2011 Ni-Hub
$23.49
2012 Ni-Hub
$24.74
2012 PJM-West
$36.97
2011 PJM-West
$36.26 |
 39
39
39
39
39
39
5.5
6.5
7.5
8.5
9.5
10.5
11.5
12.5
13.5
4/09
5/09
6/09
7/09
8/09
9/09
10/09
11/09
12/09
1/10
2/10
3/10
8
8.2
8.4
8.6
8.8
9
9.2
9.4
9.6
9.8
10
4/09
5/09
6/09
7/09
8/09
9/09
10/09
11/09
12/09
1/10
2/10
3/10
40
45
50
55
60
65
70
75
80
4/09
5/09
6/09
7/09
8/09
9/09
10/09
11/09
12/09
1/10
2/10
3/10
5
5.5
6
6.5
7
7.5
8
8.5
9
4/09
5/09
6/09
7/09
8/09
9/09
10/09
11/09
12/09
1/10
2/10
3/10
39
Market Price Snapshot
2012
$9.03
2011
$8.86
2011
$46.41
2012
$51.22
2011
$5.24
2012
$5.67
Houston Ship Channel Natural Gas
Forward Prices
ERCOT North On-Peak Forward Prices
ERCOT North On-Peak v. Houston Ship Channel
Implied Heat Rate
2011
$6.09
2012
$7.79
ERCOT North On Peak Spark Spread
Assumes a 7.2 Heat Rate, $1.50 O&M, and $.15 adder
Rolling 12 months, as of April 15, 2010. Source: OTC quotes and electronic trading
system. Quotes are daily. |