Attached files
 2010
First-Quarter Earnings Results
April 22, 2010
Exhibit 99.3 |
 2
Introduction
Unless otherwise stated, we will be talking about results in the
first quarter 2010 and comparing them with the same period in
2009
References to PMI volumes refer to shipment data
Industry volume and market shares are the latest data
available from a number of internal and external sources
Organic volume refers to volume excluding acquisitions
Net revenues exclude excise taxes
Data tables showing adjustments to net revenues and
Operating Companies Income (OCI) for currency, acquisitions,
asset impairment and exit costs, adjustments to EPS, and
reconciliations to U.S. GAAP measures are at the end of
today’s web cast slides and are posted on our web site
|
 3
Forward-Looking and Cautionary Statements
This presentation and related discussion contain statements that, to the
extent they do not relate strictly to historical or current facts, constitute
“forward-looking statements”
within the meaning of the Private Securities
Litigation Reform Act of 1995. Such forward-looking statements are
based on current plans, estimates and expectations, and are not
guarantees of future performance. They are based on management’s
expectations that involve a number of business risks and uncertainties,
any of which could cause actual results to differ materially from those
expressed in or implied by the forward-looking statements. PMI
undertakes no obligation to publicly update or revise any forward-looking
statements, except in the normal course of its public disclosure
obligations. The risks and uncertainties relating to the forward-looking
statements in this presentation include those described under Item 1A.
“Risk Factors”
in PMI’s Form 10-K for the year ended December 31,
2009, filed with the Securities and Exchange Commission.
|
 4
PMI Results
Strong financial performance in Q1, 2010
In line with or above all our constant currency mid to long-
term annual growth targets:
Growth
Targets
(c)
Q1,
2010
Results
(c)
Net Revenues
4 –
6%
+ 6.1%
Adjusted
OCI
(a)
6 –
8%
+ 8.6%
Adjusted
Diluted
EPS
(b)
10 –
12%
+13.5%
(a)
OCI stands for Operating Companies Income, which is defined as operating income
before general corporate expenses and the amortization of intangibles. Q1,
2010, OCI growth rate is on an adjusted basis which excludes asset impairment and exit costs
(b)
Adjusted diluted earnings per share
(c)
All financial growth rates exclude currency. Net revenues and OCI growth rates also
exclude acquisitions Source: PMI Financials. See reconciliations to
U.S. GAAP measures at the end of this presentation |
 5
PMI Results
Source: PMI Financials
204.7
Q1, 2010 Results
(units billions)
(2.3)%
0.7%
Cigarette Volume
Excl. Acquisitions
Actual
% Growth
Q1, 2010 vs. Q1, 2009 |
 6
Business Outlook
Economic environment
Adult consumer behavior
Excise taxation
Competitiveness |
 7
Economic Environment
Emerging markets in Asia continue to grow
Improved outlook in Latin America
Some signs of stabilization in Eastern Europe
Economic conditions in EU remain difficult |
 8
Adult Consumer Behavior
Growing premium volume in several emerging markets,
such as Algeria, Argentina, Indonesia and Mexico
Consumer downtrading moderating in Russia
Price sensitivity remains high in EU markets
Improvement in employment levels key to global
resumption in consumer uptrading
Illicit trade attracting price sensitive consumers |
 9
Excise Taxation
Most governments are continuing to pursue a policy of
reasonable increases
Excise tax structures are globally improving |
 10
New EU Excise Tax Directive
Premised on gradual tax increases
Three important structural improvements:
-
Increase in maximum specific-to-total ratio from 55% to 76.5%
-
Gradual reduction in gap between tax rates on fine cut and
cigarettes
-
Elimination of previous 100% of MPPC cap on Minimum Excise
Tax
Visibility through 2018
Source: European Union Commission |
 11
Excise Taxation
Most governments are continuing to pursue a policy of
reasonable increases
Excise tax structures are globally improving
Large disruptive excise tax increases in January 2010 in
Romania and Turkey:
-
Double-digit industry volume declines
-
Significant increase in illicit trade in both markets
Source: PMI Financials |
 12
Excise Taxation
Most governments are continuing to pursue a policy of
reasonable increases
Excise tax structures are globally improving
Large disruptive excise tax increases in January 2010 in
Romania and Turkey
Greek Government decreased the Minimum Excise Tax,
at the same time as it increased the ad-valorem excise
tax rate:
-
Consumer downtrading expected as price gaps widen
-
Main impact starting in the second quarter
Consequently, government revenue targets may not be
met and we hope a more appropriate approach will be
taken going forward
Source: PMI Financials |
 13
Excise Taxation
Most governments are continuing to pursue a policy of
reasonable increases
Excise tax structures are globally improving
Large disruptive excise tax increases in January 2010 in
Romania and Turkey
Greek Government decreased the Minimum Excise Tax,
at the same time as they increased the ad-valorem excise
tax rate
70 Yen / pack excise tax increase in Japan to take place
in October 2010:
-
Impact on industry volume very difficult to predict
-
PMI obtained approval to increase prices by 20 Yen / pack this
June but has decided not to implement this price move
Source: Government of Japan |
 14
PMI Competitiveness
PMI continues to grow share across wide range of
developed and emerging markets
Markets where PMI’s smoker share among Legal Age
(min. 18) –
24 year olds is at least 5 share points higher
than among Legal Age (min. 18) –
64 year olds include:
-
OECD: Austria, Belgium, France, Hungary, Japan, Korea,
Netherlands, Poland, Portugal, Slovakia, Spain
-
Non-OECD: Argentina, Brazil, Egypt, Lebanon, Qatar, Slovenia,
Ukraine
Source:
A.C.
Nielsen,
PMI
Estimates
and
PMI
Market
Research
–
Consumer
and
Segment
Tracking
(CAST) |
 15
Marlboro
Volume
Strong performance in Q1, 2010, with total volume down
just 0.6% and up 1.4% excluding Romania and Turkey
Asia: volume up 7.4%
Latin America & Canada: volume up 1.5%
Source: PMI Financials |
 16
Marlboro
Volume
Strong performance in Q1, 2010, with total volume down
just 0.6% and up 1.4% excluding Romania and Turkey
Asia: volume up 7.4%
Latin America & Canada: volume up 1.5%
EEMA: volume down 1.2%, in spite of strong performance
in North Africa and improved duty-free sales
EU: volume down 6.2%, due to consumer downtrading in
Germany and Spain and overall industry volume decline
Non-EU markets account for over 60% of global Marlboro
volume
Source: PMI Financials |
 17
Marlboro
Innovation
Roll-out of new architecture
Innovative line extensions:
-
Marlboro Filter Plus
(2.8% share in Kuwait)
-
Marlboro Gold Touch
(1.4% share in Italy)
-
Marlboro Black Menthol
(1.3% share in Japan)
Incremental volume and
reinforcement of equity of
the overall Marlboro
franchise
Note: All market share data refers to first quarter to date, 2010
Source: A.C. Nielsen, PMI estimates and Tobacco Institute of Japan
|
 18
Superior Brand Portfolio
Mid-Price
Premium &
Above
Local Heritage
International
Low-Price |
 19
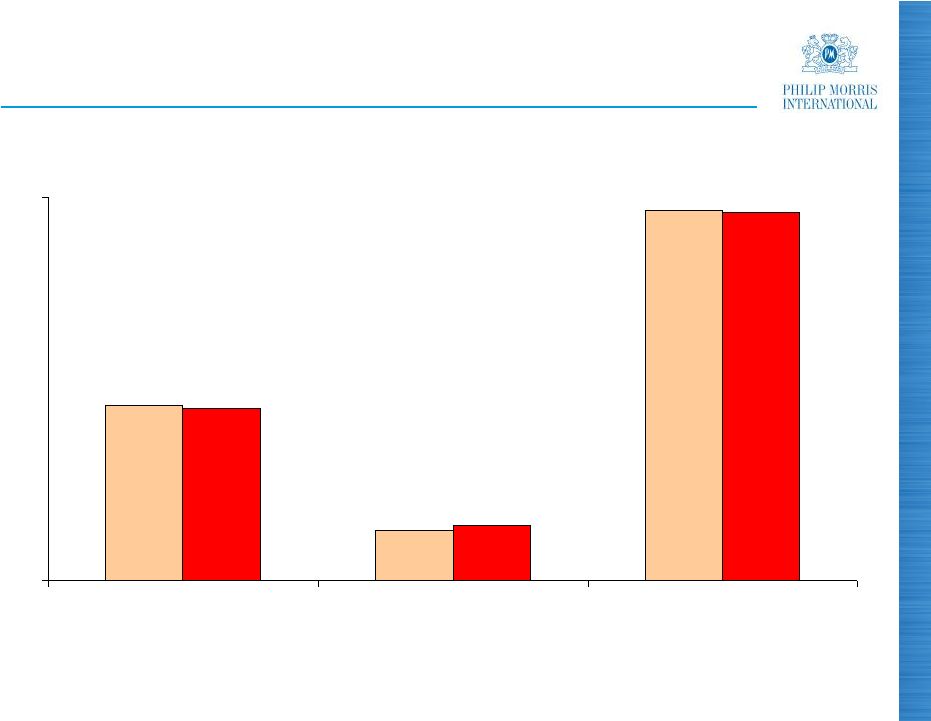
18.3
5.2
38.6
18.0
5.7
38.4
0
40
Total PMI
PMI Market Share Developments: EU Region
Source: PMI Estimates
(%) |
 20
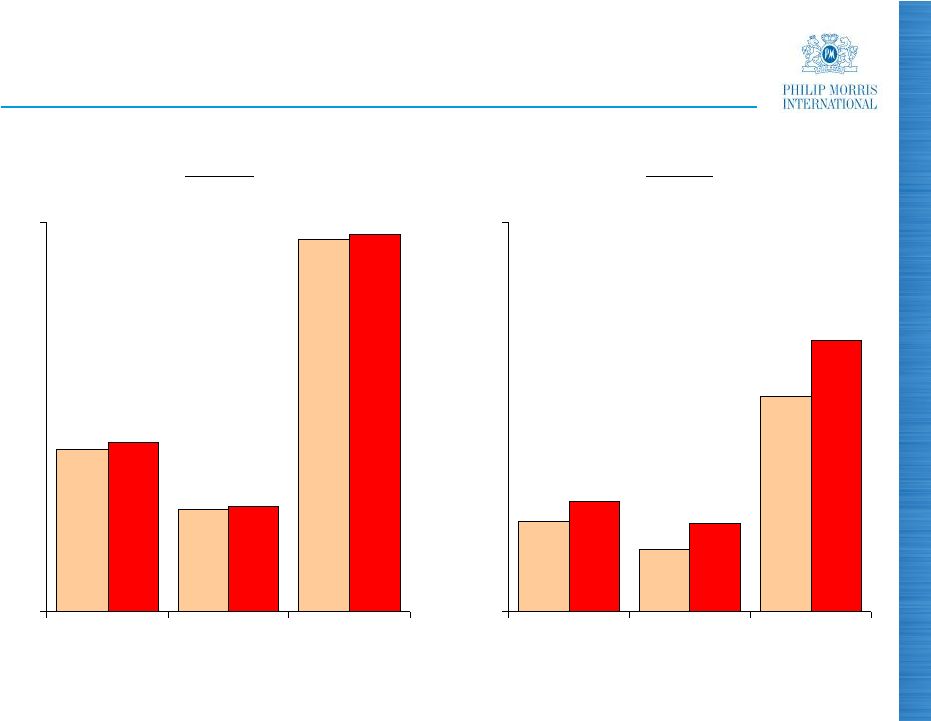
5.8
4.0
13.8
7.0
5.7
17.4
0
25
Total PMI
10.4
6.5
23.9
10.8
6.7
24.2
0
25
Total PMI
PMI Market Share Developments: Asia Region
Source:
Tobacco
Institute
of
Japan
and
Hankook
Research
(%)
(%)
Japan
Korea |
 21
PMI Market Share Developments: Russia
PMI share up 0.5pp to 25.6% in Q1, 2010
Bond
Street
key
driver
of
PMI
share
gains
and
fastest-
growing brand on the market
Parliament
in
above
premium
segment
is
stable
Chesterfield
in mid-price segment is gaining share
Source: A.C. Nielsen |
 22
PMI Share Developments: Emerging Markets
(0.1)
29.0
Indonesia
(a)
0.9
74.5
Argentina
N.A.
c.90 (March)
Philippines
0.4
69.6
Mexico
(1.5)
40.9
Turkey
0.4pp
36.2
Ukraine
Variance
Q1, 2010
vs. Q1, 2009
Q1, 2010
Market Shares
a)
Latest available data for the quarter through end February
Source: A.C. Nielsen and PMI estimates |
 23
Pricing
In last six months, PMI has implemented price increases
notably in:
Pricing variance was $449 million in Q1, 2010
Argentina
Canada
Dominican Rep.
Mexico
Australia
Indonesia
Malaysia
Pakistan
Romania
Russia
Saudi Arabia
Turkey
Ukraine
France
Greece
Italy
Poland
Spain
UK
LA & Canada
Asia
EEMA
EU
Source: PMI Financials |
 24
PMI Results
Source: PMI Financials. See reconciliations to U.S. GAAP measures at the end of
this presentation 6.5
Q1, 2010 Results
($ billions)
6.1%
16.1%
Net Revenues
Excl. Currency
and Acquisitions
Actual
% Growth
Q1, 2010 vs. Q1, 2009 |
 25
PMI Results
(a)
Excludes asset impairment and exit costs
Source: PMI Financials. See reconciliations to U.S. GAAP measures at the end of
this presentation 2.8
6.5
Q1, 2010 Results
($ billions)
8.6 %
17.0%
Adjusted OCI
(a)
6.1%
16.1%
Net Revenues
Excl. Currency
and Acquisitions
Actual
% Growth
Q1, 2010 vs. Q1, 2009 |
 26
Adjusted OCI Margins
(a)
0.4
42.7
42.3
Total PMI
2.9
30.2
27.3
LA & Canada
(3.8)
37.8
41.6
Asia
4.6
45.0
40.4
EEMA
0.3pp
49.0%
48.7%
EU
Variance
Q1
2010
Q1
2009
(a)
Excluding currency impact
Note: Margins are calculated as adjusted OCI, divided by net revenues, excluding
excise taxes Source: PMI
Financials.
See
reconciliation
to
U.S.
GAAP
measures
at
the
end
of
this
presentation |
 27
Productivity and Costs
$200 million tobacco leaf cost increase forecast for 2010
Will be largely offset by productivity savings in
manufacturing
On track to realize $500 million of productivity and cost
savings in 2010 and $1.5 billion on a cumulative basis for
the period 2008-2010
Source: PMI Financials |
 28
PMI Results
0.90
Q1, 2010
Results ($)
13.5%
21.6%
Adjusted
Diluted
EPS
(a)
Excl. Currency
Actual
% Growth
Q1, 2010 vs. Q1, 2009
(a)
Excludes asset impairment and exit costs
Source: PMI Financials. See reconciliations to U.S. GAAP measures at the end of
this presentation |
 29
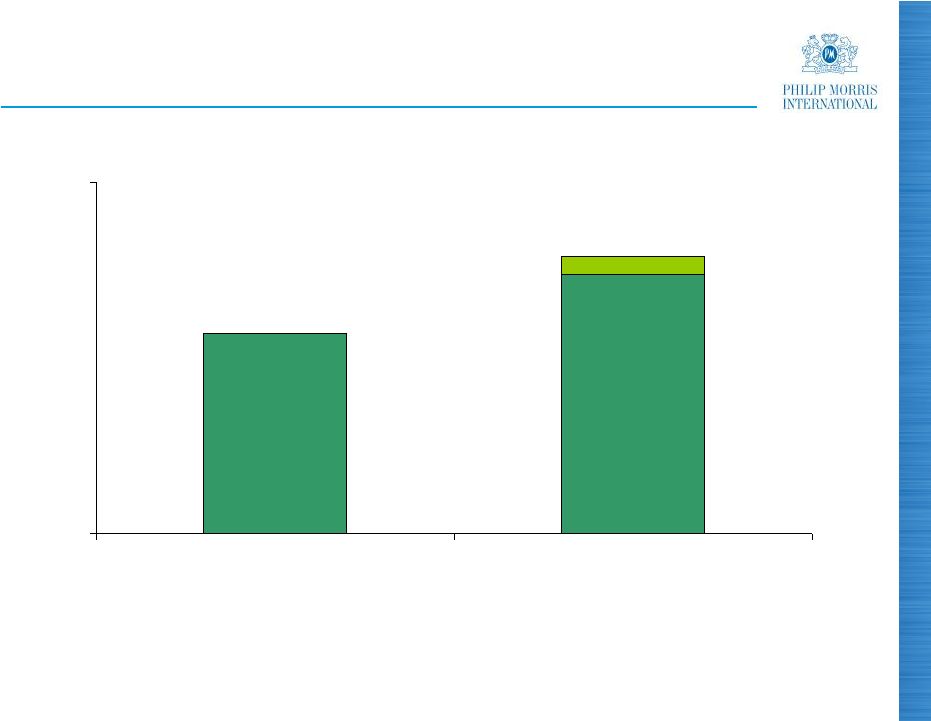
1,427
1,974
0
2,500
Q1
Q1
Source: PMI Financials. See reconciliations to U.S. GAAP measures at the end of
this presentation Operating Cash Flow
($ millions) |
 30
Operating Cash Flow
Increase in operating cash flow in Q1, 2010, driven mainly
by:
Higher net earnings
Stricter forestalling regulations
Working capital improvement program
Source: PMI Financials |
 31
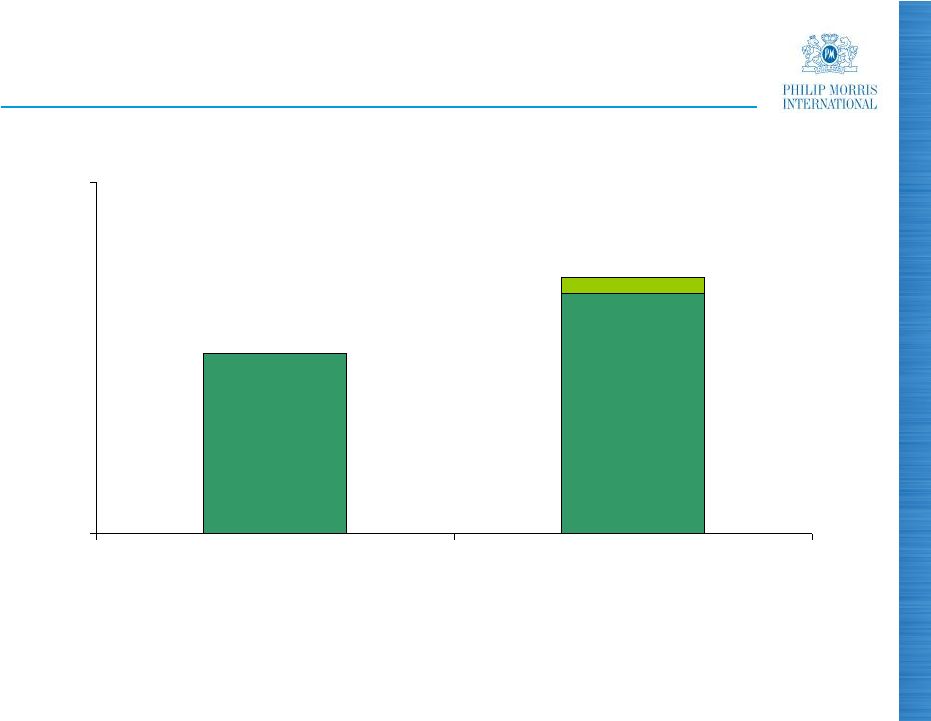
1,282
1,824
0
2,500
Q1
Q1
(a)
Free cash flow equals net cash provided by operating activities less capital
expenditures. Source: PMI Financials. See reconciliations to U.S. GAAP
measures at the end of this presentation Free Cash Flow
(a)
($ millions) |
 32
Corporate Financing
$1.0 billion 10 year bond with 4.5% coupon issued in
March 2010
$2.5 billion three-year bank revolver established to
replace two facilities maturing this year
Over $14 billion in well-laddered bonds in three currencies
issued since spin with attractive average cost of 5.5%
Total available and undrawn bank revolver credit is now
$5.2 billion
Continued strong A2 / A / A long-term credit ratings
Access to tier 1 commercial paper market
Source: PMI Financials |
 33
Shareholder Returns
$1.8 billion spent in Q1, 2010, to purchase 36.1 million
shares
$257 million remained on current share repurchase plan,
which will be completed by end April
New share repurchase program of $12 billion May 2010
through April 2013
Dividend yield on 19 April 2010 was an attractive 4.5%
Source: PMI Financials |
 34
Summary
Strong financial results
Pricing power remains intact
Superior brand portfolio
Innovation success
Market share gains
Tremendous cash flow
Some road bumps from excise taxation
Improved economic outlook
Good business momentum
Impact of Japan excise tax increase uncertain |
 35
2010 EPS Guidance
PMI is reaffirming its 2010 reported diluted EPS guidance
of $3.75 -
$3.85
Guidance represents a reported diluted EPS growth rate
of 16% to 19%
Exchange rates more favorable today than in February
More cautious stance being taken on Japan in light of
recent developments
On a constant currency basis, reported diluted EPS
guidance growth rate is 10% to 13% |
 Questions & Answers
2010 First-Quarter
Earnings Results |
 37
PHILIP MORRIS INTERNATIONAL INC. and Subsidiaries
Reconciliation of Non-GAAP Measures
Adjustments for Impact of Currency and Acquisitions
For the Quarters Ended March 31,
(in millions)
(Unaudited)
Reported Net
Revenues
Less
Excise
Taxes
Reported Net
Revenues
excluding
Excise Taxes
Less
Currency
Reported Net
Revenues
excluding Excise
Taxes &
Currency
Less
Acquisi-
tions
Reported Net
Revenues
excluding
Excise Taxes,
Currency &
Acquisitions
Reported
Net
Revenues
Less
Excise
Taxes
Reported Net
Revenues
excluding
Excise Taxes
Reported
Reported
excluding
Currency
Reported
excluding
Currency &
Acquisitions
6,748
$
4,564
$
2,184
$
178
$
2,006
$
3
$
2,003
$
European Union
6,050
$
4,063
$
1,987
$
9.9 %
1.0 %
0.8 %
3,356
1,610
1,746
52
1,694
26
1,668
EEMA
2,831
1,379
1,452
20.2 %
16.7 %
14.9 %
3,562
1,689
1,873
172
1,701
75
1,626
Asia
2,857
1,267
1,590
17.8 %
7.0 %
2.3 %
1,921
1,228
693
51
642
-
642
Latin America & Canada
1,548
980
568
22.0 %
13.0 %
13.0 %
15,587
$
9,091
$
6,496
$
453
$
6,043
$
104
$
5,939
$
PMI Total
13,286
$
7,689
$
5,597
$
16.1 %
8.0 %
6.1 %
Reported
Operating
Companies
Income
Less
Currency
Reported
Operating
Companies
Income
excluding
Currency
Less
Acquisi-
tions
Reported
Operating
Companies
Income
excluding
Currency &
Acquisitions
Reported
Operating
Companies
Income
Reported
Reported
excluding
Currency
Reported
excluding
Currency &
Acquisitions
1,062
$
80
$
982
$
2
$
980
$
European Union
967
$
9.8 %
1.6 %
1.3 %
770
8
762
9
753
EEMA
586
31.4 %
30.0 %
28.5 %
724
81
643
(5)
648
Asia
661
9.5 %
(2.7)%
(2.0)%
217
23
194
-
194
Latin America & Canada
155
40.0 %
25.2 %
25.2 %
2,773
$
192
$
2,581
$
6
$
2,575
$
PMI Total
2,369
$
17.1 %
8.9 %
8.7 %
2010
2009
% Change in Reported Operating
Companies Income
2010
2009
% Change in Reported Net
Revenues excluding Excise Taxes |
 38
PHILIP MORRIS INTERNATIONAL INC. and Subsidiaries
Reconciliation of Non-GAAP Measures
Reconciliation of Reported Operating Companies Income to Adjusted Operating
Companies Income & Reconciliation of Adjusted Operating Companies Income
Margin Excluding Currency and Acquisitions For the Quarters Ended March
31, (in millions)
(Unaudited)
(1) For the calculation of net revenues excluding excise taxes and currency, refer
to previous slide. Reported
Operating
Companies
Income
Less
Asset
Impairment
& Exit
Costs
Adjusted
Operating
Companies
Income
Less
Currency
Adjusted
Operating
Companies
Income
excluding
Currency
Less
Acquisi-
tions
Adjusted
Operating
Companies
Income
excluding
Currency &
Acquisitions
Reported
Operating
Companies
Income
Less
Asset
Impairment &
Exit Costs
Adjusted
Operating
Companies
Income
Adjusted
Adjusted
excluding
Currency
Adjusted
excluding
Currency &
Acquisitions
1,062
$
-
$
1,062
$
80
$
982
$
2
$
980
$
European Union
967
$
(1)
$
968
$
9.7 %
1.4 %
1.2 %
770
-
770
8
762
9
753
EEMA
586
-
586
31.4 %
30.0 %
28.5 %
724
-
724
81
643
(5)
648
Asia
661
-
661
9.5 %
(2.7)%
(2.0)%
217
-
217
23
194
-
194
Latin America & Canada
155
-
155
40.0 %
25.2 %
25.2 %
2,773
$
-
$
2,773
$
192
$
2,581
$
6
$
2,575
$
PMI Total
2,369
$
(1)
$
2,370
$
17.0 %
8.9 %
8.6 %
% Points Change
Adjusted
Operating
Companies
Income
excluding
Currency
Net
Revenues
excluding
Excise
Taxes &
Currency
(1)
Adjusted
Operating
Companies
Income Margin
excluding
Currency
Adjusted
Operating
Companies
Income
excluding
Currency &
Acquisitions
Net Revenues
excluding
Excise Taxes,
Currency &
Acquisitions
(1)
Adjusted
Operating
Companies
Income Margin
excluding
Currency &
Acquisitions
Adjusted
Operating
Companies
Income
Net Revenues
excluding
Excise
Taxes
(1)
Adjusted
Operating
Companies
Income
Margin
Adjusted
Operating
Companies
Income Margin
excluding
Currency
Adjusted
Operating
Companies
Income Margin
excluding
Currency &
Acquisitions
982
$
2,006
$
49.0 %
980
$
2,003
$
48.9 %
European Union
968
$
1,987
$
48.7 %
0.3
0.2
762
1,694
45.0 %
753
1,668
45.1 %
EEMA
586
1,452
40.4 %
4.6
4.7
643
1,701
37.8 %
648
1,626
39.9 %
Asia
661
1,590
41.6 %
(3.8)
(1.7)
194
642
30.2 %
194
642
30.2 %
Latin America & Canada
155
568
27.3 %
2.9
2.9
2,581
$
6,043
$
42.7 %
2,575
$
5,939
$
43.4 %
PMI Total
2,370
$
5,597
$
42.3 %
0.4
1.1
% Change in Adjusted Operating
Companies Income
2009
2010
2009
2010 |
 39
PHILIP MORRIS INTERNATIONAL INC. and Subsidiaries
Reconciliation of Non-GAAP Measures
Reconciliation of Reported Diluted EPS to Adjusted Diluted EPS and Adjusted
Diluted EPS, Excluding Currency For the Quarters Ended March 31,
(Unaudited)
2010
2009
% Change
Reported Diluted EPS
0.90
$
0.74
$
21.6%
Less:
Asset impairment and exit costs
-
-
Adjusted Diluted EPS
0.90
$
0.74
$
21.6%
Less:
Currency Impact
0.06
Adjusted Diluted EPS, Excluding Currency
0.84
$
0.74
$
13.5% |
 40
PHILIP MORRIS INTERNATIONAL INC. and Subsidiaries
Reconciliation of Non-GAAP Measures
Reconciliation
of
Operating
Cash
Flow
to
Free
Cash
Flow
and
Free
Cash
Flow,
excluding
Currency
Reconciliation of Operating Cash Flow to Operating Cash Flow, excluding
Currency For the Quarters Ended March 31,
(in millions)
(Unaudited)
(a) Operating Cash Flow
2010
2009
% Change
Net cash provided by operating activities
(a)
1,974
$
1,427
$
38.3 %
Less:
Capital expenditures
150
145
Free cash flow
1,824
$
1,282
$
42.3 %
Less:
Currency impact
116
Free cash flow, excluding currency
1,708
$
1,282
$
33.2 %
2010
2009
% Change
Net cash provided by operating activities
(a)
1,974
$
1,427
$
38.3 %
Less:
Currency impact
130
Net cash provided by operating activities, excluding currency
1,844
$
1,427
$
29.2 % |
 2010
First-Quarter Earnings Results April 22, 2010
|