Attached files
| file | filename |
|---|---|
| 8-K - POLARIS INDUSTRIES INC. 8-K - Polaris Inc. | a6258020.htm |
| EX-99.1 - EXHIBIT 99.1 - Polaris Inc. | a6258020ex99_1.htm |
Exhibit 99.2

0 Polaris Industries Inc. First Quarter 2010 Earnings Results April 21, 2010
1 Safe Harbor Except for historical information contained herein, the matters set forth in this document, including but not limited to management’s expectations regarding 2010 sales, shipments, net income and cash flow, are forward-looking statements that involve certain risks and uncertainties that could cause actual results to differ materially from those forward-looking statements. Potential risks and uncertainties include such factors as product offerings, promotional activities and pricing strategies by competitors; warranty expenses; foreign currency exchange rate fluctuations; effects of the KTM relationship; environmental and product safety regulatory activity; effects of weather; commodity costs; uninsured product liability claims; uncertainty in the retail and wholesale credit markets; changes in tax policy and overall economic conditions, including inflation, consumer confidence and spending and relationships with dealers and suppliers. Investors are also directed to consider other risks and uncertainties discussed in our 2009 annual report and Form 10-K filed by the Company with the Securities and Exchange Commission. The Company does not undertake any duty to any person to provide updates to its forward-looking statements. The data source for retail sales figures included in this presentation is registration information provided by Polaris dealers in North America and compiled by the Company or Company estimates. The Company must rely on information that its dealers supply concerning retail sales, and other retail sales data sources and this information is subject to revision.

2 Polaris Industries Inc. 1st Quarter 2010 Earnings Results Scott Wine CEO
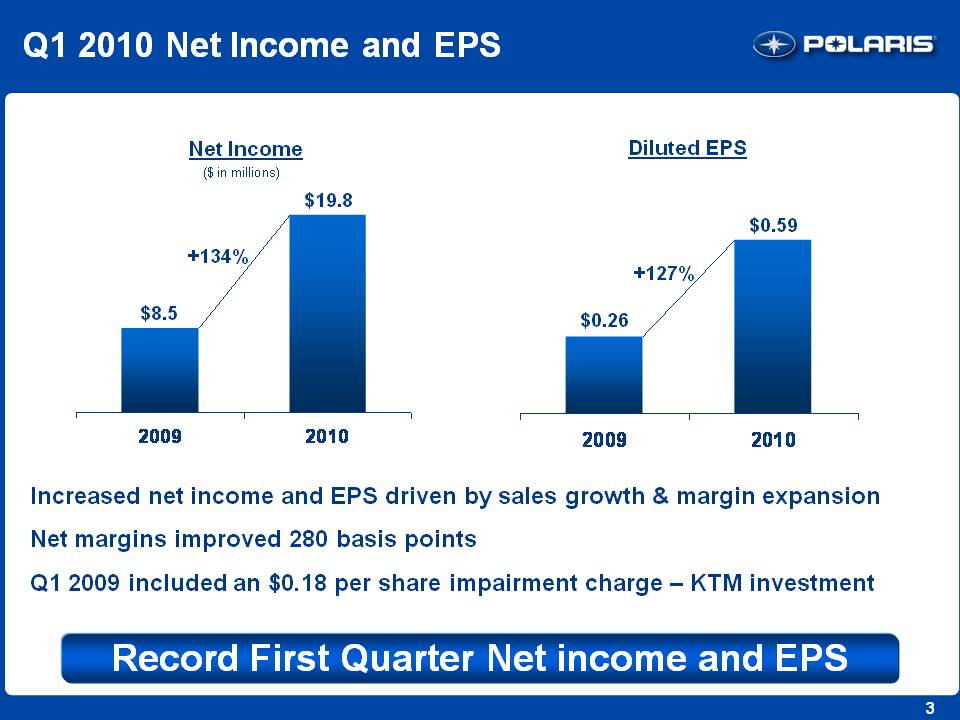
3 Q1 2010 Net Income and EPS Diluted EPS $0.26 $0.59 +127% Net Income ($ in millions) $8.5 $19.8 +134% 2009 2010 2009 2010 Increased net income and EPS driven by sales growth & margin expansion Net margins improved 280 basis points Q1 2009 included an $0.18 per share impairment charge – KTM investment Record First Quarter Net income and EPS
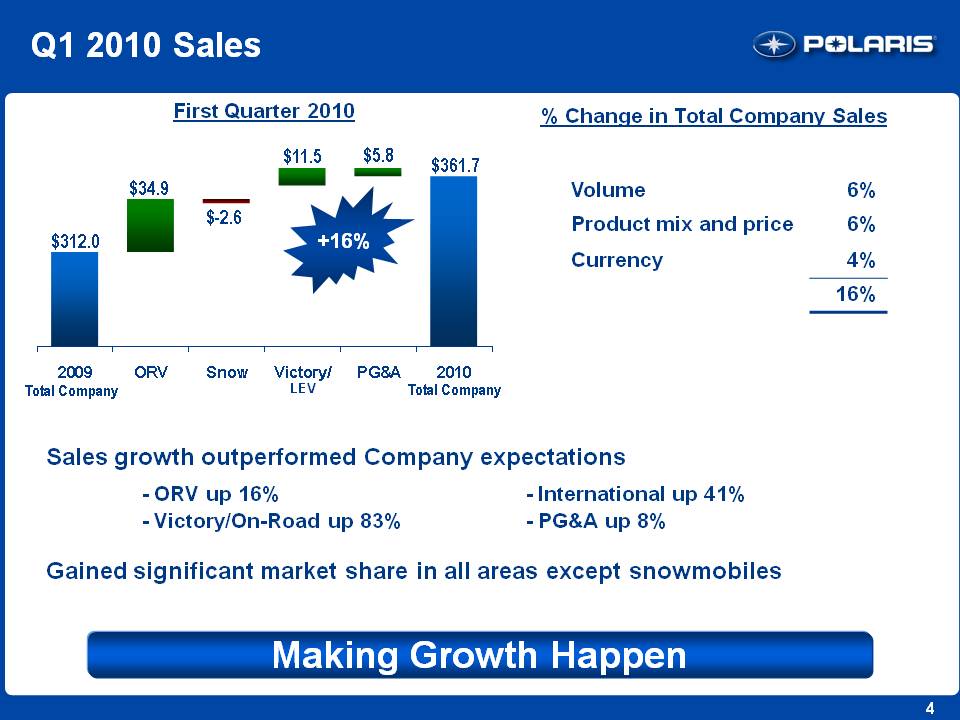
4 Q1 2010 Sales First Quarter 2010 $312.0 $34.9 $-2.6 $11.5 $5.8 $361.7 2009 Total Company 2010 Total Company ORV Snow Victory/LEV PG&A % Change in Total Company Sales Volume 6% Product mix and price 6% Currency 4% 16% Sales growth outperformed Company expectations - ORV up 16% - International up 41% - Victory/On-Road up 83% - PG&A up 8% Gained significant market share in all areas except snowmobiles Making Growth Happen +16%
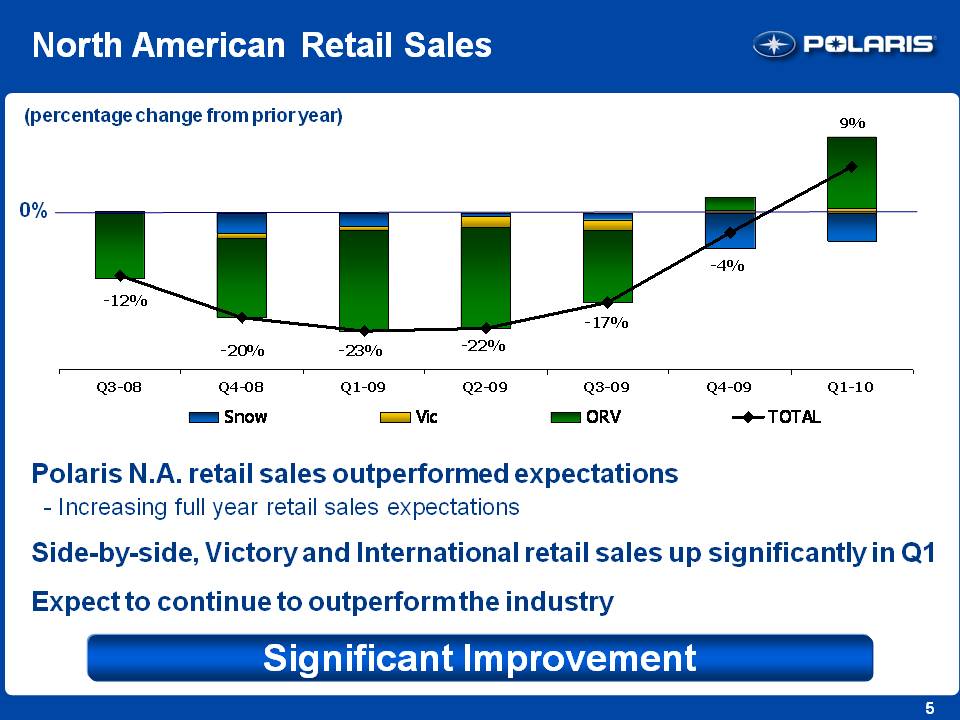
5 North American Retail Sales Polaris N.A. retail sales outperformed expectations - Increasing full year retail sales expectations Side-by-side, Victory and International retail sales up significantly in Q1 Expect to continue to outperform the industry -12% -20% -23% -22% -17% -4% 9% Q3-08 Q4-08 Q1-09 Q2-09 Q3-09 Q4-09 Q1-10 Snow Vic ORV TOTAL 0% (percentage change from prior year) Significant Improvement
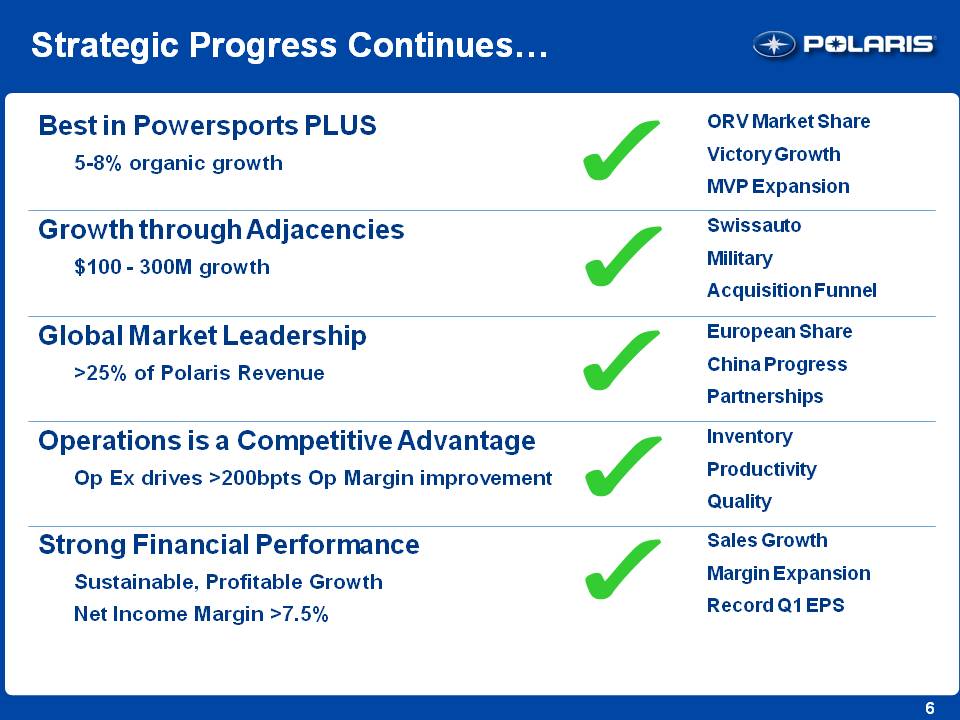
6 Strategic Progress Continues… Best in Powersports PLUS 5-8% organic growth ORV Market Share Victory Growth MVP Expansion Growth through Adjacencies $100 - 300M growth Swissauto Military Acquisition Funnel Global Market Leadership >25% of Polaris Revenue European Share China Progress Partnerships Operations is a Competitive Advantage Op Ex drives >200bpts Op Margin improvement Inventory Productivity Quality Strong Financial Performance Sustainable, Profitable Growth Net Income Margin >7.5% Sales Growth Margin Expansion Record Q1 EPS
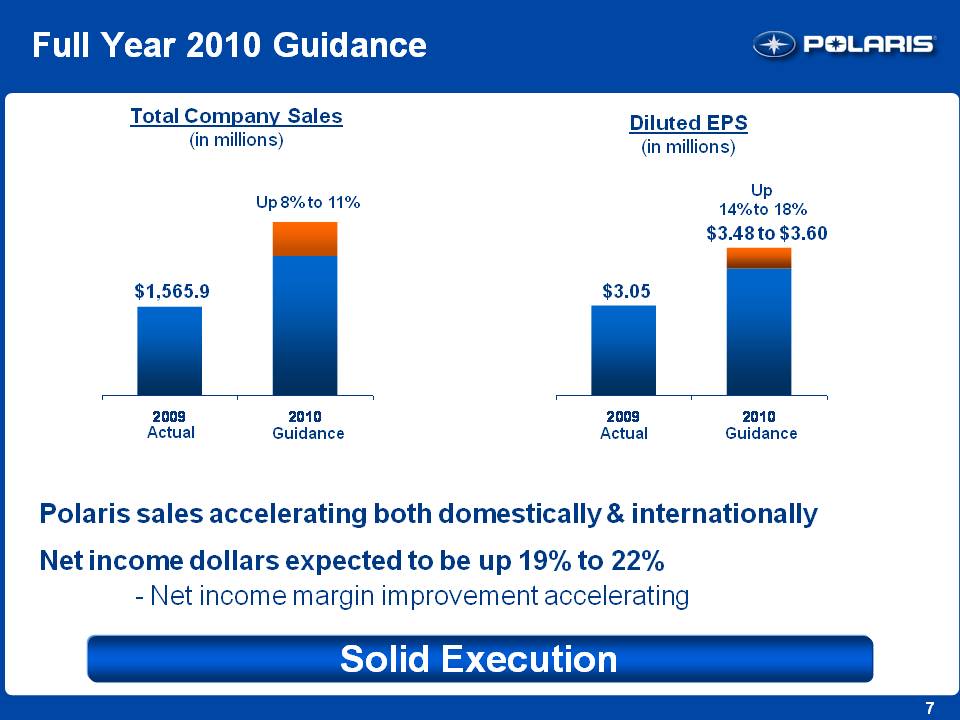
7 Full Year 2010 Guidance Polaris sales accelerating both domestically & internationally Net income dollars expected to be up 19% to 22% - Net income margin improvement accelerating Total Company Sales (in millions) Diluted EPS (in millions) Up 8% to 11% 2009 Actual $1,565.9 2010 Guidance Up 14% to 18% $3.48 to $3.60 2009 Actual $3.05 2010 Guidance Solid Execution
8 Polaris Industries Inc. 1st Quarter 2010 Earnings Results Bennett Morgan President & COO
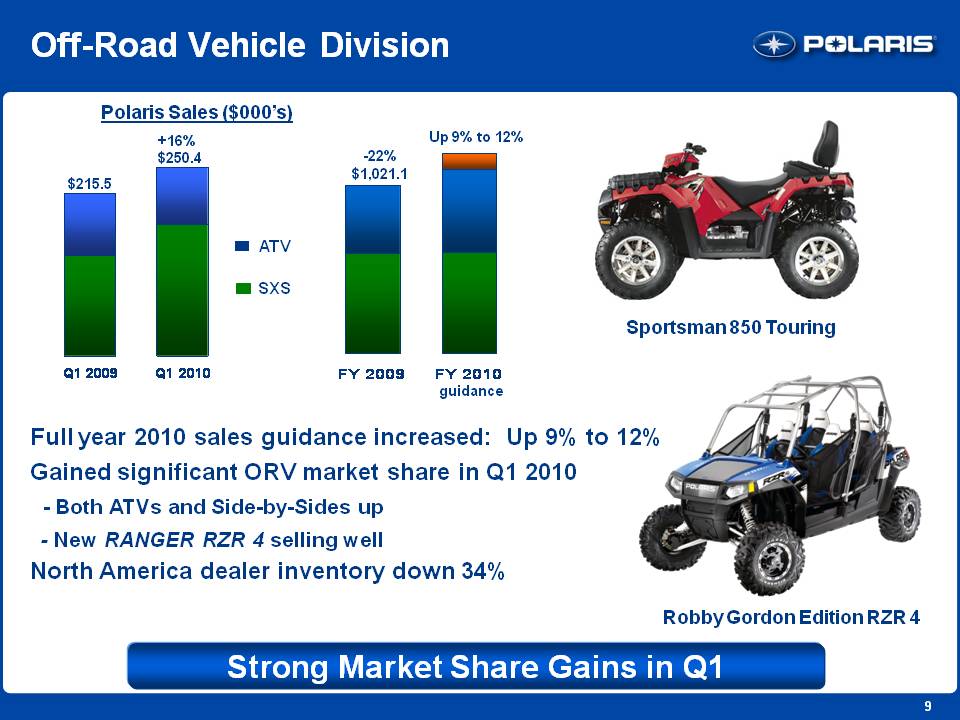
9 Off-Road Vehicle Division Polaris Sales ($000’s) $215.5 +16% $250.4 Q1 2009 Q1 2010 ATV SXS FY 2009 FY 2010 guidance -22% $1,021.1 Up 9% to 12% Full year 2010 sales guidance increased: Up 9% to 12% Gained significant ORV market share in Q1 2010 - Both ATVs and Side-by-Sides up - New RANGER RZR 4 selling well North America dealer inventory down 34% Strong Market Share Gains in Q1 Sportsman 850 Touring Robby Gordon Edition RZR 4
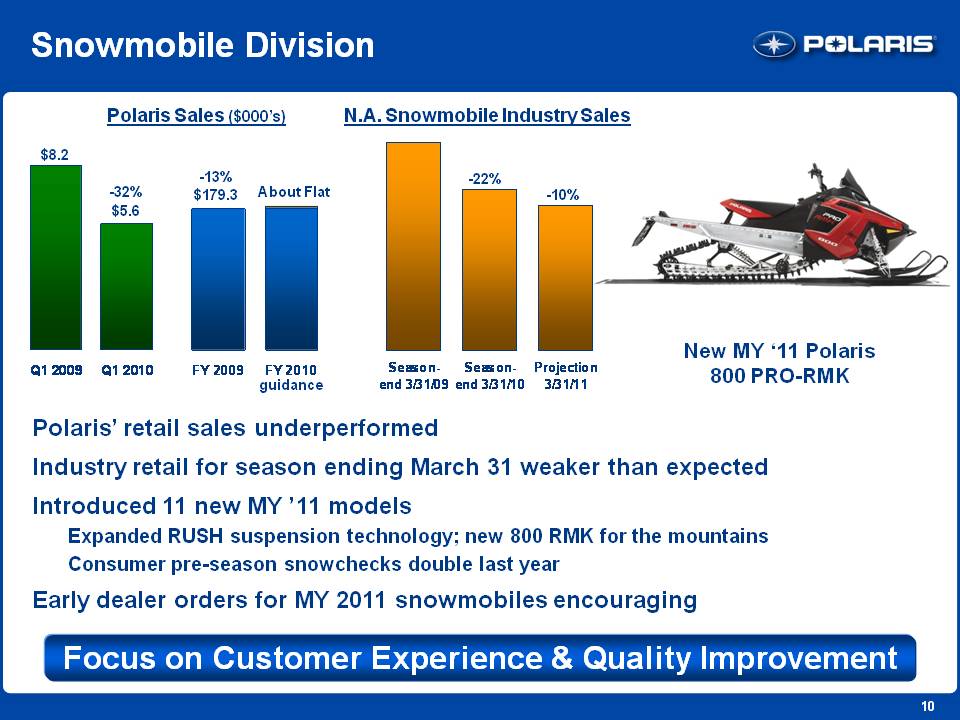
10 Snowmobile Division Polaris Sales ($000’s) $8.2 -32% $5.6 Q1 2009 Q1 2010 FY 2009 FY 2010 guidance -13% $179.3 About Flat N.A. Snowmobile Industry Sales -22% -10% Season-end 3/31/09 Season-end 3/31/10 Projection 3/31/11 Polaris’ retail sales underperformed Industry retail for season ending March 31 weaker than expected Introduced 11 new MY ’11 models Expanded RUSH suspension technology; new 800 RMK for the mountains Consumer pre-season snowchecks double last year Early dealer orders for MY 2011 snowmobiles encouraging Focus on Customer Experience & Quality Improvement New MY ‘11 Polaris 800 PRO-RMK
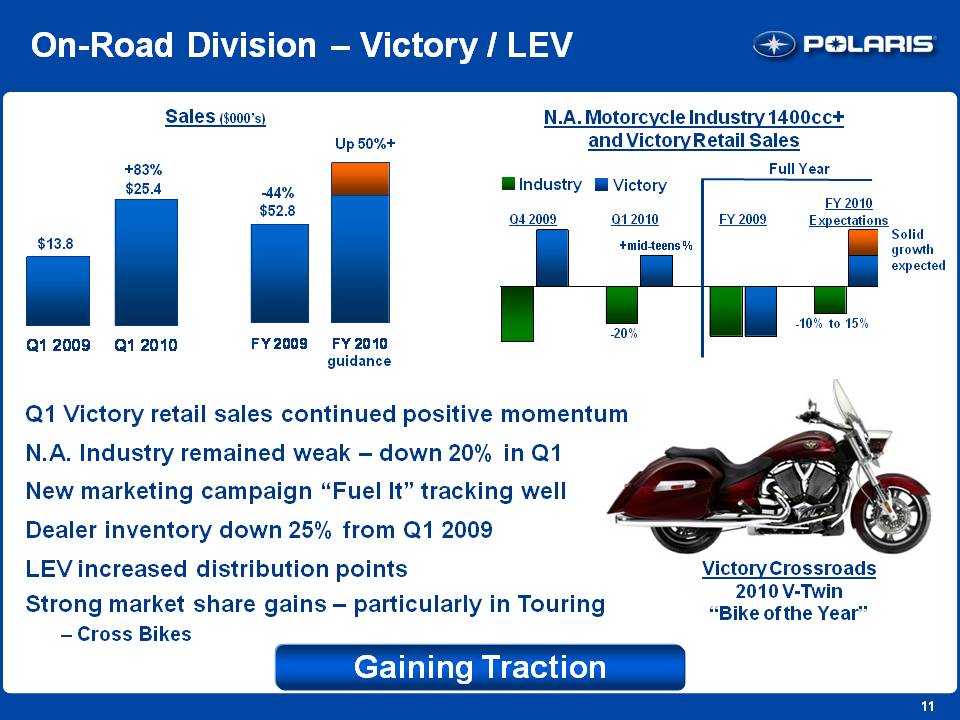
11 On-Road Division – Victory / LEV Sales ($000’s) $13.8 +83% $25.4 Q1 2009 Q1 2010 FY 2009 FY 2010 guidance -44% $52.8 Up 50%+ N.A. Motorcycle Industry 1400cc+ and Victory Retail Sales Q4 2009 Q1 2010 Full Year Industry Victory FY 2009 FY 2010 Expectations Solid growth expected -10% to 15% -20% + mid-teens % Q1 Victory retail sales continued positive momentum N.A. Industry remained weak – down 20% in Q1 New marketing campaign “Fuel It” tracking well Dealer inventory down 25% from Q1 2009 LEV increased distribution points Strong market share gains – particularly in Touring – Cross Bikes Victory Crossroads 2010 V-Twin“Bike of the Year” Gaining Traction
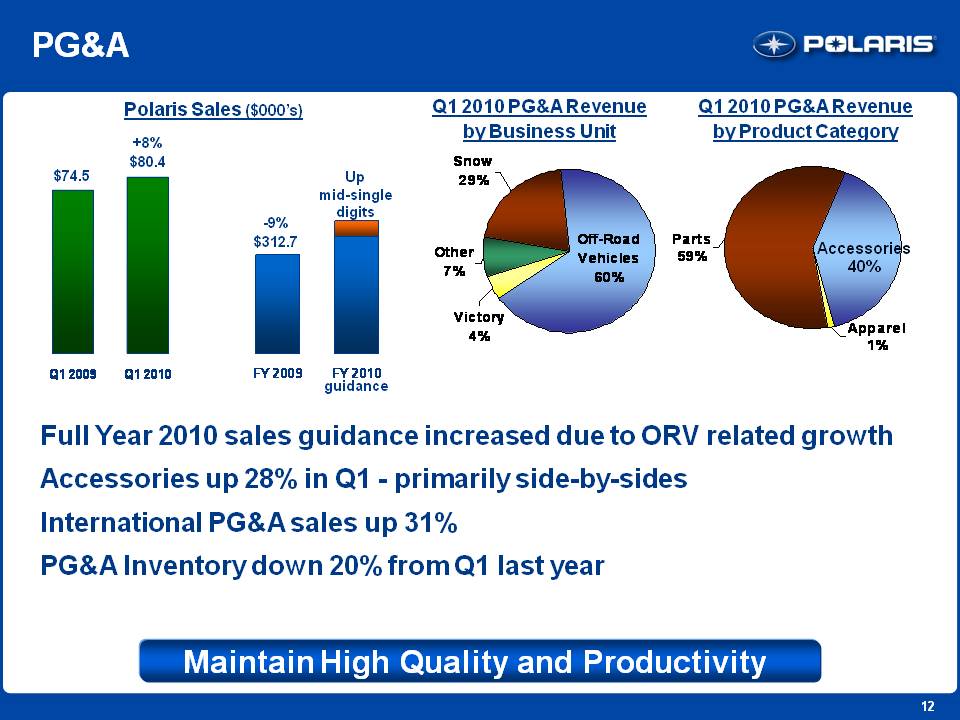
12 PG&A Polaris Sales ($000’s) $74.5 +8% $80.4 Q1 2009 Q1 2010 FY 2009 FY 2010 guidance -9%$312.7 Up mid-single digits Q1 2010 PG&A Revenue by Business Unit Off-Road Vehicles 60% Snow 29% Other 7% Victory 4% Q1 2010 PG&A Revenue by Product Category Parts 59% Accessories 40% Apparel 1% Full Year 2010 sales guidance increased due to ORV related growth Accessories up 28% in Q1 - primarily side-by-sides International PG&A sales up 31% PG&A Inventory down 20% from Q1 last year Maintain High Quality and Productivity
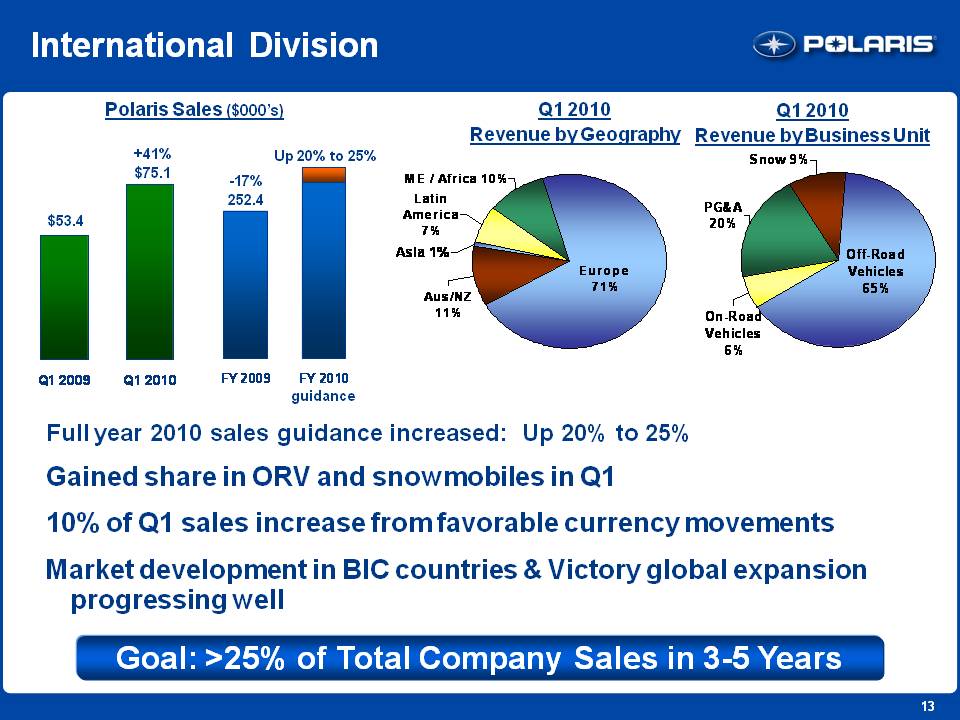
13 International Division Polaris Sales ($000’s) $53.4 +41% $75.1 Q1 2009 Q1 2010 FY 2009 FY 2010 guidance -17% 252.4 Up 20% to 25% Q1 2010 Revenue by Geography Europe 71% Aus/ NZ 11% ME / Africa 10% Latin America 7% Asia 1% Q1 2010 Revenue by Business Unit Off-Road Vehicles 65% PG&A 20% Snow 9% On-Road Vehicles 6% Full year 2010 sales guidance increased: Up 20% to 25%Gained share in ORV and snowmobiles in Q1 10% of Q1 sales increase from favorable currency movements Market development in BIC countries & Victory global expansion progressing well Goal: >25% of Total Company Sales in 3-5 Years
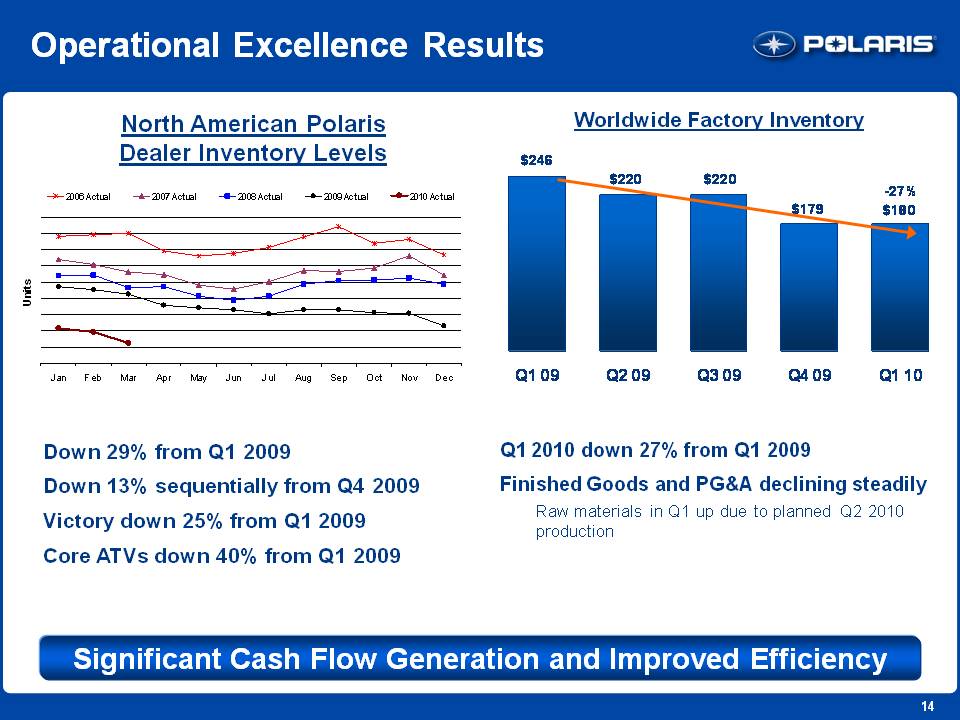
14 Operational Excellence Results North American Polaris Dealer Inventory Levels Down 29% from Q1 2009 Down 13% sequentially from Q4 2009 Victory down 25% from Q1 2009 Core ATVs down 40% from Q1 2009 Worldwide Factory Inventory Q1 2010 down 27% from Q1 2009 Finished Goods and PG&A declining steadily Raw materials in Q1 up due to planned Q2 2010 production Q1 09 Q2 09 Q3 09 Q4 09 Q1 10 $246 $220 $220 $179 -27% $180 Significant Cash Flow Generation and Improved Efficiency
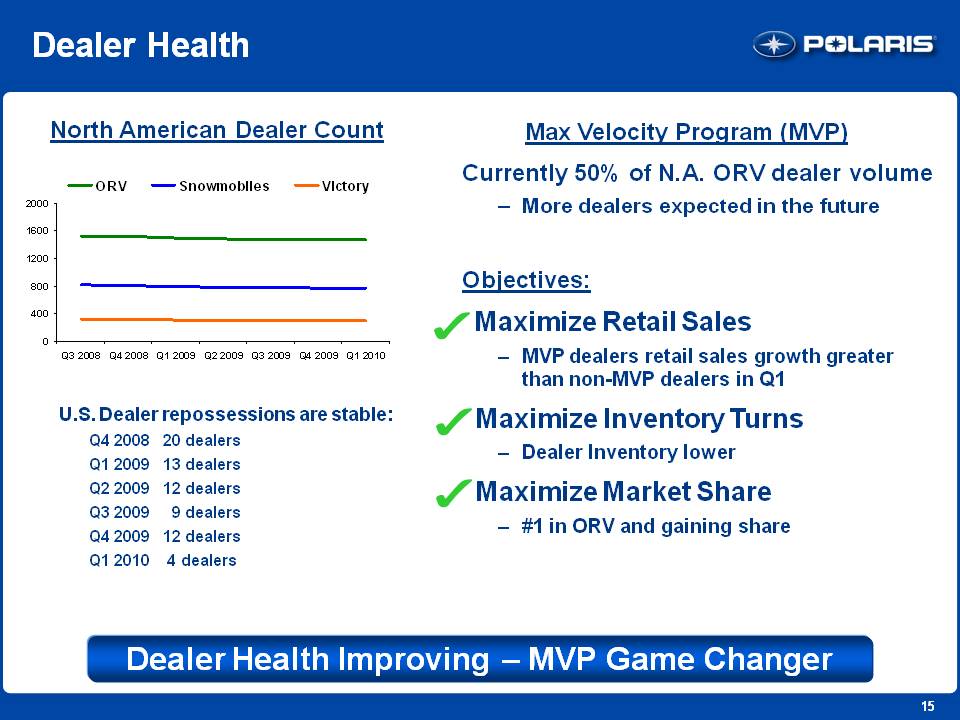
15 Dealer Health North American Dealer Count U.S. Dealer repossessions are stable: Q4 2008 20 dealers Q1 2009 13 dealers Q2 2009 12 dealers Q3 2009 9 dealersQ4 2009 12 dealers Q1 2010 4 dealers Max Velocity Program (MVP) Currently 50% of N.A. ORV dealer volumeMore dealers expected in the future Objectives: Maximize Retail SalesMVP dealers retail sales growth greater than non-MVP dealers in Q1Maximize Inventory TurnsDealer Inventory lowerMaximize Market Share#1 in ORV and gaining share Dealer Health Improving – MVP Game Changer
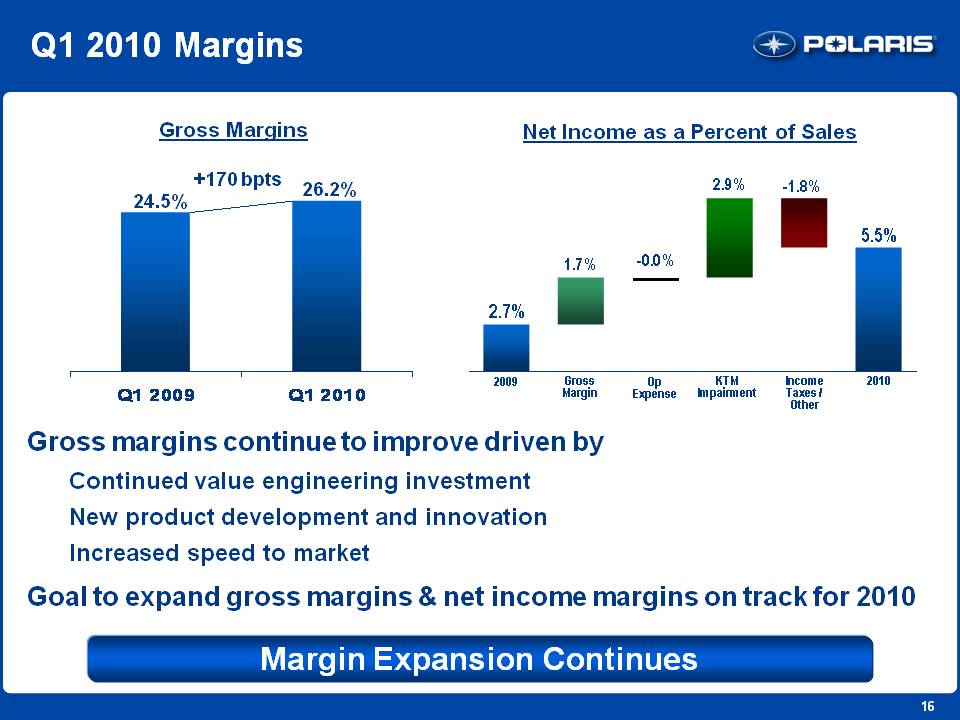
16 Q1 2010 Margins Gross Margins 24.5% 26.2% +170 bpts Q1 2009 Q1 2010 Net Income as a Percent of Sales 2009 Gross Margin Op Expense KTM Impairment Income Taxes / Other 2010 2.7% 1.7% -0.0% 2.9% -1.8% 5.5% Gross margins continue to improve driven by Continued value engineering investment New product development and innovation Increased speed to market Goal to expand gross margins & net income margins on track for 2010 Margin Expansion Continues
17 Polaris Industries Inc. 1st Quarter 2010 Earnings Results Mike Malone V.P. Finance and CFO
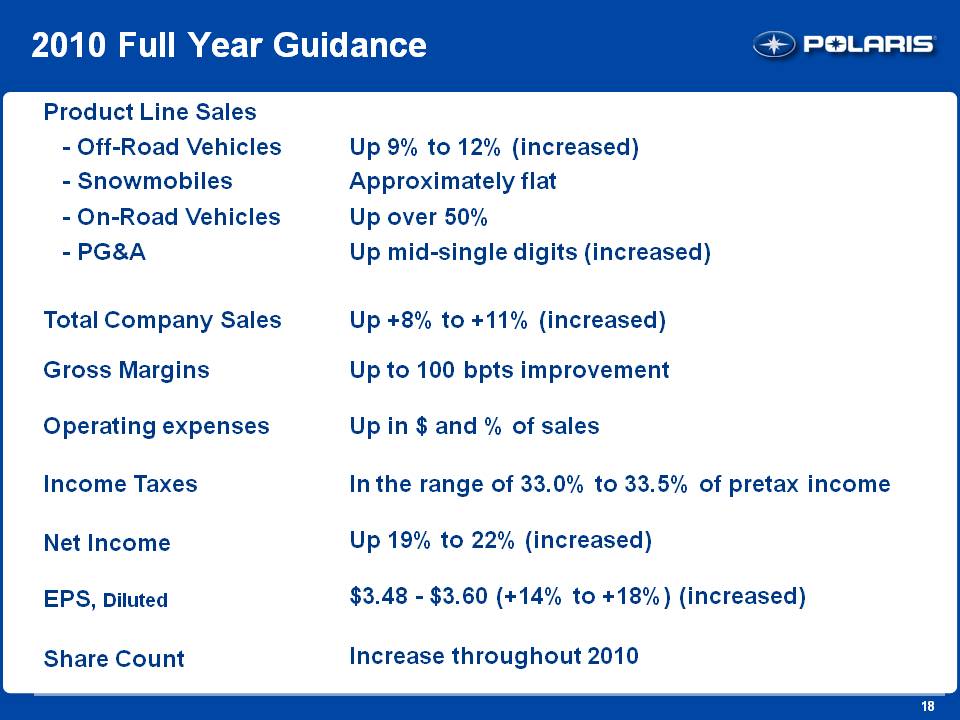
18 2010 Full Year Guidance Product Line Sales - Off-Road Vehicles Up 9% to 12% (increased) - Snowmobiles Approximately flat - On-Road Vehicles Up over 50% - PG&A Up mid-single digits (increased) Total Company Sales Up +8% to +11% (increased) Gross Margins Up to 100 bpts improvement Operating expenses Up in $ and % of sales Income Taxes In the range of 33.0% to 33.5% of pretax income Net Income Up 19% to 22% (increased) EPS, Diluted $3.48 - $3.60 (+14% to +18%) (increased) Share Count Increase throughout 2010
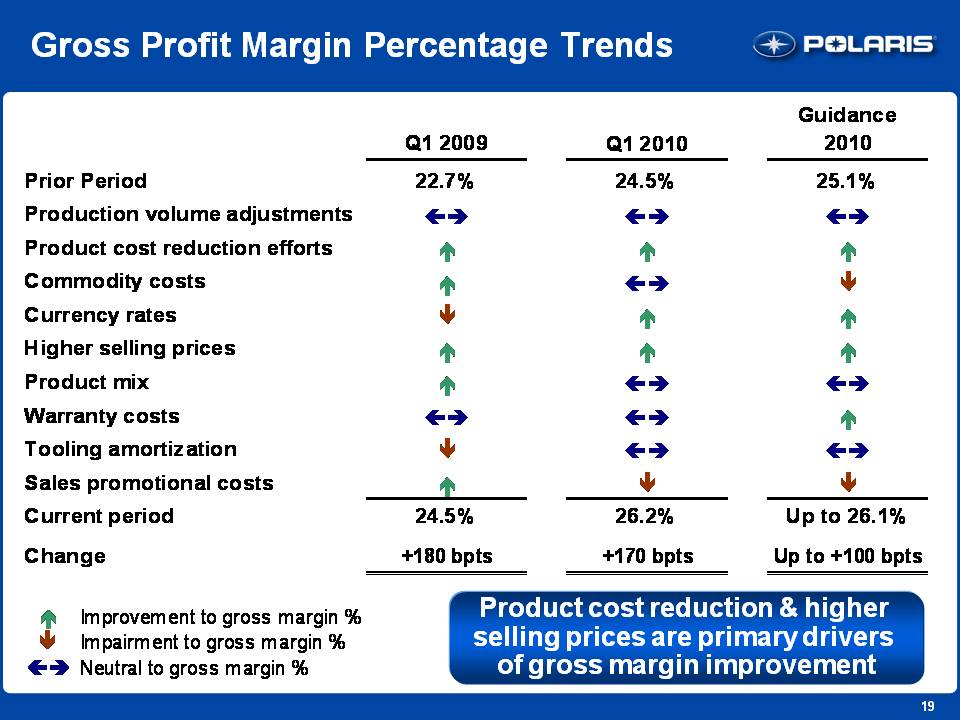
19 Gross Profit Margin Percentage Trends Prior Period Production volume adjustments Product cost reduction efforts Commodity costs Currency rates Higher selling prices Product mix Warranty costs Tooling amortization Sales promotional costs Current period Change Q1 2009 Q1 2010 Guidance 2010 22.7% 24.5% 25.1% 24.5% 26.2% Up to 26.1% +180 bpts + 170 bpts Up to + 100 bpts Improvement to gross margin % Impairment to gross margin % Neutral to gross margin % Product cost reduction & higher selling prices are primary drivers of gross margin improvement
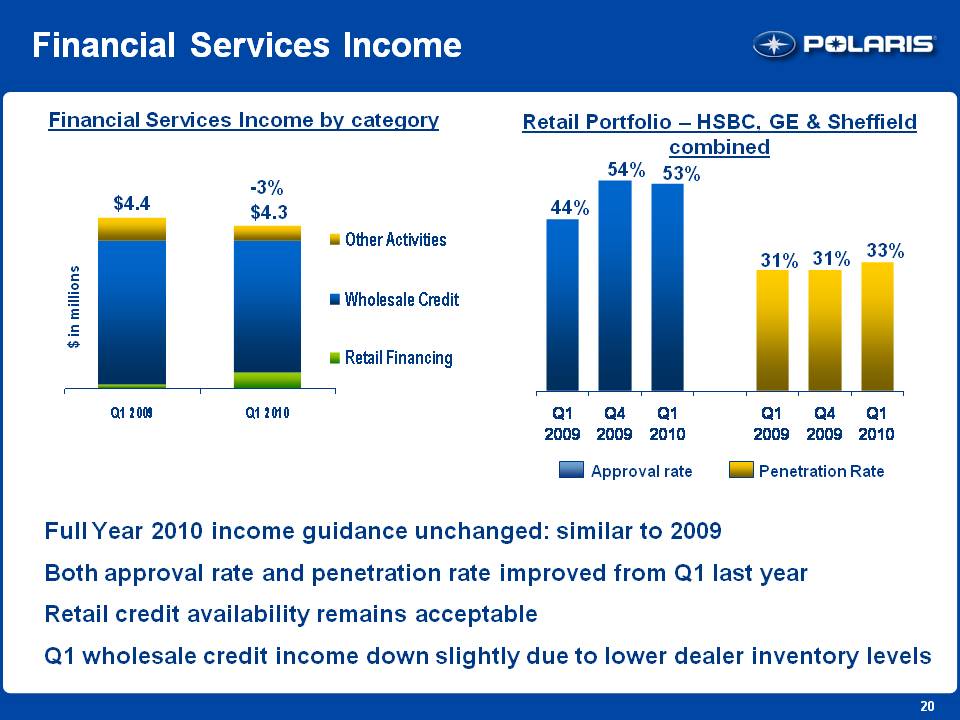
20 Financial Services Income Financial Services Income by category $4.4 -3% $4.3 Q1 2009 Q1 2010 $ in millions Other Activities Wholesale Credit Retail Financing Retail Portfolio – HSBC, GE & Sheffield combined Approval rate Penetration Rate 44% 54% 53% 31% 31% 33% Q1 2009 Q4 2009 Q1 2010 Q1 2009 Q4 2009 Q1 2010 Full Year 2010 income guidance unchanged: similar to 2009 Both approval rate and penetration rate improved from Q1 last year Retail credit availability remains acceptable Q1 wholesale credit income down slightly due to lower dealer inventory levels
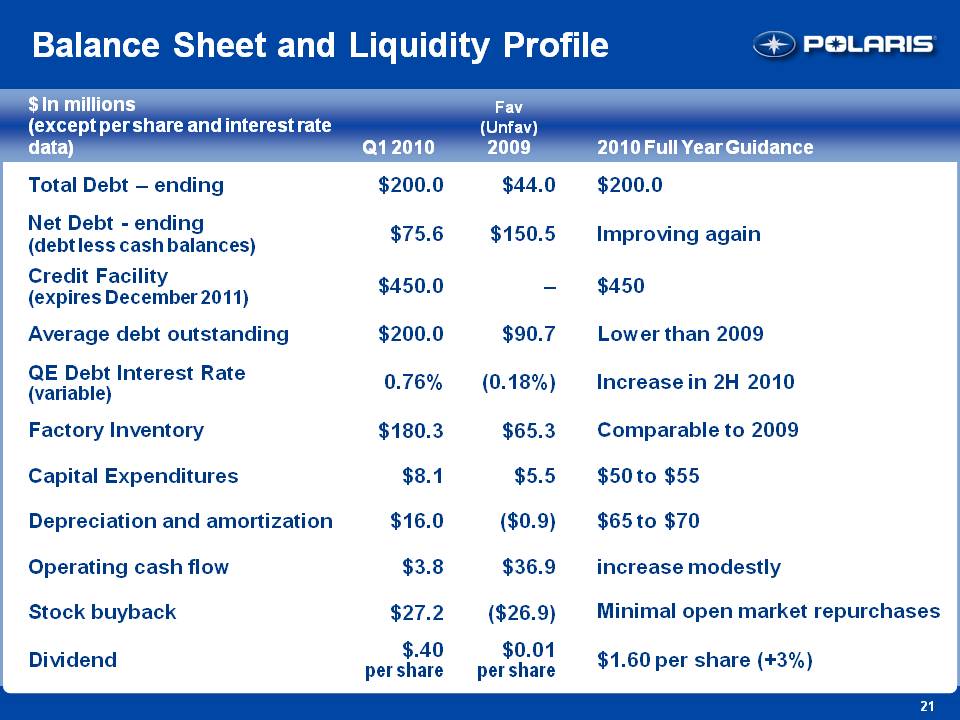
21 Balance Sheet and Liquidity Profile $ In millions (except per share and interest rate data) Q1 2010 Fav (Unfav) 2009 2010 Full Year Guidance Total Debt – ending $200.0 $44.0 $200.0 Net Debt - ending (debt less cash balances) $75.6 $150.5 Improving again Credit Facility (expires December 2011) $450.0 – $450 Average debt outstanding $200.0 $90.7 Lower than 2009 QE Debt Interest Rate (variable) 0.76% (0.18%) Increase in 2H 2010 Factory Inventory $180.3 $65.3 Comparable to 2009 Capital Expenditures $8.1 $5.5 $50 to $55 Depreciation and amortization $16.0 ($0.9) $65 to $70 Operating cash flow $3.8 $36.9 increase modestly Stock buyback $27.2 ($26.9) Minimal open market repurchases Dividend $.40 per share $0.01 per share $1.60 per share (+3%)
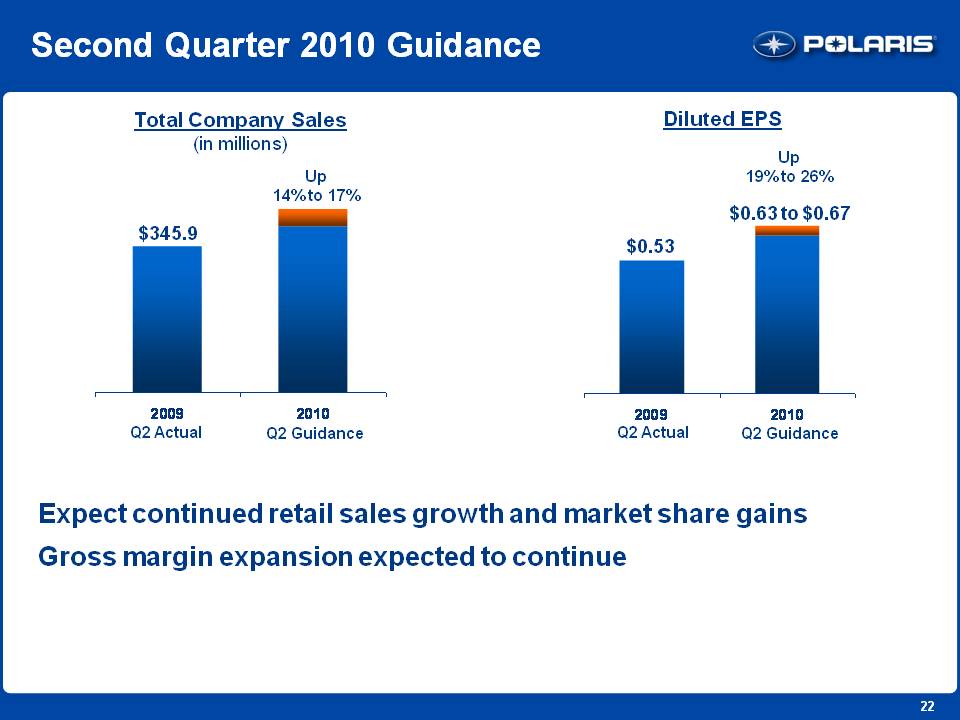
22 Second Quarter 2010 Guidance Total Company Sales (in millions) Up14% to 17% $345.9 2009 Q2 Actual 2010 Q2 Guidance Diluted EPS Up19% to 26% $0.63 to $0.67 $0.53 2009 Q2 Actual 2010 Q2 Guidance Expect continued retail sales growth and market share gains Gross margin expansion expected to continue
23 Polaris Industries Inc. 1st Quarter 2010 Earnings Results Scott Wine CEO
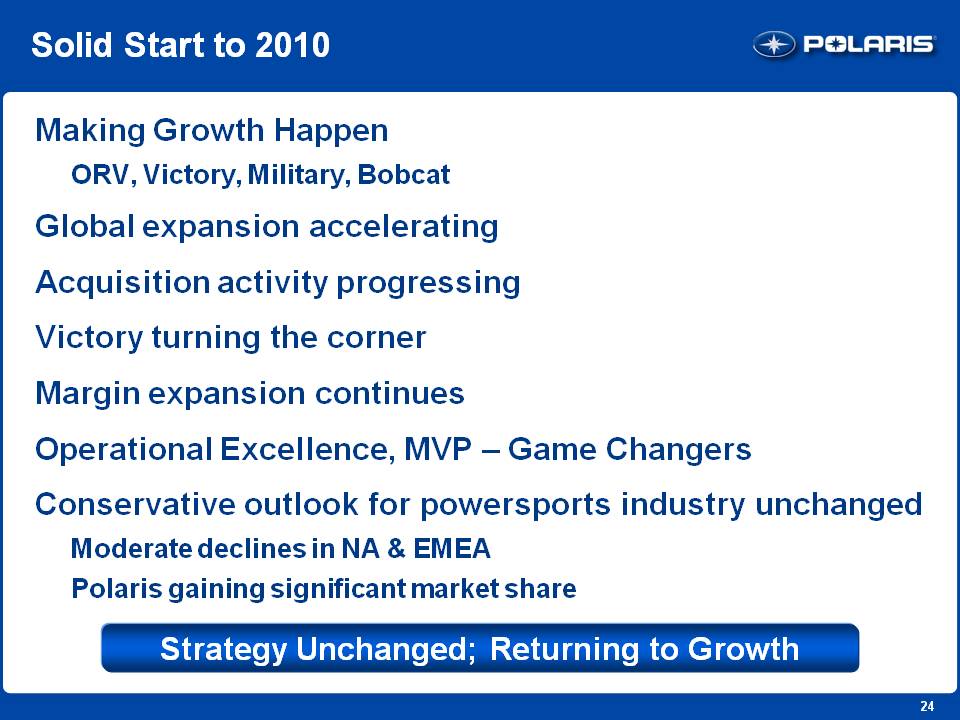
24 Solid Start to 2010 Making Growth Happen ORV, Victory, Military, Bobcat Global expansion accelerating Acquisition activity progressing Victory turning the corner Margin expansion continues Operational Excellence, MVP – Game Changers Conservative outlook for powersports industry unchanged Moderate declines in NA & EMEA Polaris gaining significant market share Strategy Unchanged; Returning to Growth
25 Polaris Industries Inc. Thank you.Q & A