Attached files
| file | filename |
|---|---|
| EX-23.1 - CONSENT OF ACCOUNTANTS - SUTRON CORP | exh23-1_16778.htm |
| EX-31.2 - 302 CERTIFICATION OF THE C.F.O. - SUTRON CORP | exh31-2_16778.htm |
| EX-23.2 - CONSENT OF ACCOUNTANTS - SUTRON CORP | exh23-2_16778.htm |
| EX-31.1 - 302 CERTIFICATION OF THE CHAIRMAN - SUTRON CORP | exh31-1_16778.htm |
| EX-10.19 - NOTE AND LOAN MODIFICATION AGREEMENT - SUTRON CORP | exh10-19_16778.htm |
| EX-10.21 - STOCK OPTION AGREEMENT - SUTRON CORP | exh10-21_16778.htm |
| EX-10.20 - AMENDED AND RESTATED 2002 STOCK OPTION PLAN - SUTRON CORP | exh10-20_16778.htm |
| EX-32 - 906 CERTIFICATION OF THE CHAIRMAN & C.F.O. - SUTRON CORP | exh32_16778.htm |
UNITED STATES
SECURITIES AND EXCHANGE COMMISSION
Washington, D.C. 20549
FORM 10-K
Annual Report Pursuant to Section 13 or 15(d) of the Securities Exchange Act Of 1934
For the fiscal year ended: December 31, 2009
Commission file number: 0-12227
SUTRON CORPORATION
(Exact name of registrant as specified in its charter)
| Virginia | 54-1006352 |
| (State or other jurisdiction of incorporation or organization) | (I.R.S. Employer Identification No.) |
22400 Davis Drive, Sterling Virginia 20164
(Address of principal executive offices)
(703) 406-2800
(Registrants telephone number, including area code)
Securities registered under Section 12(g) of the Act: Common Stock, $.01 par value
(Title of class)
Indicate by check mark if the registrant is a well-known seasoned issuer, as defined in Rule 405 of the Securities Act. Yes o No þ
Indicate by check mark if the registrant is not required to file reports pursuant to Section 13 or 15(d) for the Exchange Act. Yes o No þ
Indicate by check mark whether the registrant (1) has filed all reports required to be filed by Section 13 or 15(d) of the Securities Exchange Act of 1934 during the preceding 12 months (or for such shorter period that the Registrant was required to file such reports), and (2) has been subject to such filing requirements for the past 90 days. Yes þ No o
Indicate by check mark if there is no disclosure of delinquent filers in response to Item 405 of Regulation S-K contained in this form, and no disclosure will be contained, to the best of registrants knowledge, in definitive proxy or information statements incorporated by reference in Part III of this Form 10-K or any amendments to this Form 10-K. o
Indicate by check mark whether the registrant is a large accelerated filer, an accelerated filer, a non-accelerated filer or a smaller reporting company. See the definitions of “large accelerated filer,” “accelerated filer” and “smaller reporting company” in Rule 12b-2 of the Exchange Act. (Check one):
| Large accelerated filer o | Accelerated filer o | Non-accelerated filer o | Smaller reporting company þ |
Indicate by check mark whether the registrant is a shell company (as defined in Rule 12b-2 of the Exchange Act).
Yes o No þ
The aggregate market value of the voting stock held by non-affiliates of the registrant, based on the closing price of $7.07 as reported by the NASDAQ Stock Market, Inc. for the Registrant’s Common Stock as of April 13, 2010, was $24,248,057.
The number of shares outstanding of the Registrant’s Common Stock, $.01 par value, as of April 13, 2010 was 4,570,632.
DOCUMENTS INCORPORATED BY REFERENCE
Certain portions of the Registrants’ Definitive Proxy Statement for the 2010 Annual Meeting of Shareholders, which will be filed within 120 days after the end of the year covered by this Form 10-K, are incorporated in Part III as set forth herein.
TABLE OF CONTENTS
|
Explanatory Note
|
4
|
||
|
Note Concerning Forward-Looking Statements
|
4
|
||
|
Part I
|
|||
|
Item 1.
|
Business
|
4
|
|
|
Item 1A
|
Risk Factors
|
10
|
|
|
Item 1B
|
Unresolved Staff Comments
|
12
|
|
|
Item 2.
|
Properties
|
12
|
|
|
Item 3.
|
Legal Proceedings
|
12
|
|
|
Item 4.
|
Submission of Matters to a Vote of Security Holders
|
12
|
|
|
Part II
|
|||
|
Item 5.
|
Market for Registrant’s Common Equity, Related Stockholder Matters and Issuer Purchases of Equity Securities
|
13
|
|
|
Item 6.
|
Selected Financial Data
|
14
|
|
|
Item 7.
|
Management's Discussion and Analysis of Financial Condition and Results of Operations
|
14
|
|
|
Item 7A
|
Quantitative and Qualitative Disclosures about Market Risk
|
22
|
|
|
Item 8.
|
Financial Statements and Supplementary Data
|
24
|
|
|
Item 9.
|
Changes in and Disagreements with Accountants on Accounting and Financial Disclosures
|
47
|
|
|
Item 9A
|
Controls and Procedures
|
47
|
|
|
Item 9B
|
Other Information
|
49
|
|
|
Part III
|
|||
|
Item 10.
|
Directors, Executive Officers and Corporate Governance
|
49
|
|
|
Item 11.
|
Executive Compensation
|
49
|
|
|
Item 12.
|
Security Ownership of Certain Beneficial Owners and Management and Related Stockholder Matters
|
49
|
|
|
Item 13.
|
Certain Relationships, Related Transactions and Directors Independence
|
49
|
|
|
Item 14.
|
Principal Accountant Fees and Services
|
49
|
|
|
Part IV
|
|||
|
Item 15.
|
Exhibits and Financial Statement Schedules
|
50
|
|
| Signature | 51 | ||
- 3 -
In this Annual Report on Form 10-K for the year ended December 31, 2009 (the “2009 Form 10-K”), Sutron Corporation is restating its financial statements for the years ended December 31, 2008, 2007 and 2006, as well as the quarterly financial statements for the periods ended March 31, 2006 through September 30, 2009. This 2009 Form 10-K reflects the restatement of “Selected Financial Data” in Item 6, Note 19 “Quarterly Financial Information” in Item 8, and the amendment of “Management’s Discussion and Analysis of Financial Condition and Results of Operations” presented in this 2009 Form 10-K in Item 7, in each case relating to the fiscal periods in each of the years ended December 31, 2008, 2007 and 2006. Certain immaterial adjustments that were not made or reflected in the previously issued consolidated financial statements for the years ended December 31, 2008, 2007 and 2006 are reflected in the restated consolidated financial statements as a result of the restatement. The restatement relates (i) to errors in inventory standard costs that were not being updated annually resulting in an overstatement of inventory values as of December 31, 2008, 2007 and 2006 and (ii) to errors in income tax expense for tax deductions related to employee stock compensation that were not properly classified as additional paid-in capital and understated additional paid-in capital and income tax expense for the years ended December 31, 2008, 2007 and 2006.
The filing of this 2009 Form 10-K was delayed due to the time required by management to review and to restate our previously issued audited consolidated financial statements for the years ended December 31, 2008, 2007 and 2006, including the quarterly periods ended March 31, 2006 through September 30, 2009. We have not amended our previously filed Annual Reports on Form 10-K for the fiscal years ended December 31, 2008, 2007 and 2006, or the Quarterly Reports on Form 10-Q for the periods ended March 31, 2006 through September 30, 2009, to reflect the restatements described in this Annual Report on Form 10-K, and thus the financial statements and related financial statement information contained in those reports and the disclosures regarding effectiveness of internal control over financial reporting for the fiscal years ended December 31, 2008, 2007 and 2006, and all related earnings releases and similar communications issued by the Company for those periods, should no longer be relied upon. Throughout this Annual Report on Form 10-K, all amounts presented from prior periods and prior period comparisons that have been revised are labeled as “restated” and reflect the balances and amounts on a restated basis.
NOTE CONCERNING FORWARD-LOOKING STATEMENTS
This Form 10-K includes forward-looking statements regarding our expected future financial position, results of operations, cash flows, financing plans, business strategy, products and services, competitive positions, growth opportunities, plans and objectives of management for future operations. Statements that include words such as "anticipate," "if," "believe," "plan," "estimate," "expect," "intend," may," “should” and other similar expressions are forward-looking statements. All forward-looking statements involve risks, uncertainties and contingencies which may cause actual results, performance, or achievements to differ materially from anticipated results, performance, or achievements. Factors that may cause actual results to differ materially from those in the forward-looking statements include those discussed under “Risk Factors,” “Management’s Discussion and Analysis of Financial Condition and Results of Operations” and elsewhere in this report. All forward-looking statements speak only to events as of the date on which the statements are made. All subsequent written and oral forward-looking statements attributable to us or any person acting on our behalf are qualified by the cautionary statements in this section. We undertake no obligation to update or publicly release any revisions to forward-looking statements to reflect events, circumstances or changes in expectations after the date on which the statement is made.
PART I
Item 1 - Business
Sutron Corporation was incorporated on December 30, 1975 under the General Laws of the Commonwealth of Virginia. Our headquarters is located at 22400 Davis Drive, Sterling, Virginia 20164, and the telephone number at that location is (703) 406-2800. We maintain a worldwide web address at www.sutron.com. The information contained on our website is not incorporated by reference into this Form 10-K and shall not be considered a part of this Form 10-K.
- 4 -
We design, manufacture and market products and systems that enable government and commercial entities to monitor and collect hydrological, meteorological and oceanic data for the management of critical water resources, for early warning of potentially disastrous floods, storms or tsunamis and for the optimization of hydropower plants. We provide real-time data collection and control products consisting primarily of dataloggers, satellite transmitters/loggers, water level and meteorological sensors and tides monitoring systems. We provide turnkey integrated systems for hydrological, meteorological and oceanic and related services consisting of installation, training and maintenance of hydrological and meteorological networks. Our customers include a diversified base of federal, state, local and foreign governments, engineering companies, universities and hydropower companies.
We operate principally in two industry segments: the manufacturing of standard products (hydrological, meteorological and oceanic monitoring and control products) which are sold off-the-shelf and systems (hydrological, meteorological and oceanic monitoring stations/systems that are comprised of standard products and custom items as required by the system specification also including software) and services (including installation, training, and maintenance of systems). Our Hydromet Products Division is responsible for the manufacturing of all standard products. We have various profit centers consisting of Integrated Systems Division, Hydrological Services Division, Ilex Division and Sutron India operations that provide our systems and services.
The Hydromet Products Division manufactures dataloggers, satellite transmitters/loggers, water level and meteorological sensors and tides monitoring systems. Dataloggers collect sensor data and transmit the data to central facilities primarily by satellite radio but also by cell phone, fiber optics or microwave. Our sensors collect hydrological and meteorological data and include a tipping bucket rain gauge, a barometric pressure sensor, a temperature sensor and differing types of water level sensors including shaft encoders, bubbler systems, submersible sensors and radar sensors. Our dataloggers can interface to sensors from other companies. We have long-standing relationships with suppliers of sensors for wind speed and wind direction, water quality, humidity and solar radiation. The principal products that are manufactured by the Hydromet Products Division are described below.
Xpert and XLite Dataloggers
The Xpert Datalogger/controller is our fourth generation datalogger. The Xpert is environmentally hardened and capable of operating from -40 C to 60 C. It runs on a Microsoft CE operating system, has a 486 microprocessor, C++ programming and standard 2 MB memory that is expandable to over 1 gigabyte. The XLite, a derived product based on the Xpert, does not have a display but is similarly capable. The XLite was released at the end of 2001.
The Xpert and XLite dataloggers are the core of a wide-range of remote monitoring and control systems, The rugged Xpert is highly modular and can be leveraged to handle multiple applications, from the simplest to the most complex. Its Sensor Library programs are for widely used brand name sensors and all Sutron sensors. Generic measurement objects make adding support for new sensors very easy. It is designed specifically to support a variety of portable and permanent monitoring and control applications and systems including automatic weather stations, agrimet stations, synoptic weather stations, AWOS stations, tide stations, hydromet stations, water level and water quality stations, rainfall stations, gate control stations, irrigation and water distribution control stations, stream gaging stations, dam safety stations and flood forecasting, monitoring, control and warning systems
SatLink2 Transmitter/Logger
In January 2004, the SatLink2 was certified by the National Environmental Satellite, Data and Information Services (NESDIS). The SatLink2 is a redesign of the original SatLink transmitter in order to provide the latest features, to improve functionality and to lower manufacturing costs. The SatLink2 is a high data rate satellite transmitter/logger that transmits at 100, 300 and 1200 baud, incorporates GPS and functions as a logger. The SatLink transmitter was certified by the NESDIS in July 2001 for operation on the Geostationary Operational Environment Satellite (GOES) system. NESDIS operates two U.S. Government environmental satellites on this system. All GOES customers are mandated by NESDIS to purchase high data rate satellite transmitters and to replace all old 100 baud transmitters within a ten-year period beginning in July 2001. NESDIS made this a requirement in order to increase the amount of data that the two GOES satellites can handle.
SatLink2 is certified on all major satellite systems around the world and works with virtually all dataloggers. SatLink2 is programmable from any PC or PDA using software provided with the unit. SatLink2’s innovative
- 5 -
design includes everything needed to collect high quality data, without costly options. Our standard unit includes a built-in logger, SDI-12 interface, dedicated tipping bucket input, 4 analog inputs and a powerful mathematical equation editor.
Stage Discharge Recorder
The Stage Discharge Recorder is an ultra-reliable SDI-12 optical encoder fused with logger technology from our Satlink2 Transmitter/Logger to create an encoder that never forgets. Using proven float-tape-counterweight technology, the Stage Discharge Recorder is a “plug compatible” replacement for strip chart recorders or punched-tape recorder. The Stage Discharge Recorder saves data in ultra-reliable flash memory. This means that there are no backup batteries for the memory. The Stage Discharge Recorder incorporates standard flume and weir equations and can compute and log discharge totals and display discharge as well as flume/weir stage. A built-in event log keeps track of when anyone views or downloads data or makes changes to the setup. The Stage Discharge Recorder will run up to one year on an industrial alkaline battery.
Accubar Gauge Pressure Sensor
The Accubar Gauge Pressure sensor is used in water level monitoring systems and is a highly accurate solid state pressure transducer capable of measuring air/dry gas pressures from 0 to 22 psi with a maximum pressure of 35 psi. It is housed in an aluminum case and with its low power consumption and low maintenance requirements, it is ideal for remote monitoring applications.
AccuBubble Self-Contained Bubbler System
The AccuBubble Self-Contained Bubbler is a mercury-free and nitrogen-free bubbler apparatus designed for low maintenance water level measuring. Using the Sutron Accubar Pressure Sensor as the control and sensing element makes the AccuBubble a very stable and highly accurate water level measuring device. The AccuBubble uses power conservation techniques to minimize current consumption. The bubbler purges the orifice line prior to each measurement. This eliminates the need for a constant bubble rate, which has been known to consume excessive power. In addition, the purging sequence prevents debris build up in the orifice line. The AccuBubble uses an oil-less, non-lubricated piston and cylinder compressor. This type of compressor is designed to give consistent air delivery without the use of a diaphragm which can rupture over time. The AccuBubble uses the SDI-12 communications protocol as the control interface. This allows the unit to be configured by any data logger supporting the SDI-12 standard.
Tides and Ports Systems
The National Ocean Survey (NOS), part of the National Oceanic and Atmospheric Administration (NOAA), has the responsibility to accurately measure tide levels around the perimeter of the United States. NOS ensures that measurements are the most accurate possible by using the best water level instruments available. Tide stations are based on the Xpert data logger and the SatLink2. Xperts run the powerful Windows CE multi-tasking operating system. Sutron has taken advantage of Windows CE to equip each tide station with software that meets and exceeds all of the NOS requirements. We have enhanced the capabilities of tides systems by adding Storm Surge/Tsunami software. This software provides added capability to tides stations to detect and provide tsunami warnings.
The Main Tide Station is designed to detect a vast array of events. Sutron's Xpert Logger is a Windows device programmable to monitor multiple parameters including traditional NOS methods such as sudden water level drops and seismic sensors, or both at one time. It supports a wide variety of water level monitoring and weather instruments. The Main Tide Station provides pre-programmed support for all NOS-required tidal data processing. The Main Tide Station also supports GOES satellite and a wide variety of other telemetry methods including cell and marine phones. The tides station provides built-in surge protection for all inputs. Although designed for the tidal market, the Main Tide Station is an ideal starting point for a wide variety of highly reliable and accurate weather stations.
The Integrated Systems Division provides system integration services consisting of the design, integration, installation and commissioning of customer-specific hydrological and meteorological monitoring and control
- 6 -
systems. Systems also include software applications based on our XConnect database software and our Ilex Tempest database software. Our databaswe software capability allows us to provide turnkey hydrological and meteorological systems to a variety of users. Projects may range in size from one station to hundreds of stations. Projects usually require design, equipment integration, software application development, installation, training and commissioning. Projects can range in duration from several days to several years depending on the scope and complexity of the system.
Airport weather systems are integrated and installed by the Integrated Services Division. We have contracted with a seasoned manager with over 20 years experience in the Automatic Weather Observation System (AWOS) market to lead our airport weather efforts. Typically, an AWOS includes a sensor suite to measure wind direction and speed, temperature, relative humidity, precipitation, and barometric pressure as well as cloud height and horizontal visibility/runway visibility. Sensors are connected to an Xpert datalogger, which processes the data, stores it in a relational database and transmits real-time weather parameters to all designated users, regardless of location. The system produces weather reports for aviation and meteorological use, virtually automatically and without need of human intervention.
The Hydrological Services Division provides hydrologic services including data interpretation and analysis, flow modeling (low flow, rainfall runoff, unsteady flow routing, water surface profiles), field studies (time of travel, diffusion, dispersion, calibration of flow control structures, site location), hydrologic studies (water budget, regression analysis, basin inventory studies), environmental permitting, legal or expert witness and equipment integration, installation, commissioning and maintenance.
Our Ilex Division is a provider of Tempest database software, DOMSAT systems, custom software and engineering services. Ilex’s customers are primarily the U.S. Army Corps of Engineers, U.S. Geological Survey, NOAA National Weather Service and U.S. Bureau of Reclamation.
Sutron India Operations consist of a Branch Office that was established early in 2004 in order to comply with India tax law and to perform work on an annual maintenance contract that was received from the Central Water Commission of India (CWC) in July 2004. In February 2005, we established Sutron HydroMet Systems Private Limited, a wholly owned subsidiary, in order to bid on National tenders. Our India Operations procures local goods for projects and performs systems integration, civil works construction, installation, commissioning and maintenance. Our India Operations maintains over 260 remote automatic real-time hydromet monitoring stations in India under contracts with the CWC and with the Government of Andhra Pradesh.
Sales and Marketing
We market our products and services domestically and internationally. Domestic sales are conducted by our internal sales staff that consists of five salaried sales personnel who are directly engaged in direct sales activities. The sales staff is assisted by two other employees in marketing and sales support functions. Internationally, we have two employees who cover the world and who work closely with our international sales network that consists of 35 resellers and agents in Canada, Latin and South America, Europe, Africa, Asia and Australia.
Competition
We compete in the hydrological, meteorological and oceanic monitoring markets and are aware of both domestic and foreign competitors who offer products, systems, and services of their own as well as companies that are systems integrators who primarily offer real-time networks from components manufactured by others. We are aware of numerous firms, ranging in size, that offer competitive dataloggers, high data rate satellite transmitters, sensors and other instruments and software.
Several of these companies have financial, research and development, marketing, management and technical resources substantially greater than ours. We may also be at a competitive disadvantage because we purchase certain sensors and other equipment components, as well as computer hardware and peripheral equipment, from manufacturers who are or may become competitors with respect to one or more of our products.
- 7 -
With respect to our professional engineering and technical services, we are in competition with numerous diverse engineering and consulting firms, many of which have larger staffs and facilities, and are better known, have greater financial resources, and have more experience. As to hydrological services, we are aware that many firms offer maintenance services; some of these companies have larger staffs, are better equipped, and have greater financial, marketing and management resources. Price, features, product quality, promptness of delivery, customer service and performance are believed to be the primary competitive factors with respect to all of our products and services.
Customers
During 2009, approximately 35% of our products and services were sold to the Federal Government. Net sales and revenues in 2009 among the various agencies were as follows: Department of the Interior, 18%; Department of Commerce, 9%; Department of Defense, 7% and Other Federal Agencies, 1%. The revenues from the Department of the Interior were among the U.S. Geological Survey and the Bureau of Reclamation. The revenue from the Department of Defense was primarily from the U.S. Army Corps of Engineers. The revenue from the Department of Commerce was from sales of tides systems and spares to NOS and SatLink2 Transmitters to the National Data Buoy Center. The loss of any significant portion of our sales to any major customer, the loss of a single major customer or budgetary constraints of any one of our major customers could have a material adverse effect on our business and financial results. We also performed on various contracts of foreign origin. Revenues from foreign customers amounted to approximately 48% of revenues in 2009, 42% of revenues in 2008 and 40% of revenues in 2007.
Research and Development
During the years ended December 31, 2009, 2008, 2007 and 2006, we incurred expenses of $1,635,161, $1,228,661, $1,293,207 and $1,358,624, respectively, on activities relating to the development of new products and enhancements and improvements of existing products. In 2009, we focused on software enhancements to the Xpert datalogger and to the SatLink2 Transmitter/Logger and released our SatLink2B Transmitter/Logger into production. We released our Wireless Link into production which provides a way for an SDI-12 data recorder to read one or more SDI-12 sensors located up to 1 mile away using un-licensed band radios. We completed work on a Small Business Innovation Research (SBIR) contract that was awarded in 2007. The SBIR was to develop and test a prototype (preliminary design and specifications) for a "DCPI Low Power and Low Cost Command Receiver". The new DCPI (Data Collection Platform with Interrogate Capability) employing DS-CDMA RF transmission techniques allow two-way communication through the GOES Satellite System and other geostationary satellite systems.
Patents, Trademarks, Copyrights and Agreements
We may in the future seek patents for certain products, real-time networks, and technology as well as software products, real-time networks, and technology. We treat our products, real-time networks, technology and software as proprietary and rely on trade secret laws and internal non-disclosure safeguards rather than making our designs and processes generally available to the public by applying for patents. We believe that, because of the rapid pace of technological change in the computer, electronics and telecommunications industries, patent and copyright protection is of less significance than factors such as the knowledge and experience of our personnel and their ability to design and develop enhanced and new products, real-time networks and their components.
Manufacturing
Our manufacturing operations consist of materials planning and procurement, final assembly, product assurance testing, quality control, and packaging and shipping. We currently use several independent manufacturers to provide certain printed circuit boards, chassis and subassemblies. We believe that the efficiency of our manufacturing process to date is largely due to our product architecture and our commitment to manufacturing process design. We have spent significant engineering resources producing customized software to assure consistent high product quality. Products are tested after the assembly process using internally developed automated product assurance testing procedures.
Our products use certain components, such as microprocessors, memory chips and pre-formed enclosures that are acquired or available from one or a limited number of sources. We have generally been able to procure adequate
- 8 -
supplies of these components in a timely manner from existing sources. While most components are standard items, certain application-specific integrated circuit chips used in many of our products are customized to our specifications. None of the suppliers of components operate under contract. Additionally, availability of some standard components may be affected by market shortages and allocations. Our inability to obtain a sufficient quantity of components when required or to develop alternative sources at acceptable prices and within a reasonable time could result in delays or reductions in product shipments which could materially affect our operating results in any given period. In addition, as referenced above, we rely heavily on outsourcing subcontractors for production. The inability of such subcontractors to deliver products in a timely fashion or in accordance with our quality standards could materially affect our operating results and business.
We received an ISO 9001 certification on March 12, 1999 and an ISO 9001:2000 certification on August 13, 2003. We continued to be certified during fiscal year 2009.
Government Regulation
We manufacture some of our products and provide some of our services under contracts with the United States government. We manufacture other products under contracts with private third parties who utilize our products to satisfy United States government contracts to which they are a party. Federal acquisition regulations and other federal regulations govern these relationships. Some of these regulations relate specifically to the seller-purchaser relationship with the government (which may exist on our own account, or that of one or more of our clients), such as the bidding and pricing rules. Under regulations of this type, we must observe pricing restrictions, produce and maintain detailed accounting data, and meet various other requirements.
Other regulations relate to the conduct of our business generally, such as regulations and standards established by the Occupational Safety and Health Act or similar state laws and relating to employee health and safety. In particular, regulations governing these contracts require that we comply with federal laws and regulations, in general, or face civil liability, cancellation or suspension of existing contracts, or ineligibility for future contracts or subcontracts funded in whole or in part with federal funds. In addition, loss of governmental certification (affirming that we are eligible to participate on government contracted work) could cause some of our customers to reduce or cease making purchases from us, which would adversely impact our business.
Foreign Operations
We opened a branch office in New Delhi, India in December 2004. The branch office was established in order to comply with India tax law after the Advance Tax Court of India determined that we had a Permanent Establishment in India as a result of the employment of a full-time Country Manager. The branch office can perform sales and marketing and installation and maintenance activities but is restricted from bidding on domestic Indian tenders. We began the process of forming a wholly owned subsidiary in India in 2004 in order to bid on domestic India tenders. Formal approval of the wholly owned subsidiary was given in February 2005. Our India Operations procures local goods for projects and performs systems integration, civil works construction, installation, commissioning and maintenance services including maintaining over 260 remote automatic real-time hydromet monitoring stations under contracts with the CWC and with the Government of Andhra Pradesh.
Employees
As of December 31, 2009, we and our wholly owned subsidiary had a total of 90 employees, of which 87 were full time. We also from time to time employ part-time employees and hire independent contractors. Our employees are not represented by any collective bargaining agreement and we have never experienced a work stoppage. We believe that our employee relations are good.
Backlog
At December 31, 2009, our backlog was approximately $11,908,000 as compared with approximately $7,239,000 at December 31, 2008. We anticipate that 80% of our 2009 year-end backlog will convert to revenue in 2010. An economic downturn may result in increased cancellation of orders, which could have a material adverse effect on our ability to convert our backlog into revenues. Other factors that may result in a cancellation of orders include
- 9 -
changes, delays or cancellation of government programs, political and economic business events and trade restrictions.
Item 1A ─ Risk Factors
The following are certain risk factors that could impact our business, financial results and results of operations. Investing in our Common Stock involves risks, including those described below. The risk factors below, among others, should be considered by prospective and current investors in our Common Stock before making or evaluating an investment in our securities. These risk factors could cause actual results and conditions to differ materially from those projected herein.
Our dependence on government business could adversely affect our operating results
Contracts and purchase orders with agencies of the United States government and various state and local governments represented approximately 45% of our revenues in fiscal year 2009. The success of our business is therefore materially dependent on governmental agencies. Companies engaged in government business are subject to certain unique risks not shared by the general commercial sector. Among these risks are:
|
•
|
a competitive procurement process with no guaranty of being awarded contracts;
|
||
|
•
|
dependence on congressional appropriations and administrative allotment of funds;
|
||
|
•
|
policies and regulations that can be changed at any time by Congress or a presidential administration;
|
||
|
•
|
changes in and delays or cancellations of government programs or requirements; and
|
||
|
•
|
some contracts with Federal, state and local government agencies require annual funding and may be terminated at the agency’s discretion.
|
A reduction or shift in spending priorities by government agencies could limit or eliminate the continued funding of our existing government contracts. These reductions or shifts in spending, if significant, could have a material adverse effect on our business.
Our dependence on international sales involves significant risk
Sales and services to customers outside the United States accounted for approximately 48%, 42%, 40% and 36% of our sales for fiscal 2009, 2008, 2007 and 2006, respectively. We expect that our non-U.S. sales and services will continue to grow and account for a higher percentage of overall future revenues. International business operations may be adversely affected by many factors, including fluctuations in exchange rates, imposition of government controls, trade restrictions, political, economic and business events and social and cultural differences.
Intense competition can adversely affect our operating results
The hydro-meteorological monitoring equipment and systems market is intensely competitive. Significant competitive factors include price, technical capabilities, quality, automation, reliability, product availability and customer service. We face competition from established and potential new competitors, many of whom have greater financial, engineering, manufacturing and marketing resources than us. New products offered by our competitors could cause a decline in our revenue or a loss of market acceptance of our existing products and services. Increased competitive pressure could also lead to intensified price-based competition. Price-based competition may result in lower prices, adversely affecting our operating results.
- 10 -
The variability of our quarterly operating results can be significant
Our future revenues and operating results may vary significantly from quarter-to-quarter as a result of a number of factors, many of which are outside our control. These factors include the relatively large size of project or tender business, unpredictability in the number and timing of international sales, length of the sales cycle, delays in installations and changes in customer’s financial condition or budgets.
Managing costs while planning for growth will be critical
We believe that we must expand our technical workforce to develop new products, enhance existing products and serve the needs of our existing and anticipated customer base. Our ability to successfully expand our operations will depend, in large part, upon our ability to attract and retain highly qualified employees. Our ability to manage our planned growth effectively also will require that we continue to (1) improve our operational, management, and financial systems and controls, (2) train, motivate, and manage our employees and (3) increase our operating expenses in anticipation that our new products will increase future revenues.
Technological changes may make our products obsolete or result in decreased prices or increased expenses
Technological changes may make our services or products obsolete. Advances in technology may lead to significant price erosion for products. Our success will depend in part on our ability to develop and offer more advanced products in the future, to anticipate both future demand and the technology to supply that demand, to enhance our current products and services, to provide those products and services at competitive prices on a timely and cost-effective basis and to achieve market acceptance of those products and services. To accomplish these goals, we may be required to incur significant engineering expenses. As new products or services are introduced, we may experience warranty claims or product returns. We may not be able to accomplish these goals correctly or timely enough. If we fail in our efforts, our products and services may become less competitive or obsolete.
We do not rely on patents to protect our products or technology
We do not rely on patent or trade secret protection for our products or technology. Competitors may develop technologies similar to or more advanced than ours. We treat our products, real-time networks, technology and software as proprietary and rely on trade secret laws and internal non-disclosure safeguards rather than making our designs and processes generally available to the public by applying for patents. We cannot assure that our current or future products will not be copied or will not infringe on the patents of others. Moreover, the cost of litigation of any claim or damages resulting from infringement of patents or other intellectual property could adversely affect our business, financial condition and results of operations.
We may incur losses due to foreign currency fluctuations
Portions of our revenue are denominated in India rupees. Consequently, a portion of our costs, revenue and operating margins may be affected by fluctuations in exchange rates, primarily between the U.S. dollar and the India rupee. We recognized a foreign currency gain of approximately $50,000 in 2009, a foreign currency loss of approximately $180,000 in 2008, a foreign currency gain of approximately $179,000 in 2007 and a foreign currency loss of approximately $23,000 in 2006 due to intercompany payables owed to us by our India entities. Fluctuations between the U.S. dollar and the India rupee may have a material adverse effect on our financial results.
Acquisition and integration of new businesses could disrupt our ongoing business, distract management and employees, increase our expenses or adversely affect our business
A portion of our future growth may be accomplished through the acquisition of other businesses. The success of those acquisitions will depend, in part, on our ability to integrate the acquired personnel, operations, products, services and technologies into our organization, to retain and motivate key personnel of the acquired entities and to retain the customers of those entities. We may not be able to identify suitable acquisition opportunities, obtain financing on acceptable terms to bring the acquisition to fruition or to integrate such personnel, operations, products or services. The process of identifying and closing acquisition opportunities and integrating acquisitions into our operations may distract our management and employees, disrupt our ongoing business, increase our expenses and materially and adversely affect our operations. We may also be subject to certain other risks if we acquire other entities, such as the assumption of additional liabilities. We may issue additional equity securities or incur debt to pay for future acquisitions.
- 11 -
We do not have contracts with key suppliers
We have no written contracts with any of our suppliers. Our suppliers may terminate their relationships with us at any time without notice. There can be no assurance that we will be able to find satisfactory replacement suppliers or that new suppliers will not be more expensive than the current suppliers if any of our suppliers were to terminate their relationship with us.
We are highly dependent on key personnel
Our success has depended, and to a large extent will depend, on the continued services our key senior executives, and engineering, marketing, sales, production and other personnel. We do not have an employment agreement with any of our key personnel with one exception. The loss of these key personnel, who would be difficult to replace, could harm our business and operating results. Competition for management in our industry is intense and we may be unsuccessful in attracting and retaining the executive management and other key personnel that we require.
The restatement of our historical financial statements has already consumed and may continue to consume a significant amount of our time and resources and may have a material adverse effect on our business and stock price
As described earlier, we have restated our consolidated financial statements. The restatement process was time-consuming and involved significant attention from management. Although we have now completed the restatement, we cannot guarantee that we will not have inquires from the SEC or Nasdaq regarding our restated financial statements. We anticipate that any inquiries will be time-consuming. Also, some companies that have been required to restate their historical financial statements have experienced a decline in stock price and stockholder lawsuits related thereto.
Item 1B – Unresolved Staff Comments
Not applicable
Item 2 - Properties
Our corporate headquarters are located at 22400 Davis Drive, Sterling, Virginia. We lease this 27,800 square foot facility and it contains our administrative offices, sales and marketing offices and manufacturing facilities. The lease expires in May 31, 2019.
We lease 2,850 square feet of office and warehouse space in West Palm Beach, Florida. The three-year lease expires in August 2011. The Hydrological Services division uses this space which consists of both office and warehouse space. The Hydrological Services Division also occupies 800 square feet of leased office space in Lakeland, Florida. The lease expires on October 31, 2010. This space is used for sales and marketing and engineering offices.
We lease office space and furniture in New Delhi, India. The leases were extended until September 2012. Our wholly owned subsidiary uses this space for their offices.
We believe that our facilities are adequate for our present needs and that our properties are in good condition, well maintained and adequately insured.
Item 3 - Legal Proceedings
Various legal claims can arise from time to time in the normal course of business which, in the opinion of management, will have no material effect on our financial statements. We have been named in a compensation claim under the Indian Anti-Trust Law that has pending before The Monopolies and Restrictive Trade Practices Commission in New Delhi, India since 2005. Management believes that the case is unsubstantiated and intends to vigorously defend itself.
- 12 -
Item 4 - Submission of Matters to a Vote of Security Holders
Not applicable
PART II
Item 5 - Market for Registrant's Common Equity, Related Stockholder Matters and Issuer Purchases of Equity Securities
Market Information
Our common stock trades on the Nasdaq Capital Market (formerly the Nasdaq SmallCap Market) under the symbol “STRN”. The table below sets forth the high and low sales prices for the periods shown.
|
Fiscal year ended December 31, 2008
|
||||||||
|
First Quarter
|
$ | 10.81 | $ | 5.75 | ||||
|
Second Quarter
|
$ | 8.31 | $ | 6.18 | ||||
|
Third Quarter
|
$ | 7.95 | $ | 3.33 | ||||
|
Fourth Quarter
|
$ | 10.30 | $ | 2.83 | ||||
|
Fiscal year ended December 31, 2009
|
||||||||
|
First Quarter
|
$ | 10.00 | $ | 3.75 | ||||
|
Second Quarter
|
$ | 5.99 | $ | 3.51 | ||||
|
Third Quarter
|
$ | 6.62 | $ | 5.48 | ||||
|
Fourth Quarter
|
$ | 7.50 | $ | 5.78 | ||||
Stockholders
On March 28, 2010, there were approximately 865 stockholders of record.
The graph below compares our cumulative total shareholder return of the Common Stock of the Company with the cumulative total return on the NASDAQ Composite Index and the NASDAQ Computer Index for the five year period ending December 31, 2008. The graph assumes an investment of $100 on December 31, 2004 when the closing price was $8.90 per share. The comparison in the graph is not intended to forecast future performance of Common Stock.
- 13 -
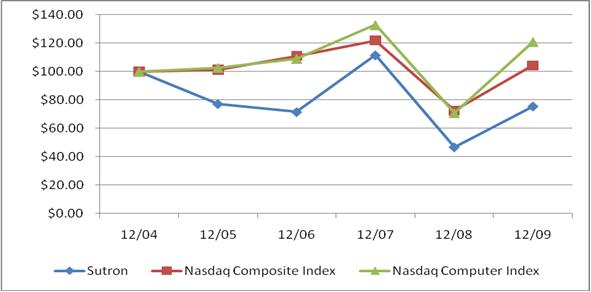
| 12/04 | 12/05 | 12/06 | 12/07 | 12/08 | 12/09 | |||||||||||||||||||
|
Sutron Corporation
|
$ | 100.00 | $ | 77.21 | $ | 71.53 | $ | 111.55 | $ | 46.74 | $ | 75.53 | ||||||||||||
|
NASDAQ Composite Index
|
$ | 100.00 | $ | 101.37 | $ | 111.03 | $ | 121.92 | $ | 72.49 | $ | 104.31 | ||||||||||||
|
NASDAQ Computer Index
|
$ | 100.00 | $ | 102.75 | $ | 109.07 | $ | 132.90 | $ | 70.85 | $ | 121.03 | ||||||||||||
Dividend Policy
We have never declared or paid a dividend on our common stock. We intend to retain future earnings to fund development and growth of our business.
Item 6 – Selected Financial Data
The following table sets forth consolidated financial data with respect to Sutron Corporation for the five year period ended December 31, 2009. The information set forth below should be read in conjunction with “Management’s Discussion and Analysis of Financial Condition and Results of Operations” and the Consolidated Financial Statements and related notes included elsewhere in this Form 10-K.
The data for the years ended December 31, 2008, 2007 and 2006 have been restated to reflect the effects of the accounting errors discussed in Note 3 to the Consolidated Financial Statements.
| (In thousands, except earnings per share data)
Years Ended December 31,
|
||||||||||||||||||||
|
2009
|
2008
|
2007
|
2006
|
2005
|
||||||||||||||||
|
(Restated)
|
(Restated)
|
(Restated)
|
||||||||||||||||||
|
Income Statement Data
|
||||||||||||||||||||
|
Revenues
|
$ | 20,851 | $ | 15,941 | $ | 18,868 | $ | 19,407 | $ | 15,434 | ||||||||||
|
Operating income
|
3,333 | 719 | 2,797 | 2,934 | 2,203 | |||||||||||||||
|
Net Income
|
2,229 | 499 | 1,856 | 1,871 | 1,470 | |||||||||||||||
|
Basic earnings per share
|
.49 | .11 | .41 | .43 | .34 | |||||||||||||||
|
Diluted earnings per share
|
.45 | .10 | .37 | .39 | .30 | |||||||||||||||
|
Shares used in computing basic per share data
|
4,571 | 4,550 | 4,513 | 4,342 | 4,292 | |||||||||||||||
|
Shares used in computing diluted per share data
|
4,975 | 5,052 | 4,982 | 4,811 | 4,933 | |||||||||||||||
|
Balance Sheet Data
|
||||||||||||||||||||
|
Cash
|
$ | 5,700 | $ | 4,490 | $ | 5,434 | $ | 1,677 | $ | 2,095 | ||||||||||
|
Working capital
|
13,931 | 11,654 | 11,364 | 9,430 | 6,844 | |||||||||||||||
|
Total assets
|
19,528 | 14,958 | 14,337 | 13,375 | 9,847 | |||||||||||||||
|
Long-term debt, including current portion
|
— | 3 | 40 | 88 | 137 | |||||||||||||||
|
Stockholders' equity
|
15,031 | 12,633 | 11,956 | 9,934 | 7,322 | |||||||||||||||
|
Cash dividends declared
|
— | — | — | — | — | |||||||||||||||
- 14 -
Item 7 - Management's Discussion and Analysis of Financial Condition and Results of Operations
The following discussion and analysis should be read in conjunction with our disclaimer on “Forward-Looking Statements,” “Item 1 – Business,” “Item 1A - Risk Factors,” “Item 6 – Selected Financial Data” and Consolidated Financial Statements, the notes to those statements and other financial information contained elsewhere in this Annual Report on Form 10-K. The information below reflects the impact of the restatement of our financial results which is more fully described in Note 3 to the Consolidated Financial Statements contained in this Annual Report on Form 10-K and under the paragraph” Restatement of Previously Issued Financial Statements” below and does not reflect any subsequent information or events occurring after the date of the filing of our reports originally presenting the financial information being restated or update any disclosure herein to reflect the passage of time since the date of such filings.
Restatement of Previously Issued Financial Statements
In March and April 2010, after discussions with management and our independent registered public accounting firm, the Audit Committee of the Board (the “Audit Committee”) recommended to the Board, and the Board thereafter concluded, that our previously issued consolidated financial statements for the years ended December 31, 2008, 2007 and 2006, including the quarterly periods be restated. The data for the years ended December 31, 2008, 2007 and 2006 have been restated to reflect the effects of the accounting errors discussed in Note 3 to our Consolidated Financial Statements and the Explanatory Note on page 4 of this 2009 Form 10-K. We have not amended our previously filed Annual Reports on Form 10-K for the fiscal years ended December 31, 2008, 2007 and 2006, or the Quarterly Reports on Form 10-Q for the periods ended March 31, 2006 through September 30, 2009 to reflect the restatements described in this Annual Report on Form 10-K, and thus the financial statements and related financial statement information contained in those reports should no longer be relied upon.
The restatement relates to errors in inventory standard costs that were not updated annually, and were as a result set in excess of inventory purchase costs, resulting in an overstatement of inventory values as of December 31, 2008, 2007 and 2006. The restatement also relates to errors in income tax expense for tax deductions related to employee stock compensation for the years ended December 31, 2008, 2007 and 2006 that were not properly classified as additional paid-in capital resulting in the understatement of additional paid-in capital and income tax expense. For a discussion of the restatement, including the material adjustments to our previously issued financial statements, see Note 3 of the Notes to Consolidated Financial Statements.
Background and Overview
Our primary focus is to provide real-time systems solutions, including equipment and software, and services to our customers in the areas of hydrological meteorological and oceanic monitoring. We design, manufacture and market these products and services to a diversified customer base consisting of federal, state, local and foreign governments, engineering companies, universities and hydropower companies. Our products and services enable these entities to monitor and collect hydrological, meteorological and oceanic data for the management of critical water resources, for early warning of potentially disastrous floods, storms or tsunamis, for the optimization of hydropower plants and for providing real-time weather conditions at airports.
Our key products are the SatLink2 Transmitter/Logger, the Xpert/XLite dataloggers, the Accububble Self-Contained Bubbler, the Accubar Pressure Sensor, and Tempest and XConnect systems software. These are the essential components of most systems and are provided to customers as off-the-shelf equipment or as part of a custom system. The SatLink2 is a key product because it functions both as a transmitter and logger. The Xpert and XLite are more
- 15 -
powerful dataloggers that have significant more logging capability and communications options than the SatLink2. Our Tempest and XConnect systems software allow us to provide turn-key systems solutions to our customers.
Our Hydrological Services Division provides a variety of services including hydrologic modeling, flood and storm water management, river and stream analysis and equipment integration, installation, commissioning and maintenance. The principal customer of this division has been the South Florida Water Management District (SFWMD) which is a regional agency of the state of Florida that is charged with managing and protecting water resources in a 16 county area.
We are beginning fiscal year 2010 with a backlog of approximately $11,908,000 as compared to beginning fiscal year 2009 with a backlog of approximately $7,239,000. We estimate that approximately 80% of our December 31, 2009 backlog will convert to revenue in 2010. We anticipate that we will continue to experience significant quarterly fluctuations in our sales and revenues in 2010. Operating results will depend upon the product mix and upon the timing of project awards.
International sales, which totaled 48% of revenues for 2009, continue to constitute a more significant portion of our revenues. We expect international revenues to grow as a percentage of our total business. International sales are however difficult to forecast and international awards are frequently delayed due to governmental approvals.
Our domestic business is highly dependent upon government business. Contracts and purchase orders with Federal, state and local government agencies represented approximately 45% of our 2009 revenues. Due to economic conditions in 2009, we believe that competition was more price-based and that some projects were delayed due to funding issues. We are closely following the federal economic stimulus plan. We believe that we will benefit from increased future spending on water resources projects from our federal and state customers.
We are committed to growing our hydrological services however our primary customer in Florida has expanded the pool of qualified contractors on all our contracts. We therefore must expand our business outside of SFWMD. We also hope to sell more standard products through our Hydrological Services which was a primary reason for setting up operations in Florida. We added the Ilex Division through our purchase of Ilex Engineering on December 31, 2008 and believe that Ilex will help us compete better in the GOES data collection services market and global satellite market, both domestically and internationally.
We are committed in our ongoing sales, marketing and research and development activities to sustain and grow our sales and revenues from our products and services. We expect our sales and marketing, research and development and general and administrative expenses to increase moderately in 2010 as compared to 2009 due to planned spending sales and marketing activities and on new products and applications.
Critical Accounting Policies and Estimates
The discussion and analysis of financial condition and results of operations is based upon the consolidated financial statements, which have been prepared in accordance with accounting principles generally accepted in the United States. The preparation of these financial statements requires us to make estimates and judgments that affect the reported amounts of assets, liabilities, revenues and expenses, and related disclosure of contingent assets and liabilities. We evaluate, on an on-going basis, our estimates and judgments, including those related to bad debts, excess and obsolete inventories, warranty obligations, income taxes, contingencies and litigation. Our estimates are based on historical experience and assumptions that we believe to be reasonable under the circumstances, the results of which form the basis for making judgments about the carrying values of assets and liabilities that are not readily apparent from other sources. Actual results may differ from these estimates under different assumptions or conditions.
We believe the following critical accounting policies, among others, affect our more significant judgments and estimates used in the preparation of the consolidated financial statements.
|
·
|
Revenue recognition;
|
|
·
|
Allowance for doubtful accounts;
|
- 16 -
|
·
|
Allowances for excess and obsolete inventories;
|
|
·
|
Accounting for warranty obligations;
|
|
·
|
Accounting for income taxes;
|
|
·
|
Accounting and valuation of stock option compensation.
|
Revenue Recognition – Revenue for our products, consisting of both equipment and software, is recognized upon shipment, delivery, installation or customer acceptance of the product, as agreed in the customer order or contract. We do sell our software products without the related equipment although software products are integral to systems. Our typical system requires no significant production, modification or customization of the software or hardware. For complex systems, revenue is deferred until customer acceptance. We do provide customer discounts and do allow for product returns. We do not do consignment sales or bill and hold. Revenue reflects reductions due to discounts and product returns. Product returns have historically been insignificant in amount.
Our sales arrangements for systems often include services in addition to equipment and software. These services could include equipment integration, software customization, installation, maintenance, training, and customer support. For sales arrangements that include bundled hardware, software and services, we account for any undelivered service offering as a separate element of a multiple-element arrangement. Amounts allocated to each element are based on its objectively determined fair value, such as the sales price for the product or service when it is sold separately. Revenue for these services is typically recognized ratably over the period benefited or when the services are complete.
We use the percentage of completion method for recognizing revenue and profits when we perform on fixed price contracts that extend over a number of years. Under the percentage of completion method, revenue and profits are recorded as costs are incurred based on estimates of total sales value and costs at completion where total profit can be estimated with reasonable accuracy and ultimate realization is reasonably assured. Profit estimates are revised periodically based upon changes and facts, and any losses on contracts are recognized immediately. Contracts may contain provisions to earn incentive and award fees if targets are achieved. Incentive and award fees that can be reasonably estimated are recorded over the performance period of the contract. Incentive and award fees that cannot be reasonably estimated are recorded when awarded. We recognize revenue from time-and-materials contracts to the extent of billable rates, times hours delivered, plus direct materials costs incurred. Some of the contracts include provisions to withhold a portion of the contract value as retainage. Our policy is to take into revenue the full value of the contract, including any retainage, as we perform against the contract.
Allowance for Doubtful Accounts – Accounts receivable arise from the normal course of selling products on credit to customers. An allowance for doubtful accounts has been provided for estimated uncollectable accounts. Accounts receivable balances, historical bad debts, customer concentrations, customer creditworthiness, current economic trends and changes in customer payment terms and practices are analyzed when evaluating the adequacy of the allowance for doubtful accounts. Individual accounts are charged against the allowance when collection efforts have been exhausted.
Inventory Valuation – Our inventories are stated at the lower of cost or market. We provide allowances on inventories for any material that has become obsolete or may become unsalable based on estimates of future demand and sale price in the market. Judgments with respect to salability and usage of inventories, estimated market value, and recoverability upon sale are complex and subjective. Such assumptions are reviewed periodically and adjustments are made, as necessary, to reflect changed conditions.
Warranty Obligations – We warranty our products for up to two years and estimated warranty costs are based upon management’s best estimate of the amounts necessary to settle future and existing claims on equipment sold as of the balance sheet date. Factors considered include actual past experience of product returns and the related estimated cost of labor and material to make the necessary repairs as well as technological advances and enhanced design and manufacturing processes. If actual future product return rates or the actual costs of material and labor differ from the estimates, adjustments to the accrued warranty liability are made.
- 17 -
Income Taxes – We are taxed as a domestic U.S. corporation under the Internal Revenue Code. Deferred income tax assets and liabilities are recognized for the expected future tax consequences of events that have been included in the consolidated financial statements or tax returns. Deferred income tax assets and liabilities are determined based on the differences between the financial statement and tax basis of assets and liabilities using currently enacted tax rates in effect for the years in which the differences are expected to reverse. Deferred tax assets are evaluated and a valuation allowance is established if it is more likely than not that all or a portion of the tax asset will not be utilized.
Stock Option Compensation – We adopted the provisions of FASB ASC 718 Compensation – Stock Compensation on January 1, 2006, which requires the measurement and recognition of compensation expense for all share-based payment awards to employees and directors based on estimated fair values. Additionally, the Corporation follows the Securities and Exchange Commission’s Staff Accounting Bulletin Share-Based Payment which provides supplemental ASC 718 application guidance based on the views of the SEC.
The Corporation adopted ASC 718 using the modified prospective transition method. Under this transition method, share-based compensation expense recognized during the year ended December 31, 2006 included: (a) compensation expense for all share-based awards granted prior to, but not yet vested, as of January 1, 2006, based on the grant date fair value estimated in accordance with the original provisions of SFAS 123, and (b) compensation expense for all share-based awards granted beginning January 1, 2006, based on the grant date fair value estimated in accordance with the provisions of ASC 718. In accordance with the modified prospective transition method, the Corporation's consolidated financial statements for prior periods have not been restated to reflect the impact of ASC 718.
Results of Operations
The following table sets forth, for the periods presented, certain income statement data of the Company expressed as a percentage of revenues:
| Year ended December 31, | |||||||
|
2009
|
2008
|
2007
|
2006
|
||||
|
(Restated)
|
(Restated)
|
(Restated)
|
|||||
|
Net sales and revenues
|
100%
|
100%
|
100%
|
100%
|
|||
|
Cost of sales and revenues
|
58.1
|
65.6
|
60.6
|
62.7
|
|||
|
Gross profit
|
41.9
|
34.4
|
39.4
|
37.3
|
|||
|
Selling, general and administrative expenses
|
18.0
|
22.2
|
17.7
|
15.1
|
|||
|
Research and Development expenses
|
7.9
|
7.7
|
6.9
|
7.0
|
|||
|
Operating income
|
16.0
|
4.5
|
14.8
|
15.2
|
|||
|
Interest income
|
1.0
|
0.7
|
0.7
|
0.3
|
|||
|
Income before income taxes
|
17.0
|
5.2
|
15.5
|
15.5
|
|||
|
Income taxes
|
6.3
|
2.1
|
5.6
|
5.8
|
|||
|
Net income
|
10.7%
|
3.1%
|
9.9%
|
9.7%
|
|||
Fiscal 2009 Compared to Fiscal 2008 (Restated)
Net Sales and Revenues
Revenues for the year ended December 31, 2009 increased 31% to $20,851,144 from $15,941,328 in 2008. Net sales and revenues are broken down between sales of standard products and sales of systems and services.
Standard products had a net sales and revenue increase of 37% to $11,791,235 in 2009 from $8,581,451 in 2008. The increase was primarily due to increased sales to federal government agencies and to international projects in India and Venezuela. Sales of standard products to Tamil Nadu Agricultural University (TNAU) totaled
- 18 -
approximately $1,040,000. Sales of standard products to UTE Dominion-ADASA, a consortium of Spanish firms, for 631 rainfall, hydrological, meteorological, and agricultural monitoring stations in Venezuela totaled approximately $1,066,000.
Net sales and revenues for systems and services increased 23% to $9,059,909 from $7,359,837 in 2008 primarily due to increased systems sales. Significant system sales in 2009 included the UTE Dominion-ADASA project in Venezuela totaling approximately $1,252,000 and TNAU systems sales of approximately $1,410,000. The Ilex Division had sales of approximately $698,000 for the full year. Our India subsidiary also experienced increased annual maintenance contract revenues. These increases offset decreased revenues due to the completion of our contract with the Ministry of Energy and Water in Afghanistan in October 2009, decreased sales of hydrological services and decreased sales of airport weather systems.
Overall domestic revenues increased 19% to $10,940,894 in 2009 versus $9,222,662 in 2008 while international revenues increased 48% to $9,910,250 in 2009 versus $6,718,666 in 2008. The Department of the Interior, the principal agencies being the US Geological Survey and the Bureau of Reclamation, was our largest customer accounting for 18% and 19% of total revenues in years 2009 and 2008, respectively. Federal government revenues were 35% and 33% of revenues in 2009 and 2008. State and local government, commercial and international revenues represented 65% and 67% of revenues in 2009 and 2008.
Cost of Sales and Revenues
Cost of sales as a percentage of revenues decreased to 58% for 2009 compared to 66% for 2008. Cost of sales for standard products was approximately 51% in 2009 as compared to 48% in 2008. The increase for standard products was primarily due to the product mix and due to discounts provided to customers on several large orders. Cost of sales for systems and services was 67% in 2009 as compared to 87% in 2008. The decrease was primarily due to increased project activity and sales volume and higher utilization of personnel. Cost of sales for both 2009 and 2008 include provisions for inventory obsolescence, physical inventory adjustments, inventory valuation adjustments and warranty provision adjustments. We continually pursue product cost reductions through continual review of procurement sourcing based on quality and cost goals, product value engineering and improvements in manufacturing processes.
Selling, General and Administrative Expenses
Selling, general and administrative expenses were $3,762,291 in 2009 as compared to $3,544,065 in 2008, a 6% increase. Selling, general and administrative expenses as a percentage of revenues decreased to 18% in 2009 from 22.2% in 2008 due to the increased sales volume in 2009 as compared to 2008. We experienced lower general and administrative costs in 2009 due to lower legal and bank letter of credit fees which however were offset by higher selling expenses due to an increased agent commissions relating to international contracts, increased sales and marketing activities by our Integrated Services Division and sales and marketing expenses of our new Ilex Division.
Product Research and Development Expenses
Product research and development expenses increased to $1,635,161 in 2009 from $1,228,661 in 2008, a 33% increase. Research and development expenses as a percentage of revenues were 7.9% in 2009 as compared to 7.7% in 2008 due to the increased sales volume in 2009 as compared to 2008. In 2009, we focused on software enhancements to the Xpert datalogger and to the SatLink2 Transmitter/Logger and we released our SatLink2B Transmitter/Logger to production. We released our Wireless Link to production which provides a way for an SDI-12 data recorder to read one or more SDI-12 sensors located up to 1 mile away using un-licensed band radios. We completed work on a Small Business Innovation Research (SBIR) contract that was awarded in 2007. The SBIR was to develop and test a prototype (preliminary design and specifications) for a "DCPI Low Power and Low Cost Command Receiver" that allows two-way communication through the GOES Satellite System and other geostationary satellite systems.
- 19 -
Interest and Other Income, Net
Net interest and other income increased to $214,844 in 2009 as compared to $108,391 in 2008. In 2007, we brought a lawsuit against a former employee. We successfully settled the lawsuit in January 2009 in the amount of $150,000. The settlement provided for the immediate payment of $60,000. The remaining balance of $90,000 was secured by a promissory note that requires monthly payments over a five year period including interest at 4%.
Income Taxes
Income tax expense for 2009 was $1,319,000 compared to $328,000 for 2008. The provision for income taxes for 2009 represents an effective tax rate of approximately 37.2% compared with 39.6% for 2008.
Fiscal 2008 Compared to Fiscal 2007 (Restated)
Net Sales and Revenues
Net sales and revenues for 2008 decreased 16% to $15,941,328 from $18,868,101 in 2007. Net sales and revenues are broken down between sales of standard products and sales of systems and services.
Standard products had a net sales and revenue decrease of 14% to $8,581,451 in 2008 from $10,019,406 in 2007. The decrease was primarily due to decreased sales to federal government agencies and to decreased sales of standard products on international projects as compared to 2007 when sales of approximately $900,000 were made to customers in China for equipment that was supplied to the Three Gorges Dam. Net sales and revenues for systems and services decreased 17% to $7,359,837 in 2008 from $8,848,695 in 2007. The decrease was due to decreased systems sales as compared to 2007 when a large project was received from Washington International Group totaling approximately $2,200,000 for stream monitoring stations supplied to the Iraq Ministry of Water and due to decreased sales of hydrological services.
Overall domestic revenues decreased 19% to $9,222,662 in 2008 versus $11,334,987 in 2007 while international revenues decreased 11% to $6,718,666 in 2008 versus $7,533,113 in 2007. The Department of the Interior, the principal agencies being the US Geological Survey and the Bureau of Reclamation, was our largest customer accounting for 19% and 21% of total revenues in years 2008 and 2007, respectively. Federal government revenues were 33% in both 2008 and 2007. State and local government, commercial and international revenues represented 67% of revenues in 2008 and 2007.
Cost of Sales and Revenues
Cost of sales as a percentage of revenues increased to 66% for 2008 compared to 61% for 2007. Cost of sales for standard products was approximately 48% in 2008 as compared to 45% in 2007. The increase for standard products was primarily due to the lower sales volume resulting in lower absorption of fixed costs. Cost of sales for systems and services was 87% in 2008 as compared to 79% in 2007. The increase was primarily due to decreased project activity and sales volume and lower utilization of personnel. Cost of sales for both 2008 and 2007 include provisions for inventory obsolescence, physical inventory adjustments, inventory valuation adjustments and warranty provision adjustments. We continually pursue product cost reductions through continual review of procurement sourcing based on quality and cost goals, product value engineering and improvements in manufacturing processes.
Selling, General and Administrative Expenses
Selling, general and administrative expenses were $3,544,065 in 2008 as compared to $3,340,323 in 2007. Selling, general and administrative expenses as a percentage of revenues increased to 22.2% in 2008 from 17.7% in 2007. We experienced higher general and administrative costs in 2008 due to increases in Board of Director annual retainers and fees, legal costs relating to our Ilex acquisition, audit fees and project management costs relating to the build-out of our new corporate headquarters and production facility. We experienced higher selling expenses in 2008 relating to our India operations and our Hydrological Services Division.
- 20 -
Product Research and Development Expenses
Product research and development expenses decreased to $1,228,661 in 2008 from $1,293,207 in 2007. Research and development expenses as a percentage of revenues increased to 7.7% in 2008 from 6.9% in 2007 which is attributable to the decrease in revenues. In 2008, we focused our product development on enhancements to the Xpert datalogger and to the SatLink2 Transmitter/Logger. We developed a total precipitation gage upgrade kit for the National Weather Service that resulted in a contract award of approximately $765,000 in September 2008. We also performed work on a Small Business Innovation Research (SBIR) contract in the amount of approximately $400,000 that was received in 2007. The SBIR was to continue to develop and test a prototype (preliminary design and specifications) for a "DCPI Low Power and Low Cost Command Receiver" that allows two-way communication through the GOES Satellite System and other geostationary satellite systems.
Interest and Other Income, Net
We earned net interest income of $108,391 in 2008 as compared with net interest income of $121,448 in 2007. Although our cash and cash equivalent balances were higher throughout 2008 as compared to 2007, the decrease in interest rates caused a decrease in net interest income.
Income Taxes
Income tax expense for 2008 was $328,000 compared to $1,063,000 for 2007. The provision for income taxes for 2008 represents an effective tax rate of approximately 39.6% compared with 36.4% for 2007.
Fiscal 2007 Compared to Fiscal 2006 (Restated)
Net Sales and Revenues
Net sales and revenues for 2007 decreased 3% to $18,868,101 from $19,406,638 in 2006. Net sales and revenues are broken down between sales of standard products and sales of systems and services.
Standard products had a net sales and revenue increase of 9% to $10,019,406 in 2007 from $9,233,807 in 2006. The increase was primarily due to increased sales to federal government agencies. Net sales and revenues for systems and services decreased 13% to $8,848,695 in 2007 from $10,172,831 in 2006. The decrease was primarily due to decreased systems sales in India as compared to 2006.
Overall domestic revenues decreased 10% to $11,334,987 in 2007 versus $12,525,079 in 2006 while international revenues increased 9% to $7,533,113 in 2007 versus $6,881,559 in 2006. The Department of the Interior, the principal agencies being the US Geological Survey and the Bureau of Reclamation, was our largest customer accounting for 21% and 17% of total revenues in years 2007 and 2006, respectively. Federal government revenues were 33% in both 2007 and 42% in 2006. State and local government, commercial and international revenues represented 67% of revenues in 2007 and 58% in 2006.
Cost of Sales and Revenues
Cost of sales as a percentage of revenues decreased to 60.6% for 2007 compared to 62.7% for 2006. Cost of sales for standard products was approximately 45% in 2007 as compared to 50% in 2006. The decrease for standard products was primarily due to changes in the product mix. Cost of sales for systems and services was 79% in 2007 as compared to 74% in 2006. The increase was primarily due to decreased project activity and sales volume and lower utilization of personnel. Cost of sales for both 2007 and 2006 include provisions for inventory obsolescence, physical inventory adjustments, inventory valuation adjustments and warranty provision adjustments. We continually pursue product cost reductions through continual review of procurement sourcing based on quality and cost goals, product value engineering and improvements in manufacturing processes.
Selling, General and Administrative Expenses
Selling, general and administrative expenses were $3,340,323 in 2007 as compared to $2,936,925 in 2006. Selling, general and administrative expenses as a percentage of revenues increased to 17.7% in 2007 from 15.1% in 2006.
- 21 -
The increased expenses were primarily due to the addition of two domestic salesmen in 2007, higher legal costs relating to a lawsuit against a former employee to recover monetary damages, SOX 404 compliance costs and higher standby letter of credit fees relating to performance bonds for various international projects.
Product Research and Development Expenses
Product research and development expenses decreased to $1,293,207 in 2007 from $1,358,624 in 2006. Research and development expenses as a percentage of revenues decreased to 6.9% in 2007 from 7% in 2006. In 2007, product development focused on two water level sensors. The first was a radar water level sensor which is a precision water level measuring instrument that uses radar pulses without direct contact with the water surface. The second was a continuous flow bubbler system which operates in severe cold conditions. We also continued to focus on enhancements to the Xpert and XLite dataloggers that were upgraded in 2006 and released in 2007.
Interest and Other Income, Net
We earned net interest income of $121,448 in 2007 as compared with net interest income of $68,394 in 2006. Higher cash and cash equivalent balances were responsible for the increase in net interest income.
Income Taxes
Income tax expense for 2007 was $1,063,000 compared to $1,132,000 for 2006. The provision for income taxes for 2007 represents an effective tax rate of approximately 36.4% compared with 37.7% for 2006.
Off-Balance Sheet Arrangements
The Company is not a party to any off-balance sheet transactions, arrangements or obligations that have, or are reasonably likely to have, a material effect on the Company’s financial condition, changes in the financial condition, revenues or expenses, results of operations, liquidity, capital expenditures or capital resources. The Company provides bid and performance bonds to customers that are secured either by cash or under the Company’s credit facility with our bank. If the Company fails to meet its bid or performance requirements, these bonds may be drawn upon by the customer resulting in the bank making payment to the customer in an amount not to exceed the amount of the respective bond.
Liquidity and Capital Resources
Cash and cash equivalents were $4,666,983 at December 31, 2009 compared to $3,705,475 at December 31, 2008. Working capital increased to $13.9 million at December 31, 2009 compared with $11.7 million at December 31, 2008.
Net cash provided by operating activities was $1,590,116 for the year ended December 31, 2009, compared to cash used by operating activities was $379,753 for the year ended December 31, 2008, compared to net cash provided by operating activities was $3,925,274 for the year ended December 31, 2007 and compared to cash used by operating activities of $934,148 for the year ended December 31, 2006. The increase in 2009 was due to a decrease in income taxes receivable and an increase in accrued expenses. The decrease in 2008 was due to a significant increase in income taxes receivable. The increase in 2007 was due to a significant decrease in accounts receivable in 2007. The decrease in 2006 was due to increased accounts receivable.
Net cash used by investing activities was $662,073 for the year ended December 31, 2009, compared to cash used by investing activities of $1,265,585 for the year ended December 31, 2008, compared to cash used by investing activities of $204,456 for the year ended December 31, 2007 and compared to cash used by investing activities of $45,885 for the year ended December 31, 206. Net cash used in 2009 was primarily for purchases of property and equipment and due to restricted cash that was used to secure performance bonds on international projects. The decrease in 2008 resulted primarily from the purchase of Ilex Engineering and due to restricted cash. Net cash used in 2007 and 2006 was primarily due to purchases of property and equipment.
- 22 -
Net cash used by financing activities was $2,765 for the year ended December 31, 2009 due payments on notes payable. Net cash provided by financing activities was $91,959 for the year ended December 31, 2008 as compared to net cash provided by financing activities was $95,306 for the year ended December 31, 2007 and as compared to net cash provided by financing activities was $668,934 for the year ended December 31, 2006 due primarily to tax benefits relating to tax deductible employee compensation associated with the exercise of non-qualified stock options.
We have a revolving credit facility of $3,000,000 with Branch Banking and Trust (BB&T). We are permitted to borrow based on accounts receivable and inventory according to pre-established criteria. The credit facility expires on August 5, 2010 and is secured by substantially all assets of the Company. Borrowings bear interest at the bank’s prime rate. During 2009, there was no borrowing on the line of credit. We frequently bid on and enter into international contracts that require bid and performance bonds. At December 31, 2009 and 2008, BB&T had issued standby letters of credit in the amount of $411,000 and $1,010,238 that served as either bid or performance bonds. The amount available to borrow under the line of credit was reduced by these amounts.
Management believes that its existing cash resources, cash flow from operations and short-term borrowings on the existing credit line will provide adequate resources for supporting operations during fiscal 2010. Although there can be no assurance that our revolving credit facility will be renewed, management believes that, if needed, it would be able to find alternative sources of funds on commercially acceptable terms.
Item 7A – Quantitative and Qualitative Disclosures about Market Risk
Foreign Currency Exchange Rate Risk
Although the majority or our sales, costs of sales and selling costs are transacted in U.S. dollars, a portion of our revenue is denominated in India rupees. Consequently, a portion of our revenues, costs and operating margins may be affected by fluctuations in exchange rates between the U.S. dollar and the India rupee. We recognized a foreign currency gain of approximately $50,000 in 2009, a foreign currency loss of approximately $180,000 in 2008, and a foreign currency gain of approximately $179,000 in 2007 due to intercompany payable balances owed to us by our Sutron India entities. Fluctuations between the U.S. dollar and the India rupee may have a material adverse effect on our financial results.
Interest Rate Risk
We currently invest our cash balances, in excess of our current needs, in an interest bearing savings account and in a certificate of deposit. We do not invest for the purposes of trading in securities. We do not use derivative financial instruments in our investments.
- 23 -
Item 8 - Financial Statements and Supplementary Data
SUTRON CORPORTION
INDEX TO CONSOLIDATED FINANCIAL STATEMENTS
| Report of Independent Registered Public Accounting Firm | 25 |
| Report of Independent Registered Public Accounting Firm | 26 |
| Consolidated Balance Sheets at December 31, 2009, 2008, 2007 and 2006 | 27 |
| Consolidated Statements of Operations for the Years ended December 31, 2009, 2008, 2007 and 2006 | 28 |
| Consolidated Statements of Stockholders' Equity for the Years ended December 31, 2009, 2008, 2007 and 2006 | 29 |
| Consolidated Statements of Cash Flows for the Years ended December 31, 2009, 2008, 2007 and 2006 | 30 |
| Notes to Consolidated Financial Statements | 31 |
- 24 -
REPORT OF INDEPENDENT REGISTERED PUBLIC ACCOUNTING FIRM
To the Board of Directors and Stockholders
Sutron Corporation and Subsidiary
Sterling, Virginia
We have audited the accompanying consolidated balance sheet of Sutron Corporation and Subsidiary as of December 31, 2009, and the related consolidated statements of operations, stockholders’ equity and cash flows for the year ended December 31, 2009. These financial statements are the responsibility of the Corporation’s management. Our responsibility is to express an opinion on these financial statements based on our audit.
We conducted our audit in accordance with the standards of the Public Company Accounting Oversight Board (United States). Those standards require that we plan and perform the audit to obtain reasonable assurance about whether the financial statements are free of material misstatement. An audit includes examining, on a test basis, evidence supporting the amounts and disclosures in the financial statements. An audit also includes assessing the accounting principles used and significant estimates made by management, as well as evaluating the overall financial statement presentation. We believe that our audit provides a reasonable basis for our opinion.
In our opinion, the financial statements referred to above present fairly, in all material respects, the financial position of Sutron Corporation and Subsidiary as of December 31, 2009, and the results of its operations and its cash flows for the year ended December 31, 2009, in conformity with U.S. generally accepted accounting principles.
We also have audited the adjustments described in note 3 that were applied to restate the 2008, 2007 and 2006 financial statements to correct certain errors. In our opinion, such adjustments are appropriate and have been properly applied. We were not engaged to audit, review or apply any procedures to the 2008, 2007 and 2006 financial statements of the Company other than with respect to the adjustments and accordingly, we do not express an opinion or any other form of assurance on the 2008, 2007 and 2006 financial statements taken as a whole.
 |
Winchester, Virginia
April 14, 2010
- 25 -
REPORT OF INDEPENDENT REGISTERED PUBLIC ACCOUNTING FIRM
To the Board of Directors and Stockholders
Sutron Corporation and Subsidiary
Sterling, Virginia
We have audited, before the effects of the adjustments for the correction of the errors described in Note 3, the consolidated balance sheets of Sutron Corporation and Subsidiary as of December 31, 2008, 2007, and 2006, and the related consolidated statements of operations, stockholders’ equity and cash flows for each of the three years in the period ended December 31, 2008. These financial statements are the responsibility of the Corporation’s management. Our responsibility is to express an opinion on these financial statements based on our audits.
We conducted our audits in accordance with the standards of the Public Company Accounting Oversight Board (United States). Those standards require that we plan and perform the audits to obtain reasonable assurance about whether the financial statements are free of material misstatement. An audit also includes examining, on a test basis, evidence supporting the amounts and disclosures in the financial statements. An audit also includes assessing the accounting principles used and significant estimates made by management, as well as evaluating the overall financial statement presentation. We believe that our audits provide a reasonable basis for our opinion.
In our opinion, except for the errors in Note 3, the 2008, 2007, and 2006 financial statements present fairly, in all material respects, the financial position of Sutron Corporation and Subsidiary as of December 31, 2008, 2007, and 2006, the results of its operations and its cash flows for each of the three years then ended in conformity with generally accepted accounting principles in the United States of America.
We were not engaged to audit, review or apply any procedures to the adjustments for the correction of the errors described in Note 3 and, accordingly, we do not express an opinion or any other form of assurance about whether such adjustments are appropriate and have been properly applied. Those adjustments were audited by Yount, Hyde & Barbour, P.C.
 |
Fairfax, Virginia
March 24, 2009
- 26 -
SUTRON CORPORATION
CONSOLIDATED BALANCE SHEETS
|
December 31,
|
December 31,
|
December 31,
|
December 31,
|
|||||||||||||
|
2009
|
2008
|
2007
|
2006
|
|||||||||||||
|
(Restated)
|
(Restated)
|
(Restated)
|
||||||||||||||
|
ASSETS
|
||||||||||||||||
|
Current Assets:
|
||||||||||||||||
|
Cash and cash equivalents
|
$ | 4,666,983 | $ | 3,705,475 | $ | 5,299,904 | $ | 1,539,032 | ||||||||
|
Restricted cash and cash equivalents
|
1,032,517 | 784,920 | 134,241 | 138,233 | ||||||||||||
|
Accounts receivable, net
|
7,468,327 | 3,872,527 | 3,614,532 | 6,835,751 | ||||||||||||
|
Inventory
|
3,088,782 | 3,831,788 | 3,775,014 | 3,281,017 | ||||||||||||
|
Prepaid items and other assets
|
206,338 | 302,633 | 477,754 | 394,818 | ||||||||||||
|
Income taxes receivable
|
70,695 | 1,034,875 | — | 167,902 | ||||||||||||
|
Deferred income taxes
|
412,000 | 388,000 | 357,000 | 347,000 | ||||||||||||
|
Total Current Assets
|
16,945,642 | 13,920,218 | 13,658,445 | 12,703,753 | ||||||||||||
|
Property and Equipment, Net
|
1,884,876 | 372,745 | 579,282 | 620,218 | ||||||||||||
|
Other Assets
|
||||||||||||||||
|
Goodwill
|
570,150 | 570,150 | — | — | ||||||||||||
|
Other Assets
|
127,529 | 95,057 | 99,308 | 50,576 | ||||||||||||
|
Total Assets
|
$ | 19,528,197 | $ | 14,958,170 | $ | 14,337,035 | $ | 13,374,547 | ||||||||
|
LIABILITIES AND STOCKHOLDERS’ EQUITY
|
||||||||||||||||
|
Current Liabilities:
|
||||||||||||||||
|
Accounts payable
|
$ | 1,064,425 | $ | 1,200,721 | $ | 823,114 | $ | 1,398,285 | ||||||||
|
Accrued payroll
|
479,507 | 129,142 | 285,829 | 317,974 | ||||||||||||
|
Other accrued expenses
|
1,470,477 | 794,307 | 901,123 | 1,506,950 | ||||||||||||
|
Notes payable – current
|
— | 2,765 | 38,381 | 50,722 | ||||||||||||
|
Billings in excess of costs and estimated earnings
|
— | 139,117 | 246,448 | — | ||||||||||||
|
Total Current Liabilities
|
3,014,409 | 2,266,052 | 2,294,895 | 3,273,931 | ||||||||||||
|
Long-Term Liabilities
|
||||||||||||||||
|
Deferred rent
|
1,335,176 | — | — | — | ||||||||||||
|
Notes payable, net of current maturities
|
— | — | 2,075 | 37,678 | ||||||||||||
|
Deferred income taxes
|
148,000 | 59,000 | 84,000 | 129,000 | ||||||||||||
|
Total Long-term Liabilities
|
1,483,176 | 59,000 | 86,075 | 166,678 | ||||||||||||
|
Total Liabilities
|
4,497,585 | 2,325,052 | 2,380,970 | 3,440,609 | ||||||||||||
|
Stockholders’ Equity
|
||||||||||||||||
|
Common stock
|
45,707 | 45,707 | 45,257 | 44,946 | ||||||||||||
|
Additional paid-in capital
|
3,635,659 | 3,502,996 | 3,284,651 | 3,063,281 | ||||||||||||
|
Retained earnings
|
11,422,485 | 9,193,884 | 8,694,576 | 6,838,878 | ||||||||||||
|
Accumulated other comprehensive loss
|
(73,239 | ) | (109,469 | ) | (68,419 | ) | (13,167 | ) | ||||||||
|
Total Stockholders’ Equity
|
15,030,612 | 12,633,118 | 11,956,065 | 9,933,938 | ||||||||||||
|
Total Liabilities and Stockholders’ Equity
|
$ | 19,528,197 | $ | 14,958,170 | $ | 14,337,035 | $ | 13,374,547 | ||||||||
See accompanying notes to consolidated financial statements.
- 27 -
SUTRON CORPORATION
CONSOLIDATED STATEMENTS OF OPERATIONS
|
For the Years Ended December 31,
|
||||||||||||||||
|
2009
|
2008
|
2007
|
2006
|
|||||||||||||
|
(Restated)
|
(Restated)
|
(Restated)
|
||||||||||||||
|
Net sales and revenues
|
$ | 20,851,144 | $ | 15,941,328 | $ | 18,868,101 | $ | 19,406,638 | ||||||||
|
Cost of sales and revenues
|
12,120,975 | 10,449,685 | 11,437,321 | 12,176,829 | ||||||||||||
|
Gross profit
|
8,730,169 | 5,491,643 | 7,430,780 | 7,229,809 | ||||||||||||
|
Operating expenses:
|
||||||||||||||||
|
Selling, general and administrative expenses
|
3,762,291 | 3,544,065 | 3,340,323 | 2,936,925 | ||||||||||||
|
Research and development expenses
|
1,635,161 | 1,228,661 | 1,293,207 | 1,358,624 | ||||||||||||
|
Total operating expenses
|
5,397,452 | 4,772,726 | 4,633,530 | 4,295,549 | ||||||||||||
|
Operating income
|
3,332,717 | 718,917 | 2,797,250 | 2,934,260 | ||||||||||||
|
Financing income, net
|
214,884 | 108,391 | 121,448 | 68,394 | ||||||||||||
|
Income before income taxes
|
3,547,601 | 827,308 | 2,918,698 | 3,002,654 | ||||||||||||
|
Income tax expense
|
1,319,000 | 328,000 | 1,063,000 | 1,132,000 | ||||||||||||
|
Net income
|
$ | 2,228,601 | $ | 499,308 | $ | 1,855,698 | $ | 1,870,654 | ||||||||
|
Net income per share:
|
||||||||||||||||
|
Basic income per share
|
$ | 0.49 | $ | 0.11 | $ | 0.41 | $ | 0.43 | ||||||||
|
Diluted income per share
|
$ | 0.45 | $ | 0.10 | $ | 0.37 | $ | 0.39 | ||||||||
See accompanying notes to consolidated financial statements.
- 28 -
SUTRON CORPORATION
CONSOLIDATED STATEMENTS OF CHANGES IN STOCKHOLDERS' EQUITY
|
Accumulated
|
||||||||||||||||||||||||
|
Additional
|
Other
|
|||||||||||||||||||||||
|
Common
|
Stock
|
Paid-In
|
Retained
|
Comprehensive
|
||||||||||||||||||||
|
Shares
|
Par Value
|
Capital
|
Earnings
|
Income (Loss)
|
Total
|
|||||||||||||||||||
|
Balances, December 31, 2005
|
4,294,551 | $ | 42,946 | $ | 2,312,230 | $ | 4,968,224 | $ | (1,671 | ) | $ | 7,321,729 | ||||||||||||
|
Net income
|
— | — | — | 1,870,654 | — | 1,870,654 | ||||||||||||||||||
|
Cumulative translation adjustment
|
— | — | — | — | (11,496 | ) | (11,496 | ) | ||||||||||||||||
|
Total comprehensive income
|
1,859,158 | |||||||||||||||||||||||
|
Stock based compensation
|
— | — | 36,081 | — | — | 36,081 | ||||||||||||||||||
|
Stock options exercised
|
200,000 | 2,000 | 714,970 | — | — | 716,970 | ||||||||||||||||||
|
Balances, December 31, 2006 (Restated)
|
4,494,551 | 44,946 | 3,063,281 | 6,838,878 | (13,167 | ) | 9,933,938 | |||||||||||||||||
|
Net income
|
— | — | — | 1,855,698 | — | 1,855,698 | ||||||||||||||||||
|
Cumulative translation adjustment
|
— | — | — | — | (55,252 | ) | (55,252 | ) | ||||||||||||||||
|
Total comprehensive income
|
1,800,446 | |||||||||||||||||||||||
|
Stock based compensation
|
— | — | 78,431 | — | — | 78,431 | ||||||||||||||||||
|
Stock options exercised
|
31,081 | 311 | 142,939 | — | — | 143,250 | ||||||||||||||||||
|
Balances, December 31, 2007 (Restated)
|
4,525,632 | 45,257 | 3,284,651 | 8,694,576 | (68,419 | ) | 11,956,065 | |||||||||||||||||
|
Net income
|
— | — | — | 499,308 | — | 499,308 | ||||||||||||||||||
|
Cumulative translation adjustment
|
— | — | — | — | (41,050 | ) | (41,050 | ) | ||||||||||||||||
|
Total comprehensive income
|
458,258 | |||||||||||||||||||||||
|
Stock based compensation
|
— | — | 89,145 | — | — | 89,145 | ||||||||||||||||||
|
Stock options exercised
|
45,000 | 450 | 129,200 | — | — | 129,650 | ||||||||||||||||||
|
Balances, December 31, 2008 (Restated)
|
4,570,632 | 45,707 | 3,502,996 | 9,193,884 | (109,469 | ) | 12,633,118 | |||||||||||||||||
|
Net income
|
— | — | — | 2,228,601 | — | 2,228,601 | ||||||||||||||||||
|
Cumulative translation adjustment
|
— | — | — | — | 36,230 | 36,230 | ||||||||||||||||||
|
Total comprehensive income
|
2,264,831 | |||||||||||||||||||||||
|
Stock based compensation
|
— | — | 132,663 | — | — | 132,663 | ||||||||||||||||||
|
Balances, December 31, 2009
|
4,570,632 | $ | 45,707 | $ | 3,635,659 | $ | 11,422,485 | $ | (73,239 | ) | $ | 15,030,612 | ||||||||||||
See accompanying notes to consolidated financial statements.
- 29 -
SUTRON CORPORTION
CONSOLIDATED STATEMENTS OF CASH FLOWS
|
For the Years Ended December 31,
|
||||||||||||||||
|
2009
|
2008
|
2007
|
2006
|
|||||||||||||
|
(Restated)
|
(Restated)
|
(Restated)
|
||||||||||||||
|
Cash Flows from Operating Activities:
|
||||||||||||||||
|
Net income
|
$ | 2,228,601 | $ | 499,308 | $ | 1,855,698 | $ | 1,870,654 | ||||||||
|
Noncash items included in net income:
|
||||||||||||||||
|
Depreciation and amortization
|
247,311 | 254,443 | 208,135 | 206,088 | ||||||||||||
|
Deferred income taxes
|
65,000 | (56,000 | ) | (55,000 | ) | (109,000 | ) | |||||||||
|
Stock based compensation
|
132,663 | 89,145 | 78,431 | 36,081 | ||||||||||||
|
(Gain) loss on disposal of property
|
13,412 | 1,100 | (7,483 | ) | — | |||||||||||
|
Changes in current assets and liabilities:
|
||||||||||||||||
|
Accounts receivable
|
(3,595,800 | ) | (257,995 | ) | 3,221,219 | (3,124,325 | ) | |||||||||
|
Inventory
|
743,006 | (56,774 | ) | (493,997 | ) | (748,493 | ) | |||||||||
|
Prepaid items and other assets
|
96,295 | 175,121 | (82,936 | ) | 99,129 | |||||||||||
|
Income taxes receivable
|
964,180 | (1,034,875 | ) | 167,902 | (167,902 | ) | ||||||||||
|
Accounts payable
|
(136,296 | ) | 377,608 | (575,171 | ) | 553,774 | ||||||||||
|
Accrued expenses
|
1,026,535 | (263,503 | ) | (637,972 | ) | 449,846 | ||||||||||
|
Billings in excess of costs and estimated earnings
|
(139,117 | ) | (107,331 | ) | 246,448 | — | ||||||||||
|
Deferred rent
|
(55,674 | ) | — | — | — | |||||||||||
|
Net Cash Provided (Used) by Operating Activities
|
1,590,116 | (379,753 | ) | 3,925,274 | (934,148 | ) | ||||||||||
|
Cash Flows from Investing Activities:
|
||||||||||||||||
|
Restricted cash and cash equivalents
|
(247,597 | ) | (650,679 | ) | 3,992 | 95,142 | ||||||||||
|
Purchase of property and equipment
|
(386,419 | ) | (54,007 | ) | (176,719 | ) | (139,074 | ) | ||||||||
|
Other assets
|
(32,472 | ) | 4,251 | (48,732 | ) | (1,953 | ) | |||||||||
|
Acquisition and goodwill
|
— | (570,150 | ) | — | — | |||||||||||
|
Proceeds from the sale of property and equipment
|
4,415 | 5,000 | 17,003 | — | ||||||||||||
|
Net Cash Used by Investing Activities
|
(662,073 | ) | (1,265,585 | ) | (204,456 | ) | (45,885 | ) | ||||||||
|
Cash Flows from Financing Activities:
|
||||||||||||||||
|
Payments on notes payable
|
(2,765 | ) | (37,691 | ) | (47,944 | ) | (48,036 | ) | ||||||||
|
Tax benefit from stock options exercised
|
— | 101,000 | 58,000 | 504,000 | ||||||||||||
|
Proceeds from stock options exercised
|
— | 28,650 | 85,250 | 212,970 | ||||||||||||
|
Net Cash Provided (Used) by Financing Activities
|
(2,765 | ) | 91,959 | 95,306 | 668,934 | |||||||||||
|
Effect of exchange rate changes on cash and cash equivalents
|
36,230 | (41,050 | ) | (55,252 | ) | (11,496 | ) | |||||||||
|
Net increase (decrease) in cash and cash equivalents
|
961,508 | (1,594,429 | ) | 3,760,872 | (322,595 | ) | ||||||||||
|
Cash and Cash Equivalents, beginning of year
|
3,705,475 | 5,299,904 | 1,539,032 | 1,861,627 | ||||||||||||
|
Cash and Cash Equivalents, end of year
|
$ | 4,666,983 | $ | 3,705,475 | $ | 5,299,904 | $ | 1,539,032 | ||||||||
|
Supplemental Disclosure of Non-Cash Investing Activities:
|
||||||||||||||||
|
Acquisition of leasehold improvements from
|
||||||||||||||||
|
lease incentives
|
$ | 1,390,850 | $ | — | $ | — | $ | — | ||||||||
See accompanying notes to consolidated financial statements.
- 30 -
SUTRON CORPORATION
NOTES TO CONSOLIDATED FINANCIAL STATEMENTS
Year ended December 31, 2009 and the years ended December 31, 2008, 2007 and 2006 as Restated
1. ORGANIZATION AND BASIS OF PRESENTATION
Sutron Corporation (Corporation) was incorporated on December 30, 1975, under the General Laws of the Commonwealth of Virginia. The Company is a leading provider of real-time data collection and control products, systems software and professional services in the hydrological, meteorological and oceanic monitoring markets. The Company’s products include data loggers, satellite transmitters/loggers, sensors and system and application software. Customers consist of a diversified base of Federal, state, local and foreign government agencies, universities and hydropower companies.
The Company operates from its headquarters located in Sterling, Virginia. The Company has several branch offices located throughout the United States and a branch office in India. The Company has established a wholly-owned subsidiary, Sutron HydroMet Systems, Private Limited, which is located in New Delhi, India.
Basis of Presentation
The consolidated financial statements include the accounts of Sutron Company and its wholly-owned subsidiary, Sutron HydroMet Systems, Private Ltd. All intercompany balances and transactions have been eliminated.
Restatement
As discussed in Note 3, the Company determined that its previously issued consolidated financial statements for the fiscal years ended December 31, 2008, 2007, and 2006 were not prepared in accordance with accounting principles generally accepted in the United States of America (“GAAP”) and must be restated. The consolidated financial statements and the notes to the financial statements for the fiscal years ended December 31, 2008, 2007, and 2006 reflect the effects of these restatements. Parenthetical references to prior year information are also presented as restated, as appropriate. See Note 3, Restatement of Previously Issued Consolidated Financial Statements for further detail as it relates to the Restatement. We have not amended our previously filed Annual Reports on Form 10-K for the fiscal years ended December 31, 2008, 2007 and 2006, or the Quarterly Reports on Form 10-Q for the periods ended March 31, 2006 through September 30, 2009, to reflect the restatements described in this Annual Report on Form 10-K, and thus the financial statements and related financial statement information contained in those reports should no longer be relied upon.
2. SUMMARY OF SIGNIFICANT ACCOUNTING POLICIES
Revenue Recognition
Revenue for the Company’s products, consisting of both equipment and software, is recognized upon shipment, delivery, installation or customer acceptance of the product, as agreed in the customer order or contract. Sutron does sell its software products without the related equipment although software products are integral to systems. The Company’s typical system requires no significant production, modification or customization of the software or hardware. For complex systems, revenue is deferred until customer acceptance. The Company does provide customer discounts and does allow for product returns. The Company does not do consignment sales or bill and hold. Revenue reflects reductions due to discounts and product returns. Product returns have historically been insignificant in amount.
- 31 -
The Company’s sales arrangements for systems often include services in addition to equipment and software. These services could include equipment integration, software customization, installation, maintenance, training, and customer support. For sales arrangements that include bundled hardware, software and services, Sutron accounts for any undelivered service offering as a separate element of a multiple-element arrangement. Amounts allocated to each element are based on its objectively determined fair value, such as the sales price for the product or service when it is sold separately. Revenue for these services is typically recognized ratably over the period benefited or when the services are complete.
The Company uses the percentage of completion method for recognizing revenue and profits when it performs on fixed price contracts that extend over a number of years. Under the percentage of completion method, revenue and profits are recorded as costs are incurred based on estimates of total sales value and costs at completion where total profit can be estimated with reasonable accuracy and ultimate realization is reasonably assured. Profit estimates are revised periodically based upon changes and facts, and any losses on contracts are recognized immediately. Contracts may contain provisions to earn incentive and award fees if targets are achieved. Incentive and award fees that can be reasonably estimated are recorded over the performance period of the contract. Incentive and award fees that cannot be reasonably estimated are recorded when awarded. The Company recognizes revenue from time-and-materials contracts to the extent of billable rates, times hours delivered, plus direct materials costs incurred. Some of the contracts include provisions to withhold a portion of the contract value as retainage. The Company’s policy is to take into revenue the full value of the contract, including any retainage, as it performs against the contract. Contract costs include allocated indirect costs. Anticipated losses on all contracts are recognized as soon as they become known. Costs on contracts in excess of related billings are reflected as unbilled receivables and are included in accounts receivable. Billings in excess of costs are reflected as a liability.
Cash and Cash Equivalents
For purposes of the consolidated statements of cash flows, cash equivalents include time deposits and all highly liquid debt instruments with original maturities of three months or less. Interest paid approximated $35 for the year ended December 31, 2009 and $200 for the years ended December 31, 2007 and 2006. No interest was paid for the year ended December 31, 2008. Income taxes paid approximated $630,000, $901,000, $683,000 and$663,000 for the years ended December 31, 2009, 2008, 2007 and 2006, respectively. Foreign income tax paid approximated $144,000, $123,000, $40,000 and $15,000 for the years ended December 31, 2009, 2008, 2007 and 2006, respectively.
Restricted Cash
For the years ended December 31, 2009, 2008, 2007 and 2006, the Company had submitted bid bonds or performance bonds on both official tenders or awarded contracts. At December 31, 2009, 2008, 2007 and 2006, cash in the amount of $1,032,517, $784,920, $134,241 and $138,233, respectively, was restricted for bid or performance bonds.
Accounts Receivable
Based on management’s evaluation of uncollected accounts receivable at the end of each year, bad debts are provided for utilizing the allowance method. At December 31, 2009, 2008, 2007 and 2006, the Company’s investment in accounts 90 days or more past due was $528,101, $1,277,231, $1,070,808 and $1,030,402 respectively, net of contract retainages. Bad debt expense for the years ending December 31, 2009, 2008, 2007 and 2006 was $34,539, $71,368, $18,386 and $10,006, respectively.
Inventory
Inventory is stated at the lower of cost or market. Electronic components costs, work in process and finished goods costs consist of materials, labor and overhead and are recorded at a standard cost that approximates the average cost method. The Company provides allowances on inventories for any material that has become obsolete or may become unsellable based on estimates of future demand and sale price in the market.
- 32 -
Property and Equipment
Property and equipment is recorded at cost and depreciated over their estimated useful lives, ranging from three to seven years, using the straight-line method for financial statement purposes, and the straight-line and accelerated methods for income tax purposes. Expenditures for maintenance, repairs, and improvements that do not materially extend the useful lives of the assets are charged to earnings as incurred. When items of property and equipment are disposed of, the cost of the asset and the related accumulated depreciation are removed from the accounts. Any gain or loss resulting from the removal from service is taken into the current period earnings.
Acquisition and Goodwill
On December 31, 2008, the Company purchased the assets of Ilex Engineering, Inc., a provider of DOMSAT systems, custom software and engineering services, located in Columbia, Maryland. The acquisition is expected to strengthen the Company’s position in the GOES data collection services market and global satellite market. The purchase price of approximately $575,000 was allocated among tangible assets based on the relative fair market value of assets. The excess of the purchase price over the fair value of assets in the amount of approximately $570,000 was recorded as goodwill and the entire amount is expected to be deductible for tax purposes.
Goodwill represents the excess of cost of the acquired net assets over the net amounts assigned to assets acquired and liabilities assumed. Goodwill is not amortized, but rather evaluated for impairment each year. Impairment exists when the carrying amount of goodwill exceeds its implied fair value. The Company performs impairment testing in the last quarter of each year. No impairment of goodwill was deemed to exist as of the balance sheet date.
Income Taxes
The Company utilizes an asset and liability approach to accounting for income taxes. The objective is to recognize the amount of income taxes payable or refundable in the current year based on the Company’s income tax return and the deferred tax liabilities and assets for the expected future tax consequences of events that have been recognized in the Company’s financial statements or tax returns. The asset and liability method accounts for deferred income taxes by applying enacted statutory rates to temporary differences, the difference between financial statement amounts and tax basis of assets and liabilities. The resulting deferred tax liabilities or assets are classified as current or noncurrent based on the classification of the related asset or liability. Deferred income tax liabilities or assets are adjusted to reflect changes in tax laws or rates in the year of enactment.
The Company adopted the Financial Accounting Standards Board’s guidance on accounting for uncertainty in income taxes on January 1, 2007. Management has evaluated the Company’s tax positions and concluded that the Company had taken no uncertain tax positions that require adjustment to the financial statements to comply with the provisions of this guidance. With few exceptions, the Company is no longer subject to income tax examinations by the U.S. federal, state or local tax authorities for years before 2006.
Capital
The Company has 12,000,000, $.01 par value, shares authorized. There were 4,570,632 shares issued and outstanding at December 31, 2009 and December 31, 2008, and 4,525,632 and 4,494,551 shares issued and outstanding at December 31, 2007 and December 31, 2006.
Foreign Currency Translation
Results of operations for the Company’s foreign branch office and foreign wholly-owned subsidiary are translated from the designated functional currency to the U.S. dollar using average exchange rates during the period, while assets and liabilities of the foreign branch office are translated at the exchange rate in effect at the reporting date. Resulting gains or losses from translating foreign currency financial statements are included in accumulated other comprehensive loss, net of any related tax effect.
- 33 -
Use of Estimates
The preparation of financial statements in conformity with accounting principles generally accepted in the United States of America requires management to make estimates and assumptions that affect the reported amounts of assets and liabilities and disclosure of contingent assets and liabilities at the date of the financial statements and the reported amounts of revenue and expenses during the reporting period. Actual results could vary from the estimates that were used.
Earnings per Share
The Company has adopted the provision of FASB ASC 260 that establishes standards for computing and presenting earnings per share (EPS) for entities with publicly held common stock. The standard requires presentation of two categories of earnings per share, basic EPS and diluted EPS. Basic EPS excludes dilution and is computed by dividing income available to common stockholders by the weighted-average number of common shares outstanding for the year. Diluted EPS reflects the potential dilution that could occur if securities or other contracts to issue common stock were exercised or converted into common stock or resulted in the issuance of common stock that then shared in the earnings of the Company.
Stock Compensation Plans
Effective January 1, 2006, the Company adopted the provisions of FASB ASC 718 Compensation – Stock Compensation, which requires the measurement and recognition of compensation expense for all share-based payment awards to employees and directors based on estimated fair values. Additionally, the Company follows the Securities and Exchange Commission’s Staff Accounting Bulletin Share-Based Payment which provides supplemental application guidance based on the views of the SEC. The Company adopted ASC 718 using the modified prospective transition method. Under this transition method, share-based compensation expense recognized during the year ended December 31, 2005 included: (a) compensation expense for all share-based awards granted prior to, but not yet vested, as of January 1, 2006, based on the grant date fair value estimated in accordance with the original provisions of ASC 718, and (b) compensation expense for all share-based awards granted beginning January 1, 2006, based on the grant date fair value estimated in accordance with the provisions of ASC 718.
Fair Value Measurement
Accounting standards establish a framework for measuring fair value. That framework provides a fair value hierarchy that prioritizes the inputs to valuation techniques used to measure fair value. The hierarchy gives the highest priority to unadjusted quoted prices in active markets for identical assets or liabilities (level 1) and the lowest priority to unobservable inputs (level 3). The three levels of the fair value hierarchy under the standards are described as follows:
Level 1 – Valuations for assets and liabilities traded in active exchange markets. Valuations are obtained from readily available pricing sources for market transactions involving identical assets or liabilities.
Level 2 – Valuations for assets and liabilities traded in less active dealer or broker markets. Valuations are obtained from third party pricing services for identical or similar assets or liabilities or other inputs observable for the asset or liability, either directly or indirectly through corroboration with observable market data. If the asset or liability has a specified (contractual) term, a Level 2 input must be observable for substantially the full term of the asset or liability.
Level 3 – Valuations for assets and liabilities that are derived from other valuation methodologies, including option pricing models, discounted cash flow models and similar techniques, and not based on market exchange, dealer, or broker traded transactions. Level 3 valuations incorporate certain assumptions and projections in determining the fair value assigned to such assets or liabilities.
The asset or liability's fair value measurement level within the fair value hierarchy is based on the lowest level of any input that is significant to the fair value measurement. Valuation techniques used need to maximize the use of observable inputs and minimize the use of unobservable inputs.
- 34 -
For the fiscal years ended December 31, 2009, 2008, 2007 and 2006 the application of valuation techniques applied to similar assets and liabilities has been consistent. The following is a description of the valuation methodologies used for instruments measured at fair value:
Certificates of Deposit
Certificates of deposit are carried at cost, which approximates fair value based upon observable market prices of similar instruments. If observable market prices are not available, fair values are estimated by discounting expected future cash flows applying interest rates currently being offered. For the fiscal years ended December 31, 2009, 2008, 2007 and 2006, all certificates of deposit are valued using Level 2 inputs and are valued at $908,919, $885,383, $845,384 and $0, respectively.
The carrying amounts of the Company’s financial instruments not described above arise in the ordinary course of business and approximate fair value.
The preceding methods described may produce a fair value calculation that may not be indicative of net realizable value or reflective of future fair values. Furthermore, although the Company believes its valuation methods are appropriate and consistent with other market participants, the use of different methodologies or assumptions to determine the fair value of certain financial instruments could result in a different fair value measurement at the reporting date.
Recent Accounting Pronouncements
In May 2009, the FASB issued Statement of Financial Accounting Standards ASC 855, “Subsequent Events.” ASC 855 establishes general standards of accounting for and disclosure of events that occur after the balance sheet date but before financial statements are issued or are available to be issued. ASC 855 is effective for interim and annual periods ending after June 15, 2009. The adoption of ASC 855 did not have a material impact on the Company’s consolidated financial statements.
In June 2009, the FASB issued ASC 105, “The FASB Accounting Standards Codification and the Hierarchy of Generally Accepted Accounting Principles.” ASC 105 establishes the FASB Accounting Standards Codification which will become the source of authoritative U.S. generally accepted accounting principles recognized by the FASB to be applied by nongovernmental entities. ASC 105 is effective immediately. The adoption of ASC 105 did not have a material impact on the Company’s consolidated financial statements.
In August 2009, the FASB issued Accounting Standards Update No. 2009-05 (ASU 2009-05), “Fair Value Measurements and Disclosures (Topic 820) – Measuring Liabilities at Fair Value.” ASU 2009-05 amends Subtopic 820-10, “Fair Value Measurements and Disclosures – Overall,” and provides clarification for the fair value measurement of liabilities. ASU 2009-05 is effective for the first reporting period including interim period beginning after issuance. The adoption of ASU 2009-05 did not have a material impact on the Company’s consolidated financial statements.
In October 2009, the Securities and Exchange Commission issued Release No. 33-99072, “Internal Control over Financial Reporting in Exchange Act Periodic Reports of Non-Accelerated Filers.” Release No. 33-99072 delays the requirement for non-accelerated filers to include an attestation report of their independent auditor on internal control over financial reporting with their annual report until the fiscal year ending on or after June 15, 2010.
The FASB issued ASU No. 2009-13, Revenue Recognition (Topic 605) – Multiple-Deliverable Revenue Arrangements – a consensus of the FASB Emerging Issues Task Force. This ASU addresses the accounting for multiple-deliverable arrangements to enable vendors to account for products or services (deliverables) separately rather than as a combined unit. The ASU is effective prospectively for revenue arrangements entered into or materially modified in fiscal years beginning on or after June 15, 2010. The Company does not expect the adoption of ASU No. 2009-13 to have a material impact on its consolidated financial statements.
The FASB issued ASU No. 2009-14, Software (Topic 985) – Certain Revenue Arrangements That Include Software Elements – a consensus of the FASB Emerging Issues Task Force. The amendments in this ASU change the accounting model for revenue arrangements that include both tangible products and software elements. The ASU is
- 35 -
effective prospectively for revenue arrangements entered into or materially modified in fiscal years beginning on or after June 15, 2010. The Company does not expect the adoption of ASU No. 2009-14 to have a material impact on its consolidated financial statements.
The FASB issued ASU No. 2010-06, Fair Value Measurements and Disclosures (Topic 820) – Improving Disclosures about Fair Value Measurements. This ASU affects all entities that are required to make disclosures about recurring and nonrecurring fair value measurements under FASB ASC Topic 820, originally issued as FASB Statement No. 157, Fair Value Measurements. The ASU requires certain new disclosures and clarifies two existing disclosure requirements. The new disclosures and clarifications of existing disclosures are effective for interim and annual reporting periods beginning after December 15, 2009, except for the disclosures about purchases, sales, issuances, and settlements in the roll forward of activity in Level 3 fair value measurements. Those disclosures are effective for fiscal years beginning after December 15, 2010, and for interim periods within those fiscal years. The Company does not expect the adoption of ASU No. 2010-06 to have a material impact on its consolidated financial statements.
3. RESTATEMENT OF PREVIOUSLY ISSUED CONSOLIDATED FINANCIAL STATEMENTS
In March 2010, the Audit Committee recommended to the Board, and the Board thereafter concluded, that our previously issued consolidated financial statements for the years ended December 31, 2008, 2007 and 2006 be restated. The restatement relates to errors in inventory standard costs that were set in excess of inventory purchase costs resulting in an overstatement of inventory values as of December 31, 2008, 2007 and 2006 and due to errors in income tax expense relating to tax deductible stock compensation expense that should have been classified as additional paid-in capital resulting in the understatement of additional paid-in capital and income tax expense for the years ended December 31, 2008, 2007 and 2006. The quarterly impact of the restatement for the periods presented in the Consolidated Statements of Income is included in Note 19. The adjustments below resulted from the restatement as described above and the correction of errors that were previously deemed immaterial, both individually and in the aggregate to the consolidated financial statements.
|
2008
|
2007
|
2006
|
||||||||||
|
Total adjustment to inventory
|
$ | (222,000 | ) | $ | (339,000 | ) | $ | (121,000 | ) | |||
|
Previously reported inventory
|
$ | 4,053,788 | $ | 4,114,014 | 3,402,017 | |||||||
|
Percent variation from previously reported inventory
|
-5.5 | % | -8.2 | % | -3.6 | % | ||||||
|
2008
|
2007
|
2006
|
||||||||||
|
Total adjustment to prepaid items and other assets
|
$ | — | $ | — | $ | (135,902 | ) | |||||
|
Previously reported prepaid items and other assets
|
$ | 302,633 | $ | 477,754 | 530,720 | |||||||
|
Percent variation from previously reported prepaid items and other assets
|
— | % | — | % | -25.6 | % | ||||||
|
2008
|
2007
|
2006
|
||||||||||
|
Total adjustment to income taxes receivable
|
$ | 51,000 | $ | — | $ | 167,902 | ||||||
|
Previously reported income taxes receivable
|
$ | 983,875 | $ | — | $ | — | ||||||
|
Percent variation from previously reported income taxes receivable
|
5.2 | % | — | % | — | % | ||||||
| 2008 | 2007 | 2006 | ||||||||||
|
Total adjustment to deferred income taxes
|
$ | 80,000 | $ | 45,000 | $ | 14,000 | ||||||
|
Previously reported deferred income taxes
|
$ | 308,000 | $ | 312,000 | $ | 333,000 | ||||||
|
Percent variation from previously deferred income taxes
|
26 | % | 14.4 | % | 4.2 | % | ||||||
- 36 -
| 2008 | 2007 | 2006 | ||||||||||
|
Total adjustment to additional paid-in capital
|
$ | 724,221 | $ | 590,235 | $ | 504,000 | ||||||
|
Previously reported additional paid-in capital
|
$ | 2,778,775 | $ | 2,694,416 | 2,559,281 | |||||||
|
Percent variation from previously reported additional paid-in capital
|
26.1 | % | 21.9 | % | 19.7 | % | ||||||
| 2008 | 2007 | 2006 | ||||||||||
|
Total adjustment to other accrued expenses
|
$ | — | $ | (94,000 | ) | $ | — | |||||
|
Previously reported other accrued expenses
|
$ | 794,307 | $ | 995,123 | 1,506,950 | |||||||
|
Percent variation from previously reported other accrued expenses
|
- | % | -9.4 | % | — | % | ||||||
| 2008 | 2007 | 2006 | ||||||||||
|
Total adjustment to retained earnings
|
$ | (815,221 | ) | $ | (790,235 | ) | $ | (579,000 | ) | |||
|
Previously reported retained earnings
|
$ | 10,009,105 | $ | 9,484,811 | 7,417,878 | |||||||
|
Percent variation from previously retained earnings
|
-8.1 | % | -8.3 | % | -7.8 | % | ||||||
| 2008 | 2007 | 2006 | ||||||||||
|
Total adjustment to cost of sales
|
$ | (117,000 | ) | $ | 218,000 | $ | 121,000 | |||||
|
Previously reported cost of sales
|
$ | 10,566,685 | $ | 11,219,321 | 12,055,829 | |||||||
|
Percent variation from previously reported cost of sales
|
-1.1 | % | 1.9 | % | 1.0 | % | ||||||
| 2008 | 2007 | 2006 | ||||||||||
|
Total adjustment to selling, general and administrative expenses
|
$ | 32,986 | $ | 28,235 | $ | — | ||||||
|
Previously reported selling, general and administrative expenses
|
$ | 3,511,079 | $ | 3,312,088 | 2,936,925 | |||||||
|
Percent variation from previously reported selling, general and administrative expenses
|
.1 | % | .1 | % | — | % | ||||||
| 2008 | 2007 | 2006 | ||||||||||
|
Total adjustment to net income before taxes
|
$ | 84,014 | $ | (246,235 | ) | $ | (121,000 | ) | ||||
|
Previously reported net income before taxes
|
$ | 743,294 | $ | 3,164,933 | 3,123,654 | |||||||
|
Percent variation from previously reported net income before taxes
|
11.3 | % | -7.8 | % | -3.9 | % | ||||||
| 2008 | 2007 | 2006 | ||||||||||
|
Total adjustment to income tax expense
|
$ | 109,000 | $ | (35,000 | ) | $ | 458,000 | |||||
|
Previously reported income tax expense
|
$ | 219,000 | $ | 1,098,000 | 674,000 | |||||||
|
Percent variation from previously reported income tax expense
|
49.8 | % | -3.2 | % | 68 | % | ||||||
|
2008
|
2007
|
2006
|
||||||||||
|
Total adjustment to net income
|
$ | (24,986 | ) | $ | (211,235 | ) | $ | (579,000 | ) | |||
|
Previously reported net income
|
$ | 524,294 | $ | 2,066,933 | 2,449,654 | |||||||
|
Percent variation from previously reported net income
|
-4.8 | % | -10.2 | % | -23.6 | % | ||||||
|
2008
|
2007
|
2006
|
||||||||||
|
Total adjustment to EPS
|
$ | — | $ | (.04 | ) | $ | ( .12 | ) | ||||
|
Previously reported EPS
|
$ | .10 | $ | .41 | $ | .51 | ||||||
|
Percent variation from previously reported EPS
|
— | % | -9.7 | % | -23.5 | % | ||||||
- 37 -
4. ACCOUNTS RECEIVABLE
Accounts receivable at December 31, consists of the following:
|
2009
|
2008
|
2007
|
2006
|
|||||||||||||
|
Trade receivables
|
$ | 4,802,563 | $ | 3,398,285 | $ | 2,706,063 | $ | 5,291,728 | ||||||||
|
Costs in excess of billings and estimated earnings
|
2,145,779 | 109,948 | 761,207 | 1,294,443 | ||||||||||||
|
Contract retainage
|
564,985 | 493,835 | 206,262 | 356,137 | ||||||||||||
|
Allowance for doubtful accounts
|
(45,000 | ) | (129,541 | ) | (59,000 | ) | (106,557 | ) | ||||||||
|
Totals
|
$ | 7,468,327 | $ | 3,872,527 | $ | 3,614,532 | $ | 6,835,751 | ||||||||
5. INVENTORY
Inventory consists of the following at December 31:
|
2009
|
2008
|
2007
|
2006
|
|||||||||||||
|
(Restated)
|
(Restated)
|
(Restated)
|
||||||||||||||
|
Electronic components
|
$ | 1,678,448 | $ | 1,668,438 | $ | 1,669,590 | $ | 1,563,775 | ||||||||
|
Work in process
|
1,472,169 | 1,945,616 | 1,582,652 | 1,531,131 | ||||||||||||
|
Finished goods
|
482,720 | 658,317 | 1,158,249 | 689,998 | ||||||||||||
|
Allowance for obsolete inventory
|
(544,555 | ) | (440,583 | ) | (635,477 | ) | (503,887 | ) | ||||||||
|
Totals
|
$ | 3,088,782 | $ | 3,831,788 | $ | 3,775,014 | $ | 3,281,017 | ||||||||
6. PROPERTY AND EQUIPMENT
A summary of property and equipment at December 31 is as follows:
|
2009
|
2008
|
2007
|
2006
|
|||||||||||||
|
Furniture, fixtures and equipment
|
$ | 1,901,814 | $ | 1,955,526 | $ | 1,949,776 | $ | 2,867,053 | ||||||||
|
Vehicles
|
277,803 | 355,660 | 364,134 | 400,271 | ||||||||||||
|
Leasehold improvements
|
1,555,057 | 127,439 | 110,858 | 93,835 | ||||||||||||
|
Totals
|
$ | 3,734,674 | $ | 2,438,625 | $ | 2,424,768 | $ | 3,361,159 | ||||||||
Accumulated depreciation and amortization at December 31, is as follows:
|
2009
|
2008
|
2007
|
2006
|
|||||||||||||
|
Furniture, fixtures and equipment
|
$ | 1,491,888 | $ | 1,651,011 | $ | 1,543,053 | $ | 2,469,562 | ||||||||
|
Vehicles
|
261,837 | 305,080 | 256,136 | 228,964 | ||||||||||||
|
Leasehold improvements
|
96,073 | 109,789 | 46,297 | 42,415 | ||||||||||||
|
Totals
|
$ | 1,849,798 | $ | 2,065,880 | $ | 1,845,486 | $ | 2,740,941 | ||||||||
Depreciation and amortization expense totaled $247,311, $254,443, $208,135 and $206,088 for the years ended December 31, 2009, 2008, 2007 and 2006, respectively.
7. LINE OF CREDIT
The Company has a $3,000,000 line of credit with a commercial bank. The line of credit is collateralized by substantially all of the assets of the Company and expires August 2010. Under the terms of the line of credit, the
- 38 -
Company is required to maintain certain financial covenants. Interest is charged at the bank’s prime rate and is payable monthly. There was no balance outstanding at December 31, 2009, 2008, 2007 and 2006.
The Company frequently bids on and enters into international contracts that require bid and performance bonds. At December 31, 2009, 2008, 2007 and 2006, the commercial bank had issued standby letters of credit on behalf of the Company in the amount of $411,000, $1,010,238, $1,652,818 and $532,300, respectively, that served as either bid or performance bonds. The amount available under the line of credit was reduced by this amount.
8. OTHER ACCRUED EXPENSES
Components of other accrued expenses consist of the following at December 31:
|
2009
|
2008
|
2007
|
2006
|
|||||||||||||
|
(Restated)
|
||||||||||||||||
|
Accrued vacation pay
|
$ | 211,637 | $ | 192,858 | $ | 218,278 | $ | 182,980 | ||||||||
|
Accrued warranty costs
|
304,000 | 245,000 | 226,000 | 288,000 | ||||||||||||
|
Customer advance payments
|
512,203 | 318,407 | 224,972 | 907,133 | ||||||||||||
|
Federal income taxes payable
|
340,847 | — | 209,015 | — | ||||||||||||
|
Other accruals
|
101,790 | 38,042 | 22,858 | 128,837 | ||||||||||||
|
Totals
|
$ | 1,470,477 | $ | 794,307 | $ | 901,123 | $ | 1,506,950 | ||||||||
9. ACCRUED WARRANTY COSTS
The Company warranties its products for up to two years and estimated warranty costs are based upon management’s best estimate of the amounts necessary to settle future and existing claims on equipment sold as of the balance sheet date. Factors considered include actual past experience of product returns and the related estimated cost of labor and material to make the necessary repairs as well as technological advances and enhanced design and manufacturing processes. If actual future product return rates or the actual costs of material and labor differ from the estimates, adjustments to the accrued warranty liability are made.
Changes to the product warranty reserve are identified below and represent adjustments to the reserve based on management estimates and other factors as noted above:
|
Balance as of December 31, 2005
|
$ | 288,000 | ||
|
Reserve adjustment
|
— | |||
|
Balance as of December 31, 2006
|
$ | 288,000 | ||
|
Reserve adjustment
|
(62,000 | ) | ||
|
Balance as of December 31, 2007
|
$ | 226,000 | ||
|
Reserve adjustment
|
19,000 | |||
|
Balance as of December 31, 2008
|
245,000 | |||
|
Reserve adjustment
|
59,000 | |||
|
Balance as of December 31, 2009
|
$ | 304,000 |
10. NOTES PAYABLE
Notes payable consist of notes from various finance companies for vehicle acquisitions and are secured by the underlying vehicles. Monthly installments range from $259 to $700 and include zero percent interest. The balances outstanding at December 31 are as follows:
|
2009
|
2008
|
2007
|
2006
|
|||||||||||||
|
Long-term maturities
|
$ | — | $ | — | $ | 2,075 | $ | 37,678 | ||||||||
|
Current maturities
|
— | 2,765 | 38,381 | 50,722 | ||||||||||||
|
Totals
|
$ | — | $ | 2,765 | $ | 40,456 | $ | 88,400 | ||||||||
- 39 -
11. LEASE OBLIGATIONS
The Company entered into a ten year lease for a new corporate headquarters and operations facility in Sterling, Virginia on November 13, 2008. The Company moved into the new facility on May 15, 2009 and lease payments commenced on June 1, 2009. As per the lease agreement, the monthly rent for the first year is $30,135, and thereafter increases 3 percent per annum. The lease agreement includes additional rent payments based on a pro rata portion of operating expenses which consist of building insurance, real estate taxes, landscaping and other property related expenses. The Company received a tenant improvement allowance in the amount of $1,390,850 from the landlord. The tenant improvement allowance was capitalized and recorded as an asset under leasehold improvements and as a liability under deferred rent.
The Company leases office and warehouse space in West Palm Beach, Florida. The three-year lease, expiring August 31, 2011, requires monthly payments of $3,695. The Company leases office space in Brandon, Florida. The one-year lease, expiring October 31, 2010, requires monthly payment of $482.
The Company’s wholly owned subsidiary, Sutron Hydromet Systems, Pvt., Ltd., leases office space and furniture in New Delhi, India. The three-year leases expire in August 2012 and require monthly payments of $1,821.
The following is a schedule of future minimum lease payments by year:
|
Years ending December 31:
|
||||
|
2010
|
$ | 565,513 | ||
|
2011
|
542,064 | |||
|
2012
|
508,665 | |||
|
2013
|
508,665 | |||
|
2014
|
508,665 | |||
|
2015 and thereafter
|
1,737,939 | |||
|
Total
|
$ | 4,371,511 | ||
Rent expense amounted to $361,091, $362,182, $332,999 and $315,903 for the years ended December 31, 2009, 2008, 2007 and 2006, respectively.
12. INCOME TAXES
The income tax expense charged to operations for the years ended December 31, were as follows:
|
2009
|
2008
|
2007
|
2006
|
|||||||||||||
|
(Restated)
|
(Restated)
|
(Restated)
|
||||||||||||||
|
Domestic income tax expense
|
$ | 1,110,000 | $ | 261,000 | $ | 1,078,000 | $ | 1,226,000 | ||||||||
|
Foreign income tax expense
|
144,000 | 123,000 | 40,000 | 15,000 | ||||||||||||
|
Deferred tax benefit
|
65,000 | (56,000 | ) | (55,000 | ) | (109,000 | ) | |||||||||
|
Total income tax expense
|
$ | 1,319,000 | $ | 328,000 | $ | 1,063,000 | $ | 1,132,000 | ||||||||
Deferred tax assets, are comprised of the following at December 31:
|
2009
|
2008
|
2007
|
2006
|
|||||||||||||
|
(Restated)
|
(Restated)
|
(Restated)
|
||||||||||||||
|
Accrued vacation and warranty
|
$ | 80,000 | $ | 171,000 | $ | 173,000 | $ | 184,000 | ||||||||
|
Stock compensation additional paid in capital
|
131,000 | 80,000 | 45,000 | 14,000 | ||||||||||||
|
Accounts receivable and inventory allowances
|
201,000 | 137,000 | 139,000 | 149,000 | ||||||||||||
|
Gross deferred tax assets
|
412,000 | 388,000 | 357,000 | 347,000 | ||||||||||||
|
Gross deferred tax liability – depreciation
|
(148,000 | ) | (59,000 | ) | (84,000 | ) | (129,000 | ) | ||||||||
|
Net deferred tax assets
|
$ | 264,000 | $ | 329,000 | $ | 273,000 | $ | 218,000 | ||||||||
- 40 -
The realization of the deferred tax assets is dependent on future taxable earnings. The Company has not provided for a deferred tax asset valuation allowance due to their current and anticipated future earnings.
Reconciliation of the amount of reported income tax expense and the amount computed by multiplying the applicable statutory Federal income tax rate is as follows:
|
2009
|
2008
|
2007
|
2006
|
|||||||||||||
|
(Restated)
|
(Restated)
|
(Restated)
|
||||||||||||||
|
Income before income taxes
|
$ | 3,547,601 | $ | 827,308 | $ | 2,918,698 | $ | 3,002,654 | ||||||||
|
Applicable statutory tax rate
|
34 | % | 34 | % | 34 | % | 34 | % | ||||||||
|
Computed “expected” Federal income tax expense
|
1,206,000 | 281,000 | 992,000 | 1,021,000 | ||||||||||||
|
Adjustments to Federal income tax resulting from:
|
||||||||||||||||
|
State income tax expense
|
206,000 | 63,000 | 183,000 | 198,000 | ||||||||||||
|
Tax credits and other
|
(93,000 | ) | (16,000 | ) | (112,000 | ) | (87,000 | ) | ||||||||
|
Income tax expense
|
$ | 1,319,000 | $ | 328,000 | $ | 1,063,000 | $ | 1,132,000 | ||||||||
13. MAJOR CUSTOMERS
Set forth below are customers, including agencies of the U.S. Government, from which the Company received more than ten percent of total revenue for the years ended December 31:
|
2009
|
2008
|
2007
|
2006
|
||||
|
Department of Interior
|
18%
|
19%
|
21%
|
17%
|
|||
|
International
|
48%
|
42%
|
40%
|
36%
|
|||
|
Commercial
|
17%
|
24%
|
27%
|
23%
|
|||
|
Department of Defense
|
7%
|
8%
|
5%
|
16%
|
Set forth below are customers from which the Company had more than ten percent of total accounts receivable outstanding for the years ended December 31:
|
2009
|
2008
|
2007
|
2006
|
|||||||||||||
|
Islamic Republic of Afghanistan
|
$ | 593,841 | $ | 1,713,673 | $ | 798,656 | $ | — | ||||||||
|
Dominion/ADASA
|
$ | 2,108,258 | $ | — | $ | — | $ | — | ||||||||
|
South Florida Water Management District
|
$ | — | $ | — | $ | — | $ | 410,759 | ||||||||
|
US Army Corps of Engineers
|
$ | — | $ | — | $ | — | $ | 676,757 | ||||||||
|
National Ocean Survey
|
$ | — | $ | — | $ | — | $ | 592,607 | ||||||||
|
Tamil Nadu Agricultural University
|
$ | 1,461,170 | $ | — | $ | — | $ | — | ||||||||
|
Central Water Commission of India
|
$ | — | $ | 506,000 | $ | 695,000 | $ | 1,190,000 | ||||||||
The above table includes unbilled accounts receivable. As of December 31, 2009, unbilled receivables of $1,068,000 and $1,040,000 are included for Dominion/ASDA and Tamil Nadu Agricultural University, respectively. As of December 31, 2008, 2007, and 2006, unbilled receivables of approximately $506,000, $695,000 and $1,190,000 are included for the Government of India Central Water Commission.
- 41 -
14. CONCENTRATIONS
The Company’s bank participates in the FDIC’s Transaction Account Guarantee Program. Under that program, through December 31, 2009, all non-interest bearing transaction accounts are fully guaranteed by the FDIC for the entire amount in the account. Coverage is in addition to, and separate from, the coverage available under the FDIC’s general deposit insurance rules. The Company also maintains accounts that are not covered by the guarantee program. At times throughout the year, cash and cash equivalents exceeded the FDIC insurance limits in these accounts. As of December 31, 2009, 2008, 2007 and 2006, the Company’s cash deposits exceeded the FDIC insured amount by approximately $4,497,000, $3,954,000, $4,718,000 and $867,000, respectively.
The Company’s products use certain standard and application specific components that are acquired from one or a limited number of sources. The Company has generally been able to procure adequate supplies of these components in a timely manner from existing sources. The Company’s inability to obtain a sufficient quantity of components when required or to develop alternative sources at acceptable prices and within a reasonable time, could result in delays or reductions in product shipments which could materially affect the Company’s operating results in any given period.
15. STOCK OPTIONS
The Company’s Amended and Restated 1996, 1997 and 2002 Stock Option Plans (the “Stock Option Plans”) provide for the issuance of non-qualified stock options to employees, officers and directors. The plans are administered by the compensation committee of the Board of Directors which selects persons to receive awards and determines the number of shares subject to each award and the terms, conditions, performance measures and other provisions of the award. The Company measures and recognizes compensation expense for all stock-based payments at fair value. The Company recognizes stock-based compensation costs on a straight-line basis over the requisite service period of the award, which is generally the option vesting term. For the years ended December 31, 2009, 2008, 2007 and 2006, total stock-based compensation expense was $132,663, $89,145, $78,431 and $36,081. Unrecognized stock-based compensation expense totaled $90,511as of December 31, 2009. The weighted average fair value of options granted during the years ended December 31, 2009, 2008, 2007 and 2006 were calculated using the Black-Scholes option pricing model with the valuation assumptions shown below:
|
2009
|
2008
|
2007
|
2006
|
||||
|
Weighted average fair value
|
$4.57
|
$3.63
|
$3.55
|
$4.12
|
|||
|
Risk free rate
|
2.46-3.11%
|
3.62-3.92%
|
4.50 - 5.16%
|
5.16%
|
|||
|
Expected volatility
|
25-33%
|
30%
|
30%
|
30%
|
|||
|
Dividend yield
|
0%
|
0%
|
0%
|
0%
|
|||
|
Expected term in years
|
10
|
10
|
10
|
10
|
The volatility factor is based on the Company’s historical stock price fluctuations. The Company has not, and does not intend to, issue dividends; therefore, the dividend yield assumption is 0. The Company applied the risk-free interest rate based on the U.S. Treasury yield in effect at the time of the grant. The expected term of the option is based on the contractual period of the options granted.
The Company has granted stock options under the Stock Option Plans to key employees and directors for valuable services provided to the Company. The vesting schedules are determined by the Board of Directors at the time each individual option is granted. Under the 1996 Plan, the Company authorized 260,000 shares, 259,000 of which have been granted. The Company authorized 60,000 shares under the 1997 Plan, all of which have been granted. Under the 2002 Stock Option Plan, the Company authorized 650,000 shares, 561,333 of which have been granted. Shares under all of the plans may be granted at not less than 100 percent of the fair market value at the grant date. All options have a ten-year term from the date of grant. Cancelled or expired options are able to be reissued. The following table summarizes stock option activity under the Stock Option Plans for the last three years.
- 42 -
|
Option
|
Weighted
|
|||||||||||
|
Price
|
Number of
|
Average
|
||||||||||
|
Per Share
|
Shares
|
Exercise Price
|
||||||||||
|
Outstanding, December 31, 2005
|
$ | .40 - 7.45 | 739,333 | $ | .98 | |||||||
|
Grants
|
7.80 | 15,000 | $ | 7.80 | ||||||||
|
Exercised
|
.40 - 1.125 | 200,000 | $ | 1.06 | ||||||||
|
Cancelled or expired
|
— | — | $ | — | ||||||||
|
Outstanding, December 31, 2006
|
.55-7.80 | 554,333 | $ | 1.13 | ||||||||
|
Grants
|
6.90-7.60 | 65,000 | $ | 6.48 | ||||||||
|
Exercised
|
.65-5.50 | 31,081 | $ | 2.74 | ||||||||
|
Cancelled or expired
|
7.60 | 5,000 | $ | 7.60 | ||||||||
|
Outstanding, December 31, 2007
|
.55 – 7.80 | 583,252 | $ | 1.65 | ||||||||
|
Grants
|
6.00 – 7.50 | 16,000 | $ | 7.41 | ||||||||
|
Exercised
|
.55 – .68 | 45,000 | $ | 0.64 | ||||||||
|
Cancelled or expired
|
7.45-7.80 | 10,000 | $ | 3.91 | ||||||||
|
Outstanding, December 31, 2008
|
.55 – 7.80 | 544,252 | $ | 1.80 | ||||||||
|
Grants
|
4.45 – 4.82 | 45,000 | $ | 4.57 | ||||||||
|
Exercised
|
— | — | $ | — | ||||||||
|
Cancelled or expired
|
— | — | $ | — | ||||||||
|
Outstanding, December 31, 2009
|
$ | .55 – 7.80 | 589,252 | $ | 2.01 | |||||||
The vesting period of the remaining options is as follows:
|
Vested and exercisable
|
553,786 | |||
|
2010
|
15,466 | |||
|
2011
|
10,000 | |||
|
2012
|
10,000 | |||
|
Total
|
589,252 |
The weighted average remaining contractual life of options outstanding at December 31, 2009 is 3.6 years.
16. EARNINGS PER SHARE
The following table shows the weighted average number of shares used in computing earnings per share and the effect on weighted average number of shares of potential dilutive common stock.
|
Years Ended December 31,
|
||||||||||||||||
|
2009
|
2008
|
2007
|
2006
|
|||||||||||||
|
(Restated)
|
(Restated)
|
(Restated)
|
||||||||||||||
|
Net income
|
$ | 2,228,601 | $ | 499,308 | $ | 1,855,698 | $ | 1,870,654 | ||||||||
|
Shares used in calculation of income per share:
|
||||||||||||||||
|
Basic
|
4,570,632 | 4,549,810 | 4,512,578 | 4,341,534 | ||||||||||||
|
Effect of dilutive options
|
404,480 | 501,816 | 469,652 | 469,109 | ||||||||||||
|
Diluted
|
4,975,112 | 5,051,626 | 4,982,230 | 4,810,643 | ||||||||||||
|
Net income per share:
|
||||||||||||||||
|
Basic
|
$ | 0.49 | $ | 0.11 | $ | 0.41 | $ | 0.43 | ||||||||
|
Diluted
|
$ | 0.45 | $ | 0.10 | $ | 0.37 | $ | 0.39 | ||||||||
Stock options that could potentially dilute basic EPS in the future were not included in the computation of diluted EPS, because to do so would have been anti-dilutive, were 96,000, 95,000, 0 and 0 for the years ended December 31, 2009, 2008, 2007 and 2006, respectively.
17. PROFIT SHARING PLAN
The Company has a 401(k) Profit-Sharing Plan that covers substantially all employees of the Company. The 401(k) provision permits employees to elect to defer a portion of their compensation. The Plan was amended in May 2006 to allow for employer matching of up to 4 percent. The profit-sharing contribution is determined each year by the
- 43 -
Board of Directors based on profits. The Company did not make a profit sharing contribution for the years ended December 31, 2009, 2008, and 2007. A profit sharing contribution of $100,000 was made for the year ended December 31, 2006. The employer matching contribution was approximately $158,000, $148,000, $156, 000 and $73,000 for the years ended December 31, 2009, 2008, 2007 and 2006, respectively.
18. SEGMENT INFORMATION (RESTATED)
The Company operates principally in two industry segments: the manufacturing of standard products (hydrological, meteorological and oceanic monitoring and control products) which are sold off-the-shelf and systems (hydrological, meteorological and oceanic monitoring stations/systems that are comprised of standard products and custom items as required by the system specification also including software) and services (including installation, training, and maintenance of systems). Corporate assets consisted mainly of cash, prepaid expenses, deferred taxes, and income tax receivables. The results of these segments are shown below (in thousands):
|
Years Ended Dec. 31
|
Net Sales
|
Operating Income (Loss)
|
Total Assets
|
Depreciation
|
Capital Expenditures
|
||||||||||||||||
|
Standard Products
|
2009
|
11,791 | 1,959 | 5,698 | 139 | 283 | |||||||||||||||
|
2008
|
8,581 | 1,235 | 4,651 | 120 | 34 | ||||||||||||||||
|
2007
|
10,019 | 2,198 | 5,049 | 89 | 129 | ||||||||||||||||
|
2006
|
9,234 | 1,606 | 5,127 | 95 | 73 | ||||||||||||||||
|
Systems/Services
|
2009
|
9,060 | 1,374 | 6,477 | 108 | 103 | |||||||||||||||
|
2008
|
7,360 | (516 | ) | 4,216 | 134 | 20 | |||||||||||||||
|
2007
|
8,849 | 599 | 3,939 | 119 | 48 | ||||||||||||||||
|
2006
|
10,173 | 1,328 | 6,499 | 111 | 66 | ||||||||||||||||
|
Corporate and
|
2009
|
— | — | 7,353 | — | — | |||||||||||||||
|
Unallocated
|
2008
|
— | — | 6,091 | — | — | |||||||||||||||
|
2007
|
— | — | 5,349 | — | — | ||||||||||||||||
|
2006
|
— | — | 1,749 | — | — | ||||||||||||||||
|
Total Company
|
2009
|
20,851 | 3,333 | 19,528 | 247 | 386 | |||||||||||||||
|
2008
|
15,941 | 719 | 14,958 | 254 | 54 | ||||||||||||||||
|
2007
|
18,868 | 2,797 | 14,337 | 208 | 177 | ||||||||||||||||
|
2006
|
19,407 | 2,934 | 13,375 | 206 | 139 | ||||||||||||||||
Export sales were based on countries where the customers were located. Central and South America includes all countries south of the United States. Asia includes customers in Australia, China, India, Korea and New Zealand. Europe and other consists of Europe and Africa. The Middle East was primarily sales to Afghanistan and Iraq. Export sales from the Company’s operations at December 31, were as follow (in thousands):
- 44 -
|
2009
|
2008
|
2007
|
2006
|
|||||||||||||
|
Central and South America
|
$ | 4,056 | $ | 755 | $ | 580 | $ | 1,269 | ||||||||
|
Canada
|
1,236 | 1,160 | 717 | 645 | ||||||||||||
|
Asia
|
2,904 | 1,209 | 3,187 | 4,527 | ||||||||||||
|
Europe and other
|
731 | 539 | 800 | 441 | ||||||||||||
|
Middle East
|
983 | 3,056 | 2,248 | — | ||||||||||||
| $ | 9,910 | $ | 6,719 | $ | 7,532 | $ | 6,882 | |||||||||
19. SUMMARIZED QUARTERLY UNAUDITED FINANCIAL DATA (RESTATED)
| 2009 | ||||||||||||||||
| Q1 | Q2 | Q3 | Q4 | |||||||||||||
|
Net Sales
|
$ | 3,575,031 | $ | 4,786,898 | $ | 4,536,850 | $ | 7,952,365 | ||||||||
|
Gross Profit
|
1,344,122 | 2,078,412 | 2,060,029 | 3,247,606 | ||||||||||||
|
Operating Income (Loss)
|
(51,339 | ) | 696,862 | 739,242 | 1,947,952 | |||||||||||
|
Net Income
|
$ | 68,154 | $ | 436,349 | $ | 521,014 | $ | 1,203,084 | ||||||||
|
Basic income per common share
|
$ | 0.01 | $ | 0.10 | $ | 0.11 | $ | 0.26 | ||||||||
|
Diluted income per common share
|
$ | 0.01 | $ | 0.09 | $ | 0.10 | $ | 0.24 | ||||||||
| 2008 | ||||||||||||||||
| Q1 | Q2 | Q3 | Q4 | |||||||||||||
|
Net Sales
|
$ | 3,819,048 | $ | 4,025,016 | $ | 4,395,775 | $ | 3,701,489 | ||||||||
|
Gross Profit
|
1,551,256 | 1,338,290 | 1,551,356 | 1,050,741 | ||||||||||||
|
Operating Income (Loss)
|
370,954 | 321,222 | 318,022 | (291,281 | ) | |||||||||||
|
Net Income
|
$ | 280,275 | $ | 252,329 | $ | 188,246 | $ | (221,542 | ) | |||||||
|
Basic income (loss) per common share
|
$ | 0.06 | $ | 0.06 | $ | 0.04 | $ | (0.05 | ) | |||||||
|
Diluted income (loss) per common share
|
$ | 0.06 | $ | 0.05 | $ | 0.04 | $ | (0.04 | ) | |||||||
| 2007 | ||||||||||||||||
| Q1 | Q2 | Q3 | Q4 | |||||||||||||
|
Net Sales
|
$ | 3,146,744 | $ | 4,217,871 | $ | 6,607,220 | $ | 4,896,266 | ||||||||
|
Gross Profit
|
1,120,265 | 1,586,579 | 3,006,276 | 1,717,660 | ||||||||||||
|
Operating Income (Loss)
|
(21,260 | ) | 512,006 | 1,836,912 | 469,592 | |||||||||||
|
Net Income
|
$ | 1,137 | $ | 351,758 | $ | 1,161,580 | $ | 341,223 | ||||||||
|
Basic income per common share
|
$ | 0.00 | $ | 0.08 | $ | 0.26 | $ | 0.08 | ||||||||
|
Diluted income per common share
|
$ | 0.00 | $ | 0.07 | $ | 0.23 | $ | 0.07 | ||||||||
| 2006 | ||||||||||||||||
| Q1 | Q2 | Q3 | Q4 | |||||||||||||
|
Net Sales
|
$ | 4,076,108 | $ | 4,421,174 | $ | 4,783,365 | $ | 6,125,991 | ||||||||
|
Gross Profit
|
1,759,946 | 1,583,471 | 1,520,476 | 2,365,916 | ||||||||||||
|
Operating Income
|
533,287 | 630,220 | 565,407 | 1,205,346 | ||||||||||||
|
Net Income
|
$ | 347,642 | $ | 460,464 | $ | 375,873 | $ | 686,675 | ||||||||
|
Basic income per common share
|
$ | 0.08 | $ | 0.11 | $ | 0.09 | $ | 0.16 | ||||||||
|
Diluted income per common share
|
$ | 0.07 | $ | 0.10 | $ | 0.08 | $ | 0.14 | ||||||||
- 45 -
The sum of the quarterly earnings per share amounts do not equal the amount reported for the full year since per share amounts are computed independently for each quarter and for the full year based on respective weighted-average shares outstanding and other dilutive potential shares. The reconciliation of previously reported selected unaudited quarterly financial and restated quarterly financial data in 2009 is as follows:
|
For the Three Months Ended March 31, 2009
|
||||||||||||
|
Reported
|
Adjustment
|
As Restated
|
||||||||||
|
Net sales and revenues
|
$ | 3,575,031 | $ | — | $ | 3,575,031 | ||||||
|
Cost of sales and revenues
|
2,188,742 | 42,167 | 2,230,909 | |||||||||
|
Gross profit
|
1,386,289 | (42,167 | ) | 1,344,122 | ||||||||
|
Selling, general and administrative
|
1,010,035 | 26,337 | 1,036,372 | |||||||||
|
Research and development expenses
|
359,089 | — | 359,089 | |||||||||
|
Total operating expenses
|
1,369,124 | 26,337 | 1,395,461 | |||||||||
|
Operating income (loss)
|
17,165 | (68,504 | ) | (51,339 | ) | |||||||
|
Interest income (expense), net
|
172,493 | — | 172,493 | |||||||||
|
Income before income taxes
|
189,658 | (68,504 | ) | 121,154 | ||||||||
|
Income taxes
|
83,000 | (30,000 | ) | 53,000 | ||||||||
|
Net income
|
$ | 106,658 | $ | (38,504 | ) | $ | 68,154 | |||||
|
Diluted income per share
|
$ | 0.02 | $ | (0.01 | ) | $ | 0.01 | |||||
|
For the Three Months Ended June 30, 2009
|
||||||||||||
|
Reported
|
Adjustment
|
As Restated
|
||||||||||
|
Net sales and revenues
|
$ | 4,786,898 | $ | — | $ | 4,786,898 | ||||||
|
Cost of sales and revenues
|
2,843,518 | (135,032 | ) | 2,708,486 | ||||||||
|
Gross profit
|
1,943,380 | 135,032 | 2,078,412 | |||||||||
|
Selling, general and administrative
|
961,872 | 7,176 | 969,048 | |||||||||
|
Research and development expenses
|
412,502 | — | 412,502 | |||||||||
|
Total operating expenses
|
1,374,374 | 7,176 | 1,381,550 | |||||||||
|
Operating income
|
569,006 | 127,856 | 696,862 | |||||||||
|
Interest income (expense), net
|
22,487 | — | 22,487 | |||||||||
|
Income before income taxes
|
591,493 | 127,856 | 719,349 | |||||||||
|
Income taxes
|
232,700 | 50,300 | 283,000 | |||||||||
|
Net income
|
$ | 358,793 | $ | 77,556 | $ | 436,349 | ||||||
|
Diluted income per share
|
$ | 0.07 | $ | 0.02 | $ | 0.09 | ||||||
|
For the Three Months Ended September 30, 2009
|
||||||||||||
|
Reported
|
Adjustment
|
As Restated
|
||||||||||
|
Net sales and revenues
|
$ | 4,536,850 | $ | — | $ | 4,536,850 | ||||||
|
Cost of sales and revenues
|
2,613,524 | (136,703 | ) | 2,476,821 | ||||||||
|
Gross profit
|
1,923,326 | 136,703 | 2,060,029 | |||||||||
|
Selling, general and administrative
|
905,980 | (28,670 | ) | 877,310 | ||||||||
|
Research and development expenses
|
443,477 | — | 443,477 | |||||||||
|
Total operating expenses
|
1,349,457 | (28,670 | ) | 1,320,787 | ||||||||
|
Operating income
|
573,869 | 165,373 | 739,242 | |||||||||
|
Interest income (expense), net
|
20,772 | — | 20,772 | |||||||||
|
Income before income taxes
|
594,641 | 165,373 | 760,014 | |||||||||
|
Income taxes
|
187,300 | 51,700 | 239,000 | |||||||||
|
Net income
|
$ | 407,341 | $ | 113,673 | $ | 521,014 | ||||||
|
Diluted income per share
|
$ | 0.08 | $ | 0.02 | $ | 0.10 | ||||||
- 46 -
20. LEGAL CONTINGENCIES
Various legal claims can arise from time to time in the normal course of business which, in the opinion of management, will have no material effect on the Company’s financial statements. The Company has been named in a compensation claim under the Indian Anti-Trust Law that is pending before The Monopolies and Restrictive Trade Practices Commission in New Delhi, India. Management believes that the case is unsubstantiated and does not anticipate that any material losses will occur.
Item 9 - Changes In and Disagreements with Accountants on Accounting and Financial Disclosure
Not applicable.
Item 9A - Controls and Procedures
(a) Disclosure Controls and Procedures
Our management (with the participation of our Chief Executive Officer and Chief Financial Officer) evaluated the effectiveness of our disclosure controls and procedures (as defined in Rules 13a-15(e) and 15d-15(e) under the Securities Exchange Act of 1934, as amended (the “Exchange Act”)), as of December 31, 2009, the end of the fiscal period covered by this report on Form 10-K. The Company maintains disclosure controls and procedures that are designed to ensure that information required to be disclosed in our Securities Exchange Act of 1934 reports are recorded, processed, summarized and reported within the time periods specified in the SEC's rules and forms, and that such information is accumulated and communicated to our management, including our chief executive officer and chief financial officer, as appropriate, to allow timely decisions regarding required disclosure. As described below, management has identified material weaknesses in our internal control over financial reporting, which is an integral component of our disclosure controls and procedures. Solely as a result of these material weaknesses, our Chief Executive Officer and Chief Financial Officer have concluded that our disclosure controls and procedures were not effective as of December 31, 2009.
(b) Management’s Annual Report on Internal Control Over Financial Reporting
Management of Sutron Corporation is responsible for establishing and maintaining adequate internal control over financial reporting as defined in Rules 13a-15(f) and 15d-15(f) under the Securities Exchange Act of 1934. Sutron’s internal control over financial reporting is a process designed to provide reasonable assurance regarding the reliability of financial reporting and the preparation of financial statements for external purposes in accordance with accounting principles generally accepted in the United States of America. Internal control over financial reporting includes those written policies and procedures that:
|
·
|
pertain to the maintenance of records that, in reasonable detail, accurately and fairly reflect the transactions and dispositions of Sutron’s assets;
|
|
·
|
provide reasonable assurance that transactions are recorded as necessary to permit preparation of financial statements in accordance with accounting principles generally accepted in the United States of America;
|
|
·
|
provide reasonable assurance that receipts and expenditures of Sutron are being made only in accordance with authorization of management and directors of Sutron; and
|
|
·
|
provide reasonable assurance regarding prevention or timely detection of unauthorized acquisition, use or disposition of assets that could have a material effect on the consolidated financial statements.
|
- 47 -
Internal control over financial reporting includes the controls themselves, monitoring and internal auditing practices and actions taken to correct deficiencies as identified. Because of its inherent limitations, internal control over financial reporting may not prevent or detect misstatements. Also, projections of any evaluation of effectiveness to future periods are subject to the risk that controls may become inadequate because of changes in conditions, or that the degree of compliance with the policies or procedures may deteriorate.
Management assessed the effectiveness of Sutron’s internal control over financial reporting as of December 31, 2009. Management based this assessment on criteria for effective internal control over financial reporting described in “Internal Control – Integrated Framework” issued by the Committee of Sponsoring Organizations of the Treadway Commission. Management’s assessment included an evaluation of the design of Sutron’s internal control over financial reporting and testing of the operational effectiveness of its internal control over financial reporting. Based on this assessment, Management believes that, as of December 31, 2009, the Company’s internal control over financial reporting was ineffective based on this criteria. Management reviewed the results of its assessment with the Audit Committee of our Board of Directors.
Material Weaknesses in Internal Control Over Financial Reporting
A material weakness is a deficiency, or a combination of deficiencies, in internal control over financial reporting such that there is a reasonable possibility that a material misstatement of the annual or interim financial statements will not be prevented or detected on a timely basis.
Our management concluded that there was a material weakness in regards to the setting of inventory standard costs due to inventory standard costs not being reviewed and adjusted annually. Management also determined that income tax benefit relating to tax deductible stock compensation expense should have been classified as additional paid-in capital resulting in the understatement of income tax expense. These material weaknesses resulted in errors in the Company’s accounting and disclosures for inventory and income tax expense and resulted in the restatement of the financial statements for the years ended December 31, 2008, 2007 and 2006, including all quarterly periods for the years ended December 31, 2006, 2007 and 2008 as well as the first three quarters of 2009.
(c) Remedial Measures
We are developing and implementing new procedures to remediate the material weaknesses that existed in our internal control over financial reporting as of December 31, 2009. Specifically, we will be creating a new procedure to annually review and update standard costs for all inventory items. We will also be reviewing and creating new procedures for reporting income tax expense relating to employee stock compensation. These procedures will be documented internal controls and will be reviewed and audited annually.
(d) Attestation Report of the Independent Registered Public Accounting Firm
This annual report does not include an attestation report of the Company’s registered public accounting firm regarding internal control over financial reporting. Management's report was not subject to attestation by the Company's registered public accounting firm pursuant to temporary rules of the SEC that permit the Company to provide only management's report in this annual report.
(e) Changes in Internal Control Over Financial Reporting
There have been no changes in our internal control over financial reporting that occurred during the last fiscal year that have materially affected, or are reasonably likely to materially affect, our internal control over financial reporting.
Item 9B – Other Information
None
- 48 -
PART III
Item 10 – Directors, Executive Officers and Corporate Governance
The Board has adopted a Code of Conduct and Ethics that applies to Sutron’s principal executive officer, principal financial officer and all other employees of the Company. This Code of Conduct and Ethics is posted on the Company’s website at http://www.sutron.com on the investors’ page. Any amendments to the Code of Ethics and waivers of the Code of Ethics for our principal executive, accounting or financial officers will be published on our website.
The remainder of information required for this Item is incorporated by reference to the Proxy Statement to be filed in connection with our 2010 Annual Meeting of Shareholders.
Item 11 - Executive Compensation
The information required for this Item is incorporated by reference to the Proxy Statement to be filed in connection with our 2010 Annual Meeting of Shareholders.
Item 12 - Security Ownership of Certain Beneficial Owners and Management and Related Stockholder Matters
The information required for this Item is incorporated by reference to the Proxy Statement to be filed in connection with our 2010 Annual Meeting of Shareholders.
Item 13 - Certain Relationships, Related Transactions and Directors Independence
The information required for this Item is incorporated by reference to the Proxy Statement to be filed in connection with our 2010 Annual Meeting of Shareholders.
Item 14 – Principal Accounting Fees and Services
The information required for this Item is incorporated by reference to the Proxy Statement to be filed in connection with our 2010 Annual Meeting of Shareholders.
PART IV
Item 15 – Exhibits, Financial Statements and Schedules
(a)(1 and 2) Financial Statements and Schedules
The financial statements listed in Item 8 in the Index to Consolidated Financial Statements on page 24 are filed as part of this report.
(b) Exhibits
|
3.2
|
Copy of Articles of Amendment to the Articles of Incorporation and Articles of Reduction of Stated Capital of the Company (incorporated by reference as filed with the Securities and Exchange Commission on September 16, 1983)
|
|
3.3
|
By-laws of the Company (incorporated by reference as filed with the Securities and Exchange Commission on September 16, 1983)
|
|
10.18
|
Lease Agreement dated November 17, 2008 between Sutron Corporation and FP Sterling Park II, LLC (incorporated by reference as filed with the Securities and Exchange Commission on March 31, 2009)
|
|
10.19
|
Loan Modification Agreement dated September 2, 2009 between Sutron Corporation and Branch Banking and Trust Company of Virginia, a North Carolina Banking Corporation
|
|
10.20
|
Form of Stock Option Plan*
|
|
10.21
|
Form of Stock Option Agreement*
|
|
23.1
|
Consent of Independent Registered Public Accounting Firm
|
- 49 -
|
23.2
|
Consent of Independent Registered Public Accounting Firm
|
|
31.1
|
Certification pursuant to Rule 13a-14(a) or Rule 15d-14(a) of the Chairman of the Board of Directors, President and Chief Executive Officer
|
|
31.2
|
Certification pursuant to Rule 13a-14(a) or Rule 15d-14(a) of the Chief Financial Officer and Treasurer
|
|
32
|
Certification pursuant to 18 U.S.C. Section 1350, as adopted pursuant to Section 906 of the Sarbanes-Oxley Act of 2002
|
|
*
|
Indicates management contract or compensatory plan or arrangement
|
- 50 -
SIGNATURES
In accordance with Section 13 or 15(d) of the Exchange Act, the Registrant caused this report to be signed on its behalf by the undersigned, thereunto duly authorized.
Sutron Corporation
(Registrant)
|
/s/ Raul S. McQuivey
By: Raul S. McQuivey,
|
Date: April 14, 2010
|
|
Chairman of the Board of Directors, President
|
|
|
and Chief Executive Officer
|
|
|
In accordance with the Securities Exchange Act, this report has been signed by the following persons on behalf of the Registrant and in the capacities and on the dates indicated.
|
|
|
/s/ Raul S. McQuivey
By: Raul S. McQuivey,
|
Date: April 14, 2010
|
|
Chairman of the Board of Directors, President
|
|
|
and Chief Executive Officer
|
|
|
/s/ Daniel W. Farrell
By: Daniel W. Farrell, Director and Vice President
|
Date: April 14, 2010
|
|
/s/ Andrew D. Lipman
By: Andrew D. Lipman, Director
|
Date: April 14, 2010
|
|
/s/ Leland R. Phipps
By: Leland R. Phipps, Director
|
Date: April 14, 2010
|
|
/s/ Robert F. Roberts, Jr.
By: Robert F. Roberts, Jr., Director
|
Date: April 14, 2010
|
|
/s/ Sidney C. Hooper
By: Sidney C. Hooper, Chief Financial Officer
|
Date: April 14, 2010
|
|
(Principal Financial and Accounting Officer)
|
|
- 51 -