Attached files
| file | filename |
|---|---|
| EX-23 - HOOKER FURNITURE CORP | ex23.htm |
| EX-32.1 - HOOKER FURNITURE CORP | ex32-1.htm |
| EX-4.3 - HOOKER FURNITURE CORP | ex4-3a.htm |
| EX-31.1 - HOOKER FURNITURE CORP | ex31-1.htm |
| EX-31.2 - HOOKER FURNITURE CORP | ex31-2.htm |
| EX-10.1C - HOOKER FURNITURE CORP | ex10-1c.htm |
| EX-10.1H - HOOKER FURNITURE CORP | ex10-1h.htm |
UNITED STATES
SECURITIES AND EXCHANGE COMMISSION
Washington, DC 20549
Form 10-K
Annual Report Pursuant to Section 13 or 15(d) of the Securities Exchange Act of 1934
For the fiscal year ended January 31, 2010
Commission file number 000-25349
HOOKER FURNITURE CORPORATION
(Exact name of registrant as specified in its charter)
| Virginia | 54-0251350 |
| (State or other jurisdiction of incorporation or organization) | (I.R.S. Employer Identification Number) |
440 East Commonwealth Boulevard, Martinsville, VA 24112
(Address of principal executive offices, Zip Code)
(276) 632-0459
(Registrant’s telephone number, including area code)
Securities registered pursuant to Section 12(b) of the Act:
| Name of Each Exchange | |
| Title of Each Class | on Which Registered |
| Common Stock, no par value | NASDAQ Global Select Market |
Securities registered pursuant to Section 12(g) of the Act: None
Indicate by check mark if the registrant is a well-known seasoned issuer, as defined in Rule 405 of the Securities Act. Yes o No x
Indicate by check mark if the registrant is not required to file reports pursuant to Section 13 or Section 15(d) of the Act. Yes o No x
Indicate by check mark whether the registrant (1) has filed all reports required to be filed by Section 13 or 15(d) of the Securities Exchange Act of 1934 during the preceding 12 months (or for such shorter period that the registrant was required to file such reports), and (2) has been subject to such filing requirements for the past 90 days. Yes x No o
Indicate by check mark whether the registrant has submitted electronically and posted on its corporate Web site, if any, every Interactive Data File required to be submitted and posted pursuant to Rule 405 of Regulation S-T (§232.405 of this chapter) during the preceding 12 months (or for such shorter period that the registrant was required to submit and post such files). Yes o No o
Indicate by check mark if disclosure of delinquent filers pursuant to Item 405 of Regulation S-K (§229.405 of this chapter) is not contained herein, and will not be contained, to the best of registrant’s knowledge, in definitive proxy or information statements incorporated by reference in Part III of this Form 10-K or any amendment to this Form 10-K. o
Indicate by check mark whether the registrant is a large accelerated filer, an accelerated filer, a non-accelerated filer, or a smaller reporting company. See the definitions of “large accelerated filer,” “accelerated filer” and “smaller reporting company” in Rule 12b-2 of the Exchange Act. (Check one):
|
Large accelerated Filer o
|
Accelerated Filer x
|
|
Non-accelerated Filer o
|
Smaller reporting company o
|
|
|
(Do not check if a smaller reporting company)
|
Indicate by check mark whether the registrant is a shell company (as defined in Rule 12b-2 of the Act). Yes o No x
State the aggregate market value of the voting and non-voting common equity held by non-affiliates computed by reference to the price at which the common equity was last sold, or the average bid and asked price of such common equity, as of the last business day of the registrant’s most recently completed second fiscal quarter: $141.8 million.
Indicate the number of shares outstanding of each of the registrant’s classes of common stock as of April 12, 2010:
| Common stock, no par value | 10,774,743 |
| (Class of common stock) | (Number of shares) |
Documents incorporated by reference: Portions of the registrant’s definitive Proxy Statement for its Annual Meeting of Shareholders scheduled to be held June 8, 2010 are incorporated by reference into Part III.
Hooker Furniture Corporation
TABLE OF CONTENTS
|
Part I
|
Page
|
|
|
Item 1.
|
3
|
|
|
Item 1A.
|
11
|
|
|
Item 1B.
|
13
|
|
|
Item 2.
|
14
|
|
|
Item 3.
|
14
|
|
|
Item 4.
|
14
|
|
|
15
|
||
|
Part II
|
||
|
Item 5.
|
16 | |
|
Item 6.
|
18
|
|
|
Item 7.
|
19
|
|
|
Item 7A.
|
33
|
|
|
Item 8.
|
34
|
|
|
Item 9.
|
34 | |
|
Item 9A.
|
34
|
|
|
Item 9B.
|
35
|
|
|
Part III
|
||
|
Item 10.
|
36
|
|
|
Item 11.
|
36
|
|
|
Item 12.
|
36
|
|
|
Item 13.
|
36
|
|
|
Item 14.
|
36
|
|
|
Part IV
|
||
|
Item 15.
|
37
|
|
|
38
|
||
|
F-1
|
||
Hooker Furniture Corporation
Part I
ITEM 1. BUSINESS
General
Incorporated in Virginia in 1924 and celebrating our 85th anniversary in 2009, Hooker Furniture Corporation (“Company”, “we”, “us”, and “our”) is ranked among the nation’s top 10 largest publicly traded furniture sources, based on 2008 shipments to U.S. retailers, according to Furniture/Today, a leading trade publication. We are a key resource for residential wood, metal and upholstered furniture. Our major wood furniture product categories include home entertainment, home office, accent, dining, bedroom and bath furniture under the Hooker Furniture brand, and youth furniture sold under the Opus Designs by Hooker brand. Our residential upholstered seating companies include Cherryville, N.C.-based Bradington-Young, LLC, a specialist in upscale motion and stationary leather furniture, and Bedford, Va.-based Sam Moore Furniture LLC, a specialist in upscale occasional chairs with an emphasis on cover-to-frame customization. An extensive selection of designs and formats along with finish and cover options in each of these product categories makes us a comprehensive resource for retailers primarily targeting the upper-medium price range. Our principal customers are retailers of residential home furnishings who are broadly dispersed throughout North America. Customers include independent furniture stores, specialty retailers, department stores, catalog merchants, interior designers and national and regional chains.
We market wood and metal furniture under the Hooker Furniture, Envision and Opus Designs by Hooker brand names, and upholstered furniture under the Bradington-Young, Sam Moore and Envision brand names. Furniture is designed and marketed as stand-alone products or products within small multi-piece groups or broader collections offering a unifying style, design theme and finish. Examples of Hooker Furniture collections include Beladora, North Hampton and Kensington. Products also are marketed by product category, such as The Great Entertainers, SmartWorks Home Office and Opus Designs Youth Furniture by Hooker. Our wood and metal furniture is typically designed for and marketed in the medium to high price range. Under the Bradington-Young upholstery brand, we offer a broad variety of residential leather and fabric upholstered furniture and specialize in leather reclining and motion chairs, sofas, club chairs and executive desk chairs. Under the Sam Moore upholstery brand, we offer upscale occasional chairs with an emphasis on fabric-to-frame customization in the upper-medium to high-end price niches. Domestically produced upholstered furniture is targeted at the upper-medium and upper price ranges, while imported upholstered furniture is targeted at the medium and upper-medium price ranges. Hooker is a full-line resource for retailers, offering furniture collections and products for virtually every room of the home.
We have transformed our company from a predominantly wood furniture manufacturer to a product design, global sourcing, logistics and marketing company for residential wood and upholstered furniture. Prior to 2003, nearly seventy percent of our net sales were derived from the sale of domestically produced wood furniture; subsequently, sales of our better valued imported wood furniture rapidly overtook, and have now replaced sales of our domestically made furniture. We systematically closed our domestic wood furniture plants as our product mix increasingly shifted toward imported wood and metal furniture. In March 2007, we closed our Martinsville, Va. wood furniture production facility, the last of our domestic wood furniture plants, marking our exit from domestic wood furniture manufacturing. This completed our transformation from a wood furniture manufacturer to a company that both markets high-value wood, metal and upholstered furniture sourced globally and manufactures upholstered furniture.
Our goal to expand our offerings to furniture retailers led to the acquisitions of Bradington-Young in January 2003 and Sam Moore Furniture in April 2007. These acquisitions provided Hooker’s customers with a broad array of upholstered seating options to complement our wood and metal furniture offerings. In December 2007, we acquired certain assets of Opus Designs Furniture, a specialist in moderately-priced youth furniture. The Opus Designs acquisition provides us with expanded product offerings in a previously under-developed niche. In order to meet the needs of a younger and less affluent consumer, we introduced our Envision product line in April 2009.
With our exit from domestic wood furniture manufacturing, and the addition of upholstery, expanded bedroom offerings, and a product line focused on meeting the needs of a younger and less affluent consumer, Hooker Furniture’s transition to a design, marketing, logistics and global sourcing business model focused on imported wood and metal and domestically produced and imported upholstered home furnishings is complete.
Strategy and Mission
Our mission is to “enrich the lives of the people we touch,” using the following strategy:
|
§
|
To offer world-class style, quality and product value as a complete residential wood, metal and upholstered furniture resource through excellence in product design, manufacturing, global sourcing, marketing, logistics, sales, and customer service.
|
|
§
|
To be an industry leader in sales growth and profitability performance, providing an outstanding investment for our shareholders and contributing to the well-being of our employees, customers, suppliers and community neighbors.
|
|
§
|
To nurture the relationship-focused, team-oriented and honor-driven corporate culture that has distinguished our company for over 85 years.
|
Home furnishings account for all of Hooker’s net sales. The percentages of net sales provided by each of our major product sub-categories for the fifty-two week fiscal year that ended January 31, 2010, the fifty-two week fiscal year that ended February 1, 2009, and the fifty-three week fiscal year that ended February 3, 2008, were as follows:
|
2010
|
2009
|
2008
|
||||||||||
|
Wood and metal furniture products
|
69 | % | 72 | % | 75 | % | ||||||
|
Upholstered furniture products
|
31 | % | 28 | % | 25 | % | ||||||
|
Total
|
100 | % | 100 | % | 100 | % | ||||||
Product Design, Product Collections and Styles
Our product lines cover most major style categories, including European and American traditional, transitional, urban, country, casual and cottage designs. We offer furniture in a variety of materials, such as various types of wood, metal, leather and fabric, as well as veneer and rattan, often accented with marble, stone, slate, ceramic, glass, brass and/or hand-painted finishes. Products are designed to be attractive to consumers both as individual furniture pieces and as pieces within whole-home collections. We believe our wide variety of product categories, styles and finishes enables us to anticipate and respond quickly to changing consumer preferences.
We offer retailers a comprehensive furniture resource, particularly in the upper-medium price point, which has been our historical price niche. In an effort to broaden the appeal of our line to both consumers and retailers, over the past year we have offered a good-better-best merchandising assortment. Broadening our merchandising price range makes us a more complete resource for our established dealers and increases the scope of our offerings to additional retailers who are positioned below or above our core upper-medium price point range.
At the Hooker, Bradington-Young and Sam Moore divisions, we have addressed the medium price points through our new Envision line, products of more casual styles in moderate scaling and more affordable price points aimed at younger shoppers aged 25 to 44 with household incomes of $75,000 and below. We have addressed the “best” price points and styling at Hooker through collections such as Beladora and Sanctuary.
Based on sales and market acceptance, we believe our products represent good value, and the style and quality of our furniture compares favorably with more premium-priced products.
The product life cycle for furniture continues to shorten as consumers demand innovative new features, functionality, style, finishes and fabrics that will enhance their lifestyle while providing value and durability. We believe our distinctive product design, development and market-launch process provides us with a competitive advantage. New styles in each of our product categories are designed and developed semi-annually to replace discontinued products and collections, and in some cases, to enter new product categories. Our collaborative product design process begins with the marketing team identifying customer needs and trends and conceptualizing product ideas and features. A variety of sketches are produced, usually by independent designers, from which prototype furniture pieces are built. We invite some of our independent sales representatives and a representative group of dealers to view and critique the prototypes. Based on this input, we may modify the designs and then prepare samples for full-scale production. We generally introduce new product styles at the International Home Furnishings Market (“the Market”) held each Fall and Spring in High Point, North Carolina, and support new product launches with promotions, public relations, product brochures, online marketing and point-of-purchase consumer materials. The flexibility of our global sourcing business model gives us the ability to offer a wide range of styles, materials and price points to a variety of retailers serving a range of consumer markets.
We continue to strive for innovation in the home office and home entertainment furniture categories, where we believe we are perceived as an industry leader.
Our approach to the home entertainment category is to offer presentation formats for TV sizes from 32” up to 73” in a variety of sizes and styles. Our stacking console program offers three sizes of consoles that may be displayed on retail floors in a pyramid formation to help the retailer maximize sales per square foot, while helping the consumer to easily evaluate size options. The smallest consoles in the stacking console program take 32” to 42” TVs; the middle size consoles take 50” to 55” TVs, and the largest consoles take 60” and up TVs. Sales of consoles with hutches also continue to grow, both with larger units that have back panels for mounting the TV and smaller units that include stands for 55” and smaller monitors on stands. This year, we are developing a new category within home entertainment for gaming consoles. Gaming consoles are designed to accommodate gaming stations like the Sony PlayStation®, Microsoft X-Box®, and the Nintendo Wii®. These units are more casual in design to fit in family rooms, take up to 65” monitors, and feature media storage drawers and a speaker compartment.
In the home theater and wall unit category, sales of large units designed for rooms with 10- and 12- foot ceilings have cooled off somewhat, but are still a substantial business. They can accommodate up to 73” TV’s, and we offer several styles that fit into the large atrium family rooms in suburban homes. We have had success in moving to some smaller scaled transitional designs to appeal to a more urban, younger customer. Our new lower priced Envision product has a retail price point that is 1/3 less than most Hooker products.
In home office, Hooker continues to offer full sized executive office solutions. We are also focusing on smaller-scaled executive desks and credenza/hutches at 66” wide (compared to widths of 72” and up) to fit smaller scaled homes. Modular home office introductions also fit these smaller spaces, and we had several new styles and formats this year, including one that is at a 36” height so consumers can work from a taller chair or standing up. We have also augmented the home office modular segment with a lower priced product from our “Kendra” collection in the Envision line, again aimed at the younger, more urban consumer.
Bradington -Young continues to focus on strengthening the value proposition of the domestic and import leather upholstery product lines through the introduction of innovative products and programs. On the domestic side of the business, the continuing implementation of Lean Manufacturing process improvement technology is contributing to increasing value to the consumer through the reduction of non-value added costs and improved service to our customers. Following the success of Hooker and Sam Moore at this past October 2009 Market, Bradington-Young launched a new lifestyle upholstery product line under the Envision brand. Envision targets a younger consumer desiring high quality transitional styling in a more moderate price range. The introduction of Envision was highly successful and will be produced in domestic factories. Bradington-Young has also created a brand positioning statement from which to build on: "Comfort Never Looked So Good." This brand positioning statement will be used for all communications to dealers, consumers and employees. Lastly, Bradington-Young continues to expand its dealer base through aggressive merchandising and marketing initiatives targeting the Top 100 home furnishings dealers.
Sam Moore’s product offerings fill several niches in the occasional chair category, offering exposed wood as well as fully upholstered seating. Sam Moore’s occasional seating covers multiple styles that include upholstered swivel rockers, club chairs, wings, chaises, benches, ottomans, office chairs, settees, dining chairs and barstools in 18th Century, French, traditional, transitional, and contemporary styles. Most chair styles are available in a choice of either fabric or leather.
Sam Moore has a modern finishing facility that offers a choice of 30 different finishes for any exposed wood chair selection. Over one-half of the styles shipped are custom ordered with the customer’s choice of leather, fabric and finish. In addition, Sam Moore customers may provide their own fabric (customer’s own material “COM”) to be applied to a chair. In fact, COM is the most popular fabric application choice of customers.
At the April High Point Market, the Sam Moore showroom was relocated to a new space that is contiguous to the Bradington-Young showroom, with a combined lobby/reception function. As a result, customer visits and new account additions were significantly increased for both companies. Also at that market, Sam Moore introduced Envision by Sam Moore, a new collection of more moderately priced chairs, styled to appeal to younger, more lifestyle oriented consumers. Along with more fashion forward fabrics and frame designs in the core product line, Sam Moore’s product line is now more updated for today’s consumers and marketplace.
It is Sam Moore’s goal to be “America’s Premier Chair Specialist” by offering a quality product from a complete selection of chairs in fresh leathers and fabrics with exceptional wood finishes.
During fiscal year 2010, we focused on updating product offerings for Opus Designs by Hooker Furniture, a specialist in moderately priced youth furniture, which we acquired in December 2007. Since that time, the sales, marketing, merchandising and operations of Opus Designs have been successfully integrated into our company, and the line positioned itself for growth by gaining floor placements with approximately 600 new retail customers. Despite a double-digit sales downturn in the furniture industry, sales of Opus Designs products increased slightly during fiscal 2009, but decreased by $1 million in fiscal year 2010. Opus Designs by Hooker is poised to introduce several new groups in 2010 to expand its appeal. Focusing on upscale finishes, cleaner lines, superior quality and more transitional styling, the groups will reflect the changing tastes of the youth furniture consumer.
Sourcing
Hooker Furniture has the capability, resources, longstanding business relationships and experience to efficiently and cost effectively source our wood, metal and upholstered furniture.
Imported Products
We have sourced products from foreign manufacturers since 1988. We have imported finished furniture in a variety of styles, materials and product lines. We believe the best way to leverage our financial strength and differentiate our import business from the industry is through innovative and collaborative design, outstanding products, great value, consistent quality, easy ordering, and quick delivery through world-class global logistics and distribution systems. Imported wood, metal and upholstered furniture accounted for approximately 76% of net sales in fiscal 2010, 77% of net sales in fiscal 2009 and 76% of net sales in fiscal 2008.
Hooker imports products primarily from China, the Philippines, Indonesia, Vietnam, and Thailand through direct relationships with factories and with agents representing other factories. Because of the large number and diverse nature of the foreign factories from which we source our imported products, we have significant flexibility in the placement of products in any particular factory or country. Factories located in China are our primary resource for imported furniture. In fiscal 2010, imported products sourced from China accounted for approximately 94% of import purchases; and the factory in China from which we directly source the most product accounted for approximately 42% of our worldwide purchases of imported product. A sudden disruption in our supply chain from this factory, or from China in general, could significantly compromise our ability to fill customer orders for products manufactured at that factory or in that country. If such a disruption were to occur, we believe that we would have sufficient inventory to adequately meet demand for approximately four months. Also, with the broad spectrum of product we offer, we believe that, in some cases, buyers could be offered similar product available from alternative sources. We believe that we could, most likely at higher cost, source most of the products currently sourced in China from factories in other countries and could produce certain upholstered products domestically at our own factories. However, supply disruptions and delays on selected items could occur for up to six months. If we were to be unsuccessful in obtaining those products from other sources or at a comparable cost, then a sudden disruption in our supply chain from our largest import furniture supplier, or from China in general, could have a short-term material adverse effect on our results of operations. Given the capacity available in China and other low-cost producing countries, we believe the risks from these potential supply disruptions are manageable.
Our imported furniture business is subject to the usual risks inherent in importing products manufactured abroad, including, but not limited to, supply disruptions and delays, currency exchange rate fluctuations, economic and political developments and instability, as well as the laws, policies, and actions of foreign governments and the United States affecting trade, including tariffs.
For imported products, Hooker generally negotiates firm pricing with its foreign suppliers in U.S. Dollars, typically for a term of at least one year. We accept the exposure to exchange rate movements beyond these negotiated periods. We do not use derivative financial instruments to manage this risk. Since we transact our imported product purchases in U.S. Dollars, a relative decline in the value of the U.S. Dollar could increase the price we pay for imported products beyond the negotiated periods. We generally expect to reflect substantially all of the effects of any price increases from suppliers in the prices we charge for imported products. These price changes could adversely impact sales volume and profit margin during affected periods. Conversely, a relative increase in the value of the U.S. Dollar could decrease the cost of imported products and favorably impact net sales and profit margins during affected periods. See also “Item 7A. Quantitative and Qualitative Disclosures about Market Risk.”
Manufacturing and Raw Materials
At January 31, 2010, Hooker Furniture operated approximately 615,000 square feet of manufacturing and supply plant capacity in North Carolina and Virginia for its domestic upholstered furniture production. We consider the machinery and equipment at these locations generally to be modern and well-maintained.
We believe that there is a viable future for domestically produced upholstery, which, as an industry, has been less affected by import competition over the last five years than wood furniture production. Domestic seating companies with strong positions in the upper-medium to high-end price point have been the domestic furniture manufacturers least impacted by lower cost imports. In addition, domestic upholstery manufacturers have two key competitive advantages compared to imported upholstery manufacturers:
|
·
|
offering customized cover-to-frame and fabric-to-frame combinations to the upscale consumer and interior design trade; and,
|
|
·
|
offering quick four- to six-week product delivery of custom products.
|
Due to these and other competitive advantages, we remain committed to maintaining domestic production of upholstered furniture.
Bradington-Young’s strategy for its upholstered furniture production operation is to be a comprehensive leather resource for retailers positioned in the upper and upper-medium price ranges. Bradington-Young offers a broad selection of approximately 273 leather covers for domestically produced upholstered furniture. The motion category comprises approximately 56% of Bradington-Young’s domestic production. The upholstery manufacturing process begins with the cutting of leather or fabric and the cutting and precision machining of frames. Precision frames are important for motion furniture to operate properly and to provide durable service over the life of the products. Finally, the cut leather or fabric upholstery, frames, foam and other materials are assembled to build reclining chairs, executive seating, stationary seating and multiple-seat reclining furniture.
Sam Moore’s strategy for its upholstery production operation is to be a complete source of fashionable upholstered chairs for all rooms of the home and other upholstered accent pieces, such as decorative upholstered headboards. Sam Moore offers a diverse range of approximately 200 different styles of upholstered products in over 550 fabric choices and over 100 leather choices. Sam Moore produces 95% of its products domestically at its single, large manufacturing facility in Bedford, Va.
Significant materials used in manufacturing upholstered furniture products include leather or fabric, foam, wooden frames and metal mechanisms. Most of the leather is imported from Italy, South America and China. Leather is purchased as full hides, which Bradington-Young and Sam Moore then cut and sew, and as pre-cut and sewn hides processed by the vendor to pattern specifications.
Costs for leather and leather products from Asia decreased modestly during fiscal 2010 due to economic pressures. As a result, Bradington-Young dealer prices were unchanged at the Fall Market. Late in the year, upward price pressure increased due to hide shortage and increased demand.
We believe that our sources for raw materials are adequate and that we are not dependent on any one supplier. Hooker’s five largest suppliers accounted for approximately 31% of our raw materials supply purchases for domestic upholstered furniture manufacturing operations in fiscal 2010. Two suppliers accounted for more than 10% of our raw material purchases at 14% and 11% of total raw materials purchases, respectively. Should disruptions with either of these suppliers occur, we believe that we could successfully source these products from other suppliers without significant disruptions to our operations.
Distribution
Hooker companies utilize 95,000 square feet of showroom space in High Point, N.C. to introduce new products and collections and increase sales of existing products during the industry’s Spring and Fall Pre-Markets and Markets. The Company also works directly with several large customers to develop proprietary products exclusively for those customers.
We sell our furniture through over 75 independent sales representatives to retailers of residential home furnishings, who are broadly dispersed throughout North America, including:
|
·
|
independent furniture retailers such as Furnitureland South of Jamestown/High Point, N.C., Mathis Brothers of Oklahoma and California, Baer’s Furniture of South Florida, and Berkshire Hathaway-owned companies Star Furniture, Jordan’s Furniture, Nebraska Furniture Mart and R.C. Willey;
|
|
·
|
department stores such as Macy’s and Dillard’s;
|
|
·
|
regional chain stores such as Raymour & Flanigan and Haverty’s;
|
|
·
|
national chain stores such as Z Gallerie and Crate & Barrel; and
|
|
·
|
catalog merchandisers such as Frontgate and the Horchow Collection, a unit of Neiman Marcus.
|
Hooker sold to more than 4,100 customers during fiscal 2010. No single customer accounted for more than 4% of our net sales in 2010. No significant part of our business is dependent upon a single customer, the loss of which would have a material effect on our business. However, the loss of several of our major customers could have a material impact on our business. In addition to our broad domestic customer base, approximately 4% of our net sales in 2010 were to international customers.
We believe this broad network of retailers and independent sales representatives reduces our exposure to regional recessions and allows us to capitalize on emerging trends in channels of distribution.
Hooker offers tailored merchandising programs, such as our SmartLiving ShowPlace in-store galleries, Seven Seas Treasures boutiques and Home Entertainment and SmartWorks Home Office galleries, to address each channel of distribution. These galleries are currently dedicated principally to furniture groups and whole-home collections under the Hooker, Bradington-Young, Sam Moore, and Opus Designs by Hooker Furniture brands, with plans to increase the number of galleries that carry our brands. These galleries typically comprise 3,500 to 8,000 square feet of retail space. The mission of the SmartLiving program is to develop progressive partnerships with retailers by providing a merchandising and marketing plan to drive increased sales and profitability and positively influence consumers’ purchase decisions, satisfaction and loyalty through an enhanced shopping experience.
Currently, we have approximately 60 SmartLiving Showplace Galleries established throughout the country. There are approximately 340 dealers who dedicate space in their stores to display our Seven Seas Treasures line of imported upscale and casual dining room furniture, metal beds, occasional tables and functional accents, including hand-painted furniture, carved writing desks, tables and chests. In the home entertainment and home office categories, in which we are recognized as an industry leader, we have well-developed product specialty gallery programs supported by semi-annual national sales promotions, a special website dealer locator and point-of-purchase collateral materials. Over 280 dealers have Home Entertainment by Hooker galleries and more than 200 dealers have SmartWorks Home Office galleries in their retail stores There are more than 130 Opus Designs by Hooker Furniture youth furniture galleries around the country. In addition, over 1,450 retailers offer Bradington-Young leather upholstery products and over 1,500 retailers offer Sam Moore Furniture occasional seating products.
During fiscal 2010, we hired a seasoned international furniture sales specialist as our Vice President of International Sales. We believe that our broad array of product across price points and covering both wood furniture and upholstery, makes us an attractive supplier to the international marketplace. With the variety of product our suppliers can deliver, we are able to design product catering to the needs of a particular geographic region. We believe that, over a few years, we can grow our international sales to a much more meaningful part of our business. Subsequent to the fiscal 2010 year-end, we hired an executive, who had previously served as a third generation independent sales representative for Hooker, as our Director of National Accounts in order to focus on growing our business at targeted national and regional key accounts. We believe we can significantly grow our business with this important group of dealers through this focused attention.
Warehousing, Inventory and Supply Chain Management
During fiscal year 2010, we continued to refine our supply chain and sourcing operations via systems enhancements and personnel additions in both the U.S. and China. Investments made in a new Global Purchasing System and a web-based Global Sourcing Management System, coupled with upgrades to current demand and inventory planning platforms, should help improve order fulfillment rates.
We distribute furniture to retailers from our distribution centers and warehouses in Virginia and North Carolina, as well as directly from Asia via our Container Direct Program. We have warehousing and distribution arrangements in China with two of our largest suppliers of imported products. The warehouse and distribution facilities are owned by the suppliers and operated by those suppliers and a third party utilizing a global warehouse management system that updates daily our central inventory management and order processing systems. Under the Container Direct Program, we offer directly to retailers in the U.S. a focused mix of over 1,400 of our best selling items sourced from these three suppliers. The program features an internet-based product ordering system and a delivery notification system that is easy to use and available to our pre-registered dealers. In addition, we also ship containers directly from a variety of other suppliers in Asia. We are committed to exploring ways to continually improve our distinctive, value-added Container Direct Program through additional warehouses at key vendors, product consolidation and routing strategies aimed at shortening delivery times and providing significant cost savings for retailers.
Seven Seas Seating, Bradington-Young’s line of imported upholstered furniture, experienced rapid growth from its introduction in the 2003 fourth quarter through fiscal year 2008. In fiscal year 2009, net sales of Seven Seas Seating declined by $1.3 million, or 9.2% to $12.9 million as compared to $14.2 million in fiscal 2008. Fiscal year 2010 sales were essentially flat at $12.7 million. Unlike domestic upholstered production, Seven Seas Seating products are purchased based on a forecast of product demand and shipped out of inventory from 109,000 square feet of leased warehouse space in Cherryville, N.C. Seven Seas Seating may also be purchased under the Container Direct Program, and a container order can include any of the product produced at a given supply plant.
In April 2009 Sam Moore introduced its Paris Flea Market line of imports. The line is a diverse product mix including ottomans, benches, chairs, loveseats, and sofas. There are 63 styles in the line produced by 3 factories in China. Sam Moore warehouses these styles and orders mixed containers according to rate of sale. Orders are shipped from their facility in Bedford, Va. In addition to Paris Flea Market, Sam Moore also imports one club chair and ottoman set and a recliner. They are ordered by container from an additional supplier in China and shipped from the Bedford, Va. facility. All styles can be ordered and shipped directly to the customer in full containers. Sam Moore also imports one style chair from yet another factory in China that is shipped directly to the customer in container load quantities.
Hooker Furniture schedules purchases of imported furniture and production of domestically manufactured upholstered furniture based upon actual and anticipated orders and product acceptance at the Spring and Fall Markets. We strive to provide imported and domestically produced furniture on-demand for our dealers. During fiscal year 2010, we shipped 77% of all wood and metal furniture orders and 68% of all upholstery orders within 30 days of order receipt. It is our policy and industry practice to allow order cancellation for wood and metal furniture up to the time of shipment; therefore, customer orders for wood and metal furniture are not firm. However, domestically produced upholstered product orders are predominantly custom-built and shipped within six weeks after the order is received and consequently, cannot be cancelled once the leather or fabric is cut.
Our backlog of unshipped orders for all of our products amounted to $29.2 million or approximately 7 weeks of sales as of January 31, 2010. For the last three years, over 95% of all orders booked were ultimately shipped. Management considers orders and backlogs to be one helpful indicator of sales for the upcoming 30-day period, but because of our quick delivery and our cancellation policy, management does not consider order backlogs to be a reliable indicator of expected long-term business.
Competition
The furniture industry is highly competitive and includes a large number of foreign and domestic manufacturers and importers, none of which dominates the market. While the markets in which Hooker competes include a large number of relatively small and medium-sized manufacturers, certain competitors have substantially greater sales volumes and financial resources than we do. U.S. imports of furniture produced overseas, such as from China, have stabilized in recent years, and some overseas companies have increased both their presence through wholesale distributors based in the United States and their shipments directly to U.S. retailers during that period.
The primary competitive factors for home furnishings in our price points include price, style, availability, service, quality and durability. We believe that our design capabilities, ability to import and/or manufacture upholstered furniture, product value, longstanding customer and supplier relationships, significant distribution and inventory capabilities, ease of ordering, financial strength, experienced management and customer support are significant competitive advantages.
In November 2004 and January 2005, the U.S. Department of Commerce found that certain Chinese furniture manufacturers were dumping bedroom products into the U.S. market and imposed tariffs on Chinese companies for wood bedroom products exported to the U.S. The tariff rates were approved in a subsequent action by the International Trade Commission, based on measured damage to the U.S. furniture manufacturing industry caused by illegal dumping. Tariffs on imported bedroom furniture have not and are not expected to have a material adverse effect on our results of operations.
Employees
As of January 31, 2010, we had approximately 768 permanent employees. None of our employees are represented by a labor union. We consider our relations with our employees to be good.
Patents and Trademarks
The Hooker Furniture, Bradington-Young, Sam Moore and Opus Designs by Hooker Furniture trade names represent many years of continued business. We believe these trade names are well-recognized and associated with quality and service in the furniture industry. We also own a number of patents and trademarks, none of which are considered to be material.
Hooker, the “H” logo, Bradington-Young, the “B-Y” logo, Sam Moore, Sam Moore Furniture Industries, Sam Moore Furniture, LLC, America’s Premier Chair Specialist, Opus Designs by Hooker Furniture, Forever Young, Envision Lifestyle Collections by Hooker Furniture, Albany Park, Abbott Place, Beladora, Belle Vista, Benetton, Casablanca, North Hampton, Kinston, Kemperton, Kendra, Legends, Summerglen, Vineyard, Villagio, Chatham, Brookhaven, Belle Grove, Villa Grande, Villa Florence, Fairview, Mirabel, Danforth, Small Office Solutions, Preston Ridge, Sanctuary, Sectional Sofas by Design, Seven Seas, Seven Seas Seating, SmartLiving ShowPlace, SmartWorks Home Office, SmartWorks Home Center, The Great Entertainers, Wexford Square and Waverly Place are registered trademarks of Hooker Furniture Corporation.
Governmental Regulations
Our company is subject to federal, state, and local laws and regulations in the areas of safety, health, environmental pollution controls and importing. Compliance with these laws and regulations has not in the past had any material effect on our earnings, capital expenditures, or competitive position; however, the effect of compliance in the future cannot be predicted. We believe that we are in material compliance with applicable federal, state and local safety, health, environmental and importing regulations.
Additional Information
You may visit us online at www.hookerfurniture.com, www.bradington-young.com, www.opusdesigns.net, www.sammoore.com, and www.envisionfurniture.com. Hooker makes available, free of charge through our website, our annual report on Form 10-K, quarterly reports on Form 10-Q, current reports on Form 8-K, and other documents as soon as practical after they are filed with or furnished to to the Securities and Exchange Commission. A free copy of our Form 10-K may also be obtained by contacting Robert W. Sherwood, Vice President - Credit, Secretary and Treasurer at our corporate offices.
Forward-Looking Statements
Certain statements made in this report, including under “Item 1 - Business” and “Item 7 - Management’s Discussion and Analysis of Financial Condition and Results of Operations,” are not based on historical facts, but are forward-looking statements. These statements reflect our reasonable judgment with respect to future events and typically can be identified by the use of forward-looking terminology such as “believes,” “expects,” “projects,” “intends,” “plans,” “may,” “will,” “should,” “would,” “could” or “anticipates,” or the negative thereof, or other variations thereon, or comparable terminology, or by discussions of strategy. Forward-looking statements are subject to risks and uncertainties that could cause actual results to differ materially from those in the forward-looking statements. Those risks and uncertainties include but are not limited to:
|
·
|
current economic conditions and instability in the financial and credit markets including their potential impact on our (i) sales and operating costs and access to financing, (ii) customers and suppliers and their ability to obtain financing or generate the cash necessary to conduct their business;
|
|
·
|
general economic or business conditions, both domestically and internationally;
|
|
·
|
price competition in the furniture industry;
|
|
·
|
changes in domestic and international monetary policies and fluctuations in foreign currency exchange rates affecting the price of our imported products and raw materials;
|
|
·
|
the cyclical nature of the furniture industry, which is particularly sensitive to changes in consumer confidence, the amount of consumers’ income available for discretionary purchases, and the availability and terms of consumer credit;
|
|
·
|
risks associated with the cost of imported goods, including fluctuation in the prices of purchased finished goods and transportation and warehousing costs;
|
|
·
|
supply, transportation and distribution disruptions, particularly those affecting imported products;
|
|
·
|
adverse political acts or developments in, or affecting, the international markets from which we import products, including duties or tariffs imposed on those products;
|
|
·
|
risks associated with domestic manufacturing operations, including fluctuations in capacity utilization and the prices of key raw materials, transportation and warehousing costs, domestic labor costs and environmental compliance and remediation costs;
|
|
·
|
our ability to successfully implement our business plan to increase sales and improve financial performance;
|
|
·
|
achieving and managing growth and change, and the risks associated with acquisitions, restructurings, strategic alliances and international operations;
|
|
·
|
risks associated with distribution through retailers, such as non-binding dealership arrangements;
|
|
·
|
capital requirements and costs;
|
|
·
|
competition from non-traditional outlets, such as catalogs, internet and home improvement centers;
|
|
·
|
changes in consumer preferences, including increased demand for lower quality, lower priced furniture due to declines in consumer confidence and/or discretionary income available for furniture purchases and the availability of consumer credit; and
|
|
·
|
higher than expected costs associated with product quality and safety, including regulatory compliance costs related to the sale of consumer products and costs related to defective products.
|
Any forward looking statement that we make speaks only as of the date of that statement, and we undertake no obligation to update any forward-looking statements whether as a result of new information, future events, or otherwise.
ITEM 1A. RISK FACTORS
Our business is subject to a variety of risks. The risk factors detailed below should be considered in conjunction with the other information contained in this annual report on Form 10-K. If any of these risks actually materialize, our business, financial condition and future prospects could be negatively impacted. These risks are not the only ones we face. There may be additional risks that are presently unknown to us or that we currently believe to be immaterial that could affect our business.
An economic downturn could result in a decrease in sales and earnings.
The furniture industry is subject to cyclical variations in the general economy and to uncertainty regarding future economic prospects. Home furnishings are generally considered a postponeable purchase by most consumers. Economic downturns could affect consumer spending habits by decreasing the overall demand for home furnishings. These events could also impact retailers, Hooker’s primary customers, possibly resulting in a decrease in our sales or earnings. Changes in interest rates, consumer confidence, new housing starts, existing home sales, and geopolitical factors have particular significant effects on our Company. A recovery in the Company’s sales could lag significantly behind a general recovery in the economy after an economic downturn due to the postponeable nature and relatively significant cost of home furnishings purchases.
We may lose market share due to competition, which would decrease future sales and earnings.
The furniture industry is very competitive and fragmented. Hooker competes with many domestic and foreign manufacturers. Some competitors have greater financial resources than we have and often offer extensively advertised, well-recognized, branded products. Competition from foreign producers has increased dramatically over the past decade. We may not be able to meet price competition or otherwise respond to competitive pressures, including increases in supplier and production costs. Also, due to the large number of competitors and their wide range of product offerings, we may not be able to continue to differentiate our products (through styling, finish and other construction techniques) from those of our competitors. In addition, large retail furniture dealers have the ability and could at any time begin to obtain offshore sourcing on their own. As a result, we are continually subject to the risk of losing market share, which may lower sales and earnings.
Failure to anticipate or timely respond to changes in fashion and consumer tastes could adversely impact our business and decrease sales and earnings.
Furniture is a styled product and is subject to rapidly changing fashion trends and consumer tastes, as well as to increasingly shorter product life cycles. If we fail to anticipate or promptly respond to these changes we may lose market share or be faced with the decision of whether to sell excess inventory at reduced prices. This could result in lower sales and earnings.
A loss of several large customers through business consolidations, failures or other reasons could result in a decrease in future sales and earnings.
The loss of several of our major customers through business consolidations, failures or otherwise, could materially adversely affect our sales and earnings. Lost sales may be difficult to replace. Amounts owed to Hooker by a customer whose business fails, or is failing, may become uncollectible.
Our ability to grow sales and earnings depends on the successful execution of our business strategies.
We are primarily a residential furniture design, sourcing, marketing and logistics company with domestic upholstery manufacturing capabilities. Our ability to maintain and grow sales and earnings depends on the continued correct selection and successful execution and refinement of our overall business strategies and business systems for designing, marketing, sourcing, distributing and servicing our products. We must also make good decisions about product mix and inventory availability targets. Since we have exited domestic manufacturing of wood furniture and are now completely dependent on offshore suppliers for wood and metal furniture products, we must continue to enhance relationships and business systems that allow us to continue to work more efficiently and effectively with our global sourcing suppliers. We must also continue to evaluate the appropriate mix between domestic manufacturing and foreign sourcing for upholstered products. All of these factors affect our ability to grow sales and earnings.
We depend on suppliers in China for a very high proportion of our imported furniture products, and a disruption in supply from China or from our most significant Chinese supplier could undermine our ability to timely fill customer orders for these products and adversely affect our sourcing costs.
In fiscal 2010, imported products sourced from China accounted for approximately 94% of our import purchases and the factory in China from which we directly source the largest portion of our import products accounted for approximately 42% of our worldwide purchases of imported products. A sudden disruption in our supply chain from this factory, or from China in general, could significantly impact our ability to fill customer orders for products manufactured at that factory or in that country. If such a disruption were to occur, we believe that we would have sufficient inventory to adequately meet demand for approximately four months. We believe that we could, most likely at higher cost, source most of the products currently sourced in China from factories in other countries and could produce certain upholstered products domestically at our own factories. However, supply disruptions and delays on selected items could occur for up to six months before remedial measures could be implemented. If we were to be unsuccessful in obtaining those products from other sources or at comparable cost, then a sudden disruption in our supply chain from our largest import furniture supplier, or from China in general, could have a short-term material adverse effect on our results of operations.
Changes in the value of the U.S. Dollar compared to the currencies for the countries from which we obtain our products could adversely affect net sales and profit margins.
For imported products, we generally negotiate firm pricing with our foreign suppliers in U.S. Dollars, typically for periods of at least one year. We accept the exposure to exchange rate movements beyond these negotiated periods. We do not use derivative financial instruments to manage this risk. Since we transact our imported product purchases in U.S. Dollars, a relative decline in the value of the U.S. Dollar could increase the price we must pay for imported products beyond the negotiated periods. These price changes could adversely impact net sales and profit margins during affected periods.
Our dependence on offshore suppliers could, over time, adversely affect our ability to service customers, which could lower future sales and earnings.
We rely exclusively on offshore suppliers for our wood and metal furniture products. Our offshore suppliers may not provide goods that meet our quality, design or other specifications in a timely manner and at a competitive price. If our suppliers do not meet our specifications, we may need to find alternative vendors, potentially at a higher cost, or may be forced to discontinue products. Also, delivery of goods from offshore vendors may be delayed for reasons not typically encountered for domestically manufactured wood and metal furniture, such as shipment delays caused by customs or labor issues. Our failure to fill customer orders during an extended business interruption by a major offshore supplier could negatively impact existing customer relationships resulting in decreased sales and earnings.
We rely on offshore sourcing for all of our wood and metal products, and for some of our upholstered products. We are subject to changes in local government regulations, which could result in a decrease in earnings.
Changes in political, economic, and social conditions, as well as laws and regulations in the foreign countries where we source our products could have an adverse impact on our performance. These changes could make it more difficult to provide products and service to customers. International trade policies of the United States and the countries from which we source finished products could adversely affect us. Imposition of trade sanctions relating to imports, taxes, import duties and other charges on imports could increase our costs and decrease our earnings. For example beginning in 2004, the U.S. Department of Commerce has imposed tariffs on wooden bedroom furniture coming into the United States from China. In this case, none of the rates imposed were of sufficient magnitude to alter our import strategy in any meaningful way; however, these tariffs are subject to review and could be increased in the future.
If demand for our domestically manufactured upholstered furniture declines and we respond by realigning manufacturing, our near-term earnings could decrease.
Our domestic manufacturing operations make only upholstered furniture. A decline in demand for our domestically produced upholstered furniture could result in the realignment of domestic manufacturing operations and capabilities and the implementation of cost savings programs. These programs could include the consolidation and integration of facilities, functions, systems and procedures. We may decide to source certain products from offshore suppliers, instead of continuing to manufacture them domestically. These realignments and cost savings programs typically involve initial upfront costs and could result in decreases in our near-term earnings before the expected cost reductions from realignment are realized. We may not always accomplish these actions as quickly as anticipated and may not fully achieve the expected cost reductions.
Fluctuations in the price, availability or quality of raw materials for our domestically manufactured upholstered furniture could cause manufacturing delays, adversely affect our ability to provide goods to our customers or increase costs, any of which could decrease our sales or earnings.
We use various types of wood, leather, fabric, foam and other filling material, high carbon spring steel, bar and wire stock and other raw materials in manufacturing upholstered furniture. We depend on outside suppliers for raw materials and must obtain sufficient quantities of quality raw materials from these suppliers at acceptable prices and in a timely manner. We do not have long-term supply contracts with our suppliers. Unfavorable fluctuations in the price, quality or availability of required raw materials could negatively affect our ability to meet the demands of our customers. The inability to meet customers’ demands could result in the loss of future sales. We may not always be able to pass along price increases in raw materials to our customers due to competition and market pressures.
We may experience impairment of our long-lived assets, which would decrease earnings and net worth.
Accounting rules require that long-lived assets be tested for impairment when circumstances indicate, but at least annually. We have $22.7 million in net long-lived assets, consisting primarily of property, plant and equipment, trademarks and trade names, which based upon the outcome of the annual test, could result in the write-down of all or a portion of these assets. A write-down of our assets would, in turn, reduce our earnings and net worth. Over the past three fiscal years, we have written down $6.2 million in long lived assets. It is possible that we will have additional write-downs in the future, resulting in additional reductions to our earnings and net worth. Factors which may lead to additional write-downs of our long lived assets include:
|
§
|
A significant decrease in the market value of the long-lived asset;
|
|
§
|
A significant adverse change in the extent or manner in which a long-lived asset group is being used, or in its physical condition;
|
|
§
|
A significant adverse change in the legal factors or in the business climate that could affect the value of a long-lived asset, including an adverse action or assessment by a regulator;
|
|
§
|
An accumulation of costs significantly in excess of the amount originally expected to acquire or construct a long-lived asset;
|
|
§
|
A current period operating or cash flow loss or a projection or forecast that demonstrates continuing losses associated with the long-lived assets use; or
|
|
§
|
A current expectation that more-likely-than-not, a long-lived asset will be sold or otherwise disposed of significantly before the end of its previously estimated useful life
|
We may engage in acquisitions and investments in companies, which could disrupt our business, dilute our earnings per share and decrease the value of our common stock.
We may acquire or invest in businesses that offer complementary products and that we believe offer competitive advantages. However, we may fail to identify significant liabilities or risks that negatively affect us or result in our paying more for the acquired company or assets than they are worth. We may also have difficulty assimilating the operations and personnel of an acquired business into our current operations. Acquisitions may disrupt or distract management from our ongoing business. We may pay for future acquisitions using cash, stock, the assumption of debt, or a combination of these. Future acquisitions could result in dilution to existing shareholders and to earnings per share.
ITEM 1B. UNRESOLVED STAFF COMMENTS
None.
ITEM 2. PROPERTIES
Set forth below is information with respect to our principal properties. We believe all of these properties are well-maintained and in good condition. We believe our manufacturing facilities are efficiently utilized. During fiscal 2010, we estimate our upholstery plants operated at approximately 75% of capacity on a one-shift basis. All our production facilities are equipped with automatic sprinkler systems. All facilities maintain modern fire and spark detection systems, which we believe are adequate. We have leased certain warehouse facilities for our distribution and imports operation on a short and medium-term basis. We expect that we will be able to renew or extend these leases or find alternative facilities to meet our warehousing and distribution needs at a reasonable cost. All facilities set forth below are active and operational and represent approximately 2.0 million square feet of owned or leased space.
|
Location
|
Primary Use
|
Approximate Size in Square Feet
|
Owned or Leased
|
|||
|
Martinsville, Va.
|
Corporate Headquarters
|
43,000 |
Owned
|
|||
|
Martinsville, Va.
|
Distribution and Imports
|
580,000 |
Owned
|
|||
|
Martinsville, Va.
|
Distribution
|
189,000 |
Owned
|
|||
|
Martinsville, Va.
|
Customer Support Center
|
146,000 |
Owned
|
|||
|
Martinsville, Va.
|
Distribution
|
200,000 |
Leased (1)
|
|||
|
High Point, N.C.
|
Showroom
|
95,000 |
Leased (2)
|
|||
|
Cherryville, N.C.
|
Manufacturing and Offices
|
144,000 |
Owned (3)
|
|||
|
Cherryville, N.C.
|
Manufacturing Supply Plant
|
53,000 |
Owned (3)
|
|||
|
Cherryville, N.C.
|
Distribution and Imports
|
74,000 |
Leased (3) (4)
|
|||
|
Cherryville, N.C.
|
Distribution and Imports
|
35,000 |
Leased (3) (5)
|
|||
|
Hickory, N.C.
|
Manufacturing
|
91,000 |
Owned (3)
|
|||
|
Bedford, Va.
|
Manufacturing and Offices
|
327,000 |
Owned (6)
|
|||
|
(1) Lease expires December 31, 2010
|
||||||
|
(2) Lease expires April 30, 2014
|
||||||
|
(3) Comprise the principal properties of Bradington-Young
|
||||||
|
(4) Lease expires June 30, 2010 and provides for a one year extension, at our election.
|
||||||
|
(5) Lease expires June 30, 2010.
|
||||||
|
(6) Comprise the principal properties of Sam Moore Furniture LLC
|
||||||
Set forth below is information regarding principal properties we utilize that are owned and operated by third parties.
|
Location
|
Primary Use
|
Approximate Size in Square Feet
|
||
|
Guangdong, China
|
Distribution
|
210,000 (1)
|
||
|
Guangdong, China
|
Distribution
|
35,000 (2)
|
(1) This property is subject to an operating agreement that expires on July 31, 2010 and automatically renews for one year on its anniversary date unless notification of termination is provided 120 days prior to such anniversary.
(2) This property is subject to an operating agreement that expires on May 31, 2010 and automatically renews for one year on its anniversary date.
ITEM 3. LEGAL PROCEEDINGS
None
ITEM 4. RESERVED
HOOKER FURNITURE CORPORATION
Hooker Furniture’s executive officers and their ages as of April 15, 2010 and the year each joined the company are as follows:
|
Name
|
Age
|
Position
|
Year Joined Company
|
|||
|
Paul B. Toms, Jr.
|
55
|
Chairman, President and Chief Executive Officer
|
1983
|
|||
|
E. Larry Ryder
|
62
|
Executive Vice President - Finance and Administration,
|
1977
|
|||
|
Assistant Secretary and Assistant Treasurer
|
||||||
|
Alan D. Cole
|
60
|
President and Chief Executive Officer - Upholstery
|
2007
|
|||
|
Bruce R. Cohenour
|
52
|
Executive Vice President - Marketing
|
2007
|
|||
|
Raymond T. Harm
|
60
|
Senior Vice President - Sales
|
1999
|
|||
|
Arthur G. Raymond, Jr.
|
62
|
Senior Vice President - Operations
|
2010
|
Paul B. Toms, Jr. has been Chairman and Chief Executive Officer since December 2000 and President since November 2006. Mr. Toms was President and Chief Operating Officer from December 1999 to December 2000, Executive Vice President - Marketing from 1994 to December 1999, Senior Vice President - Sales and Marketing from 1993 to 1994, and Vice President - Sales from 1987 to 1993. Mr. Toms joined the Company in 1983 and has been a Director since 1993.
E. Larry Ryder has been Executive Vice President - Finance and Administration and Chief Financial Officer since December 2000, Assistant Treasurer since 1998, and Assistant Secretary since 1990. Mr. Ryder was Senior Vice President - Finance and Administration and Chief Financial Officer from December 1987 to December 2000, Treasurer from 1989 to 1998, and Vice President - Finance and Administration from 1983 to 1987. Prior to 1983, Mr. Ryder served in various financial management positions. Mr. Ryder joined the Company in 1977 and was a Director from 1987 until 2003.
Alan D. Cole has been President and Chief Executive Officer - Upholstery since August 2008. Mr. Cole joined the Company in April 2007 as Executive Vice President – Upholstery Operations. Prior to joining the Company, Mr. Cole was President and Chief Executive Officer of Schnadig Corporation, a manufacturer and marketer of a full line of medium-priced home furnishings from 2004 to 2006. Mr. Cole has been President of Parkwest LLC, a real estate development firm from 2002 to the present. Mr. Cole also served as a member of the Company’s Board of Directors in 2003.
Bruce R. Cohenour has been Executive Vice President – Marketing since May 2009. Mr. Cohenour joined the Company in February 2007 as Senior Vice President of National Accounts and Business Development. Prior to joining the Company, Mr. Cohenour served as an independent sales representative for the Company from 1995 to 2006.
Raymond T. Harm has been Senior Vice President - Sales since joining the Company in 1999. Prior to joining the Company, Mr. Harm served as Vice President - Sales for The Barcalounger Company, a manufacturer of upholstered motion furniture from 1992 to 1999.
Arthur G. Raymond, Jr. has been Senior Vice-President of Operations since joining the Company in 2010. Prior to joining the Company, Mr. Raymond served as President of A.G. Raymond & Company, Inc., a management and technical consulting firm serving the furniture industry, from 1980 through 2010.
Hooker Furniture Corporation
Part II
ITEM 5. MARKET FOR REGISTRANT’S COMMON EQUITY, RELATED SHAREHOLDER MATTERS AND ISSUER PURCHASES OF EQUITY SECURITIES
Our stock is traded on the NASDAQ Global Select Market under the symbol “HOFT”. The table below sets forth the high and low sales prices per share for our common stock and the dividends per share we paid with respect to our common stock for the periods indicated.
| Sales Price Per Share | Dividends | |||||||||||
|
High
|
Low
|
Per Share
|
||||||||||
|
November 2, 2009 - January 31, 2010
|
$ | 13.67 | $ | 10.94 | $ | 0.10 | ||||||
|
August 3 - November 1, 2009
|
14.44 | 12.38 | 0.10 | |||||||||
|
May 4 - August 2, 2009
|
14.11 | 11.06 | 0.10 | |||||||||
|
February 2 - May 3, 2009
|
12.17 | 5.11 | 0.10 | |||||||||
|
November 3, 2008 - February 1, 2009
|
10.09 | 5.64 | 0.10 | |||||||||
|
August 4 - November 2, 2008
|
20.59 | 8.35 | 0.10 | |||||||||
|
May 5 - August 3, 2008
|
21.94 | 15.80 | 0.10 | |||||||||
|
February 4 - May 4, 2008
|
24.00 | 19.20 | 0.10 | |||||||||
As of January 31, 2010, we had approximately 1,847 beneficial shareholders. We pay dividends on our common stock on or about the last day of February, May, August and November, when declared by the Board of Directors, to shareholders of record approximately two weeks earlier. Although we presently intend to continue to declare cash dividends on a quarterly basis for the foreseeable future, the determination as to the payment and the amount of any future dividends will be made by the Board of Directors from time to time and will depend on our then-current financial condition, capital requirements, results of operations and any other factors then deemed relevant by the Board of Directors.
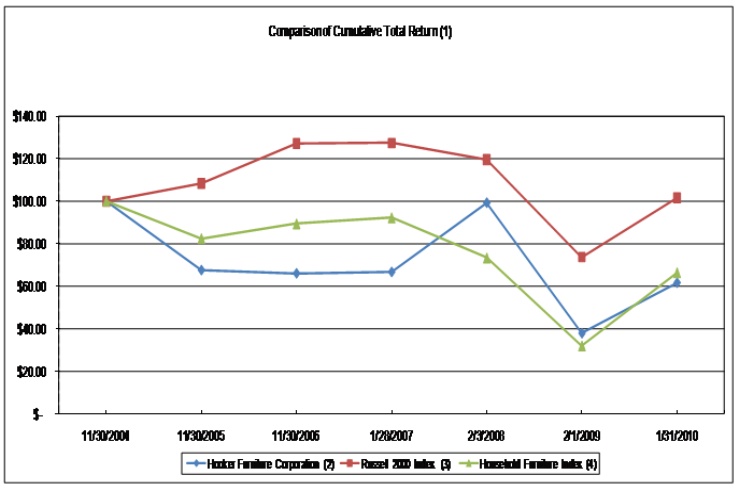
Performance Graph
The following graph compares cumulative total shareholder return for the Company with a broad performance indicator, the Russell 2000® Index, and an industry index, the Household Furniture Index, for the period from November 30, 2004 to January 31, 2010. The Household Furniture Index combines all home furnishings companies whose securities are registered with the SEC under the Securities Exchange Act of 1934.
|
(1)
|
The graph shows the cumulative total return on $100 invested at the beginning of the measurement period in the Company’s Common Stock or the specified index, including reinvestment of dividends.
|
|
(2)
|
On August 29, 2006, we approved a change in our fiscal year. After the fiscal year ended November 30, 2006, our fiscal year ends on the Sunday nearest to January 31. Information regarding the change in the Company’s fiscal year is available in the Company’s Form 8-K filed September 1, 2006. In making the transition to a new fiscal year, the Company completed a two-month transition period that began December 1, 2006 and ended January 28, 2007. The Company’s fiscal years ended January 31, 2010, February 1, 2009, February 3, 2008 and the transition period are reflected in the Performance Graph.
|
|
(3)
|
The Russell 2000® Index, prepared by Frank Russell Company, measures the performance of the 2,000 smallest companies out of the 3,000 largest U.S. companies based on total market capitalization.
|
|
(4)
|
The Household Furniture Index (SIC Codes 2510 and 2511) as prepared by Zack’s Investment Research. On March 9, 2010, Zacks Investment Research reported that the Household Furniture Index consisted of: Bassett Furniture Industries, Inc., Chromcraft Revington, Inc., Ethan Allen Interiors Inc., Flexsteel Industries, Inc., Furniture Brands International, Inc., Hooker Furniture Corporation, La-Z-Boy Incorporated, Natuzzi S.p.A, Tempur Pedic International, Inc., Leggett and Platt, Inc., Sealy Corp., Select Comfort Corp. and Stanley Furniture Company, Inc.
|
ITEM 6. SELECTED FINANCIAL DATA
The following selected financial data for each of our last five fiscal years and for the two-month transition period ended January 28, 2007 has been derived from our audited, consolidated financial statements. The selected financial data should be read in conjunction with the Consolidated Financial Statements, including the related Notes, and Management’s Discussion and Analysis of Financial Condition and Results of Operations included elsewhere in this report.
| For The | For the 53 | For the Two | ||||||||||||||||||||||
|
52 Weeks Ended (8)
|
Weeks Ended (8)
|
Months Ended (8)
|
For the Twelve Months Ended (8)
|
|||||||||||||||||||||
|
January 31,
|
February 1,
|
February 3,
|
January 28,
|
Nov. 30,
|
Nov. 30,
|
|||||||||||||||||||
|
2010 (1)(2)
|
2009 (1)(2)
|
2008 (1)(2)
|
2007
|
2006
|
2005
|
|||||||||||||||||||
|
(In thousands, except per share data)
|
||||||||||||||||||||||||
|
Income Statement Data:
|
||||||||||||||||||||||||
|
Net sales
|
$ | 203,347 | $ | 261,162 | $ | 316,801 | $ | 49,061 | $ | 350,026 | $ | 341,775 | ||||||||||||
|
Cost of sales
|
154,931 | 200,878 | 235,057 | 37,876 | 269,681 | 265,051 | ||||||||||||||||||
|
Gross profit
|
48,416 | 60,284 | 81,744 | 11,185 | 80,345 | 76,724 | ||||||||||||||||||
|
Selling and adminstrative expenses
|
41,956 | 45,980 | 51,738 | 7,028 | 50,680 | 50,319 | ||||||||||||||||||
|
ESOP termination compensation charge (3)
|
- | - | - | 18,428 | - | - | ||||||||||||||||||
|
Restructuring (credits) charges (4)
|
- | (951 | ) | 309 | 2,973 | 6,881 | 5,250 | |||||||||||||||||
|
Goodwill and intangible asset impairment charges (5)
|
1,274 | 4,914 | - | - | - | - | ||||||||||||||||||
|
Operating income (loss)
|
5,186 | 10,341 | 29,697 | (17,244 | ) | 22,784 | 21,155 | |||||||||||||||||
|
Other (expense) income, net
|
(99 | ) | 323 | 1,472 | 129 | (77 | ) | (646 | ) | |||||||||||||||
|
Income (loss) before income taxes
|
5,087 | 10,664 | 31,169 | (17,115 | ) | 22,707 | 20,509 | |||||||||||||||||
|
Income taxes
|
2,079 | 3,754 | 11,514 | 1,300 | 8,569 | 8,024 | ||||||||||||||||||
|
Net income (loss)
|
3,008 | 6,910 | 19,655 | (18,415 | ) | 14,138 | 12,485 | |||||||||||||||||
|
Per Share Data:
|
||||||||||||||||||||||||
|
Basic and diluted earnings per share (5)
|
$ | 0.28 | $ | 0.62 | $ | 1.58 | $ | (1.52 | ) | $ | 1.18 | $ | 1.06 | |||||||||||
|
Cash dividends per share
|
0.40 | 0.40 | 0.40 | - | 0.31 | 0.28 | ||||||||||||||||||
|
Net book value per share (6)
|
11.86 | 12.06 | 12.18 | 12.23 | 13.49 | 12.50 | ||||||||||||||||||
|
Weighted average shares outstanding (basic)
|
10,753 | 11,060 | 12,442 | 12,113 | 11,951 | 11,795 | ||||||||||||||||||
|
Balance Sheet Data:
|
||||||||||||||||||||||||
|
Cash and cash equivalents
|
$ | 37,995 | $ | 11,804 | $ | 33,076 | $ | 47,085 | $ | 31,864 | $ | 16,365 | ||||||||||||
|
Trade accounts receivable
|
25,894 | 30,261 | 38,229 | 37,744 | 45,444 | 43,993 | ||||||||||||||||||
|
Inventories
|
36,176 | 60,248 | 50,560 | 62,803 | 68,139 | 68,718 | ||||||||||||||||||
|
Assets held for sale (7)
|
- | - | - | 3,475 | - | 1,656 | ||||||||||||||||||
|
Working capital
|
87,894 | 91,261 | 102,307 | 127,193 | 124,028 | 110,421 | ||||||||||||||||||
|
Total assets
|
149,099 | 153,467 | 175,232 | 202,463 | 201,299 | 189,576 | ||||||||||||||||||
|
Long-term debt (including current maturites)
|
- | 5,218 | 7,912 | 10,415 | 11,012 | 13,295 | ||||||||||||||||||
|
Shareholders' equity
|
127,592 | 129,710 | 140,826 | 162,310 | 162,536 | 148,612 | ||||||||||||||||||
|
(1)
|
On April 28, 2007, we acquired substantially all of the assets of Bedford, Va.-based fabric upholstered seating specialist Sam Moore Furniture. Shipments of Sam Moore upholstered furniture products accounted for $22.2 million in net sales for fiscal 2010, $25.4 million in net sales for fiscal 2009 and for $20.8 million in net sales for fiscal 2008 following the acquisition.
|
|
(2)
|
On December 14, 2007, we acquired the assets of Opus Designs Furniture, LLC, a specialist in imported moderately-priced youth bedroom furniture. Shipments of Opus youth bedroom furniture products accounted for $4.6 million in net sales for fiscal 2010, $5.6 million in net sales for fiscal 2009 and for $636,000 in net sales for fiscal 2008 following the acquisition.
|
|
(3)
|
On January 26, 2007, we terminated our Employee Stock Ownership Plan (ESOP.) The termination resulted in an $18.4 million non-cash, non-tax deductible charge to earnings in January 2007.
|
|
(4)
|
We have closed facilities in order to reduce and ultimately eliminate our domestic wood furniture manufacturing capacity. As a result, we recorded restructuring charges and credits, principally for severance and asset impairment, as follows:
|
|
a)
|
in fiscal 2009 we recorded credits of $951,000 ($592,000 after tax), or $0.05 per share related to previously accrued employee benefits and environmental costs not expected to be paid;
|
|
b)
|
in fiscal 2008, we recorded charges of $309,000 ($190,000 after tax), or $0.02 per share, principally related to the March 2007 closing and sale of our Martinsville, Va. manufacturing facility;
|
|
c)
|
in the 2007 two-month transition period, we recorded charges of $3.0 million ($1.8 million after tax), or $0.15 per share, principally for severance and related benefits for salaried and hourly employees related to the planned closing of our Martinsville, Va. manufacturing facility;
|
|
d)
|
in fiscal 2006, we recorded charges of $6.9 million ($4.3 million after tax), or $0.36 per share, principally related to the planned closing of our Martinsville, Va. manufacturing facility and the closing of our Roanoke, Va. facility; and
|
|
e)
|
in fiscal 2005, we recorded charges of $5.3 million ($3.3 million after tax), or $0.28 per share, principally related to the closing of our Pleasant Garden, N.C. facility.
|
|
(5)
|
In 2010, based on our impairment assessments of goodwill and other intangible assets, we recorded asset impairment charges of $661,000 ($412,000, after tax) or $0.04 per share on our Opus Designs trade name and $613,000 ($382,000, pretax) or $0.04 per share on our Bradington-Young trade name. In fiscal 2009, we recorded asset impairment charges of $3.8 million ($2.5 million, after tax), or $0.22 per share, primarily related to the write-off of goodwill resulting from the acquisition of Opus Designs in 2007 and of Bradington-Young in 2003, and $1.1 million ($685,000 after tax) or $0.06 per share to write down the Bradington-Young trade name.
|
|
(6)
|
Net book value per share is derived by dividing (a) “shareholders’ equity” by (b) the number of common shares issued and outstanding, excluding unearned ESOP and restricted shares, all determined as of the end of each fiscal period.
|
|
(7)
|
In connection with the closings of the Martinsville, Va. plant in March 2007, the Roanoke, Va. plant in August 2006, the Pleasant Garden, N.C. plant in October 2005 and the Maiden, N.C. plant in October 2004, we reclassified substantially all of the related property, plant and equipment to “assets held for sale.” The carrying value of these assets approximated fair value less anticipated selling expenses. We completed the sale of the assets located in Martinsville, Va. in December 2007, the assets located in Roanoke, Va. in October 2006, the assets located in Pleasant Garden, N.C. in May 2006 and the assets located in Maiden, N.C. in January 2005.
|
|
(8)
|
On August 29, 2006, we approved a change in our fiscal year. After the fiscal year that ended November 30, 2006, our fiscal years will end on the Sunday closest to January 31. In connection with the change in our fiscal year, we had a two-month transition period that ended January 28, 2007.
|
ITEM 7. MANAGEMENT’S DISCUSSION AND ANALYSIS OF FINANCIAL CONDITION AND RESULTS OF OPERATIONS
The following discussion should be read in conjunction with the Selected Financial Data and the Consolidated Financial Statements, including the related Notes, contained elsewhere in this annual report.
Our fiscal years end on the Sunday closest to January 31, in some years (generally once every six years) the fourth quarter will be fourteen weeks long and the fiscal year will consist of fifty-three weeks (for example, the fiscal year that ended February 3, 2008 was fifty-three weeks). Our quarterly periods are based on thirteen-week “reporting periods” (which will end on a Sunday) rather than quarterly periods consisting of three calendar months. As a result, each quarterly period generally will be thirteen weeks, or 91 days, long.
The financial statements filed as part of this annual report on Form 10-K include the:
|
§
|
fifty-two week period that began February 2, 2009 and ended on January 31, 2010 (fiscal 2010);
|
|
§
|
fifty-two week period that began February 4, 2008 and ended on February 1, 2009 (fiscal 2009);
|
|
§
|
fifty-three week period that began January 29, 2007 and ended on February 3, 2008 (fiscal 2008);
|
Overview
We have seen a growing consumer preference for lower-priced, high-quality imported furniture products since 2001. Led by this change in consumer demand, from 2003 to 2008 we systematically increased our focus on high-quality imported home furnishings with a coordinated exit from domestic wood furniture manufacturing. We closed our last domestic wood manufacturing plant during the fiscal year 2008 first quarter and completed the sale of all wood furniture manufacturing assets no longer needed in the business in December 2007. As a result, we have replaced a domestic manufacturing model for wood furniture, which had high overhead and high fixed costs, with a low overhead, variable cost import model.
In early 2007, we completed the acquisition of substantially all of the assets of Sam Moore Furniture Industries, Inc., a Bedford, Virginia manufacturer of upscale occasional chairs with an emphasis on fabric-to-frame customization in the upper-medium to high-end price niches. We began operating the business as Sam Moore Furniture LLC during the fiscal 2008 second quarter. On December 14, 2007, we completed our acquisition of certain assets of Opus Designs Furniture, LLC, a specialist in moderately-priced imported youth furniture. We have integrated this business with our existing imported wood and metal furniture business and now offer this brand to customers as Opus Designs by Hooker.
We are now focused on imported wood and metal furniture, and both domestically produced and imported upholstered home furnishings. Maintaining domestic upholstered furniture manufacturing allows us to offer four to six week turnaround on orders for custom leather and fabric upholstered seating and remains an important part of our strategy.
Since the Fall of 2006, our business has been impacted by low levels of consumer confidence and a weak housing market. By late 2008, this malaise, exacerbated by weak credit markets, had spread to the broader U.S. economy. As a result, the residential home furnishings industry has seen an unprecedented decline in demand for its products. Year-over-year declines in net sales have continued through the fiscal 2010.
Results of operations for the fifty-two weeks ended January 31, 2010 and February 1, 2009 and the fifty-three weeks ended February 3, 2008 reflect the continuing deterioration in the retail environment for home furnishings. Discretionary purchases of furniture, particularly at the upper-middle price points, have been highly affected by low consumer confidence. Current economic factors, such as rising unemployment and difficult housing and mortgage markets, have resulted in a weak retail environment. We believe however, that our business model provides us with flexibility to respond to changing market conditions by adjusting import inventory purchases from suppliers. We also believe that the current economic downturn is temporary and upon economic recovery, we will be well positioned to respond quickly to increased demand.
Following are the principal factors that impacted our results of operations during the fifty-two week period ended January 31, 2010:
|
§
|
Net sales declined by $57.8 million, or 22.1%, to $203.3 million during fiscal 2010 compared to net sales of $261.2 million during fiscal year 2009. The continuing decline in net sales mirrors the year-over-year decline in incoming order rates we have experienced since the fiscal 2006 third quarter resulting from an industry-wide slow down in business at retail.
|
|
§
|
Gross margins for fiscal 2010 improved due primarily to lower freight costs on wood and metal furniture and primarily due to lower inventories for the year as well as stable pricing on imports; however, gross margins in our upholstery units declined due to higher fixed costs as a percent of net sales.
|
|
§
|
Selling and administrative expenses decreased in absolute terms compared to fiscal year 2009 but increased as a percent of net sales due to the effect of the fixed nature of certain selling and administrative costs as a percent of the lower net sales reported in fiscal 2010.
|
|
§
|
Operating income decreased principally due to lower net sales, higher fixed operating and domestic upholstery overhead costs as a percent of net sales and impairment charges of $1.3 million related to the impairment of the our Bradington-Young and Opus Designs trade names, partially offset by an approximate $700,000 favorable adjustment to our workers compensation accrual due to the exit from our captive insurance arrangement.
|
Results of Operations
The following table sets forth the percentage relationship to net sales of certain items for the annual periods included in the consolidated statements of income:
| Fifty-three | ||||||||||||
|
Fifty-two weeks ended
|
Weeks ended
|
|||||||||||
|
January 31,
|
February 1,
|
February 3,
|
||||||||||
|
2010
|
2009
|
2008
|
||||||||||
|
Net sales
|
100.0 | % | 100.0 | % | 100.0 | % | ||||||
|
Cost of sales
|
76.2 | 76.9 | 74.2 | |||||||||
|
Gross profit
|
23.8 | 23.1 | 25.8 | |||||||||
|
Selling and administrative expenses
|
20.6 | 17.6 | 16.3 | |||||||||
|
Restructuring (credits) charges
|
- | (0.4 | ) | 0.1 | ||||||||
|
Goodwill and intangible asset impairment charges
|
0.6 | 1.9 | - | |||||||||
|
Operating income
|
2.6 | 4.0 | 9.4 | |||||||||
|
Other income (expense), net
|
(0.1 | ) | 0.1 | 0.5 | ||||||||
|
Income before income taxes
|
2.5 | 4.1 | 9.8 | |||||||||
|
Income taxes
|
1.0 | 1.5 | 3.6 | |||||||||
|
Net income
|
1.5 | 2.6 | 6.2 | |||||||||
Fiscal 2010 Compared to Fiscal 2009
For fiscal 2010, Hooker Furniture reported net sales of $203.3 million, a decrease of $57.8 million, or 22.1%, compared to $261.2 million in fiscal 2009. Net sales of our wood and metal furniture decreased $47.9 million, or 25.4%, to $140.4 million during fiscal 2010 compared to net sales of $188.2 million in fiscal 2009, principally due to lower unit volume. The decline in wood and metal furniture unit volume was attributed to a sharp decline in sales as a result of the industry-wide slow down in business at retail.
Unit volume decreased for Hooker wood and metal furniture, Bradington-Young domestic leather upholstery and Sam Moore upholstered furniture compared to fiscal 2009. Unit volume increased for Bradington-Young imported leather upholstery. Sales of imported upholstery increased less than one percent from the prior year, while domestic upholstery sales declined approximately 15.7% in the same period. These unit volume declines were partially offset by sales of our new Envision product line, which was recently introduced to address the needs of a younger consumer.
Overall average selling prices decreased less than two percent in the 2010 fiscal year compared to the 2009 period. Selling price increases implemented in September 2009 in response to higher costs for imported finished goods and raw materials for domestically produced upholstery were offset by aggressive discounting. Only Sam Moore’s imported upholstered furniture showed higher average selling prices in fiscal 2010. This was primarily due to the mix of products sold.
Overall gross profit margin for fiscal 2010 increased to 23.8% of net sales compared to 23.1% in fiscal 2009 due to margin improvements in the case goods division partially offset by lower gross margins in the upholstery operations. Wood furniture margins improved from 25.6% of net sales in fiscal 2009 to 29.0% of net sales in fiscal 2010 primarily due to lower shipping costs on imported wood furniture and lower warehousing costs in the case goods operation due to the elimination of a distribution facility in California, partially offset by higher discounting. Upholstery margins declined from 16.6% in fiscal 2009 to 12.2% in fiscal 2010 due to higher fixed operating costs as a percent of net sales resulting primarily from lower net sales in fiscal 2010.
For fiscal 2010, selling and administrative expenses decreased $4.0 million, or 8.8%, to $42.0 million, compared with $46.0 million in 2009, largely due to lower selling expense attributed to lower sales volume, reduced salaries and benefits due to staff reductions, a favorable adjustment of $738,000 to our worker’s compensation accrual due to the exit from our captive insurance arrangement, and lower bonuses and severance payments than in 2009. As a percentage of net sales, selling and administrative expenses increased to 20.6% in fiscal 2010 from 17.6% in the fiscal 2009 period, due primarily to lower net sales.
During fiscal 2010, we recorded $1.3 million ($794,000 after tax, or $0.07 per share) in intangible asset impairment charges related to the write-down of our Bradington –Young and Opus Designs trade names.
During fiscal 2009, we recorded $4.9 million ($3.1million after tax, or $0.28 per share) in goodwill and intangible asset impairment charges, principally related to:
|
§
|
a write-off of $1.4 million in goodwill resulting from the 2007 acquisition of Opus Designs
|
|
§
|
a write-off of $2.4 million in goodwill remaining from the Company’s purchase of Bradington-Young in 2003; and
|
|
§
|
an impairment charge of $1.1 million in the value of the Bradington-Young trade name.
|
Additionally, we recorded restructuring credits of $951,000 ($592,000 after tax or $0.05 per share) in fiscal 2009 for previously accrued employee benefits and environmental remediation costs not expected to be paid.
Because of the factors outlined above, our operating income margin for fiscal 2010 decreased to 2.6% of net sales, compared to operating income margin of 4.0% of net sales for fiscal 2009. Wood furniture operating margins declined modestly from 8.1% of net sales in fiscal 2009 to 7.9% of net sales in fiscal 2010, reflecting the variable cost oriented import business model, while upholstery operating margins declined from -6.8% of net sales to -9.3% of net sales due to the impact of lower sales on the higher fixed cost structure of our domestic upholstery manufacturing facilities.
Excluding the effect of restructuring and goodwill and intangible asset impairment charges, operating profitability in fiscal 2010 still declined year over year compared to fiscal 2009. The following table reconciles operating income as a percentage of net sales ("operating margin") to operating margin excluding these charges and credits (“restructuring and special charges/credits”) as a percentage of net sales for each period:
| January 31, | February 1, | |||||||
|
2010
|
2009
|
|||||||
|
Operating margin, including restructuring and special charges
|
2.6 | % | 4.0 | % | ||||
|
Goodwill and intangible asset impairment charges
|
0.6 | 1.9 | ||||||
|
Restructuring (credits) charges
|
- | (0.4 | ) | |||||
|
Operating margin, excluding restructuring and special (credits) charges
|
3.2 | % | 5.5 | % | ||||
The operating margin excluding the impact of restructuring charges and special charges is a “non-GAAP” financial measure. We provide this information because we believe it is useful to investors in evaluating our ongoing operations. Non-GAAP financial measures are intended to provide insight into selected financial information and should be evaluated in the context in which they are presented. These measures are not intended to reflect our overall financial results.
Other expense, net was $99,000, for fiscal 2010, compared to other income, net of $323,000 for fiscal 2009. The decline was primarily the consequence of a decrease in interest income on cash balances from lower interest rates and lower interest expense due to the early payoff of our term loan.
Our effective tax rate increased to 40.9% for fiscal 2010, compared to 35.2% for fiscal 2009. The increase was principally a result of the establishment of a valuation allowance against certain state net operating loss carryforwards (2.7%), a late-payment penalty (2.0%) and recognition of subpart F income (3.1%). The dollar amounts of the permanent benefits for officers’ life insurance and contributions of property were not materially different than in prior years. Their percentages are larger this year because of the smaller amount of pre-tax income.
Net income for fiscal 2010 declined by 56.5%, or $3.9 million, to $3.0 million, or $0.28 per share, from $6.9 million, or $0.62 per share, for fiscal 2009. As a percent of net sales, net income decreased to 1.5% in fiscal 2010 compared to 2.6% for fiscal 2009.
Fiscal 2009 Compared to Fiscal 2008
For fiscal 2009, Hooker Furniture reported net sales of $261.2 million, a decrease of $55.6 million, or 17.6%, compared to $316.8 million in fiscal 2008. Net sales of our wood and metal furniture decreased $48.7 million, or 20.6%, to $188.2 million during fiscal 2009 compared to net sales of $236.9 million in fiscal 2008, principally due to lower unit volume. The decline in wood and metal furniture unit volume was attributed to a sharp decline in sales as a result of the industry-wide slow down in business at retail and lower shipments of discontinued domestically produced wood furniture.
Based on operating days in each period, and excluding the impact of discontinued, domestically produced wood furniture, average daily net sales declined 15.1% to $1.0 million per day during the 251-day 2009 fiscal year, compared to $1.2 million per day during the 255-day 2008 fiscal year. We experienced lower average daily unit volume shipments overall and in every product category, except youth bedroom and upholstered seating, which increased due to the acquisition of Opus Designs in December 2007 and the inclusion of a full year of sales for Sam Moore, which was acquired in April 2007.
Overall, average selling prices declined significantly. The primary contributors to the overall decline were;
|
§
|
the sharp drop in the average selling price of upholstered furniture. This drop was due to the increased proportion of upholstery sales of less expensive, predominantly fabric-covered products manufactured by Sam Moore, which was in its first full year as a Hooker subsidiary, and
|
|
§
|
the impact of our exit from the domestic wood and metal furniture business.
|
The unit volume of higher priced domestically produced wood products was partially replaced by lower priced imports. The remaining domestic wood products were heavily discounted during fiscal 2009. The average selling price for imported wood and metal furniture decreased due to heavier discounting in a challenging market and the mix of products shipped. Bradington-Young’s imported and domestically produced leather upholstered furniture showed higher average selling prices while Sam Moore’s average prices declined in both categories.
Gross profit margin for fiscal 2009 decreased to 23.1% of net sales compared to 25.8% in fiscal 2008, primarily due to:
|
§
|
increased product and shipping and warehousing costs,
|
|
§
|
lower fixed cost absorption due to lower sales of domestically produced upholstered furniture, and
|
|
§
|
higher warehousing and distribution expenses due to the addition of two facilities in China and one in California.
|
These costs were partially offset by lower salary and benefit expenses resulting from staff reductions at our Bradington-Young and domestic wood and metal furniture operations.
For fiscal 2009, selling and administrative expenses decreased $5.8 million, or 11.1%, to $46.0 million, compared with $51.7 million in 2008, due to:
|
§
|
last year’s donation of two former Bradington-Young’s showrooms to a local university, and
|
|
§
|
lower selling expenses, professional fees and administrative payroll costs.
|
These costs were partially offset by higher bad debt expenses.
As a percentage of net sales, selling and administrative expenses increased to 17.6% in fiscal 2009 from 16.3% in fiscal 2008, due to lower net sales in the current year.
During fiscal 2009, we recorded $4.9 million ($3.1million after tax, or $0.28 per share) in goodwill and intangible asset impairment charges, principally related to:
|
§
|
a write-off of $1.4 million in goodwill resulting from the 2007 acquisition of Opus Designs
|
|
§
|
a write-off of $2.4 million in goodwill remaining from the Company’s purchase of Bradington-Young in 2003;
|
|
§
|
an impairment charge of $1.1 million in the value of the Bradington-Young trade name.
|
We also recorded restructuring credits of $951,000 ($592,000 after tax or $0.05 per share) in fiscal 2009 for previously accrued employee benefits and environmental costs not expected to be paid.
During fiscal 2008, we recorded $309,000 ($190,000 after tax, or $0.02 per share) in restructuring and asset impairment charges (net of restructuring credits).
Our operating income margin for fiscal 2009 decreased to 4.0% of net sales, compared to operating income margin of 9.4% of net sales for fiscal 2008, principally due to:
|
§
|
the $3.7 million increase in restructuring and goodwill and intangible asset impairment costs;
|
|
§
|
the decrease in gross profit margin to 23.1% from 25.8%; and
|
|
§
|
the increase in selling and administrative expenses as a percentage of net sales to 17.6% in 2009 compared to 16.3% in fiscal 2008, due to the decline in sales (although these costs decreased $5.8 million or 11.1%).
|
Excluding the effect of restructuring and goodwill and intangible asset impairment charges, operating profitability in fiscal 2009 still declined year over year compared to fiscal 2008, primarily as a result of lower gross profit margins on our imported wood and metal furniture and domestic and imported upholstered furniture. The following table reconciles operating income as a percentage of net sales ("operating margin") to operating margin excluding these charges (“restructuring and special charges”) as a percentage of net sales for each period:
|
Fifty-Two
|
Fifty-Three
|
|||||||
|
Weeks Ended
|
Weeks Ended
|
|||||||
|
February 1,
|
February 3,
|
|||||||
|
2009
|
2008
|
|||||||
|
Operating margin, including restructuring and special charges
|
4.0 | % | 9.4 | % | ||||
|
Goodwill and intangible asset impairment charges
|
1.9 | |||||||
|
Donation of two showrooms
|
0.3 | |||||||
|
Restructuring (credits) charges
|
(0.4 | ) | 0.1 | |||||
|
Operating margin, excluding restructuring and special charges
|
5.5 | % | 9.8 | % | ||||
The operating margin excluding the impact of restructuring charges and special charges is a “non-GAAP” financial measure. We provide this information because we believe it is useful to investors in evaluating our ongoing operations. Non-GAAP financial measures are intended to provide insight into selected financial information and should be evaluated in the context in which they are presented. These measures are not intended to reflect our overall financial results.
Other income, net was $323,000, or 0.1% of net sales, for fiscal 2009, compared to other income, net of $1.5 million for fiscal 2008, primarily the consequence of a decrease in interest income from lower interest rates and lower cash balances.
Our effective tax rate decreased to 35.2% for fiscal 2009, compared to 36.9% for fiscal 2008. The decrease was principally a result of an increase in non-cash charitable contributions of finished furniture as a percentage of pretax income and lower net cost related to our captive insurance program.
Net income for fiscal 2009 declined by 64.8%, or $12.8 million, to $6.9 million, or $0.62 per share, from $19.7 million, or $1.58 per share, for fiscal 2008. As a percent of net sales, net income decreased to 2.6% in fiscal 2009 compared to 6.2% for fiscal 2008.
Financial Condition, Liquidity and Capital Resources
Balance Sheet and Working Capital
Total assets decreased $4.4 million to $149.1 million at January 31, 2010 from $153.5 million at February 1, 2009, principally due to a $24.1 million decrease in inventories, a $4.4 million decrease in net receivables, a $1.9 million decrease in property, plant, and equipment and the write-off of $1.3 million in intangible assets from prior acquisitions were partially offset by a $26.2 million increase in cash and cash equivalents and a $1.3 million increase in the cash surrender value of life insurance policies.
Working capital decreased by $3.4 million to $87.9 million as of January 31, 2010, from $91.3 million at February 1, 2009, principally as a result of decreases in inventories, trade receivables and prepaid expenses, offset by an increase in cash and cash equivalents and a decrease in current liabilities. Current liabilities decreased to $15.6 million at January 31, 2010, from $15.8 million at February 1, 2009 as a result of lower current maturities of long-term debt and accrued salaries and accrued taxes offset by higher trade accounts payable and other accrued expenses. Our long-term debt, including current maturities, decreased $5.2 million to $0.0 on January 31, 2010, compared to $5.2 million on February 1, 2009 as a result of the early payment of our term loan in August 2009. Shareholders’ equity at January 31, 2010 decreased $2.1 million to $127.6 million compared to $129.7 million on February 1, 2009, since dividend payments exceeded net income.
Summary Cash Flow Information – Operating, Investing and Financing Activities
| Fifty- Three | ||||||||||||
|
Fifty-Two Weeks Ended
|
Weeks Ended
|
|||||||||||
|
January 31,
|
February 1,
|
February 3,
|
||||||||||
|
2010
|
2009
|
2008
|
||||||||||
|
Net cash provided by operating activities
|
$ | 37,425 | $ | 3,730 | $ | 43,825 | ||||||
|
Net cash used in investing activities
|
(1,707 | ) | (3,752 | ) | (14,267 | ) | ||||||
|
Net cash used in financing activities
|
(9,527 | ) | (21,250 | ) | (43,567 | ) | ||||||
|
Net increase (decrease) in cash and cash equivalents
|
$ | 26,191 | $ | (21,272 | ) | $ | (14,009 | ) | ||||
During fiscal year 2010, cash generated from operations ($37.4 million) funded payments on our long-term debt ($5.2 million), cash dividends ($4.3 million), capital expenditures ($1.7 million), and life insurance premium payments ($1.4 million) and increased cash and cash equivalents by ($26.2 million.)
During fiscal year 2009, cash generated from operations ($3.7 million) and a decrease in cash and cash equivalents ($21.3 million) funded purchases of our common stock ($14.1 million), cash dividends ($4.5 million), payments on long-term debt ($2.7 million), capital expenditures ($2.3 million) and life insurance premium payments ($1.3 million).
During fiscal year 2008, cash generated from operations ($43.8 million), a decrease in cash and cash equivalents ($14.0 million), proceeds from the sale of property, plant and equipment ($3.7 million, principally from the sale of the Martinsville, Va. facility) and proceeds received from certain life insurance policies ($1.2 million) funded purchases of our common stock ($36.0 million), acquisitions ($15.8 million), cash dividends ($5.0 million), payments on long-term debt ($2.5 million), capital expenditures ($1.9 million) and life insurance premium payments ($1.4 million).
In fiscal year 2010, cash generated from operations of $37.4 million increased $33.7 million compared to $3.7 million in fiscal 2009. The increase was due to a $90.0 million decline in cash paid to suppliers and employees (primarily due to lower purchases of imported products and sales of existing inventory) and a $5.8 million decline in tax payments due to lower profitability, partially offset by a $61.7 million decrease in cash received from customers due to the decline in sales.
In fiscal year 2009, cash generated from operations of $3.7 million decreased $40.1 million compared to $43.8 million in fiscal 2008. The decrease was due to a $51.7 million decline in cash received from customers due to the decline in sales, partially offset by a $7.1 million decrease in cash payments to suppliers and employees (principally due to a lower purchases of imported products) and a $5.5 million decline in tax payments principally due to lower profitability. Despite lower inventory purchases in fiscal 2009, inventories increased by $9.7 million in fiscal 2009 due to the natural lag between the decline in customer order rates and our reduction of orders with our suppliers.
In fiscal year 2008, cash generated from operations of $43.8 million increased $20.0 million from $23.8 million in fiscal 2006. The increase was due to a $50.6 million decline in payments to suppliers and employees (principally due to a decline in the purchase of imported products) and a $1.3 million decrease in interest paid, net due to an increase interest income and a decline in interest expense. The increase was partially offset by a $27.9 million decrease in cash received from customers and a $4.0 million increase in income taxes paid, principally due to increased taxable income.
Investing activities consumed $1.7 million in fiscal 2010 compared to $3.8 million consumed in fiscal 2009. In fiscal 2010, we invested in $1.7 million in property, plant and equipment, $1.4 million for life insurance premium payments, partially offset by proceeds received from Company-owned life insurance policies of $987,000 and proceeds from the sale of property, plant and equipment of $337,000.
Investing activities consumed $3.8 million of cash in fiscal year 2009 compared to consuming $14.3 million in fiscal 2008. In fiscal 2009, we invested $2.3 million in property, plant and equipment, $1.3 million for life insurance premium payments and $181,000 to complete the acquisition of Opus Designs. In fiscal year 2008, the investments of $10.6 million to acquire Sam Moore, $5.3 million to acquire Opus Designs and the $1.9 million investments in property, plant and equipment exceeded the $3.7 million in proceeds from the sale of property, plant and equipment (principally from the sale of the Martinsville, Va. facility). Capital expenditures in each period were to maintain and enhance our business operating systems and facilities and for the purchase of equipment and other assets.
Financing activities consumed cash of $9.5 million in fiscal 2010 compared to $21.3 million in fiscal 2009. During fiscal year 2010, we made payments of $5.2 million on our long-term debt (both a scheduled payment and the repayment in full of our long-term debt in conjunction with the amendment of our credit agreement), a payment of $4.9 million on our short-term debt and paid cash dividends of $4.3 million. These payments were partially offset by short-term borrowings of $4.9 million.
Financing activities consumed cash of $21.3 million in fiscal year 2009 compared to $43.6 million in fiscal 2008. During fiscal year 2009, we expended cash of $14.1 million to repurchase approximately 800,000 shares of Hooker common stock, which completed the share repurchase program originally authorized in fiscal 2007. We also paid dividends of $4.5 million and made scheduled debt payments of $2.7 million. During fiscal year 2008, we expended cash of $36.0 million for the repurchase of 1.7 million shares of Hooker common stock, cash dividends of $5.0 million and $2.5 million for scheduled debt payments.
Debt Covenant Compliance
The credit agreement for our revolving credit facility contains, among other things, financial covenants as to minimum tangible net worth, the ratio of funded debt to earnings before interest, taxes, depreciation, amortization, non-cash charges and maximum capital expenditures. We are in compliance with these covenants as of January 31, 2010.
Swap Agreements
We are party to an interest rate swap agreement that provided, in effect, for a fixed interest rate on our term loans through September 1, 2010. Prior to our fiscal 2010 third quarter, we accounted for our interest rate swap agreement as a cash flow hedge, and recognized the fair value of the agreement on the balance sheet in shareholders’ equity under the caption “accumulated other comprehensive income.” The related gains or losses on this instrument were recorded through comprehensive income (loss) and, accordingly, were included in accumulated other comprehensive income on the balance sheet until recognized in net income.
In connection with the amendment of our credit agreement, effective August 11, 2009, we repaid our term loans in full. As a result, our interest rate swap no longer qualified as an effective hedge and we recognized a charge of $112,000 to income, which represented the balance under accumulated other comprehensive income on the date the loans were repaid. Through the remainder of the term of this interest rate swap, which terminates on September 1, 2010, all future changes in the swap’s fair value will be charged against net income. During our fiscal year ended January 31, 2010, we recognized aggregate charges of $55,000 against net income for the change in the swap’s fair value after the date our term loans were repaid.
In addition, in 2003 we terminated a similar swap agreement, which, prior to its termination, provided, in effect, a fixed interest rate on our term loans. We made a $3.0 million payment to terminate that former swap agreement, which through the periods ended August 2, 2009 was being amortized over the remaining repayment period of the loans. Upon the repayment of our terms loans, we wrote-off the remaining $61,000 unamortized balance of this swap termination payment during the fiscal 2010 third quarter.
Amendment of Credit Agreement and Repayment of Term Loans
On August 11, 2009, we amended our credit agreement. The amendment included the following terms:
|
·
|
upon execution of the amendment, we were required to repay in full the remaining balance of the term loans outstanding under the agreement ($3.8 million, plus accrued interest);
|
|
·
|
effective as of July 30, 2009, the funded debt to EBITDA ratio under the credit agreement was changed from 1.25:1.0 to 2.0:1.0; and
|
|
·
|
effective as of July 30, 2009, the debt service coverage ratio under the credit agreement was eliminated.
|
The other terms of the credit agreement, including our $15 million revolving line of credit, were unchanged. A copy of the amendment was included as Exhibit 10.1 to our Form 8-K, filed with the SEC on August 13, 2009.
Liquidity, Financial Resources and Capital Expenditures
As of January 31, 2010, we had an aggregate $13.1 million available under our revolving credit facility to fund working capital needs. Standby letters of credit in the aggregate amount of $1.9 million, used to collateralize certain insurance arrangements and for imported product purchases, were outstanding under our revolving credit facility as of January 31, 2010. There were no additional borrowings outstanding under the revolving credit line on January 31, 2010. Any principal outstanding under the credit line is due March 1, 2011.
We believe that we have the financial resources (including available cash and cash equivalents, expected cash flow from operations, and lines of credit) needed to meet business requirements for the foreseeable future, including capital expenditures, and working capital, as well as to pay dividends on our common stock, and repayments of outstanding debt. Cash flow from operations is highly dependent on incoming order rates and our operating performance. We expect to spend $4 to $6 million in capital expenditures during fiscal year 2011 to maintain and enhance our operating systems and facilities.
Woodleaf Closing
During our fiscal 2010 second quarter, we decided to transition frame production from our Bradington-Young Woodleaf, North Carolina plant (a leased facility) to Bradington-Young’s Cherryville, North Carolina facility by the end of December 2009. On July 17, 2009, we announced our plans to sell the frame production operation, including the associated machinery and equipment, as an on-going business. However, at November 1, 2009 we had not found, and did not anticipate finding, a buyer for this operation. Consequently, during the 2010 fiscal third quarter, we recorded $132,000 for severance (the majority of which was paid during our fiscal 2010 fourth quarter) and $48,000 in accelerated depreciation on fixed assets utilized at this location. We recorded an additional $32,000 in accelerated depreciation during our fiscal 2010 fourth quarter and have exited this location.
We expect that exiting the Woodleaf operation and moving frame production to Cherryville will reduce fixed overhead costs by approximately $350,000 annually (or about $0.02 to $0.03 per share after tax) following the completion of the transition period beginning in fiscal 2011.
Supplier Commitments
From May 2007 through September 2009, we advanced payments to, and provided financing guarantees for, one of our finished goods suppliers to facilitate the supplier’s purchase of raw materials and other related items in order to help ensure timely delivery of finished goods to us. The balance of the advances and other miscellaneous amounts to this supplier at January 31, 2010 was $124,000. In order for the supplier to obtain additional bank financing, we issued a standby letter of credit on July 14, 2008 as security in the amount of $600,000. In conjunction with the issuance of the letter of credit, we entered into a security agreement with the supplier and the supplier’s shareholders, which provides us with a security interest in certain assets of the supplier and its shareholders. During September 2009, prior to the expiration of the letter of credit, the supplier ceased operations, and defaulted on its bank notes, and its lender drew on our $600,000 letter of credit. Subsequently, we reimbursed our letter of credit provider for the $600,000. Due to the location and nature of the pledged collateral, we may incur substantial costs to obtain and foreclose on it. Consequently, we recorded:
|
·
|
a charge of $300,000 during the third quarter of fiscal 2010 to write down the value of the pledged collateral to our estimate of its net realizable value ($300,000); and
|
|
·
|
charges totaling $124,000 during the our third and fourth quarters of fiscal 2010 to reserve against the potential uncollectability of the outstanding advances and other miscellaneous amounts due from the supplier.
|
The estimated net realizable amount for the pledged collateral of $300,000 as of January 31, 2010 is recorded in our consolidated balance sheets in “other assets.” Based on a recent appraisal, we believe that the net realizable value of $300,000 is reasonable and approximates the collateral’s fair value. We are currently working with the supplier and its shareholders to have the pledged collateral conveyed to us.
Common Stock and Dividends
Since February 7, 2007, our Board of Directors has authorized the repurchase of $50 million of our common stock in a series of repurchase authorizations, subject to the limitations of a trading plan under Rule 10b-5-1 of the Securities Exchange Act of 1934 and certain board imposed guidelines. We completed these share repurchases in August 2008.
On January 15, 2010, awards totaling 2,831 shares of restricted common stock were granted to the five non-employee members of our Board of Directors. Each award is subject to vesting requirements and other limitations in accordance with the Hooker Furniture 2005 Stock Incentive Plan.
On April 13, 2010, our Board of Directors declared a quarterly cash dividend of $0.10 per share, payable on May 28, 2010, to shareholders of record May 14, 2010.
Commitments and Contractual Obligations
As of January 31, 2010, our commitments and contractual obligations were as follows:
| Payments Due by Period (In thousands) | ||||||||||||||||||||
|
Less than
|
More than
|
|||||||||||||||||||
|
1 Year
|
1-3 Years
|
3-5 Years
|
5 years
|
Total
|
||||||||||||||||
|
Deferred compensation payments
|
$ | 436 | $ | 999 | $ | 1,457 | $ | 11,395 | $ | 14,287 | ||||||||||
|
Operating leases
|
1,349 | 1,903 | 937 | - | 4,189 | |||||||||||||||
|
Other long-term obligations
|
885 | 404 | 162 | 36 | 1,487 | |||||||||||||||
|
Total contractual cash obligations
|
$ | 2,670 | $ | 3,306 | $ | 2,556 | $ | 11,431 | $ | 19,963 | ||||||||||
Standby letters of credit in the aggregate amount of $1.9 million, used to collateralize certain insurance arrangements and for imported product purchases, were outstanding under our revolving credit facility as of January 31, 2010. There were no additional borrowings outstanding under the revolving credit line on January 31, 2010.
Strategy and Outlook
Our strategy is to offer world-class style, quality and product value as a complete residential wood, metal and upholstered furniture resource through excellence in product design, global sourcing, manufacturing, logistics, sales, marketing and customer service. We strive to be an industry leader in sales growth and profitability performance, thereby providing an outstanding investment for our shareholders and contributing to the well-being of our employees, customers, suppliers and community neighbors. Additionally, we strive to nurture the relationship-focused, team-oriented and honor-driven corporate culture that has distinguished our company for over 85 years.
We have been executing this strategy since 2003 in part through:
|
§
|
exiting domestic wood furniture manufacturing to concentrate on imported wood and metal and domestically produced and imported upholstered home furnishings;
|
|
§
|
expanding product offerings to become a more complete and important resource to our furniture retailers through:
|
|
Ø
|
the acquisitions of upholstery manufacturers Bradington-Young LLC (2003) and Sam Moore LLC (2007), and in youth furniture lines through the purchase of Opus Designs LLC (2007) and by organically expanding the styles and price points offered in existing product lines; and
|
|
Ø
|
the introduction of our Envision product line in April 2009, which was designed to meet the needs of a younger and less affluent consumer and debuted on sales floors during our fiscal year 2010 third quarter.
|
|
§
|
continuing to improve and expand our supply chain capabilities, with improvements in forecasting and demand-planning software and stock keeping unit (“SKU”) optimization;
|
|
§
|
filling key leadership positions with people who have the skill sets and experience needed under our new business model; and
|
|
§
|
expanding service capabilities for our container direct customers by adding warehousing at two important suppliers’ plants in China.
|
The year over year declines in quarterly incoming orders, which began in the Fall of 2006, continued during our 2010 fiscal year. We believe that recovery may be slow, irregular, and easily derailed. Our outlook for fiscal 2011 is one of continued cautious optimism. We believe that our product, inventory availability, and business model uniquely position us to take advantage of any upturn in the economy. That optimism, however, is tempered by the uniqueness of the present economic situation. Thus, we believe that continued attention to cost control is necessary.
Our new Envision product line was introduced in April 2009 and debuted on retail sales floors during the fiscal year 2010 third quarter. While response to this new line has been encouraging, we have not yet seen an overall rebound in purchases of big-ticket consumer products such as furniture. So we remain cautious in our planning and continue to take actions to address challenges to our profitability. Some of those actions include:
|
§
|
deferring, reducing or eliminating certain spending plans;
|
|
§
|
continuing to refine the management of our supply chain, warehousing and distribution operations; and
|
|
§
|
adjusting our inventory levels to reflect current business conditions and lower sales volumes.
|
The performance of our domestic upholstery operations have been particularly impacted by the prolonged sales downturn due to the higher fixed overhead costs for those operations as a percentage of reduced net sales. To mitigate the impact of these sales declines we are:
|
§
|
pursuing additional distribution channels and offering an array of new products and designs that we believe will generate sales growth;
|
|
§
|
taking actions to streamline our domestic upholstery operations, improve efficiency and reduce overhead; and,
|
|
§
|
continuing to evaluate our manufacturing capacity utilization, work schedules and operating costs to better match costs to current sales volume levels.
|
Due to excess capacity, our upholstery division reported an operating loss of 9.3% of net sales for fiscal 2010 as compared to an operating loss of 6.8% of net sales for fiscal 2009. We have responded to this decline in performance by intensifying our focus on cost reduction and sales growth initiatives for our upholstery operations including reductions of personnel, consolidating manufacturing facilities, implementing Lean Manufacturing process improvement technology and introducing technological changes to reduce labor costs. In terms of sales growth, we have focused on updating our upholstery lines with more contemporary offerings while retaining our best selling traditionally-styled items. Consequently, we recently introduced the Envision line and the Paris Flea Market collection, which integrates stand-alone elements from all three Hooker brands –including both upholstery and wood furniture- in a fresh and exciting way. We believe both Envision and Paris Flea Market represent a compelling value for consumers and will ultimately drive sales across the entire Company. We are encouraged by the response to these product offerings at the Spring and Fall International Home Furnishings Markets. With continued emphasis on cost control and product development, coupled with a continued improvement in business, we believe we can return our upholstery division to profitability in fiscal 2011.
Fourth quarter results of operations suggest that recovery will be slow and inconsistent. Wood furniture sales of $35.9 million in the fiscal 2010 fourth quarter declined $5.1 million, or 12.4%, from the fiscal 2009 fourth quarter, while upholstery sales fared better, showing a $1.3 million increase from $15.6 million in the fiscal 2009 fourth quarter to $16.8 million in the fiscal 2010 period. Wood furniture gross margins were improved from 28.4% of net sales in the fiscal 2009 fourth quarter to 35.0% of net sales in the fiscal 2010 fourth quarter, due principally to lower freight costs on imported furniture and the impact of cost reduction initiatives, while upholstery gross margins declined slightly from 13.7% of net sales in the fiscal 2009 fourth quarter to 13.5% of net sales in the fiscal 2010 period despite the higher net sales due to higher discounting and costs incurred to exit our Woodleaf, N.C. frame manufacturing facility. Wood furniture operating margins improved from 7.0% of net sales in the fiscal 2009 fourth quarter to 15.4% in the fiscal 2010 quarter due to lower freight costs, cost reduction initiatives and $614,000 lower intangible asset impairment charges , while upholstery operating margins improved to -5.8% of net sales in the fiscal 2010 fourth quarter, from -27.7% of net sales in the fiscal 2009 quarter, principally due to lower intangible asset impairment charges $3.5 million in the current year, partially offset by slightly higher cost of goods sold and operating costs on higher sales volumes, but also as a percent of net sales.
Environmental Matters
Hooker Furniture is committed to protecting the environment. As a part of our business operations, our manufacturing sites generate non-hazardous and hazardous wastes; the treatment, storage, transportation and disposal of which are subject to various local, state and national laws relating to protecting the environment. We are in various stages of investigation, remediation or monitoring of alleged or acknowledged contamination at current or former manufacturing sites for soil and groundwater contamination and visible air emissions, none of which we believe is material to our results of operations or financial position. Our policy is to record monitoring commitments and environmental liabilities when expenses are probable and can be reasonably estimated. The costs associated with our environmental responsibilities, compliance with federal, state and local laws regulating the discharge of materials into the environment, or costs otherwise relating to the protection of the environment, have not had and are not expected to have a material effect on our financial position, results of operations, capital expenditures or competitive position.
Critical Accounting Policies and Estimates
Hooker Furniture’s significant accounting policies are described in “Note 1 – Summary of Significant Accounting Policies” to the consolidated financial statements beginning at page F-1 in this report. The preparation of financial statements in conformity with U.S. generally accepted accounting principles requires us to make estimates and assumptions in certain circumstances that affect amounts reported in the accompanying financial statements and related notes. In preparing these financial statements, we have made our best estimates and judgments of certain amounts included in the financial statements, giving due consideration to materiality. We do not believe that actual results will deviate materially from our estimates related to our accounting policies described below. However, because application of these accounting policies involves the exercise of judgment and the use of assumptions as to future uncertainties, actual results could differ materially from these estimates.
Allowance for Doubtful Accounts. We evaluate the adequacy of our allowance for doubtful accounts at the end of each quarter. In performing this evaluation, we analyze the payment history of our significant past due accounts, subsequent cash collections on these accounts and comparative accounts receivable aging statistics. Based on this information, along with consideration of the general condition of the economy, we develop what we consider to be a reasonable estimate of the uncollectible amounts included in accounts receivable. This estimate involves significant judgment and actual uncollectible amounts may differ materially from our estimate.
Valuation of Inventories. We value all of our inventories at the lower of cost (using the last-in, first-out (“LIFO”) method) or market. LIFO cost for all of our inventories is determined using the dollar-value, link-chain method. This method allows for the more current cost of inventories to be reported in cost of sales, while the inventories reported on the balance sheet consist of the costs of inventories acquired earlier, subject to adjustment to the lower of cost or market. Hence, if prices are rising, the LIFO method will generally lead to higher cost of sales and lower profitability as compared to the first-in, first-out (“FIFO”) method. We evaluate our inventory for excess or slow moving items based on recent and projected sales and order patterns. We establish an allowance for those items when the estimated market or net sales value is lower than their recorded cost. This estimate involves significant judgment and actual values may differ materially from our estimate.
Restructuring and Impairment of Long-Lived Assets
Tangible Assets
We regularly review our property, plant and equipment for indicators of impairment, as specified in the Property, Plant, and Equipment topic of the Accounting Standards Codification. Although not exhaustive, this accounting guidance lists potential indicators of impairment, which we use to facilitate our review. These potential indicators of impairment include:
|
§
|
A significant decrease in the market value of the long-lived asset;
|
|
§
|
A significant adverse change in the extent or manner in which a long-lived asset group is being used, or in its physical condition;
|
|
§
|
A significant adverse change in the legal factors or in the business climate that could affect the value of a long-lived asset, including an adverse action or assessment by a regulator;
|
|
§
|
An accumulation of costs significantly in excess of the amount originally expected to acquire or construct a long-lived asset;
|
|
§
|
A current period operating or cash flow loss or a projection or forecast that demonstrates continuing losses associated with the long-lived assets use; or
|
|
§
|
A current expectation that more-likely-than-not, a long-lived asset will be sold or otherwise disposed of significantly before the end of its previously estimated useful life.
|
The impairment test for our property, plant and equipment requires us to assess the recoverability of the value of the assets by comparing their net carrying value to the sum of undiscounted estimated future cash flows directly associated with and arising from use and eventual disposition of the assets. We principally use our internal forecasts to estimate the undiscounted future cash flows used in our impairment analyses. These forecasts are subjective and are largely based on management’s judgment, primarily due to the changing industry in which we compete; changing consumer tastes, trends, and demographics; and the current economic environment. We monitor changes in these factors as part of the quarter-end review of these assets. While our forecasts have been reasonably accurate in the past, during periods of economic instability, uncertainty, or rapid change within our industry, we may not be able to accurately forecast future cash flows from our long-lived assets and our future cash flows may be diminished. Therefore, our estimates and assumptions related to the viability of our long-lived assets may change, and are reasonably likely to change in future periods. These changes could adversely affect our consolidated statements of operations and consolidated statements of financial position. As of January 31, 2010, the fair value of our property, plant and equipment was substantially in excess of its carrying value.
When we conclude that any of these assets is impaired, the asset is written down to its fair value. Any impaired assets that we expect to dispose of by sale are measured at the lower of their carrying amount or fair value, less cost to sell; are no longer depreciated; and are reported separately as “assets held for sale” in the consolidated balance sheets.
The costs to dispose of these assets are recognized when we commit to a plan of disposal. Severance and related benefits to be paid to terminated employees affected by the facility closings are recorded in the period when management commits to a plan of termination. We recognize liabilities for these exit and disposal activities at fair value in the period in which the liability is incurred. Asset impairment charges related to the closure of facilities are based on our best estimate of expected sales prices, less related selling expenses for assets to be sold. The recognition of asset impairment and restructuring charges for exit and disposal activities requires significant judgment and estimates by management. We reassess our accrual of restructuring and asset impairment charges each reporting period. Any change in estimated restructuring and related asset impairment charges is recognized in the period during which the change occurs.
Intangible Assets
We own certain indefinite-lived intangible assets related to Bradington-Young, Sam Moore and Opus Designs by Hooker. We may acquire additional amortizable assets and/or indefinite lived intangible assets in future asset purchases or business combinations. The principal indefinite-lived intangible assets are trademarks and trade names which are not amortized but are tested for impairment annually or more frequently if events or circumstances indicate that the asset might be impaired. The fair value of the indefinite-lived intangible assets is determined based on the estimated earnings and cash flow capacity of those assets. The impairment test consists of a comparison of the fair value of the indefinite-lived intangible assets with their carrying amount. If the carrying amount of the indefinite-lived intangible assets exceeds their fair value, an impairment loss is recognized in an amount equal to that excess.
Trade names are tested for impairment annually as of the first day of our fiscal fourth quarter or more frequently if events or changes in circumstances indicate that the asset might be impaired. Circumstances that could indicate a potential impairment include:
|
·
|
a significant adverse change in the economic or business climate either within the furniture industry or the national or global economy;
|
|
·
|
significant changes in demand for our products;
|
|
·
|
loss of key personnel; or
|
|
·
|
the likelihood that a reporting unit or significant portion of a reporting unit will be sold or otherwise disposed of.
|
The assumptions used to determine the fair value of our intangible assets are highly subjective and judgmental and include long term growth rates, sales volumes, projected revenues, assumed royalty rates and factors used to develop an applied discount rate. If the assumptions that we use in these calculations differ from actual results, we may realize additional impairment on our intangible assets which may have a material, adverse affect on our consolidated statements of operations and consolidated balance sheets.
Based on assumptions used in the valuation of our Opus Designs trade names, any further deterioration in the inputs used to value the trade name at January 31, 2010 would result in additional impairment. The fair value of our Bradington-Young and Sam Moore trade names were substantially in excess of their carrying values at January 31, 2010.
ITEM 7A. QUANTITATIVE AND QUALITATIVE DISCLOSURES ABOUT MARKET RISK
Hooker Furniture is exposed to market risk from changes in interest rates and foreign currency exchange rates, which could impact our results of operations or financial condition. We manage our exposure to these risks through our normal operating and financing activities and through the use of interest rate swap agreements with respect to interest rates.
From time to time we have entered into swap agreements to hedge against the potential impact of increases in interest rates on our floating-rate debt instruments. By using swap agreements to hedge exposures to changes in interest rates, we expose ourselves to credit risk and market risk. Credit risk is the potential failure of the counterparty to perform under the terms of the swap agreement. We attempt to minimize this credit risk by entering into transactions with high-quality counterparties. Market risk is the potential adverse effect on the value of the swap agreement that results from a decline in interest rates. The market risk associated with interest-rate contracts is managed by establishing and monitoring parameters that limit the types and degree of market risk that may be undertaken.
Amounts outstanding under our revolving line of credit bear interest at variable rates. There was no outstanding balance under our revolver as of January 31, 2010. Therefore, a fluctuation in market interest rates of one percentage point (or 100 basis points) would not have a material impact on our results of operations or financial condition.
For imported products, we generally negotiate firm pricing denominated in U.S. Dollars with our foreign suppliers, typically for periods of at least one year. We accept the exposure to exchange rate movements beyond these negotiated periods. We do not use derivative financial instruments to manage this risk. Most of our imports are purchased from China. The Chinese currency now floats within a limited range in relation to the U.S. Dollar, resulting in additional exposure to foreign currency exchange rate fluctuations.
Since we transact our imported product purchases in U.S. Dollars, a relative decline in the value of the U.S. Dollar could increase the price we pay for imported products beyond the negotiated periods. We generally expect to reflect substantially all of the effect of any price increases from suppliers in the prices we charge for imported products. However, these changes could adversely impact sales volume or profit margins during affected periods.
ITEM 8. FINANCIAL STATEMENTS AND SUPPLEMENTARY DATA
Our financial statements listed in Item 15(a), and which begin on page F-1, of this report are incorporated herein by reference and are filed as a part of this report.
Certain Non-GAAP Financial Measures
In our Annual Report to Shareholders (of which this annual report on Form 10-K is a part), under the heading “Financial Highlights,” we reported net income and earnings per share both including and excluding the impact of restructuring and asset impairment charges, the January 2007 ESOP termination charge and the December 2007 charge related to the donation of two former Bradington-Young showrooms. In this Form 10-K in Management’s Discussion and Analysis of Financial Condition and Results of Operations, under the headings “Results of Operations Fiscal 2010 Compared to Fiscal 2009” and “Results of Operations Fiscal 2009 Compared to Fiscal 2008”, we have reported operating income margin both including and excluding the impact of restructuring and asset impairment charges.
The net income, earnings per share and operating income margin figures excluding the impact of the items specified above are “non-GAAP” financial measures. We provide this information because we believe it is useful to investors in evaluating our ongoing operations. Non-GAAP financial measures provide insight into selected financial information and should be evaluated in the context in which they are presented. These measures are of limited usefulness in evaluating our overall financial results presented in accordance with GAAP and should be considered in conjunction with the consolidated financial statements, including the related notes, and Management’s Discussion and Analysis of Financial Condition and Results of Operations included elsewhere in this report.
None.
ITEM 9A. CONTROLS AND PROCEDURES
Evaluation of Disclosure Controls and Procedures
Based on their most recent review, which was made as of the end of our fourth quarter ended January 31, 2010, our principal executive officer and principal financial officer have concluded that our disclosure controls and procedures are effective to provide reasonable assurance that information required to be disclosed in the reports that we file or submit under the Securities Exchange Act of 1934, as amended, is accumulated and communicated to the Company’s management, including its principal executive officer and principal financial officer, as appropriate to allow timely decisions regarding required disclosure and are effective to provide reasonable assurance that such information is recorded, processed, summarized and reported within the time periods specified in the Securities and Exchange Commission (“SEC”) rules and forms.
Management’s Annual Report on Internal Control over Financial Reporting
In accordance with Section 404 of the Sarbanes-Oxley Act and SEC rules thereunder, management has conducted an assessment of our internal control over financial reporting as of January 31, 2010. Our report regarding that assessment is included with the financial statements on page F-2 of this report and is incorporated herein by reference.
Report of Registered Public Accounting Firm
Our independent registered public accounting firm, KPMG LLP, audited the consolidated financial statements included in this annual report on Form 10-K and have issued an audit report on the effectiveness of our internal control over financial reporting. Their report is included with the financial statements on page F-4 of this report and is incorporated herein by reference.
Changes in Internal Control over Financial Reporting
There have been no changes in our internal control over financial reporting for our fourth quarter ended January 31, 2010, that have materially affected, or are reasonably likely to materially affect, our internal control over financial reporting.
ITEM 9B. OTHER INFORMATION
None
Hooker Furniture Corporation
Part III
In accordance with General Instruction G (3) of Form 10-K, the information called for by Items 10, 11, 12, 13 and 14 of Part III is incorporated by reference to the Company’s definitive Proxy Statement for its Annual Meeting of Shareholders scheduled to be held June 8, 2010 (the “2010 Proxy Statement”), as set forth below:
ITEM 10. DIRECTORS, EXECUTIVE OFFICERS AND CORPORATE GOVERNANCE
Information related to Hooker Furniture’s directors will be set forth under the caption “Election of Directors” in the 2010 Proxy Statement and is incorporated herein by reference.
Information relating to compliance with Section 16(a) of the Exchange Act will be set forth under the caption “Section 16(a) Beneficial Ownership Reporting Compliance” in the 2010 Proxy Statement and is incorporated herein by reference.
Information regarding material changes, if any, in the procedures by which shareholders may recommend nominees to the Hooker Board of Directors will be set forth under the caption “Procedures for Shareholder Recommendations of Director Nominees” in the 2010 Proxy Statement and is incorporated herein by reference.
Information relating to the Audit Committee of the Company’s Board of Directors, including the composition of the Audit Committee and the Board’s determinations concerning whether certain members of the Audit Committee are “financial experts” as that term is defined under Item 407(d)(5) of Regulation S-K will be set forth under the captions “Corporate Governance” and “Audit Committee” in the 2010 Proxy Statement and is incorporated herein by reference.
Information concerning the executive officers of the Company is included in Part I of this report under the caption “Executive Officers of Hooker Furniture Corporation.”
ITEM 11. EXECUTIVE COMPENSATION
Information relating to this item will be set forth under the captions “Report of the Compensation Committee,” “Executive Compensation” and “Director Compensation” in the 2010 Proxy Statement and is incorporated herein by reference.
ITEM 12. SECURITY OWNERSHIP OF CERTAIN BENEFICIAL OWNERS AND MANAGEMENT AND RELATED SHAREHOLDER MATTERS
Information relating to this item will be set forth under the captions “Equity Compensation Plan Information” and “Security Ownership of Certain Beneficial Owners and Management” in the 2010 Proxy Statement and is incorporated herein by reference.
ITEM 13. CERTAIN RELATIONSHIPS AND RELATED TRANSACTIONS, AND DIRECTOR INDEPENDENCE
Information relating to this item will be set forth under the captions “Related Party Transactions”, the last paragraph under the caption “Audit Committee” and the caption “Corporate Governance” in the 2010 Proxy Statement and is incorporated herein by reference.
ITEM 14. PRINCIPAL ACCOUNTANT FEES AND SERVICES
Information relating to this item will be set forth under the caption “Independent Registered Public Accounting Firm” in the 2010 Proxy Statement and is incorporated herein by reference.
Hooker Furniture Corporation
Part IV
ITEM 15. EXHIBITS AND FINANCIAL STATEMENT SCHEDULES
(a) Documents filed as part of this report on Form 10-K:
|
(1)The following financial statements are included in this report on Form 10-K:
|
|
| Report of Independent Registered Public Accounting Firm | |
|
|
Consolidated Balance Sheets as of January 31, 2010 and February 1, 2009
|
|
Consolidated Statements of Operations for the fifty-two weeks ended January 31, 2010, the fifty-two weeks ended February 1, 2009, and the fifty-three weeks ended February 3, 2008
|
|
|
|
Consolidated Statements of Cash Flows for the fifty-two weeks ended January 31, 2010, the fifty-two weeks ended February 1, 2009, and the fifty-three weeks ended February 3, 2008
|
|
Consolidated Statements of Shareholders’ Equity and Comprehensive Income for the fifty-three weeks ended February 3, 2008, the fifty-two weeks ended February 1, 2009 and the fifty-two weeks ended January 31, 2010
|
|
|
Notes to Consolidated Financial Statements
|
|
|
(2) Financial Statement Schedules:
|
|
| Financial Statement Schedules have been omitted because the information required has been separately disclosed in the consolidated financial statements or related notes. | |
(b) Exhibits:
|
3.1
|
Amended and Restated Articles of Incorporation of the Company, as amended March 28, 2003 (incorporated by reference to Exhibit 3.1 of the Company’s Form 10-Q (SEC File No. 000-25349) for the quarter ended February 28, 2003)
|
|
3.2
|
Amended and Restated Bylaws of the Company (incorporated by reference to Exhibit 3.2 to the Company’s Form 10-Q ((SEC File No. 000-25349) for the quarter ended August 31, 2006)
|
|
4.1
|
Amended and Restated Articles of Incorporation of the Company (See Exhibit 3.1)
|
|
4.2
|
Amended and Restated Bylaws of the Company (See Exhibit 3.2)
|
|
4.3(a)
|
|
|
4.3(b)
|
First Amendment to Credit Agreement, dated as of February 18, 2005, among the Company, the Lenders party thereto, and Bank of America, N.A., as agent (incorporated by reference to Exhibit 10.2 of the Company’s Form 10-Q (SEC File No. 000-25349) for the quarter ending February 28, 2005)
|
|
4.3(c)
|
Second Amendment to Credit Agreement dated as of February 27, 2008, among the Company and Bank of America, N.A. as lender and agent (incorporated by reference to Exhibit 4.3(c) of the Company’s Annual Report on Form 10-K (SEC File No. 000-25349) filed April 16, 2008)
|
|
4.3(d)
|
Third Amendment to Credit Agreement dated as of February 19, 2009, between the Company and Bank of America, N.A. (incorporated by reference to Exhibit 10.1 of the Company’s Current Report on Form 8-K (SEC File No. 000-25349) filed on February 20, 2009)
|
|
4.3(e)
|
Fourth Amendment to Credit Agreement dated as of August 10, 2009 between the Company and Bank of America, N.A. (incorporated by reference to Exhibit 10.1 of the Company’s Current Report on Form 8-K (SEC File No. 000-25349) filed on August 13, 2009)
|
|
Pursuant to Regulation S-K, Item 601(b)(4)(iii), instruments evidencing long-term debt not exceeding 10% of the Company’s total assets have been omitted and will be furnished to the Securities and Exchange Commission upon request.
|
|
|
10.1(a)
|
Form of Executive Life Insurance Agreement dated December 31, 2003, between the Company and certain of its executive officers (incorporated by reference to Exhibit 10.1 of the Company’s Form 10-Q (SEC File No. 000-25349) for the quarter ended February 29, 2004)*
|
|
|
|
|
10.1(b)(i)
|
Supplemental Retirement Income Plan effective as of December 1, 2003 (incorporated by reference to Exhibit 10.3 of the Company’s Form 10-Q (SEC File No. 000-25349) for the quarter ended February 29, 2004)*
|
|
10.1(b)(ii)
|
First Amendment to the Supplemental Retirement Income Plan, dated as of May 24, 2007 incorporated by reference to Exhibit 10.1(b)(ii) of Form 10-K (SEC File No. 000-25349) filed on April 16, 2008
|
|
|
|
|
10.1(b)(iii)
|
2008Amendment and Restatement of the Hooker Furniture Corporation Supplemental Retirement Income Plan, effective as of December 31, 2008 incorporated by reference to Exhibit 10.1 of the Company’s Current Report on Form 8-K (SEC File No. 000-25349) filed on November 19, 2008*
|
|
10.1(c)
|
|
|
10.1(d)
|
Hooker Furniture Corporation 2005 Stock Incentive Plan (incorporated by reference to Appendix B of the Company’s Definitive Proxy Statement dated March 1, 2005 (SEC File No. 000-25349))*
|
|
10.1(e)
|
Form of Outside Director Restricted Stock Agreement (incorporated by reference to Exhibit 99.1 of the Company’s Current Report on Form 8-K (SEC File No. 000-25349) filed January 17, 2006)*
|
|
10.1(f)
|
Employment Agreement, dated June 15, 2007, between Alan D. Cole and the Company incorporated by reference to Exhibit 10.1(h) of the Company’s Annual Report on Form 10-K (SEC File No. 000-25349) filed on April 16, 2008
|
|
10.1(g)
|
Employment Agreement, dated June 3, 2008, between Alan D. Cole and the Company incorporated by reference to Exhibit 10.1(i) of the Company’s Annual Report on Form 10-K (SEC File No. 000-25349) filed on June 5, 2008
|
|
10.1(h)
|
|
|
10.2(a)
|
Credit Agreement, dated April 30, 2003, between Bank of America, N.A., and the Company (See Exhibit 4.3(a)) (filed herewith)
|
|
10.2(b)
|
First Amendment to Credit Agreement, dated as of February 18, 2005, among the Company, the Lenders party thereto, and Bank of America, N.A., as agent (See Exhibit 4.3(b))
|
|
10.2(c)
|
Second Amendment to Credit Agreement, dated as of February 27, 2008, among the Company and Bank of America, N.A., as lender and agent (See Exhibit 4.3(c))
|
|
10.2(d)
|
Third Amendment to Credit Agreement dated as of February 19, 2009, between Company and Bank of America, N.A. (See Exhibit 4.3(d))
|
|
10.2(e)
|
Fourth Amendment to Credit Agreement, dated as of August 10, 2009, between the Company and Bank of America N.A. (See Exhibit 4.3(e))
|
|
21
|
List of Subsidiaries:
|
|
Bradington-Young LLC, a Virginia limited liability company
|
|
|
|
Sam Moore Furniture LLC, a Virginia limited liability company
|
|
23
|
|
|
31.1
|
|
|
31.2
|
|
|
32.1
|
*Management contract or compensatory plan
Pursuant to the requirements of Section 13 or 15(d) of the Securities Exchange Act of 1934, the registrant has duly caused this report to be signed on its behalf by the undersigned, thereunto duly authorized.
|
HOOKER FURNITURE CORPORATION
|
|||
|
Date: April 15, 2010
|
By:
|
/s/ Paul B. Toms, Jr. | |
| Paul B. Toms, Jr. | |||
| Chairman, President and Chief Executive Officer | |||
Pursuant to the requirements of the Securities Exchange Act of 1934, this report has been signed below by the following persons on behalf of the registrant and in the capacities and on the dates indicated.
|
Signature
|
Title
|
Date
|
|
/s/ Paul B. Toms, Jr.
|
Chairman, President, Chief Executive Officer and
|
April 15, 2010
|
|
Paul B. Toms, Jr.
|
Director (Principal Executive Officer)
|
|
|
/s/ E. Larry Ryder
|
Executive Vice President - Finance and
|
April 15, 2010
|
|
E. Larry Ryder
|
Administration and Chief Financial Officer
|
|
|
(Principal Financial Officer)
|
||
|
/s/ Paul A. Huckfeldt
|
Chief Accounting Officer
|
April 15, 2010
|
|
Paul A. Huckfeldt
|
(Principal Accounting Officer)
|
|
|
/s/ W. Christopher Beeler, Jr.
|
Director
|
April 15, 2010
|
|
W. Christopher Beeler, Jr.
|
||
|
/s/ John L. Gregory, III
|
Director
|
April 15, 2010
|
|
John L. Gregory, III
|
||
|
/s/ Mark F. Schreiber
|
Director
|
April 15, 2010
|
|
Mark F. Schreiber
|
||
|
/s/ David G. Sweet
|
Director
|
April 15, 2010
|
|
David G. Sweet
|
||
|
/s/ Henry G. Williamson, Jr.
|
Director
|
April 15, 2010
|
|
Henry G. Williamson, Jr.
|
HOOKER FURNITURE CORPORATION AND SUBSIDIARIES
To the Shareholders of
Hooker Furniture Corporation
Martinsville, Virginia
Management is responsible for establishing and maintaining adequate internal control over financial reporting, as defined in Exchange Act Rule 13a-15(f). Under the supervision and with the participation of management, including the principal executive officer and principal financial officer, the Company conducted an evaluation of the effectiveness of its internal control over financial reporting based on the framework in Internal Control—Integrated Framework issued by the Committee of Sponsoring Organizations of the Treadway Commission (COSO). Based on the Company’s evaluation under that framework, management concluded that the Company’s internal control over financial reporting was effective as of January 31, 2010. The effectiveness of the Company’s internal control over financial reporting as of January 31, 2010 has been audited by KPMG LLP, the Company’s independent registered public accounting firm, as stated in their report which is included herein.

Paul B. Toms, Jr.
Chairman, President and Chief Executive Officer
(Principal Executive Officer)
April 15, 2010

E. Larry Ryder
Executive Vice President – Finance and Administration
and Chief Financial Officer
(Principal Financial Officer)
April 15, 2010
The Board of Directors and Shareholders
Hooker Furniture Corporation:
We have audited the accompanying consolidated balance sheets of Hooker Furniture Corporation and subsidiaries as of January 31, 2010 and February 1, 2009, and the related consolidated statements of operations, cash flows and shareholders’ equity and comprehensive income for each of the years in the three-year period ended January 31, 2010. These consolidated financial statements are the responsibility of the Company’s management. Our responsibility is to express an opinion on these consolidated financial statements based on our audits.
We conducted our audits in accordance with the standards of the Public Company Accounting Oversight Board (United States). Those standards require that we plan and perform the audit to obtain reasonable assurance about whether the financial statements are free of material misstatement. An audit includes examining, on a test basis, evidence supporting the amounts and disclosures in the financial statements. An audit also includes assessing the accounting principles used and significant estimates made by management, as well as evaluating the overall financial statement presentation. We believe that our audits provide a reasonable basis for our opinion.
In our opinion, the consolidated financial statements referred to above present fairly, in all material respects, the financial position of Hooker Furniture Corporation and subsidiaries as of January 31, 2010 and February 1, 2009, and the results of their operations and their cash flows for each of the years in the three-year period ended January 31, 2010, in conformity with U.S. generally accepted accounting principles.
We also have audited, in accordance with the standards of the Public Company Accounting Oversight Board (United States), Hooker Furniture Corporation’s internal control over financial reporting as of January 31, 2010, based on criteria established in Internal Control – Integrated Framework issued by the Committee of Sponsoring Organizations of the Treadway Commission (COSO), and our report dated April 13, 2010 expressed an unqualified opinion on the effectiveness of the Company’s internal control over financial reporting.

Charlotte, North Carolina
April 13, 2010
Report of Independent Registered Public Accounting Firm
The Board of Directors and Shareholders
Hooker Furniture Corporation:
We have audited Hooker Furniture Corporation’s internal control over financial reporting as of January 31, 2010, based on criteria established in Internal Control – Integrated Framework issued by the Committee of Sponsoring Organizations of the Treadway Commission (COSO). Hooker Furniture Corporation’s management is responsible for maintaining effective internal control over financial reporting and for its assessment of the effectiveness of internal control over financial reporting, included in the accompanying Management’s Report on Internal Control Over Financial Reporting. Our responsibility is to express an opinion on the Company’s internal control over financial reporting based on our audit.
We conducted our audit in accordance with the standards of the Public Company Accounting Oversight Board (United States). Those standards require that we plan and perform the audit to obtain reasonable assurance about whether effective internal control over financial reporting was maintained in all material respects. Our audit included obtaining an understanding of internal control over financial reporting, assessing the risk that a material weakness exists, and testing and evaluating the design and operating effectiveness of internal control based on the assessed risk. Our audit also included performing such other procedures as we considered necessary in the circumstances. We believe that our audit provides a reasonable basis for our opinion.
A company’s internal control over financial reporting is a process designed to provide reasonable assurance regarding the reliability of financial reporting and the preparation of financial statements for external purposes in accordance with generally accepted accounting principles. A company’s internal control over financial reporting includes those policies and procedures that (1) pertain to the maintenance of records that, in reasonable detail, accurately and fairly reflect the transactions and dispositions of the assets of the company; (2) provide reasonable assurance that transactions are recorded as necessary to permit preparation of financial statements in accordance with generally accepted accounting principles, and that receipts and expenditures of the company are being made only in accordance with authorizations of management and directors of the company; and (3) provide reasonable assurance regarding prevention or timely detection of unauthorized acquisition, use, or disposition of the company’s assets that could have a material effect on the financial statements.
Because of its inherent limitations, internal control over financial reporting may not prevent or detect misstatements. Also, projections of any evaluation of effectiveness to future periods are subject to the risk that controls may become inadequate because of changes in conditions, or that the degree of compliance with the policies or procedures may deteriorate.
In our opinion, Hooker Furniture Corporation maintained, in all material respects, effective internal control over financial reporting as of January 31, 2010, based on criteria established in Internal Control – Integrated Framework issued by the Committee of Sponsoring Organizations of the Treadway Commission.
We also have audited, in accordance with the standards of the Public Company Accounting Oversight Board (United States), the consolidated balance sheets of Hooker Furniture Corporation and subsidiaries as of January 31, 2010 and February 1, 2009, and the related consolidated statements of operations, cash flows and shareholders’ equity and comprehensive income for each of the years in the three-year period ended January 31, 2010, and our report dated April 13, 2010 expressed an unqualified opinion on those consolidated financial statements.

Charlotte, North Carolina
April 13, 2010
HOOKER FURNITURE CORPORATION AND SUBSIDIARIES
|
As of
|
January 31,
|
February 01,
|
||||||
|
2010
|
2009
|
|||||||
|
Assets
|
||||||||
|
Current assets
|
||||||||
|
Cash and cash equivalents
|
$ | 37,995 | $ | 11,804 | ||||
|
Trade accounts receivable, less allowance for doubtful
|
||||||||
|
accounts of $1,938 and $2,207 on each date
|
25,894 | 30,261 | ||||||
|
Inventories
|
36,176 | 60,248 | ||||||
|
Prepaid expenses and other current assets
|
3,468 | 4,736 | ||||||
|
Total current assets
|
103,533 | 107,049 | ||||||
|
Property, plant and equipment, net
|
22,747 | 24,596 | ||||||
|
Intangible assets
|
3,468 | 4,805 | ||||||
|
Cash surrender value of life insurance policies
|
14,810 | 13,513 | ||||||
|
Other assets
|
4,541 | 3,504 | ||||||
|
Total assets
|
$ | 149,099 | $ | 153,467 | ||||
|
Liabilities and Shareholders’ Equity
|
||||||||
|
Current liabilities
|
||||||||
|
Trade accounts payable
|
$ | 10,425 | $ | 8,392 | ||||
|
Accrued salaries, wages and benefits
|
2,184 | 2,218 | ||||||
|
Other accrued expenses
|
1,953 | 2,279 | ||||||
|
Accrued dividends
|
1,077 | - | ||||||
|
Current maturities of long-term debt
|
- | 2,899 | ||||||
|
Total current liabilities
|
15,639 | 15,788 | ||||||
|
Long-term debt, excluding current maturities
|
- | 2,319 | ||||||
|
Deferred compensation
|
5,868 | 5,606 | ||||||
|
Other long-term liabilities
|
- | 44 | ||||||
|
Total liabilities
|
21,507 | 23,757 | ||||||
|
Shareholders’ equity
|
||||||||
|
Common stock, no par value, 20,000 shares authorized,
|
||||||||
|
10,775 and 10,772 shares issued and outstanding on each date
|
17,076 | 16,995 | ||||||
|
Retained earnings
|
110,073 | 112,450 | ||||||
|
Accumulated other comprehensive income
|
443 | 265 | ||||||
|
Total shareholders’ equity
|
127,592 | 129,710 | ||||||
|
Total liabilities and shareholders’ equity
|
$ | 149,099 | $ | 153,467 | ||||
See accompanying Notes to Consolidated Financial Statements.
HOOKER FURNITURE CORPORATION AND SUBSIDIARIES
|
For The
|
Fifty-Three
|
|||||||||||
|
Fifty-Two Weeks Ended
|
Weeks Ended
|
|||||||||||
|
January 31,
|
February 1,
|
February 3,
|
||||||||||
|
2010
|
2009
|
2008
|
||||||||||
|
Net sales
|
$ | 203,347 | $ | 261,162 | $ | 316,801 | ||||||
|
Cost of sales
|
154,931 | 200,878 | 235,057 | |||||||||
|
Gross profit
|
48,416 | 60,284 | 81,744 | |||||||||
|
Selling and administrative expenses
|
41,956 | 45,980 | 51,738 | |||||||||
|
Restructuring (credits) charges
|
- | (951 | ) | 309 | ||||||||
|
Goodwill and intangible asset impairment charges
|
1,274 | 4,914 | - | |||||||||
|
Operating income
|
5,186 | 10,341 | 29,697 | |||||||||
|
Other (expense) income, net
|
(99 | ) | 323 | 1,472 | ||||||||
|
Income before income taxes
|
5,087 | 10,664 | 31,169 | |||||||||
|
Income taxes
|
2,079 | 3,754 | 11,514 | |||||||||
|
Net income
|
$ | 3,008 | $ | 6,910 | $ | 19,655 | ||||||
|
Earnings per share:
|
||||||||||||
|
Basic and diluted
|
$ | 0.28 | $ | 0.62 | $ | 1.58 | ||||||
|
Weighted average shares outstanding:
|
||||||||||||
|
Basic
|
10,753 | 11,060 | 12,442 | |||||||||
|
Diluted
|
10,760 | 11,066 | 12,446 | |||||||||
|
Cash dividends declared per share
|
$ | 0.40 | $ | 0.40 | $ | 0.40 | ||||||
See accompanying Notes to Consolidated Financial Statements.
HOOKER FURNITURE CORPORATION AND SUBSIDIARIES
(In thousands)
|
For The
|
Fifty-Three
|
|||||||||||
|
Fifty-Two Weeks Ended
|
Weeks Ended
|
|||||||||||
|
January 31,
|
February 1,
|
February 3,
|
||||||||||
|
2010
|
2009
|
2008
|
||||||||||
|
Cash flows from operating activities
|
||||||||||||
|
Cash received from customers
|
$ | 207,819 | $ | 269,483 | $ | 321,189 | ||||||
|
Cash paid to suppliers and employees
|
(168,666 | ) | (258,701 | ) | (265,842 | ) | ||||||
|
Income taxes paid, net
|
(1,401 | ) | (7,219 | ) | (12,717 | ) | ||||||
|
Interest received (paid), net
|
(327 | ) | 167 | 1,195 | ||||||||
|
Net cash provided by operating activites
|
37,425 | 3,730 | 43,825 | |||||||||
|
Cash flows from investing activities
|
||||||||||||
|
Purchase of property, plant, and equipment
|
(1,678 | ) | (2,271 | ) | (1,942 | ) | ||||||
|
Acquisitions, net of cash required
|
- | (181 | ) | (15,826 | ) | |||||||
|
Proceeds received on notes receivable
|
30 | - | - | |||||||||
|
Proceeds from the sale of property and equipment
|
337 | 28 | 3,668 | |||||||||
|
Premiums paid on life insurance policies
|
(1,383 | ) | (1,328 | ) | (1,411 | ) | ||||||
|
Proceeds received on life insurance policies
|
987 | - | 1,244 | |||||||||
|
Net cash used in investing activities
|
(1,707 | ) | (3,752 | ) | (14,267 | ) | ||||||
|
Cash flows from financing activities
|
||||||||||||
|
Purchases and retirement of common stock
|
- | (14,097 | ) | (36,028 | ) | |||||||
|
Proceeds from short-term borrowing
|
4,859 | - | - | |||||||||
|
Payments on short-term debt
|
(4,859 | ) | - | - | ||||||||
|
Cash dividends paid
|
(4,309 | ) | (4,459 | ) | (5,036 | ) | ||||||
|
Payments on long-term debt
|
(5,218 | ) | (2,694 | ) | (2,503 | ) | ||||||
|
Net cash used in financing activities
|
(9,527 | ) | (21,250 | ) | (43,567 | ) | ||||||
|
Net increase (decrease) in cash and cash equivalents
|
26,191 | (21,272 | ) | (14,009 | ) | |||||||
|
Cash and cash equivalents at the beginning of the year
|
11,804 | 33,076 | 47,085 | |||||||||
|
Cash and cash equivalents at the end of the year
|
$ | 37,995 | $ | 11,804 | $ | 33,076 | ||||||
|
Reconciliation of net income to net cash provided by
|
||||||||||||
|
operating activities:
|
||||||||||||
|
Net income
|
$ | 3,008 | $ | 6,910 | $ | 19,655 | ||||||
|
Depreciation and amortization
|
3,125 | 2,912 | 3,352 | |||||||||
|
Non-cash restricted stock awards
|
81 | 74 | 47 | |||||||||
|
Asset impairment charges
|
1,274 | 4,914 | - | |||||||||
|
Restructuring charge / (credit)
|
- | (951 | ) | 309 | ||||||||
|
Loss (gain) on disposal of property
|
133 | 154 | (100 | ) | ||||||||
|
Donation of showroom facilities
|
- | - | 1,082 | |||||||||
|
Provision for doubtful accounts
|
1,361 | 2,245 | 1,313 | |||||||||
|
Loss (gain) on life insurance policies
|
- | 95 | (788 | ) | ||||||||
|
Deferred income taxes
|
239 | (2,005 | ) | 2,624 | ||||||||
|
Changes in assets and liabilities, net of effect from acquistions:
|
||||||||||||
|
Trade accounts receivable
|
3,007 | 5,767 | 2,972 | |||||||||
|
Inventories
|
24,072 | (9,629 | ) | 18,757 | ||||||||
|
Prepaid expenses and other current assets
|
(1,054 | ) | (730 | ) | (186 | ) | ||||||
|
Trade accounts payable
|
2,033 | (4,633 | ) | 2,063 | ||||||||
|
Accrued salaries, wages, and benefits
|
(34 | ) | (669 | ) | (3,256 | ) | ||||||
|
Accrued income taxes
|
253 | (1,274 | ) | (3,826 | ) | |||||||
|
Other accrued expenses
|
(579 | ) | 79 | (1,198 | ) | |||||||
|
Deferred compensation
|
322 | - | - | |||||||||
|
Other long-term liabilities
|
184 | 471 | 1,005 | |||||||||
|
Net cash provided b y operating activities
|
$ | 37,425 | $ | 3,730 | $ | 43,825 | ||||||
See accompanying Notes to Consolidated Financial Statements
HOOKER FURNITURE CORPORATION AND SUBSIDIARIES
(In thousands, except per share data)
|
For the Fifty-Three Week Period Ended February 3, 2008; The Fifty-Two Week Period Ended February 1, 2009; and The
|
||||||||||||||||||||
|
Fifty-Two Week Period Ended January 31, 2010
|
||||||||||||||||||||
|
Accumulated
|
||||||||||||||||||||
|
Other
|
Total
|
|||||||||||||||||||
|
Common Stock
|
Retained
|
Comprehensive
|
Shareholders'
|
|||||||||||||||||
|
Shares
|
Amount
|
Earnings
|
Income (Loss)
|
Equity
|
||||||||||||||||
|
Balance at January 28, 2007
|
13,269 | 20,840 | 141,539 | (69 | ) | 162,310 | ||||||||||||||
|
Net income
|
- | - | 19,655 | - | 19,655 | |||||||||||||||
|
Unrealized loss on interest rate swap
|
- | - | - | (122 | ) | (122 | ) | |||||||||||||
|
Total comprehensive income
|
19,533 | |||||||||||||||||||
|
Cash dividends ($0.40 per share)
|
- | - | (5,036 | ) | - | (5,036 | ) | |||||||||||||
|
Restricted stock grants, net of forfeitures
|
4 | - | - | - | - | |||||||||||||||
|
Restricted stock compensation cost
|
- | 47 | - | - | 47 | |||||||||||||||
|
Purchase and retirement of common stock
|
(1,712 | ) | (2,705 | ) | (33,323 | ) | - | (36,028 | ) | |||||||||||
|
Balance at February 3, 2008
|
11,561 | 18,182 | 122,835 | (191 | ) | 140,826 | ||||||||||||||
|
Net income
|
- | - | 6,910 | - | 6,910 | |||||||||||||||
|
Unrealized gain on interest rate swap
|
- | - | - | 49 | 49 | |||||||||||||||
|
Unrealized gain on deferred compensation
|
- | - | - | 407 | 407 | |||||||||||||||
|
Total comprehensive income
|
7,366 | |||||||||||||||||||
|
Cash dividends ($0.40 per share)
|
- | - | (4,459 | ) | - | (4,459 | ) | |||||||||||||
|
Restricted stock grants, net of forfeitures
|
10 | - | - | - | - | |||||||||||||||
|
Restricted stock compensation cost
|
- | 74 | - | - | 74 | |||||||||||||||
|
Purchase and retirement of common stock
|
(799 | ) | (1,261 | ) | (12,836 | ) | - | (14,097 | ) | |||||||||||
|
Balance at February 1, 2009
|
10,772 | 16,995 | 112,450 | 265 | 129,710 | |||||||||||||||
|
Net income
|
- | - | 3,008 | - | 3,008 | |||||||||||||||
|
Reclassifications due to ineffective swap
|
142 | 142 | ||||||||||||||||||
|
Unrealized gain on deferred compensation
|
- | - | - | 36 | 36 | |||||||||||||||
|
Total comprehensive income
|
3,186 | |||||||||||||||||||
|
Cash dividends paid and accrued ($0.40 per share)
|
- | - | (5,385 | ) | - | (5,385 | ) | |||||||||||||
|
Restricted stock grants, net of forfeitures
|
3 | - | - | - | - | |||||||||||||||
|
Restricted stock compensation cost
|
- | 81 | - | - | 81 | |||||||||||||||
|
Balance at January 31, 2010
|
10,775 | $ | 17,076 | $ | 110,073 | $ | 443 | $ | 127,592 | |||||||||||
See accompanying Notes to Consolidated Financial Statements.
Nature of Business
Hooker Furniture Corporation and subsidiaries (the “Company”, “we,” “us” and “our”) design, import, manufacture and market residential household furniture for sale to wholesale and retail merchandisers located principally in North America.
Consolidation
The consolidated financial statements include the accounts of Hooker Furniture Corporation and its wholly owned subsidiaries. All material intercompany accounts and transactions have been eliminated in consolidation.
Cash and Cash Equivalents
We temporarily invest unused cash balances in a high quality, diversified money market fund that provides for daily liquidity and pays dividends monthly. Cash equivalents are stated at cost plus accrued interest, which approximates the market value.
Trade Accounts Receivable
Substantially all of our trade accounts receivable are due from retailers and dealers that sell residential home furnishings, which consist of a large number of entities with a broad geographical dispersion. We continually perform credit evaluations of our customers and generally do not require collateral. Our upholstered furniture subsidiaries factor substantially all of their receivables on a non-recourse basis. Accounts receivable are reported net of allowance for doubtful accounts.
Fair Value of Financial Instruments
The carrying value for each of our financial instruments (consisting of cash and cash equivalents, trade accounts receivable and payable, and accrued liabilities) approximates fair value because of the short-term nature of those instruments. The fair value of our term loan is estimated based on the quoted market rates for similar debt with a similar remaining maturity. The fair value of our interest rate swap agreement is based on market quotes from a major financial institution, taking into consideration the most recent market activity.
Inventories
All inventories are stated at the lower of cost, using the last-in, first-out (LIFO) method, or the market value.
Property, Plant and Equipment
Property, plant and equipment is stated at cost, less allowances for depreciation. Provision for depreciation has been computed (generally by the declining balance method) at annual rates that will amortize the cost of the depreciable assets over their estimated useful lives.
Impairment of Long-Lived Assets
Long-lived assets, such as property, plant and equipment, are evaluated for impairment when events or changes in circumstances indicate that the carrying amount of the assets may not be recoverable through the estimated undiscounted future cash flows from the use of those assets. When any such impairment exists, the related assets are written down to fair value. Long-lived assets to be disposed of by sale are measured at the lower of their carrying amount or fair value less cost to sell, are no longer depreciated, and are reported separately as “assets held for sale” in the consolidated balance sheets.
Intangible Assets
We own certain indefinite-lived intangible assets related to Bradington-Young, Sam Moore and Opus Designs by Hooker. We may acquire additional amortizable assets and/or indefinite lived intangible assets in future asset purchases or business combinations. The principal indefinite-lived intangible assets are trademarks and trade names which are not amortized but are tested for impairment annually or more frequently if events or circumstances indicate that the asset might be impaired. The fair value of the indefinite-lived intangible assets is determined based on the estimated earnings and cash flow capacity of those assets. The impairment test consists of a comparison of the fair value of the indefinite-lived intangible assets with their carrying amount. If the carrying amount of the indefinite-lived intangible assets exceeds their fair value, an impairment loss is recognized in an amount equal to that excess.
Trade names are tested for impairment annually as of the first day of our fiscal fourth quarter or more frequently if events or changes in circumstances indicate that the asset might be impaired. Circumstances that could indicate a potential impairment include:
|
·
|
a significant adverse change in the economic or business climate either within the furniture industry or the national or global economy;
|
|
·
|
significant changes in demand for our products;
|
|
·
|
loss of key personnel; or
|
|
·
|
the likelihood that a reporting unit or significant portion of a reporting unit will be sold or otherwise disposed of.
|
The assumptions used to determine the fair value of our intangible assets are highly subjective and judgmental and include long term growth rates, sales volumes, projected revenues, assumed royalty rates and factors used to develop an applied discount rate. If the assumptions that we use in these calculations differ from actual results, we may realize additional impairment on our intangible assets which may have a material, adverse affect on our consolidated statements of operations and consolidated balance sheets.
Cash Surrender Value of Life Insurance Policies
We own life insurance policies on certain executives and other key current and former employees. Proceeds from the policies are used to fund certain employee benefits and for other general corporate purposes. We account for life insurance as a component of employee benefits cost. Consequently the cost of the coverage and any resulting gains or losses related to those insurance policies are recorded as a decrease or increase to operating income.
Derivative Instruments and Hedging Activities
We may use interest rate swap agreements to manage variable interest rate exposure on our long-term debt. Our objective for holding these derivatives is to decrease the volatility of future cash flows associated with interest payments on our variable rate debt. We do not issue derivative instruments for trading purposes. Typically, we account for our interest rate swap agreements as cash flow hedges. For derivatives designated as cash flow hedges, the effective portion of changes in the fair value of the derivative is initially reported in “accumulated other comprehensive income or loss” on the consolidated balance sheets and subsequently reclassified to interest expense when the hedged exposure affects income (i.e. as interest expense accrues on the related outstanding debt). Differences between the amounts paid and amounts received under the swap agreements are recognized in interest expense.
In some cases, such as upon the early repayment of a debt instrument, we may continue to hold an interest rate swap for a period of time after the related principal has been paid rendering the hedge ineffective. In that case, changes in the ineffective portion of the fair value of an interest rate swap are accounted for through interest expense.
Revenue Recognition
Sales revenue is recognized when title and the risk of loss pass to the customer, which occurs at the time of shipment. Sales are recorded net of allowances for trade promotions, estimated product returns, rebate advertising programs and other discounts.
Advertising
We offer advertising programs to qualified dealers under which we may provide signage, catalogs and other marketing support to our customers and may reimburse advertising and other costs incurred by our customers in connection with promoting our products. The cost of these programs does not exceed the fair value of the benefit received. We charge the cost of point-of-purchase materials (including signage and catalogs) to selling and administrative expense as incurred. Advertising costs charged to selling and administrative expense for fiscal years 2010, 2009 and 2008 were $2.9 million, $3.1 million, and $3.0 million, respectively. The costs for other advertising allowance programs is charged against net sales.
Income Taxes
Income taxes are accounted for under the asset and liability method. Deferred income taxes reflect the expected future tax consequences of differences between the book and income tax bases of assets and liabilities using enacted tax rates in effect in the years in which those differences are expected to reverse.
We recognize positions taken or expected to be taken in our tax returns in the financial statements when it is more likely than not that the position would be sustained upon examination by tax authorities. A recognized tax position is then measured at the largest amount of benefit that is more likely than not of being realized upon ultimate settlement. We classify interest and penalties related to uncertain tax positions as income tax expense.
Earnings Per Share
We use the two class method to compute basic earnings per share. Under this method we allocate earnings to common stock and participating securities according to their participation rights in dividends declared and undistributed earnings and divide the income available to each class by the weighted average number of common shares for the period in each class. Unvested restricted stock grants to our non-employee directors are considered participating securities because the shares have the right to receive non-forfeitable dividends. Because the participating shares have no obligation to share in net losses, we do not allocate losses to our common stock in this calculation.
Diluted earnings per share reflect the potential dilutive effect of securities that could share in our earnings. Restricted shares awarded to non-employee members of the board of directors that have not yet vested are considered when computing diluted earnings per share. We use the treasury stock method to determine the dilutive effect of unvested restricted stock. Shares of unvested stock under a stock-based compensation arrangement are considered options for purposes of computing diluted EPS and are considered outstanding as of the grant date for purposes of computing diluted EPS even though their exercise may be contingent upon vesting. Those stock-based awards are included in the diluted EPS computation even if the non-employee director may be required to forfeit the stock at some future date. Unvested restricted shares are not included in outstanding common stock in computing basic earnings per share.
Use of Estimates
The preparation of financial statements in conformity with U.S. generally accepted accounting principles requires us to make estimates and assumptions that affect the reported amounts of assets and liabilities, as well as disclosures regarding contingent assets and liabilities at the date of the financial statements; and the reported amounts of revenue and expenses during the reported periods. Significant items subject to such estimates and assumptions include the useful lives of fixed assets; allowance for doubtful accounts; the valuation of derivatives; deferred tax assets; fixed assets, our Supplemental Executive Retirement Plan and stock-based compensation. These estimates and assumptions are based on our best judgments. We evaluate these estimates and assumptions on an ongoing basis using historical experience and other factors, including the current economic environment, which we believe to be reasonable under the circumstances. We adjust our estimates and assumptions as facts and circumstances dictate. Illiquid credit markets and volatile equity markets have combined to increase the uncertainty inherent in such estimates and assumptions. Actual results could differ from our estimates.
NOTE 2 – FISCAL YEAR
Our fiscal years end on the Sunday closest to January 31. In some years, generally once every six years, the fourth quarter will be fourteen weeks long and the fiscal year will consist of fifty-three weeks (for example, the fiscal year that ended February 3, 2008 was fifty-three weeks.) Our quarterly periods are based on thirteen-week “reporting periods,” which will end on a Sunday. As a result, each quarterly period generally will be thirteen weeks, or 91 days, long.
In the notes to the consolidated financial statements, references to the:
|
§
|
2010 fiscal year and comparable terminology mean the fiscal year that began February 2, 2009 and ended January 31, 2010.
|
|
§
|
2009 fiscal year and comparable terminology mean the fiscal year that began February 4, 2008 and ended February 1, 2009; and
|
|
§
|
2008 fiscal year and comparable terminology mean the fiscal year that began January 29, 2007 and ended February 3, 2008.
|
NOTE 3 – ALLOWANCE FOR DOUBTFUL ACCOUNTS
The activity in the allowance for doubtful accounts was:
| Fifty-Three | ||||||||||||
| Fifty-Two Weeks Ended |
Weeks Ended
|
|||||||||||
|
January 31,
|
February 1,
|
February 3,
|
||||||||||
|
2010
|
2009
|
2008
|
||||||||||
|
Balance at beginning of year
|
$ | 2,207 | $ | 1,750 | $ | 1,436 | ||||||
|
Non-cash charges to cost and expenses
|
1,361 | 2,070 | 1,313 | |||||||||
|
Allowance for doubtful accounts acquired in acquisitions
|
- | - | 257 | |||||||||
|
Less uncollectible receivables written off, net of recoveries
|
(1,630 | ) | (1,613 | ) | (1,256 | ) | ||||||
|
Balance at end of year
|
$ | 1,938 | $ | 2,207 | $ | 1,750 | ||||||
NOTE 4 – ACCOUNTS RECEIVABLE AND SHORT TERM BORROWING
|
January 31,
|
February 1,
|
|||||||
|
2010
|
2009
|
|||||||
|
Trade accounts receivable
|
$ | 19,400 | $ | 24,408 | ||||
|
Receivable from factor
|
8,432 | 8,060 | ||||||
|
Allowance for doubtful accounts
|
(1,938 | ) | (2,207 | ) | ||||
|
Accounts receivable
|
$ | 25,894 | $ | 30,261 | ||||
“Receivable from factor” represents amounts due with respect to factored accounts receivable. We factor substantially all of our upholstery division accounts receivable without recourse to us.
Under the prior factoring agreement in effect until July 15, 2009, the factor owned the accounts receivable assigned to it for collection. During the second quarter of fiscal 2010, we became aware that the factor was facing liquidity concerns. In response to the risk of delayed payment of collected accounts receivable from the factor, we borrowed $4.5 million from the factor against uncollected receivables, the maximum amount available under the prior factoring arrangement. The underlying receivables were collected in the ordinary course of business, and the debt was retired with the proceeds from the collected accounts receivable. During the third quarter of 2010, we borrowed an additional $327,000 from the factor. During our fiscal 2010 fourth quarter, all amounts related to this loan were repaid. Under our current factoring agreement, entered July 15, 2009, we retain ownership of the accounts receivable that are collected by the factor, thereby substantially reducing liquidity risks associated with the former factoring arrangement.
Under both factoring agreements, invoices for upholstery products are generated and transmitted to our customer with a copy to the factor on a daily basis, as products are shipped to our upholstery customers. The factor collects the amounts due and remits collected funds to us semi-weekly. Under the prior agreement, the factor took ownership of the accounts receivable when it received our invoices. Under the new agreement, we retain ownership of the accounts receivable until the invoices are 90 days past due. At that time, the factor pays us the net invoice amount, less factoring fees and takes ownership of the accounts receivable. The factor is then entitled to collect the invoices on its own behalf and retain any subsequent remittances. Under both agreements, the invoiced amounts are reported as accounts receivable on our consolidated balance sheets when the merchandise is delivered to our customer until payment is received from the factor.
A limited number of accounts receivable are factored with recourse to us. The amounts of these receivables at January 31, 2010 and February 1, 2009 were $205,000 and $234,000, respectively. If the factor is unable to collect the amounts due, invoices are returned to us for collection. We include an estimate for these receivables in our calculation of our reserves for bad debt.
NOTE 5 – INVENTORIES
|
January 31,
|
February 1,
|
|||||||
|
2010
|
2009
|
|||||||
|
Finished Furniture
|
$ | 40,205 | $ | 64,865 | ||||
|
Furniture in process
|
798 | 900 | ||||||
|
Materials and Supplies
|
7,258 | 8,207 | ||||||
|
Inventories at FIFO
|
48,261 | 73,972 | ||||||
|
Reduction to LIFO basis
|
12,085 | 13,724 | ||||||
|
Inventories
|
$ | 36,176 | $ | 60,248 | ||||
If the first-in, first-out (FIFO) method had been used in valuing all inventories, net income would have been $2.2 million in fiscal 2010, $8.1 million in fiscal 2009, and $19.5 million in fiscal 2008.
As of January 31, 2010, we held $5.9 million in inventory (4.0% of total assets) outside of the United States, in China.
NOTE 6 – PROPERTY, PLANT AND EQUIPMENT
|
Depreciable Lives
|
January 31,
|
February 1,
|
||||||||||
|
(In years)
|
2010
|
2009
|
||||||||||
|
Buildings and land improvements
|
15 - 30 | $ | 23,708 | $ | 23,676 | |||||||
|
Machinery and equipment
|
10 | 3,507 | 3,665 | |||||||||
|
Furniture and fixtures
|
3 - 8 | 27,494 | 26,656 | |||||||||
|
Other
|
5 | 4,043 | 3,886 | |||||||||
|
Total depreciable property at cost
|
58,752 | 57,883 | ||||||||||
|
Less accumulated depreciation
|
37,603 | 35,695 | ||||||||||
|
Total depreciable property, net
|
21,149 | 22,188 | ||||||||||
|
Land
|
1,357 | 1,357 | ||||||||||
|
Construction in progress
|
241 | 1,051 | ||||||||||
|
Property, plant and equipment, net
|
$ | 22,747 | $ | 24,596 | ||||||||
Capitalized Software Costs
Certain costs incurred in connection with developing or obtaining computer software for internal use are capitalized. These costs are amortized over five years or less, and generally over five years. Capitalized software is reported as a component of furniture and fixtures on our balance sheet. The activity in capitalized software costs was:
| Fifty-Three | ||||||||||||
| Fifty-Two Weeks Ended |
Weeks Ended
|
|||||||||||
|
January 31,
|
February 1,
|
February 3,
|
||||||||||
|
2010
|
2009
|
2008
|
||||||||||
|
Balance beginning of year
|
$ | 2,863 | $ | 3,293 | $ | 1,847 | ||||||
|
Software acquired in the acquisition of Sam Moore
|
- | - | 458 | |||||||||
|
Purchases
|
868 | 635 | 2,176 | |||||||||
|
Amortization expense
|
(1,230 | ) | (1,065 | ) | (1,142 | ) | ||||||
|
Disposals
|
(8 | ) | - | (46 | ) | |||||||
|
Balance end of year
|
$ | 2,493 | $ | 2,863 | $ | 3,293 | ||||||
NOTE 7 – INTANGIBLE ASSETS
|
Useful Lives
|
January 31,
|
February 1,
|
||||||||||
|
(In years)
|
2010
|
2009
|
||||||||||
|
Non-amortizable Intangible Assets
|
||||||||||||
|
Trademarks and trade names - Bradington-Young
|
$ | 2,676 | $ | 3,289 | ||||||||
|
Trademarks and trade names - Sam Moore
|
396 | 396 | ||||||||||
|
Trademarks and trade names - Opus Designs
|
396 | 1,057 | ||||||||||
|
Total trademarks and trade names
|
3,468 | 4,742 | ||||||||||
|
Amortizable Intangible Assets
|
||||||||||||
|
Non-compete agreements
|
4 | - | 700 | |||||||||
|
Furniture designs
|
3 | - | 100 | |||||||||
|
Total amortizable intangible assets
|
- | 800 | ||||||||||
|
Less accumulated amortization
|
- | 737 | ||||||||||
|
Net carrying value
|
- | 63 | ||||||||||
|
Intangible assets
|
$ | 3,468 | $ | 4,805 | ||||||||
We recorded goodwill and certain intangible assets related to the acquisitions of Bradington-Young, Sam Moore and Opus Designs. The goodwill, trademarks and trade names have indefinite useful lives and consequently are not subject to amortization for financial reporting purposes but are tested for impairment annually or more frequently if events or circumstances indicate that the asset might be impaired. See “Note 1 – Summary of Significant Accounting Policies: Intangible Assets.” For tax reporting purposes the goodwill and intangible assets are being amortized over 15 years on a straight line basis.
Goodwill results from business acquisitions and represents the excess of acquisition costs over the fair value of the net assets acquired. Our goodwill was initially recorded in connection with the acquisitions of Bradington-Young and Opus Designs, which occurred when the US economy was much stronger, estimates of revenue, margin and cash flow growth were much greater, and our market capitalization was at higher levels. Our fiscal year 2009 goodwill impairment analysis lead us to conclude that there would be no remaining implied fair value attributable to our goodwill and accordingly, we recorded a non−cash impairment charge of $3.8 million for the year ended February 1, 2009.This impairment charge is included in the “goodwill and intangible asset impairment charges” line of our Consolidated Statements of Operations.
Trade names and trademarks are related to the acquisitions of Bradington-Young, Sam Moore and Opus Designs. The circumstances which impact the valuation of goodwill could also be an indicator of impairment of trade names or trademarks, as could changes in legal circumstances, marketing plans or customer demand. In conjunction with our evaluation of goodwill and the cash flows generated by the reporting units, we evaluated the carrying value of trade names and trademarks using the relief from royalty method, which values the trademark by estimating the savings achieved by ownership of the trade name when compared to licensing the name from an independent owner. Our trade name analyses led us to conclude that the Bradington-Young and Opus Designs trade names were impaired. Consequently, we recorded non-cash impairment charges of $613,000 and $661,000, respectively, for our Bradington-Young and Opus Designs trade names during fiscal 2010 and $1.1 million for our Bradington-Young trade name during our fiscal 2009 year ended February 1, 2009.
These impairment charges are included in the “goodwill and intangible asset impairment charges” line of our Consolidated Statements of Operations.
NOTE 8 – SUPPLEMENTAL SCHEDULE OF NON-CASH INVESTING AND FINANCING ACTIVITIES
| Fifty-Three | ||||||||||||
|
Fifty-Two Weeks Ended
|
Weeks Ended
|
|||||||||||
|
January 31,
|
February 1,
|
February 3,
|
||||||||||
|
2010
|
2009
|
2008
|
||||||||||
|
Restricted stock grants, net of forfeitures
|
$ | 81 | $ | 74 | $ | 47 | ||||||
|
Donation of showroom facilities
|
- | - | 1,082 | |||||||||
|
Liabilities assumed in connection with acquisition
|
||||||||||||
|
of Sam Moore Furniture
|
- | - | 1,487 | |||||||||
NOTE 9 – LONG-TERM DEBT AND INTEREST RATE SWAPS
|
January 31,
|
February 1,
|
|||||||
|
2010
|
2009
|
|||||||
|
Term loan
|
$ | - | $ | 5,218 | ||||
|
Less current maturities
|
- | 2,899 | ||||||
|
Long term debt, less current maturities
|
$ | - | $ | 2,319 | ||||
On August 11, 2009, we amended our credit agreement. The amendment included the following terms:
|
·
|
upon execution of the amendment, we were required to repay in full the remaining balance of the term loans outstanding under the agreement ($3.8 million, plus accrued interest);
|
|
·
|
effective as of July 30, 2009, the funded debt to EBITDA ratio under the credit agreement was changed from 1.25:1.0 to 2.0:1.0; and
|
|
·
|
effective as of July 30, 2009, the debt service coverage ratio under the credit agreement was been eliminated.
|
The other terms of the credit agreement, including our $15.0 million revolving line of credit, were unchanged.
As of January 31, 2010, we had an aggregate $13.1 million available under our revolving credit facility to fund working capital needs. Standby letters of credit in the aggregate amount of $1.9 million, used to collateralize certain insurance arrangements and for imported product purchases, were outstanding under that facility as of January 31, 2010. There were no additional borrowings outstanding under the revolving credit line on January 31, 2010. Any principal outstanding under the credit line is due March 1, 2011.
We are party to an interest rate swap agreement that provided, in effect, for a fixed interest rate of interest through 2010 on our former term loans. Prior to our fiscal 2010 third quarter, we accounted for our interest rate swap agreement as a cash flow hedge and recognized the fair value of the agreement on the balance sheet in shareholders’ equity under the caption “accumulated other comprehensive income.” The related gains or losses on this instrument were recorded through comprehensive income and, accordingly, were included in accumulated other comprehensive income on the balance sheet until recognized in net income.
In 2003, we terminated a similar swap agreement, which, prior to its termination, provided, in effect, a fixed interest rate of approximately 7.4% on our former term loans. We made a $3.0 million payment to terminate that former swap agreement, which through the periods ended August 2, 2009 was being amortized over the remaining repayment period of the loans. Upon the repayment of our terms loans, we wrote-off the remaining $61,000 unamortized balance of this swap termination payment during the fiscal 2010 third quarter.
At January 31, 2010 we were party to one derivative financial instrument, as described in the following table:
| Agreement | Notional Amount | Interest Rate | Expiration Date | Fair Value | |||||||||
|
Interest rate swap
|
$ | 2,318 | 3.09 | % | September 1, 2010 | $ | (33 | ) | |||||
Fair Value Disclosure of Derivative Instruments
The following table provides quantitative fair value disclosures regarding our interest rate swap at January 31, 2010.
|
Carrying Value and
|
Fair Value as of January 31, 2010 | ||||||||
|
Balance Sheet
Location
|
Quoted Prices in
Active Markets |
Significant
Other |
Significant
|
||||||
|
as of January 31, 2010
|
for Identical
|
Observable
|
Unobservable
|
||||||
|
Other Accrued
|
Instruments
|
Inputs
|
Inputs
|
||||||
|
Expenses
|
(Level 1)
|
(Level 2)
|
(Level 3)
|
||||||
|
Interest rate swap
|
$ |
33
|
$ |
33
|
|||||
|
Fair Value as of February 1, 2009
|
|||||||||||
|
Carrying Value and
|
Quoted Prices in
|
Significant
|
|||||||||
|
Balance Sheet Location
|
Active Markets
|
Other
|
Significant
|
||||||||
|
as of February 1, 2009
|
for Identical
|
Observable
|
Unobservable
|
||||||||
|
Other Accrued
|
Other Long
|
Instruments
|
Inputs
|
Inputs
|
|||||||
|
Expenses
|
Term Liabilities
|
(Level 1)
|
(Level 2)
|
(Level 3)
|
|||||||
|
Interest rate swap
|
$ |
80
|
$ |
29
|
$ |
109
|
|||||
|
Fifty-two Weeks Ended
|
Fifty-three Weeks
|
|||||||||||
|
January 31,
|
February 1,
|
February 3,
|
||||||||||
|
2010
|
2009
|
2008
|
||||||||||
|
Interest rate swap:
|
||||||||||||
|
Loss recognized in other comprehensive income
|
$ | - | $ | (78 | ) | $ | (159 | ) | ||||
|
Loss reclassified from accumulated other comprehensive
|
||||||||||||
|
income into interest expense, net
|
142 | 128 | 36 | |||||||||
|
Loss recognized in net income
|
- | - | - | |||||||||
|
Loss recognized in net income on change
|
||||||||||||
|
in fair value of derivative financial instrument
|
5 | - | - | |||||||||
NOTE 10 – OTHER COMPREHENSIVE INCOME (LOSS)
| Fifty-Three | ||||||||||||
|
Fifty-Two Weeks Ended
|
Weeks Ended
|
|||||||||||
|
January 31,
|
February 1,
|
February 3,
|
||||||||||
|
2010
|
2009
|
2008
|
||||||||||
|
Net income
|
$ | 3,008 | $ | 6,910 | $ | 19,655 | ||||||
|
(Loss) on interest rate swaps
|
(26 | ) | (126 | ) | (256 | ) | ||||||
|
Less amount of swaps' fair value reclassified
|
||||||||||||
|
to interest expense
|
118 | 205 | 58 | |||||||||
|
Reclassification to income of cumulative
|
||||||||||||
|
balance related to ineffective swap
|
76 | |||||||||||
|
Reclassification to income of unamortized
|
||||||||||||
|
balance of swap termination payment
|
61 | |||||||||||
|
Unrealized gain (loss) on interest rate swaps
|
229 | 79 | (198 | ) | ||||||||
|
Unrealized accumulated actuarial gain on Supplemental
|
||||||||||||
|
Retirement Income Plan (deferred compensation)
|
58 | 653 | - | |||||||||
|
Other comprehensive income (loss) before tax
|
287 | 732 | (198 | ) | ||||||||
|
Income tax (benefit)
|
109 | 276 | (76 | ) | ||||||||
|
Other comprehensive income (loss), net of tax
|
178 | 456 | (122 | ) | ||||||||
|
Comprehensive income
|
$ | 3,186 | $ | 7,366 | $ | 19,533 | ||||||
NOTE 11 – EMPLOYEE BENEFIT PLANS
Employee Savings Plans
We sponsor a tax-qualified 401(k) plan covering substantially all employees. This plan assists employees in meeting their savings and retirement planning goals through employee salary deferrals and discretionary matching contributions made by the company. Company contributions to the plan amounted to $593,000 in fiscal 2010, $617,000 in fiscal 2009 and $574,000 in fiscal 2008.
Executive Benefits
Through fiscal 2008 we provided salary continuation and supplemental executive retirement benefits to certain management employees, which consisted of individual contracts with participants to pay amounts as specified in each agreement upon retirement, disability or death. The supplemental executive retirement arrangements also provided for benefit payments to participants upon a change in control of the Company as defined in the agreements. These agreements were unfunded and all benefits were payable solely from the general assets of the Company. We accounted for our obligation to each participant individually on the accrual basis in accordance with the terms of the underlying agreements.
Effective for fiscal 2009, we replaced these agreements with a new supplemental retirement income plan (“SRIP”). The SRIP provides monthly payments to participants or their designated beneficiaries based on the participant’s “final average monthly earnings” and “specified percentage” participation level as defined in the plan, subject to a vesting schedule that may vary for each participant. The benefit is payable for a 15-year period following the participant’s termination of employment due to retirement, disability or death. In addition, the monthly retirement benefit for each executive, regardless of age, becomes fully vested and the present value of that benefit is paid to each participant in a lump sum upon a change in control of the Company as defined in the plan. The SRIP is unfunded and all benefits are payable solely from the general assets of the Company.
Summarized plan information as of each fiscal year-end (the measurement date) is as follows:
| Fifty-Two Weeks Ended | ||||||||
|
January 31,
|
February 1,
|
|||||||
|
2010
|
2009
|
|||||||
|
Change in benefit obligation:
|
||||||||
|
Beginning projected benefit obligation
|
$ | 5,780 | 5,601 | |||||
|
Service cost
|
632 | 750 | ||||||
|
Interest cost
|
355 | 350 | ||||||
|
Benefits paid
|
(187 | ) | (267 | ) | ||||
|
Actuarial loss (gain)
|
(276 | ) | (654 | ) | ||||
|
Ending projected benefit obligation (funded status)
|
$ | 6,304 | $ | 5,780 | ||||
|
Accumulated benefit obligation
|
$ | 5,773 | $ | 5,421 | ||||
|
Amount recognized in the consolidated balance sheet:
|
||||||||
|
Current liabilities
|
$ | 436 | $ | 393 | ||||
|
Non-current liabilities
|
5,868 | 5,387 | ||||||
|
Total
|
$ | 6,304 | $ | 5,780 | ||||
|
Other changes recognized in accumulated other comprehensive income
|
||||||||
|
Net (gain) arising during period
|
(218 | ) | (653 | ) | ||||
|
Net periodic benefit cost
|
987 | 1,100 | ||||||
|
Total recognized in net periodic benefit cost and
|
||||||||
|
accumulated other comprehensive income
|
$ | 769 | $ | 447 | ||||
|
Fifty-Two Weeks Ended
|
||||||||
|
January 31,
|
February 1,
|
|||||||
| 2010 | 2009 | |||||||
|
Net periodic benefit cost
|
||||||||
|
Service cost
|
$ | 632 | $ | 750 | ||||
|
Interest cost
|
355 | 350 | ||||||
|
Net periodic benefit cost
|
$ | 987 | $ | 1,100 | ||||
|
Assumptions used to determine net periodic benefit cost:
|
||||||||
|
Discount rate
|
5.5 | % | 6.25 | % | ||||
|
Increase in future compensation levels
|
4.0 | % | 4.0 | % | ||||
|
Estimated Future Benefit Payments:
|
||||||||
|
Fiscal 2011
|
$ | 436 | ||||||
|
Fiscal 2012
|
460 | |||||||
|
Fiscal 2013
|
539 | |||||||
|
Fiscal 2014
|
741 | |||||||
|
Fiscal 2015
|
716 | |||||||
|
Fiscal 2016 through Fiscal 2020
|
3,786 | |||||||
We also provide a life insurance program for certain executives. The life insurance program provides death benefit protection for these executives during employment. Coverage under the program automatically terminates when the executive attains age 65 or terminates employment with Hooker Furniture Corporation for any reason, other than death, whichever occurs first. The life insurance policies funding this program are owned by the Company with a specified portion of the death benefits payable under those policies endorsed to the insured executives’ designated beneficiaries.
Performance Grants
On April 30, 2008, the Compensation Committee of our board of directors awarded two performance grants to certain senior executives under the 2005 Stock Incentive Plan. Payments under each fixed dollar grant will be based on our cumulative earnings per share (“EPS”) and average annual return on equity (“ROE”) for the grant’s designated performance and service period. The respective performance periods for the two grants are the fiscal two-year period ended January 31, 2010 and the fiscal three-year period ending January 30, 2011. The payout targets for the fiscal two-year period ended January 31, 2010 were not met. Consequently, no payment will be made for this performance period. Payments, if any, for performance grants for the three-year period ending January 30, 2011, will be paid in cash, shares of our common stock or a combination of both, at the discretion of the Compensation Committee.
These performance grants are classified as liabilities since the (i) settlement amount for each grant is not known until after the applicable performance period is completed and (ii) settlement of the grants may be made in common stock, cash or a combination of both. The estimated cost of each grant is recorded as compensation expense over the respective performance periods when it becomes probable that the EPS and ROE performance targets will be achieved. The expected cost of the grants is revalued each reporting period. As assumptions change regarding the expected achievement of target performance levels, a cumulative adjustment is recorded and future compensation expense will increase or decrease based on the currently projected performance levels. If we determine that it is not probable that the minimum EPS and ROE performance thresholds for the grants will be met, no further compensation cost will be recognized and any previously recognized compensation cost will be reversed. A maximum of $1.1 million could be paid under the remaining grant.
As of January 31, 2010, no compensation expense has been recorded for the remaining performance grant for the fiscal three-year period ending January 30, 2011.
NOTE 12 – SHARE-BASED COMPENSATION
The Hooker Furniture Corporation 2005 Stock Incentive Plan (“Stock Plan”) permits incentive awards of restricted stock, restricted stock units, stock appreciation rights and performance grants to key employees and non-employee directors. A maximum of 750,000 shares of the Company’s common stock was approved for issuance under the Stock Plan. We expect to issue restricted stock or other forms of stock-based compensation awards to eligible directors and employees under the plan. We have issued restricted stock awards to each non-employee member of the board of directors each January since 2006. These shares will vest if the director remains on the board through a 36-month service period or may vest earlier in accordance with terms specified in the Stock Plan. During fiscal 2009, the remaining 3,920 of these shares vested. The grant-date fair value of stock awards issued during the fiscal 2010 fourth quarter was $12.51 per share, and $8.12 per share issued during the fiscal 2009 fourth quarter, and $19.61 per share for stock awards issued during the fiscal 2008 fourth quarter.
We account for these awards as “non-vested equity shares.” The awards outstanding as of January 31, 2010 had an aggregate grant-date fair value of $205,000, after taking vested and forfeited shares into account. As of January 31, 2010, we have recognized non-cash compensation expense of approximately $92,000 related to these non-vested awards and $136,000 for shares that have vested. The remaining $113,000 of grant-date fair value will be recognized over the remaining months of the vesting periods for these awards.
For each restricted common stock issuance, the following table summarizes the actual number of shares that have been issued/vested/forfeited, the weighted average issue price of those shares on the grant date, the fair value of each grant on the grant date, compensation expense recognized for the non-vested shares of each grant and the remaining fair value of the non-vested shares of each grant as of January 31, 2010:
|
Whole
|
Grant-Date
|
Aggregate
|
Compensation
|
Grant-Date Fair Value
|
||||||||||||||||
|
Number of
|
Fair Value
|
Grant-Date
|
Expense
|
Unrecognized At
|
||||||||||||||||
|
Shares
|
Per Share
|
Fair Value
|
Recognized
|
January 31, 2010
|
||||||||||||||||
|
Awards outstanding balance at January 31, 2007
|
- | - | 136 | |||||||||||||||||
|
Shares Issued on January 15, 2008
|
||||||||||||||||||||
|
Issued
|
4,335 | $ | 19.61 | 85 | 59 | $ | 26 | |||||||||||||
|
Shares Issued on January 15, 2009
|
||||||||||||||||||||
|
Issued
|
10,474 | $ | 8.12 | 85 | 31 | 54 | ||||||||||||||
|
Shares Issued on January 15, 2010
|
||||||||||||||||||||
|
Issued
|
2,831 | $ | 12.51 | 35 | 2 | 33 | ||||||||||||||
|
Awards outstanding at January 31, 2010:
|
17,640 | $ | 205 | $ | 228 | $ | 113 | |||||||||||||
The Stock Plan expired on March 30, 2010, and no further awards may be granted under that plan. Our Board of Directors has approved an amendment and restatement of the Stock Plan and directed that it be submitted to our shareholders for approval at our annual meeting to be held on June 8, 2010. If approved by our shareholders, the amendment and restatement of the Stock Plan would amend certain terms of the plan and would allow us to continue to grant equity incentive awards in accordance with our overall compensation philosophy and objectives.
NOTE 13 – EARNINGS PER SHARE
Since 2006, we have issued restricted stock awards to non-employee members of the board of directors under the Stock Plan each January, and expect to continue to grant these awards to non-employee board members in the future. As of January 31, 2010, February 1, 2009, and February 3, 2008 there were 17,640, 19,684, and 13,130, shares, respectively, of restricted stock outstanding, net of forfeitures and vested shares on each date. Restricted shares awarded that have not yet vested are considered when computing diluted earnings per share.
The following table sets forth the computation of basic and diluted earnings per share:
| Fifty-Three | ||||||||||||
|
Fifty-Two Weeks Ended
|
Weeks Ended
|
|||||||||||
|
January 31,
|
February 1,
|
February 3,
|
||||||||||
|
2010
|
2009
|
2008
|
||||||||||
|
Net income
|
$ | 3,008 | $ | 6,910 | $ | 19,655 | ||||||
|
Less: Dividends on unvested restricted shares
|
||||||||||||
|
Net earnings allocated to unvested restricted stock
|
6 | - | - | |||||||||
|
Earnings available for common shareholders
|
$ | 3,002 | $ | 6,910 | $ | 19,655 | ||||||
|
Weighted average shares outstanding for basic
|
||||||||||||
|
earnings per share
|
10,753 | 11,060 | 12,442 | |||||||||
|
Dilutive effect of restricted stock awards
|
7 | 6 | 4 | |||||||||
|
Weighted average shares outstanding for diluted
|
||||||||||||
|
earnings per share
|
10,760 | 11,066 | 12,446 | |||||||||
|
Basic earnings per share
|
$ | 0.28 | $ | 0.62 | $ | 1.58 | ||||||
|
Diluted earnings per share
|
$ | 0.28 | $ | 0.62 | $ | 1.58 | ||||||
NOTE 14 – INCOME TAXES
The provision for income taxes:
| Fifty-Three | ||||||||||||
|
Fifty-Two Weeks Ended
|
Weeks Ended
|
|||||||||||
|
January 31,
|
February 1,
|
February 3,
|
||||||||||
|
2010
|
2009
|
2008
|
||||||||||
|
Current expense
|
||||||||||||
|
Federal
|
$ | 1,746 | $ | 5,660 | $ | 7,937 | ||||||
|
State
|
224 | 99 | 953 | |||||||||
|
Total current expense
|
1,970 | 5,759 | 8,890 | |||||||||
|
Deferred taxes
|
||||||||||||
|
Federal
|
(110 | ) | (2,237 | ) | 2,609 | |||||||
|
State
|
219 | 232 | 15 | |||||||||
|
Total deferred taxes
|
109 | (2,005 | ) | 2,624 | ||||||||
|
Income tax expense
|
$ | 2,079 | $ | 3,754 | $ | 11,514 | ||||||
The effective income tax rate differed from the federal statutory tax rate as follows:
| Fifty-Three | ||||||||||||
|
Fifty-Two Weeks Ended
|
Weeks Ended
|
|||||||||||
|
January 31,
|
February 1,
|
February 3,
|
||||||||||
|
2010
|
2009
|
2008
|
||||||||||
|
Income taxes at statutory rate
|
35.0 | % | 35.0 | % | 35.0 | % | ||||||
|
Increase (decrease) in tax rate resulting from:
|
||||||||||||
|
State taxes, net of federal benefit
|
2.5 | 1.9 | 2.0 | |||||||||
|
Non-cash charitable contribution of appreciated inventory
|
(2.2 | ) | (1.1 | ) | (0.3 | ) | ||||||
|
Employee stock ownership plan
|
- | - | (0.7 | ) | ||||||||
|
Captive insurance assessments
|
- | - | 0.3 | |||||||||
|
Officer's life insurance
|
(3.8 | ) | (0.9 | ) | (0.9 | ) | ||||||
|
Subpart F Income
|
3.1 | - | - | |||||||||
|
Valuation allowance against state income tax NOL's
|
2.7 | - | - | |||||||||
|
Penalty (FIN 48)
|
2.0 | - | - | |||||||||
|
Other
|
1.6 | 0.3 | 1.5 | |||||||||
|
Effective income tax rate
|
40.9 | % | 35.2 | % | 36.9 | % | ||||||
The tax effects of temporary differences that give rise to significant portions of the deferred tax assets and liabilities were:
|
January 31,
|
February 3,
|
|||||||
|
2010
|
2009
|
|||||||
|
Assets
|
||||||||
|
Deferred compensation
|
$ | 2,377 | $ | 2,179 | ||||
|
Interest rate swaps
|
21 | 79 | ||||||
|
Allowance for bad debts
|
649 | 832 | ||||||
|
State income taxes
|
290 | 510 | ||||||
|
Restructuring
|
14 | 17 | ||||||
|
Property, plant and equipment
|
90 | 298 | ||||||
|
Intangible assets
|
927 | 669 | ||||||
|
Charitable contribution carryforward
|
445 | - | ||||||
|
Other
|
171 | 172 | ||||||
|
Total deferred tax assets
|
4,984 | 4,756 | ||||||
|
Valuation allowance
|
(139 | ) | - | |||||
| 4,845 | 4,756 | |||||||
|
Liabilities
|
||||||||
|
Inventories
|
527 | 70 | ||||||
|
Employee benefits
|
360 | 379 | ||||||
|
Other
|
6 | 7 | ||||||
|
Total deferred tax liabilities
|
893 | 456 | ||||||
|
Net deferred tax asset
|
$ | 3,952 | $ | 4,300 | ||||
As of January 31, 2010, $3.3 million of deferred income taxes was classified as “other long-term assets” and $701,000 was classified as “other current assets” in the consolidated balance sheets. At February 1, 2009, $3.5 million of deferred income taxes was classified as “other long-term assets” and $835,000 was classified as “other current assets” in the consolidated balance sheets. A valuation allowance of $139,000 was established during the fiscal year ending January 31, 2010 against certain state net operating losses being carried forward. We expect to fully utilize the remaining deferred tax assets in future periods when the amounts become deductible.
During the fiscal year ending January 31, 2010, we sold $163,000 of state income tax credits that we were not able to use or carryforward. At January 31, 2010 and February 1, 2009, we had state income tax credit carry forwards of $141,000 and $340,000, respectively. The state loss and credit carryovers begin to expire in 2021 and 2012, respectively.
During fiscal 2010, the term loans associated with our current and former interest rate swaps was repaid, making the swaps ineffective as a cash flow hedge. Therefore the classification of the deferred tax impact of the swaps was removed from “accumulated other comprehensive income” in the fiscal 2010 consolidated balance sheet. The related income taxes amounted to deferred expense of $87,000 in fiscal 2010, deferred expense of $276,000 in fiscal 2009 and deferred benefit of $76,000 in fiscal 2008.
On January 29, 2007, we adopted guidance that clarifies the accounting for uncertainty in income taxes recognized in an enterprise’s financial statements and prescribes a recognition threshold and measurement attribute for the financial statement recognition and measurement of a tax position taken or expected to be taken in a tax return. The guidance also addresses de-recognition, classification, interest and penalties, accounting in interim periods and disclosures.
A reconciliation of beginning and ending unrecognized tax benefits is as follows:
|
Balance at January 29, 2007
|
$ | 845,000 | ||
|
Increases due to positions taken during prior periods
|
45,000 | |||
|
Settlements
|
(890,000 | ) | ||
|
Balance at February 3, 2008
|
$ | - |
We had no material unrecognized tax benefits at January 31, 2010 or February 1, 2009, and there were no material increases or decreases in unrecognized tax benefits during fiscal 2010 or fiscal 2009.
We have elected to classify interest and penalties recognized with respect to unrecognized tax benefits as income tax expense. During fiscal 2010 the Internal Revenue Service assessed a late payment penalty of $100,000. Based on the facts, we feel that our appeal will be accepted, and the penalty will ultimately be waived; but since we have not yet received confirmation of abatement, we have included the penalty as a federal tax expense. Interest and penalties charged to tax expense during 2008 were $24,000. No interest or penalties were accrued as of February 1, 2009 or February 3, 2008.
Tax years beginning December 1, 2005, through February 1, 2009 remain subject to examination by federal and state taxing authorities.
NOTE 15 –SUPPLIER COMMITMENTS
From May 2007 through September 2009, we advanced payments to, and provided financing guarantees for, one of our finished goods suppliers to facilitate the supplier’s purchase of raw materials and other related items in order to help ensure timely delivery of finished goods to us. The balance of the advances and other miscellaneous amounts to this supplier at January 31, 2010 was $124,000. In order for the supplier to obtain additional bank financing, we issued a standby letter of credit on July 14, 2008 as security in the amount of $600,000. In conjunction with the issuance of the letter of credit, we entered into a security agreement with the supplier and the supplier’s shareholders, which provides us with a security interest in certain assets of the supplier and its shareholders. During September 2009, prior to the expiration of the letter of credit, the supplier ceased operations, and defaulted on its bank notes, and its lender drew on our $600,000 letter of credit. Subsequently, we reimbursed our letter of credit provider for the $600,000. Due to the location and nature of the pledged collateral, we may incur substantial costs to obtain and foreclose on it. Consequently, we recorded:
|
·
|
a charge of $300,000 during the third quarter of fiscal 2010 to write down the value of the pledged collateral to our estimate of its net realizable value ($300,000); and
|
|
·
|
charges totaling $124,000 during the our third and fourth quarters of fiscal 2010 to reserve against the potential uncollectability of the outstanding advances and other miscellaneous amounts due from the supplier.
|
The estimated net realizable amount for the pledged collateral of $300,000 as of January 31, 2010 is recorded in our consolidated balance sheets in “other assets.” Based on a recent appraisal, we believe that the net realizable value of the $300,000 is reasonable and approximates the collateral’s fair value. We are currently working with the supplier and its shareholders to have the pledged collateral conveyed to us.
NOTE 16 – RESTRUCTURING CHARGES AND ASSETS HELD FOR SALE
We have incurred significant restructuring and asset impairment charges since 2000 in connection with the closing of our domestic wood furniture manufacturing facilities. These charges included severance and related benefits for terminated employees, asset impairment charges to write down real and personal property to fair market value (as determined based on market prices for similar assets in similar condition) less selling costs, and factory disassembly and other related costs to prepare each facility for sale.
We did not record restructuring and asset impairment charges in fiscal 2010.
Pretax restructuring and asset impairment charges and credits increased operating income by 0.4% of net sales in fiscal 2009 and decreased operating income by 0.1% of net sales in fiscal 2008.
During fiscal 2009 we recorded aggregate restructuring credits of $951,000 ($592,000 after tax, or $0.05 per share) principally for:
|
§
|
previously accrued health care benefits principally for the Martinsville and Roanoke, Va. facilities which are not expected to be paid ($834,000), and
|
|
§
|
previously accrued environmental monitoring costs at the Kernersville, N.C. and Martinsville, Va. facilities, which are not expected to be paid ($117,000).
|
During fiscal 2008 we recorded aggregate restructuring and asset impairment charges of $309,000 ($190,000 after tax, or $0.02 per share) principally for:
|
§
|
additional asset impairment, disassembly and exit costs associated with the March 2007 closing of the Martinsville, Va. domestic wood manufacturing facility ($553,000); net of
|
|
§
|
a restructuring credit of $244,000, principally for previously accrued health care benefits for the Pleasant Garden, N.C., Martinsville, Va. and Roanoke, Va. facilities, which are not expected to be paid.
|
The following table sets forth the significant components of and activity related to the accrued restructuring and asset impairment charges for fiscal years 2008, 2009 and 2010:
|
Severance and
|
Asset
|
Pretax
|
After-tax
|
|||||||||||||||||
|
Related Benefits
|
Impairment
|
Other
|
Amount
|
Amount
|
||||||||||||||||
|
Accrued balance at January 28, 2007
|
2,983 | - | 200 | 3,183 | ||||||||||||||||
|
Restructuring charges accrued during fiscal 2008
|
(244 | ) | 25 | 528 | 309 | $ | 190 | |||||||||||||
|
Non-cash charges
|
- | (25 | ) | - | (25 | ) | ||||||||||||||
|
Cash payments
|
(1,910 | ) | - | (535 | ) | (2,445 | ) | |||||||||||||
|
Accrued balance at February 3, 2008
|
829 | - | 193 | 1,022 | ||||||||||||||||
|
Restructuring credits accrued during fiscal 2009
|
(834 | ) | - | (117 | ) | (951 | ) | $ | (592 | ) | ||||||||||
|
Cash payments
|
5 | - | (31 | ) | (26 | ) | ||||||||||||||
|
Accrued balance at February 1, 2009
|
- | - | 45 | 45 | ||||||||||||||||
|
Restructuring charges accrued during fiscal 2010
|
||||||||||||||||||||
|
Non-cash charges
|
- | - | - | - | ||||||||||||||||
|
Cash payments
|
- | - | (7 | ) | (7 | ) | ||||||||||||||
|
Accrued balance at January 31, 2010
|
$ | - | $ | - | $ | 38 | $ | 38 | ||||||||||||
Accrued restructuring charges are included in “accrued salaries, wages and benefits,” “other accrued expenses” and “other long-term liabilities” in the consolidated balance sheets. The expenses are included in “restructuring (credits) charges” in the consolidated statements of operations.
NOTE 17 – SEGMENT INFORMATION
We are organized and report our results of operations in one operating segment that designs, imports, manufactures and markets residential furniture products, principally in North America. The nature of the products, production processes, distribution methods, types of customers and regulatory environment are similar for substantially all of our products.
NOTE 18 – COMMITMENTS, CONTINGENCIES AND OFF BALANCE SHEET ARRANGEMENTS
We lease warehousing facilities, showroom space, and office and computer equipment under leases expiring over the next five years. Rent expense was $2.2 million in fiscal 2010, $2.5 million in fiscal 2009, and $2.2 million in fiscal 2008. Future minimum annual commitments under leases and operating agreements amount to $2.2 million in fiscal 2011, $1.4 million in fiscal 2012, $869,000 in fiscal 2013, $830,000 in fiscal 2014, and $268,000 in fiscal 2015.
We had letters of credit outstanding totaling $1.9 million on January 31, 2010. We utilize letters of credit to collateralize certain imported inventory purchases and certain insurance arrangements.
In the ordinary course of its business, we may become involved in legal proceedings involving contractual and employment relationships, product liability claims, intellectual property rights and a variety of other matters. We do not believe that any pending legal proceedings will have a material impact on our financial position or results of operations.
NOTE 19 – CONCENTRATIONS OF SOURCING RISK
We source imported products through over 36 different vendors, from 39 separate factories, located in seven countries. Because of the large number and diverse nature of the foreign factories from which we can source our imported products, we have some flexibility in the placement of products in any particular factory or country.
Factories located in China have become an important resource for Hooker Furniture. In fiscal year 2010, imported products sourced from China accounted for approximately 94% of import purchases, and the factory in China from which we directly source the most product accounted for approximately 42% of our worldwide purchases of imported product. A sudden disruption in our supply chain from this factory, or from China in general, could significantly impact our ability to fill customer orders for products manufactured at that factory or in that country. If such a disruption were to occur, we believe that we would have sufficient inventory to adequately meet demand for approximately four months. Also, with the broad spectrum of product we offer, we believe that, in some cases, buyers could be offered similar product available from alternative sources. We believe that we could, most likely at higher cost, source most of the products currently sourced in China from factories in other countries and could produce certain upholstered products domestically at our own factories. However, supply disruptions and delays on selected items could occur for approximately six months. If we were to be unsuccessful in obtaining those products from other sources, or at comparable cost, then a sudden disruption in the supply chain from our largest import furniture supplier, or from China in general, could have a short-term material adverse effect on our results of operations. Given the capacity available in China and other low-cost producing countries, we believe the risks from these potential supply disruptions are manageable.
NOTE 20 – QUARTERLY DATA (Unaudited)
| Fiscal Quarter | ||||||||||||||||
|
First
|
Second
|
Third
|
Fourth
|
|||||||||||||
|
2010
|
||||||||||||||||
|
Net sales
|
$ | 52,063 | $ | 45,978 | $ | 52,605 | $ | 52,701 | ||||||||
|
Cost of sales
|
40,836 | 36,283 | 39,928 | 37,884 | ||||||||||||
|
Gross profit
|
11,227 | 9,695 | 12,677 | 14,817 | ||||||||||||
|
Selling and administrative expenses
|
11,181 | 10,254 | 10,894 | 9,627 | ||||||||||||
|
Intangible asset impairment charges (credits)
|
673 | (60 | ) | 661 | ||||||||||||
|
Net (loss) income
|
(456 | ) | (463 | ) | 957 | 2,970 | ||||||||||
|
Basic and diluted earnings per share
|
$ | (0.04 | ) | $ | (0.04 | ) | $ | 0.09 | $ | 0.28 | ||||||
|
2009
|
||||||||||||||||
|
Net sales
|
$ | 71,027 | $ | 64,628 | $ | 68,996 | $ | 56,511 | ||||||||
|
Cost of sales
|
54,291 | 50,501 | 53,319 | 42,767 | ||||||||||||
|
Gross profit
|
16,736 | 14,127 | 15,677 | 13,744 | ||||||||||||
|
Selling and adminstrative expenses
|
12,786 | 11,264 | 11,530 | 10,400 | ||||||||||||
|
Intangible asset impairment charges (credits)
|
- | - | - | 4,914 | ||||||||||||
|
Restructuring (credits)
|
- | (258 | ) | (561 | ) | (132 | ) | |||||||||
|
Net income (loss)
|
2,605 | 2,074 | 2,950 | (719 | ) | |||||||||||
|
Basic and diluted earnings per share
|
$ | 0.23 | $ | 0.18 | $ | 0.27 | $ | (0.07 | ) | |||||||
During the fourth quarter of fiscal 2010, we recorded an approximate $700,000 favorable adjustment to our worker’s compensation accrual due to the exit from our captive insurance arrangement. During fiscal 2009, we recorded $4.9 million ($3.1 million after tax, or $0.28 per share) in goodwill and intangible asset impairment charges.
Earnings per share for each fiscal quarter is derived using the weighted average number of shares outstanding during that quarter. Earnings per share for the fiscal year is derived using the weighted average number of shares outstanding on an annual basis. Consequently, the sum of earnings per share for the quarters may not equal earnings per share for the full fiscal year.
NOTE 21 – SUBSEQUENT EVENTS
We have evaluated events that occurred subsequent to January 31, 2010 through the financial statement issuance date.
Dividend
At its April 13, 2010 meeting, our board of directors declared a quarterly cash dividend of $0.10 per share, payable on May 28, 2010 to shareholders of record at May 14, 2010.
Casualty Loss
On March 10, 2010, we experienced a small fire at one of our warehouse facilities in Martinsville, Va. The fire was contained to an area of approximately 2,000 square feet within a 580,000 square foot facility. Based on current estimates, we believe that the costs associated with the fire will exceed our insurance deductible of $500,000. We expect that amounts in excess of our deductible will be fully covered by the insurance policy in force at the time of the fire.