Attached files
| file | filename |
|---|---|
| EX-32.1 - DBUB GROUP, INC | v181171_ex32-1.htm |
| EX-21.1 - DBUB GROUP, INC | v181171_ex21-1.htm |
| EX-31.1 - DBUB GROUP, INC | v181171_ex31-1.htm |
| EX-31.2 - DBUB GROUP, INC | v181171_ex31-2.htm |
| EX-32.2 - DBUB GROUP, INC | v181171_ex32-2.htm |
| EX-23.1 - DBUB GROUP, INC | v181171_ex23-1.htm |
UNITED
STATES
SECURITIES
AND EXCHANGE COMMISSION
WASHINGTON,
D.C. 20549
FORM
10-K
|
(Mark
One)
|
|
| x |
ANNUAL
REPORT PURSUANT TO SECTION 13 OR 15(d) OF THE SECURITIES EXCHANGE ACT OF
1934
|
|
For
the fiscal year ended December 31,
2009
|
|
|
OR
|
|
| o |
TRANSITION
REPORT PURSUANT TO SECTION 13 OR 15(d) OF THE SECURITIES EXCHANGE ACT OF
1934
|
|
For
the transition period from ____________ to
____________
|
|
Commission
file number 000-28767
CHINA
3C GROUP
(Exact
name of registrant as specified in its charter)
|
Nevada
|
88-0403070
|
|
(State
or Other Jurisdiction of Incorporation or Organization)
|
(I.R.S.
Employer Identification No.)
|
368
HuShu Nan Road
HangZhou City, Zhejiang
Province, China 310014
(Address
of Principal Executive Offices) (Zip Code)
Registrant’s
telephone number, including area code: 086-0571-88381700
Securities
registered pursuant to Section 12(b) of the Act: None
Securities
registered pursuant to Section 12(g) of the Act:
Common Stock, $0.001 par
value
Title
of class
Indicate
by check mark if the registrant is a well-known seasoned issuer, as defined in
Rule 405 of the Securities Act. Yes o No x
Indicate
by check mark if the registrant is not required to file reports pursuant to
Section 13 or Section 15(d) of the Act. Yes o No x
Indicate
by check mark whether the registrant: (1) has filed all reports required to
be filed by Section 13 or 15(d) of the Securities Exchange Act of 1934
during the preceding 12 months (or for such shorter period that the registrant
was required to file such reports), and (2) has been subject to such filing
requirements for the past 90 days. Yes x No o
Indicate
by check mark whether the registrant has submitted electronically and posted on
its corporate Web site, if any, every Interactive Data File required to be
submitted and posted pursuant to Rule 405 of Regulation S-T (§ 232.405 of this
chapter) during the preceding 12 months (or for such shorter period that the
registrant was required to submit and post such files). Yes o No o
Indicate
by check mark if disclosure of delinquent filers pursuant to Item 405 of
Regulation S-K (§229.405 of this chapter) is not contained herein, and will not
be contained, to the best of registrant’s knowledge, in definitive proxy or
information statements incorporated by reference in Part III of this Form 10-K
or any amendment to this Form 10-K. o
Indicate
by check mark whether the registrant is a large accelerated filer, an
accelerated filer, a non-accelerated filer, or a smaller reporting company. See
the definitions of “large accelerated filer,” “accelerated filer” and “smaller
reporting company” in Rule 12b-2 of the Exchange Act.
|
Large
accelerated filer o
|
Accelerated
filer o
|
||
|
Non-accelerated
filer x
(Do
not check if a smaller reporting company)
|
Smaller
reporting company o
|
Indicate
by check mark whether the registrant is a shell company (as defined in Rule
12b-2 of the Exchange Act). Yes o No x
The
aggregate market value of the 45,106,327 shares of voting and non-voting common
equity stock held by non-affiliates of the registrant was approximately
$33,378,681 as of June 30, 2009, the last business day of the registrant’s most
recently completed second fiscal quarter, based on the last sale price of the
registrant’s common stock on such date of $0.74 per share, as reported on the
OTC Bulletin Board.
As of April 15, 2010, there were
54,831,327 shares of the registrant’s common stock outstanding.
Documents
incorporated by reference: None.
CHINA
3C GROUP
Table
of Contents
|
PAGE
|
|||||
|
PART I
|
|||||
|
Item 1
|
Business
|
1
|
|||
|
Item 1A
|
Risk
Factors
|
9
|
|||
|
Item 1B
|
Unresolved
Staff Comments
|
15
|
|||
|
Item 2
|
Properties
|
15
|
|||
|
Item 3
|
Legal
Proceedings
|
16
|
|||
|
Item 4
|
Reserved
for Future Use by The Securities and Exchange Commission
|
16
|
|||
|
PART II
|
|||||
|
Item 5
|
Market
for Registrant’s Common Equity, Related Stockholder Matters and Issuer
Purchases of Equity Securities
|
17
|
|||
|
Selected
Financial Data
|
20
|
||||
|
Item 7
|
Management’s
Discussion and Analysis of Financial Condition and Results of
Operations
|
21
|
|||
|
Item 7A
|
Quantitative
and Qualitative Disclosure About Market Risk
|
44
|
|||
|
Financial
Statements and Supplementary Data
|
45
|
||||
|
Item 9
|
Changes
in and Disagreements with Accountants on Accounting and Financial
Disclosure
|
45
|
|||
|
Item
9A(T)
|
Controls
and Procedures
|
46
|
|||
|
Other
Information
|
48
|
||||
|
PART III
|
|||||
|
Item 10
|
Directors,
Executive Officers and Corporate Governance
|
49
|
|||
|
Executive
Compensation
|
52
|
||||
|
Item 12
|
Security
Ownership of Certain Beneficial Owners and Management and Related
Stockholder Matters
|
57
|
|||
|
Item 13
|
Certain
Relationships and Related Transactions, and Director
Independence
|
59
|
|||
|
Principal
Accountant Fees and Services
|
59
|
||||
|
Exhibits,
Financial Statement Schedules
|
60
|
||||
|
Index
to Consolidated Financial Statements
|
65
|
||||
Forward
Looking Statements
We have
included and from time to time may make in our public filings, press releases or
other public statements, certain statements, including, without limitation,
those under “Management’s Discussion and Analysis of Financial Condition and
Results of Operations” in Part II, Item 7. In some cases these statements are
identifiable through the use of words such as “anticipate,” “believe,”
“estimate,” “expect,” “intend,” “plan,” “project,” “target,” “can,” “could,”
“may,” “should,” “will,” “would” and similar expressions. You are cautioned not
to place undue reliance on these forward-looking statements. In addition, our
management may make forward-looking statements to analysts, investors,
representatives of the media and others. These forward-looking statements are
not historical facts and represent only our beliefs regarding future events,
many of which, by their nature, are inherently uncertain and beyond our
control.
PART
I
ITEM
1. BUSINESS
Overview
China 3C
Group (referred to herein as the “Company”, “China 3C,” “we” or “us”) was
incorporated on August 20, 1998 under the laws of the State of Nevada. Before
July 2009, we were only engaged in the business of resale and distribution of
third party products and generated 100% of our revenue from resale of items such
as mobile phones, facsimile machines, DVD players, stereos, speakers, MP3 and
MP4 players, iPods, electronic dictionaries, CD players, radio Walkmans and
audio systems. On July 6, 2009, we completed the acquisition of Jinhua Baofa
Logistic Ltd (“Jinhua”). Thus, we started providing transportation
logistics services to businesses in Eastern China.
In 2007
we began operating under a “store in store” business model. As of December 31,
2009 we established and operated 915 “stores in stores.” We operate
under the brand names Hangzhou Wang Da, Yiwu YongXin, Shanghai Joy & Harmony
and Hangzhou Sanhe. The “store in store” business operation model resulted in
expanded marketing channels, thus, positively stimulated the growth of sales in
2007 and 2008. However, in 2009, we had declining sales under the “stores in
stores” model due to higher competition from direct stores and large department
stores as well as the impact of the economic slow down. Therefore, we decided to
open direct stores and franchises. As of December 31, 2009, Zhejiang has
established three direct and four franchise stores, which are currently
operating.
On July 6, 2009, China 3C and its
subsidiary Zhejiang and Yiwu acquired 100% interest of Jinhua. Jinhua provides transportation
logistics services to businesses.
Under the
stores in stores model, we distribute our products mainly via so-called
concessionaire agreements with larger department stores, supermarkets, large
electronics retail stores, and other retailers. The retail distribution of many
products in China, including those we sell, is conducted through the
concessionaire model. Under this model, companies such as China 3C own their own
outlets within larger stores and in so doing assume responsibility for most
financial and operational aspects of those outlets including capital cost,
inventory, wages, selection, pricing, and general management. Our retail
partners are compensated via margin they earn on the products we sell. This
model is similar to that employed by many department stores in the U.S. However,
this model is also different from the model found at large electronic retailers
like Best Buy and general retailers like Wal-Mart. We have found that many
investors are curious as to why the model in China differs from the one found in
the U.S. We believe, the main reasons are:
1
|
¨
|
We
decrease the financial risk for our retail partners by assuming
responsibility for the inventory and capital expense associated with
distributing our products.
|
|
¨
|
We
decrease operational risk for our retail partners by hiring and managing
employees and handling logistics issues such as wholesale purchase and
delivery and returns and after-sales
service.
|
|
¨
|
We
decrease merchandising risk for our retail partners by bringing product
expertise and specific market knowledge that is difficult for large
retailers to develop on their own across a broad range of product
categories.
|
|
¨
|
China’s
size, regional differences, logistical difficulties, managerial
challenges, underdeveloped credit markets, and rapid growth rate increases
risk for all retailers and drive the need to mitigate risk which is why
our retail partners rely on us.
|
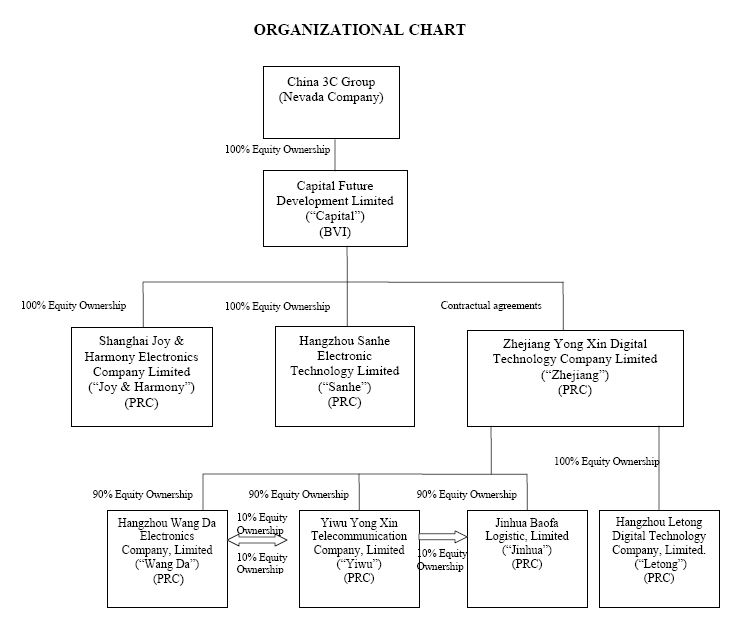
Organizational
Structure
China 3C
was incorporated on August 20, 1998 under the laws of the State of Nevada.
Capital Future Developments Limited - BVI (“Capital”) was incorporated on July
22, 2004 under the laws of the British Virgin Islands. Zhejiang Yong Xin Digital
Technology Company Limited (“Zhejiang”), Yiwu Yong Xin Communication Limited
(“Yiwu”), Hangzhou Wang Da Electronics Company Limited (“Wang Da”), Hangzhou
Sanhe Electronic Technology Limited (“Sanhe”), and Shanghai Joy & Harmony
Electronics Company Limited (“Joy & Harmony”) were incorporated under the
laws of Peoples Republic of China (“PRC”) on July 11, 2005, July 18, 1997,
March, 30, 1998, April 12, 2004, and August 20, 2003, respectively. On March 10,
2009 Zhejiang set up a new operating entity, Hangzhou Letong Digital Technology
Co., Ltd. (“Letong”). During 2009, Letong did not have any operation. On July 6,
2009, Zhejiang and Yiwu completed acquisition of Jinhua Baofa Logistic Ltd
(“Jinhua”). Jinhua was incorporated under the laws of PRC on December
27, 2001.
On
December 21, 2005, Capital became a wholly- owned subsidiary of China 3C Group
through a reverse merger (“Merger Transaction”). China 3C Group acquired all of
the issued and outstanding capital stock of Capital pursuant to a Merger
Agreement dated at December 21, 2005 by and among China 3C Group, XY Acquisition
Corporation, Capital and the shareholders of Capital (the “Merger Agreement”).
Pursuant to the Merger Agreement, Capital became a wholly owned subsidiary of
China 3C Group and, in exchange for the Capital shares, China 3C Group issued
35,000,000 shares of its common stock to the shareholders of Capital,
representing 93% of the issued and outstanding capital stock of China 3C Group
at that time and cash of $500,000.
On August
3, 2006, Capital purchased 100% interest in Sanhe for a cash and stock
transaction valued at approximately $8,750,000. The consideration consisted of
915,751 newly issued shares of the Company’s common stock and $5,000,000 in
cash.
On
November 28, 2006, Capital purchased 100% interest in Joy & Harmony for a
cash and stock transaction valued at approximately $18,500,000. The
consideration consisted of 2,723,110 shares of the Company’s common stock and
$7,500,000 in cash.
On August
15, 2007, the Company changed its ownership structure. As a result, instead of
Capital owning 100% of Zhejiang, Capital entered into contractual agreements
with Zhejiang whereby Capital owns a 100% interest in the revenues of Zhejiang.
Capital does not have an equity interest in Zhejiang, but enjoys all the
economic benefits. Under this structure, Zhejiang is now a wholly foreign owned
enterprise of Capital. The contractual agreements give Capital and its equity
owners an obligation, and having ability to absorb, any losses, and rights to
receive returns. Capital will be unable to make significant decisions about the
activities of Zhejiang and cannot carry out its principal activities without
financial support. These characteristics as defined in Accounting Standard
Codification (“ASC”) Topic 810-10 , previously Financial Accounting Standards
Board (“FASB”) Interpretation 46, Consolidation of Variable Interest Entities
(VIEs), qualifies the business operations of Zhejiang to be consolidated with
Capital and ultimately with China 3C Group. Zhejiang owns 90% of the issued and
outstanding capital stock of each of Wang Da and Yiwu.
2
Acquisitions
On July
6, 2009, China 3C and its subsidiary Zhejiang and Yiwu purchased 100% interest
of Jinhua for RMB 120 million (approximately $17.5 million) in cash.
Zhejiang acquired 90% and Yiwu acquired 10% of the entire equity interests
in Jinhua.
Jinhua
provides transportation logistics services to businesses. Jinhua operates
primarily in Eastern China and covers many of the most developed cities in the
Eastern China such as Shanghai, Hangzhou and Nanjing.
The
purchase price and related allocation to the estimated fair values of the assets
acquired and liabilities assumed, after proportionately allocating the goodwill
resulting from the transaction in accordance with ASC 805 “Business
Combinations” was as follows:
(dollar
amounts in thousands of US dollars)
|
Cash
paid for acquisition of Jinhua
|
$
|
17,508
|
||
|
Assets
acquired :
|
||||
|
Cash
|
$
|
2,406
|
||
|
Accounts
receivable, net
|
715
|
|||
|
Other
receivables, net
|
60
|
|||
|
Prepaid
expenses
|
133
|
|||
|
Property,
plant and equipment
|
216
|
|||
|
Intangible
asset - transportation network
|
15,182
|
|||
|
Goodwill
|
472
|
|||
|
Assets
acquired
|
19,184
|
|||
|
Liabilities
assumed:
|
||||
|
Accounts
payable
|
315
|
|||
|
Accrued
expenses and other payables
|
547
|
|||
|
Income
taxes payable
|
-
|
|||
|
Due
to shareholders
|
814
|
|||
|
Liabilities
assumed
|
1,676
|
|||
|
Net
assets acquired
|
$
|
17,508
|
Following
the acquisition of Jinhua, the Company began providing logistic service to
businesses in addition to its traditional business of resale and distribution of
third party products such as mobile phones, facsimile machines, DVD players,
stereos, speakers, MP3 and MP4 players, iPods, electronic dictionaries, CD
players, radio Walkmans and audio systems.
Our
corporate structure as of December 31, 2009 is as follows:
3
Our
Business
Information
About Our Segments
During
fiscal year 2009, we operated five reportable segments:
|
a.
|
Yiwu
Yong Xin Telecommunication Company, Limited, or “Yiwu,” focuses on the
selling, circulation and modern logistics of fax machines and cord phone
products.
|
|
b.
|
Hangzhou
Wang Da Electronics Company, Limited, or “Wang Da,” focuses on the
selling, circulation and modern logistics of cell phones, cell phones
products, and digital products, including digital cameras, digital
camcorders, PDAs, flash disks, and removable hard
disks.
|
|
c.
|
Hangzhou
Sanhe Electronic Technology Limited “Sanhe,” focuses on the selling,
circulation and modern logistics of home electronics, including DVD
players, audio systems, speakers, televisions and air
conditioners.
|
|
d.
|
Shanghai
Joy & Harmony Electronics Company Limited or “Joy & Harmony,”
focuses on the selling, circulation and modern logistics of consumer
electronics, including MP3 players, MP4 players, iPod, electronic
dictionary, radios, and Walkmans.
|
4
|
e.
|
Jinhua
Baofa Logistic Company Litmited or “Jinhua” provides transportation
logistics services to businesses. Jinhua operates primarily in Eastern
China and covers many of the most developed cities in the Eastern China
such as Shanghai, Hangzhou and
Nanjing
|
Financial
information about our segments is included in Item 7, Management's Discussion
and Analysis of Financial Condition and Results of Operations, and Note 13,
Segment Information, of the Notes to Consolidated Financial Statements, included
in Item 8, Financial Statements and Supplementary Data, of this Annual Report on
Form 10-K.
Yiwu
Yong Xin Telecommunication Company, Limited (“Yiwu”)
Yiwu is
an authorized sales agent, focusing on the selling, circulation and modern
logistics of fax machines and cord phone products in China. Yiwu mainly
distributes Philips fax machines and China’s top local brands Feng Da and CJT
fax machines. Yiwu sells its products through retail “stores in stores” located
in major department stores throughout the Huadong Region of China (consisting of
the Chinese provinces of Zhejiang, Jiangsu and Anhui). Yiwu had 272 retail
locations in 2009. Yiwu contributed 20.2% of revenue to the Company in
2009.
The five
largest suppliers for Yiwu are Feng Da High Technology Company Limited, Hangzhou
Senruida Trade Company Limited, Shanghai Zhongfang Electronics Company Limited,
Ninbo Zhongxun Electronics Company Limited and Wenzhou Jingwei Company. The top
five suppliers contributed 74% of purchases of Yiwu in 2009.The five largest
customers for Yiwu are Shanghai GOME Electrical Appliances Limited, Suning
Appliance Company Limited, Zhejiang GOME Appliances Company, Shanghai Suning
Appliance Company Limited, Yongle China Appliance Company Limited. The top five
customers contributed 34% of revenue of Yiwu in 2009.
Yiwu has
a diverse customer base and, the loss of any single customer is not expected to
have a material adverse affect on Yiwu’s business and operations. Yiwu did not
spend a material amount of money on research and development, and did not have a
significant backlog as of December 31, 2009.
The main
competitors of Yiwu are Hangzhou Yin Dun Company, Hangzhou Si Tong Company, and
Zhejiang Shen You Electrical Appliance Company, Shanghai Haodi Communication
Equipment Co., Ltd and Zhejiang Xincheng Technology Co., Ltd. Yiwu has many
years of long term relationships with well-known brands, which provides Yiwu
with advantages in purchase price compared to its competitors. In addition, Yiwu
has the competitive advantage of maintaining an extensive distribution
network.
Hangzhou
Wang Da Electronics Company, Limited (“Wang Da”)
Wang Da
is an authorized sales agent focusing on the selling, circulation and modern
logistics of cell phones, cell phone products, IT products (including notebook
or laptop computers), and digital products (including digital cameras, digital
camcorders, MP3 players, PDAs, flash disks, and removable hard disks) in China.
Wang Da mainly distributes its products through retail “stores in stores”
located in major department stores throughout the “Huadong” region of China
(consisting of the Chinese provinces of Zhejiang, Jiangsu and Anhui). Wang Da
had 215 retail locations in 2009. Wang Da contributed 27.5% of revenue to the
Company in 2009.
The five
largest suppliers for Wang Da are Shenzhen Tianyin Telecommunication Company
Limited, Shanghai Post & Telecom Appliances Company - Hangzhou Branch,,
Hangzhou Qiuxin Internet Equipment Company Limited Hangzhou Tianchen Digital
Telecommunication Company Limited and Hangzhou Weihua Telecommunication Company
Limited. The five largest suppliers contributed 46% of the purchases of Wang Da
in 2009. The five largest customers for Wang Da are Zhejiang Suning Appliance
Company Limited, Zhejiang GOME Appliances Company, Shanghai Jiadeli Supermarket
Group, Shanghai Guangda Comunication Terminate products Sales Co.Ltd and Suzhou
Meijia Supermarket Group. The top five customers contributed 17% of revenue of
Wang Da in 2009.
5
Wang Da
has a diverse customer base and the loss of any single customer is not expected
to have a material adverse affect on the Company’s business and operations. Wang
Da did not spend a material amount of money on research and development and did
not have a significant backlog as of December 31, 2009.
The main
competitors of Wang Da include Telephone World, Hangzhou Yindun, Shanghai
Guangda, Changjiang Tianyin and Hangzhou Zhenghua. Additionally, there are
Ningbo Haishu and Zhongyu. Wang Da has many years of experiences in mobile phone
sales. Wang Da has a wide distribution network in Zhejiang, Shanghai, Jiangsu
and other regions. These competitors use different business models such as
“store in stores”, free standing stores and distribution channels. The
competitors have smaller scale of operation and smaller distribution regions
compared to Wang Da. Therefore, these competitors typically have only a fraction
of our sales.
Hangzhou
Sanhe Electronic Technology Limited (“Sanhe”)
Sanhe is
a home electronics retail chain in Eastern China, headquartered in HangZhou
City. It had 210 retail “store in stores” in Shanghai City, Zhejiang Province
and Jiangsu Province in 2009. Sanhe specializes in the sale of home electronics,
including air conditioners, audio systems, speakers and DVD players. In 2006,
Sanhe expanded its business to the television sets, and has received sales agent
licenses from TCL, Chuangwei and Haier. Sanhe contributed 25% of revenue to the
Company in 2009.
The five
largest suppliers for Sanhe are Zhejiang Zhuocheng Digital Electronics Company
Limited, Hangzhou Xietong Trade Co., Limited, Shanghai Haier Industrial and
Trade Company, Zhejiang Saixin Technology Limited , Shenzhen Chuangwei-RGB
Electronics Company. The five largest suppliers contributed 62% of the purchases
of Sanhe in 2009. The five largest customers for Sanhe are Lianhua Supermarket
Group, Hangzhou Lianhua Huashang Group, Jiangsu Times Supermarket Company
Limited, Shanghai Lotus Supercenter and Zhejiang Huarun Vanguard Company
Limited. The top five customers contributed 29% of revenue of Sanhe in
2009.
Sanhe has
a diverse customer base and, the loss of any one customer would not likely have
an adverse effect on the Company’s sales. The Company did not spend a
material amount of money on research and development, and did not have a
significant backlog for 2009.
The main
competitors of Sanhe include Hangzhou Meidi, Hangzhou Danong, Nanjing Mingci,
Shanghai Feitong and Jiangshu Huayi. Additionally, there is Baicheng Group with
sales of approximately $30 million per year and Shanghai Feiteng with sales of
approximately $30-40 million per year. Sanhe has many years of experience in the
sale of home electronics which has allowed it to build good relationships with
brand name companies such as TCL, Skyworth, Meidi, Longdi and Galanz. In
addition, Sanhe has the competitive advantage of maintaining an extensive
distribution network.
Shanghai
Joy & Harmony Electronics Company Limited (“Joy & Harmony”)
Joy &
Harmony is a consumer electronics retail chain in Eastern China. It had 218
retail outlets in Shanghai City and Jiangsu Province in 2009. Joy & Harmony
specializes in the sale of consumer electronics, including MP3 players, MP4
players, iPods, electronic dictionaries, CD players, radios, Walkmans, audio
systems and speakers. The company is the authorized sales agent for well-known
manufacturers in China, including Tecsun Radio and Changhong ZARVA. Joy &
Harmony contributed 25% of revenue to the Company in 2009.
The five
largest suppliers for Joy & Harmony are Shanghai Ganshun Trade Company
Limited, Huaqi Information Digital Technology Company Limited (Aigo) – Shanghai,
SONY-Shanghai Company Limited, Shanghai Jingming Technology Company Limited and
Shanghai China-tex Electronic System Company Limited. The five largest suppliers
contributed 49% of the purchases of Joy & Harmony in 2009. The five largest
customers for Joy & Harmony are Shanghai No. 1 Department Store Company
Limited, Shanghai Lanle Trade Company Limited, Da Run Fa Company Limited,
Hualian Jimai Sheng Company Limited, Shanghai Lanle Trade Company Limited and
Shanghai Lian Jia Supermarket Company Limited. The top five customers
contributed 2% of revenue of Joy & Harmony in 2009.
6
As a
retailer with hundreds of locations, the Company is not reliant on any one
customer or on a few customers. The loss of any one customer would not likely
have an adverse effect on Joy & Harmony’s sales. Joy & Harmony did not
have any material backlog of orders at December 31, 2009. Joy & Harmony did
not spend a material amount of money on research and development in 2009.
The main
competitors of Joy & Harmony include Shanghai Huaning, Shanghai Juexiang,
Shanghai Wansi and Shanghai Feitong. Joy & Harmony’s competitors are a
combination of a large number of very small stores who lack the Company’s
economies and scale, as well as a small number of large players such as large
department stores. Additional competitors include Shanghai Yonguan Digital with
sales of approximately $45 million per year, Shanghai Dongqi with sales of
approximately of $7-8 million per year, and Shanghai Yidunj of sales of $4-5
million per year. Joy & Harmony has a large number of retail
locations compared to its competitors. In addition, Joy & Harmony has
built good relationships with suppliers of well-known brands such as Apple,
Sony, Meizu, Desheng and Aigo.
Jinhua
Baofa Logistic Litmited (“Jinhua”)
Jinhua
has been in operation since 2001. Jinhua transports electronics, machinery and
equipment, metal products, chemical materials, garments and handcrafted goods
for businesses in the Eastern China region in which China 3C operates, such as
Shanghai, Hangzhou and Nanjing.
The five
largest vendors for Jinhua are Zhejiang Sheng Tong Logistic Co. Ltd, Hang Zhou
Shen Zhou Transportation Co. Ltd, Shanghai Sheng Hui Transportation Co. Ltd
Shanghai Hong Wei Transportation Co. Ltd and Jiaxing Guohong Vehicle
Transpportation Co. Ltd. The five largest vendors contributed to 34% of direct
cost of Jinhua in 2009. The five largest customers for Jinhua are Guangzhou
Shuntong Transportation Co. Ltd, Wuhan Tianda Transportation Co. Ltd, Xiamen
Shida Transportation Co. Ltd, Hefei Yuanshunda Huoyun Co. Ltd. and Shenzhen
Jingpeng Kuaiyun Co. Ltd. The top five customers contributed 10% of revenue of
Jinhua in 2009.
The main
competitors of Jinhua include Hangzhou Hongrun Transportation Co., Ltd, Hangzhou
Tianzhao Logistics Co., Ltd, Hangzhou Huishen Logistics Co., Ltd, Terry
Logistics Group Co., Ltd, Shanghai Yanfu Logistics Co., Ltd, Shanghai Zhicheng
Logistics Co., Ltd and Shanghai Jiaje Express Co., Ltd
Intellectual
Property
We
consider our logos important to our business. We applied to register
10 logos with the State Administration of Industry and Commerce in China and are
currently awaiting the administration’s approval.
Seasonality
and Quarterly Fluctuations
Our
businesses experience fluctuations in quarterly performance. Traditionally, the
first quarter from January to March has a higher number of sales reflected by
our electronics business due to the New Year holidays in China occurring during
that period. Nevertheless, at times, China can experience particularly inclement
weather in January and February which can serious disrupt the Company’s supply
chain management systems. As our business model is to operate only on several
days of inventory, the effects of such weather disruptions can be severe in
certain years.
Working
Capital
We fund
our business operations through a combination of available cash and cash
equivalents, short-term investments and cash flows generated from
operations.
Due to
the global economic slowdown, we have extended the payment terms for all our
retail partners from 30 days to 45 days and wholesale department from 10 days to
15 days. This will lead to an increase in our accounts receivable. The increase
in accounts receivable will cause a decrease in working capital.
7
We
believe that our currently available working capital, primarily cash from
operation, is adequate to execute our current business plan.
Customers
We do not
have a significant concentration of sales with any individual customer and,
therefore, the loss of any one customer would not have a material impact on our
business. No single customer has accounted for 10% or more of our total revenue
in 2009.
Backlog
We do not
have a material amount of backlog orders.
Government
Contracts
No
material portion of our business is subject to renegotiation of profits or
termination of contracts or subcontracts at the election of the Chinese
government.
Competition
We
compete against other consumer electronics retailers and wholesalers. We compete
principally on the basis of product assortment and availability and value
pricing, customer service; store location and convenience and after-sales
services. We believe our broad product assortment, competitive pricing and
convenient store locations differentiate us from most competitors. Our stores
compete by emphasizing a complete product and service solution and value
pricing. In addition, our trained and knowledgeable sales and service staffs
allow us to tailor the offerings to meet the needs of our
customers.
Research
and Development
We have
not engaged in any material research and development activities during the past
three fiscal years.
Environmental
Matters
We are
subject to China’s National Environmental Protection Law, as well as a number of
other national and local laws and regulations regulating air, water and noise
pollution and setting pollutant discharge standards. We believe that all our
operations are in material compliance with all applicable environmental laws. We
did not incur any costs to comply with environmental laws in 2009 and
2008.
Employees
The
Company currently has 2,205 employees, all of which are full time employees
located in China. Zhejiang has 69 employees, Yiwu has 338 employees, Wang Da has
528 employees, Sanhe has 528 employees, Joy & Harmony has 349 employees and
Jinhua has 393 employees.
The
Company has no collective bargaining agreements with any unions.
8
A general
economic downturn, a recession in China or sudden disruption in business
conditions may affect consumer purchases of discretionary items, including
consumer and business products, which could adversely affect our
business. Consumer spending is generally affected by a number of factors,
including general economic conditions, the level of unemployment, inflation,
interest rates, energy costs, gasoline prices and consumer confidence generally,
all of which are beyond our control. Consumer purchases of discretionary items
tend to decline during recessionary periods, when disposable income is lower,
and may impact sales of our products. In addition, sudden disruptions in
business conditions as a result of a terrorist attack, retaliation and the
threat of further attacks or retaliation, war, adverse weather conditions and
climate changes or other natural disasters, pandemic situations or large scale
power outages can have a short or, sometimes, long-term impact on consumer
spending. A downturn in the economies in China, including any recession or a
sudden disruption of business conditions in China’s economy, could adversely
affect our business, financial condition, and results of operation.
Non-performance
by our suppliers may adversely affect our operations by delaying delivery or
causing delivery failures, which may negatively affect demand, sales and
profitability. We purchase various types of products from
our suppliers. We would be materially and adversely affected by the
failure of our suppliers to perform as expected. We could experience
delivery delays or failures caused by production issues or delivery of
non-conforming products if its suppliers failed to perform, and we also face
these risks in the event any of its suppliers becomes insolvent or
bankrupt.
With the markets
being highly competitive, we may not be able to compete successfully.
Many of our competitors have substantially greater revenues and financial
resources than we do. We may not be able to compete favorably and increased
competition may substantially harm our business, business prospects and results
of operations. If we are not successful in our target markets, our sales could
decline, our margins could be negatively impacted and we could lose market
share, any of which could materially harm our business, results of operations
and profitability.
If we are unable
to successfully integrate the businesses we acquire, our ability to expand our
product offerings and geographic reach may be significantly limited. In
order to expand our product offerings and grow our customer base by reaching new
customers through expanded geographic coverage, we may continue to acquire
businesses that we believe are complimentary to our growth strategy.
Acquisitions involve numerous risks, including difficulties in the assimilation
of acquired operations, loss of key personnel, distraction of management’s
attention from other operational concerns, failure to maintain supplier
relationships, inability to maintain goodwill of customers from acquired
businesses, and the inability to meet projected financial results that supported
how much was paid for the acquired businesses.
Our business will
be harmed if we are unable to maintain our supplier alliance agreements with
favorable terms and conditions. We have licensing/distribution agreements
with key suppliers in a number of major product categories. Our business will be
harmed if we are unable to maintain these favorable agreements or are limited in
our ability to gain access to additional like agreements with our key
suppliers.
If we do not
anticipate and respond to changing consumer preferences in a timely manner, our
operating results could materially suffer. Our business depends, in large
part, on our ability to introduce successfully new products, services and
technologies to consumers, the frequency of such introductions, the level of
consumer acceptance, and the related impact on the demand for existing products,
services and technologies. Failure to predict accurately constantly changing
consumer tastes, preferences, spending patterns and other lifestyle decisions,
or to address effectively consumer concerns, could have a material adverse
effect on our revenue, results of operations and standing with our
customers.
Because our
operating/business model continues to evolve it is difficult to predict our
future performance, and our business is difficult to evaluate. Our
business model continues to evolve over time. We do not have an extensive
operating history upon which you can easily and accurately evaluate our
business, or our ongoing financial condition. As our model evolves over time and
due to our numerous acquisitions, we face risks and challenges due to a lack of
meaningful historical data upon which we can develop budgets and make
forecasts.
9
Future
acquisitions may result in potentially dilutive issuances of equity securities,
the incurrence of further indebtedness, and increased amortization
expense. Our growth model has in the past and most probably in the future
will involve acquisitions that may result in potentially dilutive issuances of
equity securities or the incurrence of debt and unknown liabilities. Such
acquisitions may result in significant write-offs and increased amortization
expenses that could adversely affect our business and the results of our
operations.
If our products
fail to perform properly our business could suffer significantly.
Although we do not currently develop or manufacturer our existing products,
should they fail to perform we may suffer lost sales and customer goodwill,
ongoing liability claims, license terminations, severe harm to our brand and
overall reputation, unexpected costs, and reallocation of resources to resolve
product issues.
Rapid and
substantial growth is the key to our overall strategy, if we are unable to
manage our growth profitably and effectively, we may incur unexpected expenses
and be unable to meet our financial and customer obligations. In order
for us to meet our financial objectives we will need to substantially expand our
operations to achieve necessary market share. We cannot be certain that our IT
infrastructure, financial controls, systems, and processes will be adequate to
support our expansion. Our future results will depend on the ability of our
officers and key employees to manage changing business conditions in
administration, reporting, controls, and operations.
If we are unable
to obtain additional financing for our future needs we may be unable to respond
to competitive pressures and our business may be impaired. We cannot be
certain that financing with favorable terms, or at all, will be available for us
to pursue our expansion initiatives. We may be unable to take advantage of
favorable acquisitions or to respond to competitive pressures. This inability
may harm our operations or financial results.
If we are forced
to lower our prices to compete, our financial performance may be negatively
impacted. We derive our sales from the resale of products from a number
of our suppliers. If we are forced to lower our prices due to added competition,
inferior feature offerings, excess inventory, pressure for cash, declining
economic climate, or any other reason, our business may become less
profitable.
If we are unable
to maintain existing supplier relationships or form new ones, our business and
financial condition may suffer. We rely on our current suppliers along
with new suppliers to provide us access to competitive products for resale. If
we are unable to gain access to suppliers with needed product with favorable
terms our business may be negatively impacted.
If we incur costs
that exceed our existing insurance coverage in lawsuits brought to us in the
future, it could adversely affect our business and financial condition.
We maintain third party insurance coverage against liability risks associated
with lawsuits. While we believe these arrangements are an effective way to
insure against liability, the potential liabilities associated with such risks
or other events could exceed the coverage provided by such
insurance.
We depend on the
continued services of our executive officers and the loss of key personnel could
affect our ability to successfully grow our business. We are highly
dependent upon the services of our senior management team, particularly
Zhenggang Wang, our Chairman and Chief Executive Officer and Jian Zhang, our
Chief Financial Officer. The permanent loss for any of our key executives, could
have a material adverse effect upon our operating results. We may not be able to
locate suitable replacements for our executives if their services were lost. We
do not maintain key man life insurance on any of these individuals.
Risks
Related to Doing Business in China
Our
business operations take place primarily in China. Because Chinese laws,
regulations and policies are continually changing, our Chinese operations will
face several risks summarized below.
Limitations on
Chinese economic market reforms may discourage foreign investment in Chinese
businesses. The value of investments in Chinese businesses could be
adversely affected by political, economic and social uncertainties in China. The
economic reforms in China in recent years are regarded by China’s central
government as a way to introduce economic market forces into China. Given the
overriding desire of the central government leadership to maintain stability in
China amid rapid social and economic changes in the country, the economic market
reforms of recent years could be slowed, or even reversed.
10
Certain political
and economic considerations relating to China could adversely affect our
company. China is transitioning from a planned economy to a
market economy. While the PRC government has pursued economic reforms since its
adoption of the open-door policy in 1978, a large portion of the Chinese economy
is still operating under five-year plans and annual state plans. Through these
plans and other economic measures, such as control on foreign exchange, taxation
and restrictions on foreign participation in the domestic market of various
industries, the PRC government exerts considerable direct and indirect influence
on the economy. Many of the economic reforms carried out by the PRC government
are unprecedented or experimental, and are expected to be refined and improved.
Other political, economic and social factors can also lead to further
readjustment of such reforms. This refining and readjustment process may not
necessarily have a positive effect on our operations or future business
development. Our operating results may be adversely affected by changes in
China’s economic and social conditions as well as by changes in the policies of
the PRC government, such as changes in laws and regulations, or the official
interpretation thereof, which may be introduced to control inflation, changes in
the interest rate or method of taxation, and the imposition of additional
restrictions on currency conversion.
Accordingly,
government actions in the future, including any decision not to continue to
support recent economic reforms and to return to a more centrally planned
economy or regional or local variations in the implementation of economic
policies, could have a significant effect on economic conditions in China or
particular regions thereof, and could require us to divest ourselves of any
interest we then hold in Chinese properties or joint ventures.
Due to various
restrictions under PRC laws on the distribution of dividends by our PRC
operating companies, we may not be able to pay dividends to our
stockholders. The Wholly Foreign Owned Enterprise Law (1986),
as amended and The Wholly Foreign Owned Enterprise Law Implementing Rules
(1990), as amended, contain the principal regulations governing dividend
distributions by wholly foreign owned enterprises. Under these regulations,
wholly foreign owned enterprises, such as Zhejiang, Wang Da and Joy &
Harmony, may pay dividends only out of their accumulated profits, if any,
determined in accordance with PRC accounting standards and regulations.
Additionally, Zhejiang, Wang Da and Joy & Harmony are required to set aside
a certain amount of any accumulated profits each year (a minimum of 10%, and up
to an aggregate amount equal to half of its registered capital), to fund certain
reserve funds. These reserves are not distributable as cash dividends except in
the event of liquidation and cannot be used for working capital purposes. The
PRC government also imposes controls on the conversion of RMB into foreign
currencies and the remittance of currencies out of the PRC. If we
ever determine to pay a dividend, we may experience difficulties in completing
the administrative procedures necessary to obtain and remit foreign currency for
the payment of such dividends from the profits of Zhejiang, Wang Da and Joy
& Harmony.
Currency
conversion and exchange rate volatility could adversely affect our financial
condition and the value of our common stock. The PRC government
imposes control over the conversion of Renminbi, or RMB, into foreign
currencies. Under the current unified floating exchange rate system, the
People’s Bank of China, or PBOC, publishes an exchange rate, which we refer to
as the PBOC exchange rate, based on the previous day’s dealings in the
inter-bank foreign exchange market. Financial institutions authorized to deal in
foreign currency may enter into foreign exchange transactions at exchange rates
within an authorized range above or below the PBOC exchange rate according to
market conditions.
Pursuant
to the Foreign Exchange Control Regulations of the PRC issued by the State
Council which came into effect on April 1, 1996, and the Regulations on the
Administration of Foreign Exchange Settlement, Sale and Payment of the PRC which
came into effect on July 1, 1996, regarding foreign exchange control, conversion
of RMB into foreign exchange by Foreign Investment Enterprises, or FIEs, for use
on current account items, including the distribution of dividends and profits to
foreign investors, is permissible. FIEs are permitted to convert their after-tax
dividends and profits to foreign exchange and remit such foreign exchange to
their foreign exchange bank accounts in China. Conversion of RMB into foreign
currencies for capital account items, including direct investment, loans, and
security investment, is still under certain restrictions. On January 14, 1997,
the State Council amended the Foreign Exchange Control Regulations and added,
among other things, an important provision, which provides that the PRC
government shall not impose restrictions on recurring international payments and
transfers under current account items.
11
Enterprises
in China, including FIEs, which require foreign exchange for transactions
relating to current account items, if within a certain limited amount may,
without approval of the State Administration of Foreign Exchange, or SAFE,
effect payment from their foreign exchange account or convert and pay at the
designated foreign exchange banks by providing valid receipts and proofs.
Convertibility
of foreign exchange in respect of capital account items, such as direct
investment and capital contribution, is still subject to certain restrictions,
and prior approval from the SAFE or its relevant branches must be
sought.
Our
wholly owned subsidiaries, Zhejiang, Wang Da and Joy & Harmony are FIEs to
which the Foreign Exchange Control Regulations are applicable. There can be no
assurance that we will be able to obtain sufficient foreign exchange to pay
dividends or satisfy other foreign exchange requirements in the
future.
Between
1994 and 2004, the exchange rate for RMB against the U.S. dollar remained
relatively stable, most of the time in the region of RMB8.28 to US$1.00.
However, in 2005, the Chinese government announced it would begin pegging the
exchange rate of the RMB against a number of currencies, rather than just the
U.S. dollar. As our operations are primarily in China, any significant
revaluation of the RMB may materially and adversely affect our cash flows,
revenues, financial condition and the value of our common stock. For example, to
the extent that we need to convert U.S. dollars into RMB for our operations,
appreciation of this currency against the U.S. dollar could have a material
adverse effect on our business, financial condition, results of operations and
the value of our common stock. Conversely, if we decide to convert our Renminbi
into U.S. dollars for the purpose of declaring dividends on our common stock or
for other business purposes and the U.S. dollar appreciates against the RMB, the
U.S. dollar equivalent of our earnings from our subsidiaries in China would be
reduced.
The legal system
in China has inherent uncertainties that may limit the legal protections
available in the event of any claims or disputes with third
parties. The legal system in China is based on written
statutes. Prior court decisions may be cited for reference but have limited
precedential value. Since 1979, the central government has promulgated laws and
regulations dealing with economic matters such as foreign investment, corporate
organization and governance, commerce, taxation and trade. As China’s foreign
investment laws and regulations are relatively new and the legal system is still
evolving, the interpretation of many laws, regulations and rules is not always
uniform and enforcement of these laws, regulations and rules involve
uncertainties, which may limit the remedies available in the event of any claims
or disputes with third parties. In addition, any litigation in China may be
protracted and result in substantial costs and diversion of resources and
management attention.
Risks Associated With Our Common
Stock
There is a
limited public market for our common stock. There is currently a limited
public market for the common stock. Holders of our common stock may, therefore,
have difficulty selling their common stock, should they decide to do so. In
addition, there can be no assurances that such markets will continue or that any
shares of common stock, which may be purchased may be sold without incurring a
loss. Any such market price of the common stock may not necessarily bear any
relationship to our book value, assets, past operating results, financial
condition or any other established criteria of value, and may not be indicative
of the market price for the common stock in the future. Further, the market
price for the common stock may be volatile depending on a number of factors,
including business performance, industry dynamics, news announcements or changes
in general economic conditions.
Our common stock
may be deemed penny stock with a limited trading market. Our common stock is
currently listed for trading in the OTC Bulletin Board, which is generally
considered to be a less efficient market than markets such as NASDAQ or other
national exchanges, and which may cause difficulty in conducting trades and
difficulty in obtaining future financing. Further, our securities are subject to
the “penny stock rules” adopted pursuant to Section 15 (g) of the Securities
Exchange Act of 1934, as amended (the “Exchange Act”). The penny stock rules
apply to non-NASDAQ companies whose common stock trades at less than $5.00 per
share or which have tangible net worth of less than $5,000,000 ($2,000,000 if
the company has been operating for three or more years). Such rules require,
among other things, that brokers who trade “penny stock” to persons other than
“established customers” complete certain documentation, make suitability
inquiries of investors and provide investors with certain information concerning
trading in the security, including a risk disclosure document and quote
information under certain circumstances. Many brokers have decided not to trade
“penny stock” because of the requirements of the penny stock rules and, as a
result, the number of broker-dealers willing to act as market makers in such
securities is limited. In the event that we remain subject to the “penny stock
rules” for any significant period, there may develop an adverse impact on the
market, if any, for our securities. Because our securities are subject to the
“penny stock rules,” investors will find it more difficult to dispose of our
securities. Further, for companies whose securities are traded in the OTC
Bulletin Board, it is more difficult: (i) to obtain accurate
quotations, (ii) to obtain coverage for significant news events because
major wire services, such as the Dow Jones News Service, generally do not
publish press releases about such companies, and (iii) to obtain needed
capital.
12
We do not intend
to pay dividends on our common stock. We have no plans for
declaring or paying dividends in the foreseeable future. We intend to retain
earnings, if any, to provide funds for the implementation of our new business
plan. Therefore, there can be no assurance that holders of common stock
will receive any additional cash, stock or other dividends on their shares of
common stock until we have funds, which the Board of Directors determines, can
be allocated to dividends. Also, see risk factor titled “Due to
various restrictions under PRC laws on the distribution of dividends by our PRC
operating companies, we may not be able to pay dividends to our stockholders.”
ITEM 1B.
UNRESOLVED STAFF COMMENTS
None.
ITEM
2. PROPERTIES
The
Company does not own any real estate properties; all of the properties are
leased. The lease terms are as follows:
Yiwu
|
|
1.
|
Yiwu
headquarter office: lease term: one year (Aug. 2009 - Aug.
2010).
|
|
2.
|
Apartments:
Yiwu building, Yiwu village, Lease term: two years (July 2008 - July
2010).
|
|
3.
|
Wenzhou
Office: lease term: one year (June 2009 –June
2010).
|
Wang
Da
|
1.
|
Nanjing
Office: lease term one year (May 2009- May
2010).
|
Sanhe
|
1.
|
Hangzhou
office: lease term five year (May 2009 - May
2014).
|
|
2.
|
Hangzhou
Office: lease term : five years (Aug. 2006 - Aug.
2011).
|
|
3.
|
Wuxi
Office: lease term: two years (Sep. 2008 – Sep.
2010).
|
|
4.
|
Shanghai
Office: lease term: two years (Apr. 2009 – Apr.
2011).
|
Joy
& Harmony
|
1.
|
Wuxi
Tower office: lease term one and half year (June 2009 – Nov.
2010).
|
Jinhua
|
1.
|
Hangzhou
office and warehouse: lease term 3 years (May 2007 – Apr.
2010).
|
13
|
2.
|
Parking
lot: lease term 2 years (Sep. 2009 - Aug.
2011).
|
|
3.
|
Airport
parking: lease term: 1 year(Sep. 2009 – Aug.
2010).
|
|
4.
|
Other
leases – parking, warehouse, distribution and
dorm.
|
The
Company believes its leased spaces are adequate and suitable to maintain and
develop its business operations.
ITEM
3. LEGAL PROCEEDINGS
We are
not a party to any material pending legal proceedings.
ITEM
4. RESERVED FOR FUTURE USE BY THE SECURITIES AND EXCHANGE
COMMISSION
PART
II
ITEM 5. MARKET FOR THE REGISTRANT’S COMMON
EQUITY, RELATED STOCKHOLDER MATTERS AND ISSUER PURCHASES OF EQUITY
SECURITIES
The
Company’s common stock is quoted on the OTC Bulletin Board under the symbol
“CHCG.OB.” The following table sets forth the range of quarterly high and low
closing bids of the common stock as reported during the years ending December
31, 2008 and December 31, 2009 and through March 31, 2010:
|
|
Low Bid*
|
High Bid*
|
||||||
|
2008
|
||||||||
|
Quarter
ended March 31
|
$
|
1.25
|
$
|
3.97
|
||||
|
Quarter
ended June 30
|
$
|
1.20
|
$
|
1.96
|
||||
|
Quarter
ended September 30
|
$
|
1.20
|
$
|
2.26
|
||||
|
Quarter
ended December 31
|
$
|
0.66
|
$
|
1.36
|
||||
|
2009
|
||||||||
|
Quarter
ended March 31
|
$
|
0.43
|
$
|
1.08
|
||||
|
Quarter
ended June 30
|
$
|
0.74
|
$
|
1.72
|
||||
|
Quarter
ended September 30
|
$
|
0.55
|
$
|
0.92
|
||||
|
Quarter
ended December 31
|
$
|
0.42
|
$
|
0.84
|
||||
|
2010
|
||||||||
|
January
1, 2010 – March 31, 2010
|
$
|
0.44
|
$
|
0.59
|
||||
|
*
|
The
quotations reflect inter-dealer prices, without retail mark-up, mark-down
or commission and may not represent actual
transactions.
|
Stockholders
As of the
close of business on April 15, 2009, there were approximately 73 holders of
record of the Company’s common stock. However, we believe there are additional
beneficial owners of our common stock who own their shares in “street
name.”
Dividends
14
The
Company did not pay any dividends during 2008 and 2009. The Company has no plans
to declare cash dividends on its common stock in the future. If the Company ever
determines to pay a dividend, it may experience difficulties in completing the
administrative procedures necessary to obtain and remit foreign currency from
the PRC for the payment of such dividends from the profits of its operating
subsidiaries in China. Please see additional discussion under Item 7.
Management’s Discussion and Analysis of Financial Condition and Results of
Operations; Financial Condition, Liquidity and Capital Resources.
Equity
Compensation Plan Information
On
January 15, 2009, the Company’s Board of Directors (“BOD”) adopted the China 3C
Group 2008 Omnibus Securities and Incentive Plan (the “2008
Plan”). The 2008 Plan provides for the granting of distribution
equivalent rights, incentive stock options, non-qualified stock options,
performance share awards, performance unit awards, restricted stock awards,
stock appreciation rights, tandem stock appreciation rights, unrestricted stock
awards or any combination of the foregoing, as may be best suited to the
circumstances of the particular employee, director or
consultant. Under the 2008 Plan 2,000,000 shares of the Company’s
common stock were initially available for issuance for awards. Each
award shall remain exercisable for a term of ten (10) years from the date of its
grant. The price at which a share of common stock may be purchased upon exercise
of an option shall not be less than the closing sales price of the common stock
on the date such option is granted. The 2008 Plan shall continue in
effect, unless sooner terminated, until the tenth anniversary of the date on
which it is adopted by the Board. As of March 31, 2010, 2,728 shares of the
Company’s common stock were available for issuance of awards.
Securities
authorized for issuance under equity compensation plans
The
following is a summary of all of our equity compensation plans as of December
31, 2009.
|
Plan Category
|
Number of securities
to be issued upon
exercise of
outstanding options,
warrants and rights
|
|
Weighted average
exercise price of
outstanding options,
warrants and rights
|
|
Number of securities
remaining available
for future issuance
under
equity compensation
plan (excluding
securities reflected
in column (a))
|
|||
|
|
(a)
|
|
(b)
|
|
(c)
|
|||
|
Equity
Compensation Plans Approved by Securityholders
|
—
|
—
|
—
|
|||||
|
Equity
Compensation Plans Not Approved by Securityholders
|
1,997,272
|
$
|
0.74
|
2,728
|
||||
Repurchase of
Securities
We did
not repurchase any of shares of our common stock during the fourth quarter of
2009.
Recent
Sales of Unregistered Securities
On May 7,
2007 the BOD appointed Joseph J. Levinson to serve as a member of the BOD of the
Company and to be in charge of the Company’s investor relations. As compensation
for his services, Mr. Levinson received: (1) $60,000 per year, payable in equal
quarterly installments; (2) a monthly grant during his term of his services of
1,000 shares of the Company’s common stock; (3) an initial annual grant of a
stock option to purchase 300,000 shares of the Company's common stock, with an
exercise price of $6.15 per share (the “2007 Stock Option”) under the China 3C
Group 2005 Equity Incentive Plan; and (4) a subsequent annual grant of a stock
option to purchase an additional 300,000 shares of the Company's common stock,
with an exercise price of $1.82 (the “2008 Stock Option”) under the China 3C
Group 2005 Equity Incentive Plan. In addition, the Company agreed that Mr.
Levinson would receive (1) $2,500 for each Board meeting that he attends, (2)
$2,000 for each meeting of a committee of the Board that he attends, (3) $5,000
upon being named the chairman of any Board committee, and (4) $4,500 as a one
time bonus upon joining the Board. It was later determined that due to the
expiration of the China 3C Group 2005 Equity Incentive Plan on December 31,
2006, the 2007 Stock Option and the 2008 Stock Option were not validly granted.
Pursuant to the terms of the Compensation Agreement dated as of November 27,
2008 between Mr. Levinson and the Company, Mr. Levinson acknowledged that the
2007 Stock Option and the 2008 Stock Option were not and will not be granted and
in consideration for his services as a Director accepted the issuance of 125,000
shares of the Company’s common stock. The 125,000 shares of the
Company’s common stock were issued to Mr. Levinson on January 7,
2009.
15
On
January 15, 2009, the Company’s BOD adopted the China 3C Group, Inc. 2008
Omnibus Securities and Incentive Plan (the “2008 Plan”). The 2008
Plan provides for the granting of distribution equivalent rights, incentive
stock options, non-qualified stock options, performance share awards,
performance unit awards, restricted stock awards, stock appreciation rights,
tandem stock appreciation rights, unrestricted stock awards or any combination
of the foregoing, as may be best suited to the circumstances of the particular
employee, director or consultant. Under the 2008 Plan 2,000,000
shares of the Company’s common stock were available for issuance for
awards. Each award shall remain exercisable for a term of ten (10)
years from the date of its grant. The price at which a share of common stock may
be purchased upon exercise of an option shall not be less than the closing sales
price of the common stock on the date such option is granted. The
2008 Plan shall continue in effect, unless sooner terminated, until the tenth
anniversary of the date on which it is adopted by the BOD. In May and October
2009, the Company issued 1,097,272 and 900,000 shares of common stocks,
respectively, pursuant to two consulting agreements for 3 years consulting
service under the 2008 Plan.
In June
2009, pursuant to an employment agreement, an option grant to purchase 100,000
shares of common stock of the Company was issued to Mr. Jian Zhang for his
service as the Company’s chief financial
officer.
In
December 2009, pursuant to aboard of directors agreement, an option
grant to purchase 30,000 shares of common stock of the Company was issued to Mr.
Kenneth T. Berents for serving as a director of the Company.
Forward
Looking Statements
We have
included and from time to time may make in our public filings, press releases or
other public statements, certain statements, including, without limitation,
those under “Management’s Discussion and Analysis of Financial Condition and
Results of Operations” in Part II, Item 7. In some cases these statements are
identifiable through the use of words such as “anticipate,” “believe,”
“estimate,” “expect,” “intend,” “plan,” “project,” “target,” “can,” “could,”
“may,” “should,” “will,” “would” and similar expressions. You are cautioned not
to place undue reliance on these forward-looking statements. In addition, our
management may make forward-looking statements to analysts, investors,
representatives of the media and others. These forward-looking statements are
not historical facts and represent only our beliefs regarding future events,
many of which, by their nature, are inherently uncertain and beyond our
control.
ITEM 6. SELECTED FINANCIAL
DATA
The
selected consolidated statement of income and comprehensive income data for the
years ended December 31, 2009, 2008 and 2007 and the selected consolidated
balance sheet data as of December 31, 2009 and 2008 are derived from our audited
consolidated financial statements included elsewhere in this Annual
Report.
The
selected consolidated balance sheet data as of December 31, 2007, 2006 and 2005,
and the selected consolidated financial data for the years ended December 31,
2007 and 2006, are derived from our audited consolidated financial statements
not included in this Annual Report.
The
following selected consolidated historical financial information should be read
in conjunction with our consolidated financial statements and related notes and
the information contained in Item 7. “Management’s Discussion and Analysis of
Financial Condition and Results of Operations.”
All
amounts in thousands of U.S. dollars except for share amounts.
|
|
Year Ended December 31,
|
|||||||||||||||||||
|
|
2009
|
2008
|
2007
|
2006
|
2005
|
|||||||||||||||
|
Statements
of Operations Data:
|
||||||||||||||||||||
|
Sales,
net
|
$ | 208,489 | $ | 310,644 | $ | 276,027 | $ | 148,219 | $ | 24,702 | ||||||||||
|
Cost
of sales
|
187,476 | 262,003 | 226,656 | 125,412 | 21,577 | |||||||||||||||
|
Gross
profit
|
21,013 | 48,641 | 49,371 | 22,807 | 3,125 | |||||||||||||||
|
General
and administrative expenses
|
21,621 | 14,132 | 13,615 | 5,545 | 783 | |||||||||||||||
|
Income
from operations
|
(608 | ) | 34,509 | 35,756 | 17,262 | 2,342 | ||||||||||||||
|
Other
(Income) Expense
|
||||||||||||||||||||
|
Interest
income
|
(109 | ) | (146 | ) | (88 | ) | (31 | ) | (5 | ) | ||||||||||
|
Interest
expense
|
- | - | - | 8 | 1 | |||||||||||||||
|
Other
income
|
(163 | ) | (1,150 | ) | - | - |
-
|
|||||||||||||
|
Other
expense
|
163 | 360 | 74 | 101 | 9 | |||||||||||||||
|
Total
Other (Income) Expense
|
(109 | ) | (936 | ) | (14 | ) | 78 | 5 | ||||||||||||
|
Income
before income taxes
|
(499 | ) | 35,445 | 35,770 | 17,184 | 2,337 | ||||||||||||||
|
Provision
for income taxes
|
714 | 8,611 | 12,850 | 5,908 | 231 | |||||||||||||||
|
Net
income
|
$ | (1,213 | ) | $ | 26,834 | $ | 22,920 | $ | 11,276 | $ | 2,106 | |||||||||
|
Net
income per share:
|
||||||||||||||||||||
|
Basic
& diluted
|
$ | (0.02 | ) | $ | 0.51 | $ | 0.44 | $ | 0.24 | $ | 0.06 | |||||||||
|
Weighted
average number of shares outstanding:
|
||||||||||||||||||||
|
Basic
& diluted
|
53,867,890 | 52,673,938 | 52,671,438 | 46,179,507 | 35,000,000 | |||||||||||||||
16
|
Year Ended December 31,
|
||||||||
|
2009
|
2008
|
|||||||
|
Balance
Sheet Data:
|
||||||||
|
Cash
and cash equivalents
|
$ | 29,908 | $ | 32,158 | ||||
|
Working
capital
|
49,791 | 59,875 | ||||||
|
Total
assets
|
94,396 | 95,196 | ||||||
|
Total
liabilities
|
7,776 | 7,558 | ||||||
|
Total
shareholders’ equity
|
86,620 | 87,638 | ||||||
ITEM 7. MANAGEMENT’S DISCUSSION AND ANALYSIS
OF FINANCIAL CONDITION AND RESULTS OF OPERATIONS
The
following discussion should be read in conjunction with the Consolidated
Financial Statements and Notes thereto appearing elsewhere in this Form 10-K.
The following discussion contains forward-looking statements. Our actual results
may differ significantly from those projected in the forward-looking statements.
Factors that may cause future results to differ materially from those projected
in the forward-looking statements include, but are not limited to, those
discussed in “Risk Factors” and elsewhere in this Form 10-K.
Overview
China 3C
was incorporated on August, 20, 1998 under the laws of the State of Nevada.
Capital Future Developments Limited (“CFDL”) was incorporated on July 22, 2004
under the laws of the British Virgin Islands. Zhejiang Yong Xin Digital
Technology Company Limited (“Zhejiang”), Yiwu Yong Xin Communication Limited
(“Yiwu”), Hangzhou Wandda Electronics Company Limited (“Wang Da”), Hangzhou
Sanhe Electronic Technology, Limited (“Sanhe”), and Shanghai Joy & Harmony
Electronic Development Company Limited (“Joy & Harmony”) were incorporated
under the laws of Peoples Republic of China on July 11, 2005, July 18, 1997,
March 30, 1998, April 12, 2004, and August 25, 2003, respectively. China 3C
Group owns 100% of CFDL and CFDL own 100% of the capital stock of Joy &
Harmony and Sanhe. Until August 14, 2007, when it made the change to its
ownership structure described in the next paragraph in order to comply with
certain requirements of PRC law, CFDL owned 100% of the capital stock of
Zhenjiang. Zhejiang owns 90% and Yiwu owns 10% of Wang Da. Zhejiang owns 90% and
Wang Da owns 10% of Yiwu. On March 10, 2009 Zhejiang set up a new operating
entity, Hangzhou Letong Digital Technology Co., Ltd. (“Letong”) to establish an
electronic retail franchise operation for China 3C Group. On July 6, 2009,
Zhejiang and Yiwu completed acquisition of Jinhua Baofa Logistic Ltd
(“Jinhua”). Jinhua was incorporated under the laws of PRC on December
27, 2001.
17
Collectively
the nine corporations are referred to herein as the Company.
On
December 21, 2005, CFDL became a wholly owned subsidiary of China 3C through a
merger with a wholly owned subsidiary of the Company (the “Merger Transaction”).
China 3C acquired all of the issued and outstanding capital stock of CFDL
pursuant to a Merger Agreement dated at December 21, 2005 by and among China 3C,
XY Acquisition Corporation, CFDL and the shareholders of CFDL (the “Merger
Agreement”). Pursuant to the Merger Agreement, CFDL became a wholly owned
subsidiary of China 3C Group and, in exchange for the CFDL shares, China 3C
issued 35,000,000 shares of its common stock to the shareholders of CFDL,
representing 93% of the issued and outstanding capital stock of China 3C at that
time and a cash consideration of $500,000. On August 15, 2007, in order to
comply with the requirements of PRC law, the Company recapitalized its ownership
structure. As a result, instead of CFDL owning 100% of Zhejiang as previously
was the case, CFDL entered into contractual agreements with Zhejiang whereby
CFDL owns a 100% interest in the revenues of Zhejiang. CFDL does not have an
equity interest in Zhejiang, but is deemed to have all the economic benefits and
liabilities by contract. Under this structure, Zhejiang is now a wholly foreign
owned enterprise (WOFE) of CFDL. The contractual agreements give CFDL and its’
equity owners an obligation to absorb, any losses, and rights to receive
revenue. CFDL will be unable to make significant decisions about the activities
of Zhejiang and can not carry out its principal activities without financial
support. These characteristics as defined in ASC 810, Consolidation of Variable
Interest Entities (VIEs), qualifies the business operations of Zhejiang to be
consolidated with CFDL and ultimately with China 3C.
As a
result of the Merger Agreement, the reorganization was treated as an acquisition
by the accounting acquiree that is being accounted for as a recapitalization and
as a reverse merger by the legal acquirer for accounting purposes. Pursuant to
the recapitalization, all capital stock shares and amounts and per share data
have been retroactively restated. Accordingly, the financial statements include
the following:
(1) The
balance sheet consists of the net assets of the accounting acquirer at
historical cost and the net assets of the legal acquirer at historical
cost.
(2) The
statements of operations include the operations of the accounting acquirer for
the period presented and the operations of the legal acquirer from the date of
the merger.
Pursuant
to a share exchange agreement, dated August 3, 2006, we issued 915,751 shares of
restricted common stock, to the former shareholders of Sanhe. The shares were
valued at $3,750,000, which was the fair value of the shares at the date of
exchange agreement. This amount is included in the cost of net assets and
goodwill purchased.
Pursuant
to a share exchange agreement, dated November 28, 2006, we issued 2,723,110
shares of newly issued shares of Common Stock to the former shareholders of Joy
& Harmony. The shares were valued at $11,000,000, which was the fair value
of the shares at the date of exchange agreement. This amount is included in the
cost of net assets and goodwill purchased.
On July
6, 2009, China 3C’s subsidiaries, Zhejiang and Yiwu completed acquisition of
Jinhua, a company organized under the laws of the PRC. Zhejiang acquired 90% and
Yiwu acquired 10% of the entire equity interests in Jinhua from the shareholders
of Jinhua for a total purchase price of RMB 120,000,000 (approximately $17.5
million) in cash.
The Company is engaged in the business
of resale and distribution of third party products and generates approximately
100% of its revenue from resale of items such as mobile phones, facsimile
machines, DVD players, stereos, speakers, MP3 and MP4 players, iPod, electronic
dictionaries, CD players, radios, Walkmans, and audio systems. We sell and
distribute products through retail stores and secondary distributors. We operate
substantially all of our retail operations through our “store in store” model.
Under this model, the Company leases space in major department stores and
retailers. Leasing costs can vary based on a percentage of sales, or can be
fixed. For the year ended December 31, 2009, all of our stores in stores leases
were variable based on sales. After acquisition of Jinhua in July 2009, the
Company started provideing transportation service to business in Eastern China.
18
Results
of Operations
Year
Ended December 31, 2009 compared to Year Ended December 31,
2008
Reportable
Operating Segments
The
Company reports financial and operating information in the following five
segments:
|
a)
|
Yiwu
Yong Xin Telecommunication Company, Limited or
“Yiwu”
|
|
b)
|
Hangzhou
Wang Da Electronics Company, Limited or “Wang
Da”
|
|
c)
|
Hangzhou
Sanhe Electronic Technology Limited or
“Sanhe”
|
|
d)
|
Shanghai
Joy & Harmony Electronics Company Limited or “Joy &
Harmony”
|
|
e)
|
Jinhua
Baofa Logistic Limited or “Jinhua”
|
|
a)
|
Yiwu
Yong Xin Telecommunication Company, Limited or
“Yiwu”
|
Yiwu
focuses on the selling, circulation and modern logistics of fax machines and
cord phone products.
All
amounts, except percentage of revenues, in thousands of U.S.
dollars.
|
|
Year Ended December 31,
|
Percentage
|
||||||||||
|
Yiwu
|
2009
|
2008
|
Change
|
|||||||||
|
Revenue
|
$
|
42,064
|
$
|
63,370
|
(33.62)
|
%
|
||||||
|
Gross
Profit
|
$
|
2,818
|
$
|
9,978
|
(71.76)
|
%
|
||||||
|
Gross
Margin
|
6.70
|
%
|
15.75
|
%
|
(9.05)
|
%
|
||||||
|
Operating
Income
|
$
|
(612)
|
$
|
7,615
|
(108.04)
|
%
|
||||||
For the
year ended December 31, 2009, Yiwu generated revenue of $42,064, a decrease of
$21,306 or 33.62% compared to $63,370 for the year ended December 31, 2008.
Gross profit decreased $7,160 or 71.76% from $9,978 for the year ended 2008 to
$2,818 for the year ended 2009. Operating losses was $612 in 2009, a decrease of
$8,227 or 108.04% compared to operating income of $7,615 in 2008. Such decrease
in revenue was primarily due to the shrinking market in office communication
products. The decrease in revenue was also a result of closing 23 stores in
stores in 2009.
Gross
profit margin decreased from 15.75% in 2008 to 6.7% in 2009, a decrease of
9.05%. Such decrease is primarily due to of the more competitive fax machines
and telephone market in China as compared to 2008. In order to maintain market
shares, we had to launch more promotions which negatively affected the gross
margin. In addition, sales rebate paid to suppliers as a percentage of sales
increased in 2009, which led to lower gross margin of Yiwu.
b) Hangzhou
Wang Da Electronics Company, Limited or “Wang Da”
19
Wang Da
focuses on the selling, circulation and modern logistics of cell phones, cell
phones products, and digital products, including digital cameras, digital
camcorders, PDAs, flash disks, and removable hard disks.
All
amounts, except percentage of revenues, in thousands of U.S.
dollars.
|
|
Year Ended December 31,
|
Percentage
|
||||||||||
|
Wang
Da
|
2009
|
2008
|
Change
|
|||||||||
|
Revenue
|
$
|
57,432
|
$
|
102,935
|
(44.21)
|
%
|
||||||
|
Gross
Profit
|
$
|
5,288
|
$
|
16,313
|
(67.58)
|
%
|
||||||
|
Gross
Margin
|
9.21
|
%
|
15.85
|
%
|
(6.64)
|
%
|
||||||
|
Operating
Income
|
$
|
(262)
|
$
|
11,527
|
(102.27)
|
%
|
||||||
For the
year ended December 31, 2009, Wang Da generated revenue of $57,432, a decrease
of $45,503 or 44.21% compared to $102,935 for the year ended December 31, 2008.
Gross profit decreased $11,025 or 67.58% from $16,313 for the year ended 2008 to
$5,288 for the year ended 2009. Operating losses was $262 in 2009, a decrease of
$8,227 or 102.27% compared to operating income of $11,527 in 2008. The decrease
in revenue was primarily due to the high competition from government-owned large
telecommunication service providers. Telecommunication service providers started
to open their direct operating stores to sell communication products and also
launched promotions such as “free phone with service contract” in 2009. In
addition, the introduction of 3G phones caused lower demand for the old model
mobile phones. Meanwhile, the 3G network is still in the trial period, customers
are waiting to upgrade to 3G phones until the 3G network is complete. The
decrease in revenue was also attributed to the closing of 42 stores in stores in
2009.
Gross
profit margin decreased from 15.85% in 2008 to 9.21% in 2009. The decrease was
due to lower unit price of old model mobile phones as a result of the
introduction of the 3G phones.
c) Hangzhou
Sanhe Electronic Technology Limited or “Sanhe”
Sanhe
focuses on the selling, circulation and modern logistics of home electronics,
including DVD players, audio systems, speakers, televisions and air
conditioners.
All
amounts, except percentage of revenues, in thousands of U.S.
dollars.
|
|
Year Ended December 31,
|
Percentage
|
||||||||||
|
Sanhe
|
2009
|
2008
|
Change
|
|||||||||
|
Revenue
|
$
|
51,674
|
$
|
70,243
|
(26.44)
|
%
|
||||||
|
Gross
Profit
|
$
|
6,916
|
$
|
12,444
|
(44.43)
|
%
|
||||||
|
Gross
Margin
|
13.38
|
%
|
17.72
|
%
|
(4.34)
|
%
|
||||||
|
Operating
Income
|
$
|
(741)
|
$
|
7,509
|
(109.87)
|
%
|
||||||
For the
year ended December 31, 2009, Sanhe generated revenue of $51,674, a decrease of
$18,569 or 26.44% compared to $70,243 for the year ended December 31, 2008.
Gross profit decreased $5,528 or 44.43% from $12,444 for the year ended 2008 to
$6,916 for the year ended 2009. Operating losses was $741 in 2009, a decrease of
$8,250 or 109.87% compared to operating income of $7,509 in 2008. The increase
in revenue was primarily due to the shrinking market in DVD players and small
home electronics as well as the closing of 24 stores in 2009.
Gross
profit margin decreased from 17.72% in 2008 to 13.38% in 2009. The decrease in
gross profit and operation income was primarily due to the change in sales
revenue mix. In 2009, due to the lesser sales of DVD players and other small
home electronics, sales volume of TV sets, which has a lower margin,
comparatively increased. Therefore, gross margin for Sanhe decreased in
2009.
d) Shanghai
Joy & Harmony Electronics Company Limited or “Joy &
Harmony”
20
Joy &
Harmony focuses on the selling, circulation and modern logistics of consumer
electronics, including MP3 players, MP4 players, iPod, electronic dictionary,
radios, and Walkman.
All
amounts, except percentage of revenues, in thousands of U.S.
dollars.
|
|
Year Ended December 31,
|
Percentage
|
||||||||||
|
Joy
& Harmony
|
2009
|
2008
|
Change
|
|||||||||
|
Revenue
|
$
|
51,489
|
$
|
74,096
|
(30.51)
|
%
|
||||||
|
Gross
Profit
|
$
|
4,250
|
$
|
9,906
|
(57.10)
|
%
|
||||||
|
Gross
Margin
|
8.25
|
%
|
13.37
|
%
|
(5.12)
|
%
|
||||||
|
Operating
Income
|
$
|
1,012
|
$
|
7,406
|
(86.34)
|
%
|
||||||
For the
year ended December 31, 2009, Joy & Harmony generated revenue of $51,489, a
decrease of $22,607 or 30.51% compared to $74,096 for the year ended December
31, 2008. Gross profit decreased $5,656 or 57.10% from $9,906 for the year ended
2008 to $4,250 for the year ended 2009. Operating income was $1,012 in 2009, a
decrease of $6,394 or 86.34% compared to $7,406 in 2008. The decrease in revenue
was primarily due to closing of 12 stores in 2009. In addition, manufacturers
have been introducing new products at a slower rate and the old products
currently on the market have become out-dated. This has caused the unit price of
consumer electronics to drop and sales to decline.
Gross
profit margin decreased from 13.37% in 2008 to 8.25% in 2009. The global
financial crisis caused many small electronics manufacturers to exit the market
and large manufacturers to raise the price of consumer electronics. Therefore,
the cost for Joy & Harmony has increased, which led to a significant decline
in gross margin.
e) Jinhua
Baofa Logistic Limited or “Jinhua”
Jinhua
provides transportation service to business and transports freight, including
electronics, machinery and equipment, metal products, chemical materials,
garments and handicraft goods, in more than 20 cities in Eastern China. Its
transportation services cover many of the most developed cities in Eastern China
such as Shanghai, Hangzhou and Nanjing.
China 3C
acquired Jinhua on July 6, 2009. Therefore, the consolidated statement of income
(loss) and comprehensive income (loss) of China 3C for the year ended December
31, 2009 includes Jinhua’s operating results from the date of acquisition to
December 31, 2009.
All
amounts, except percentages of revenues, are in thousands of U.S.
dollars.
|
Jinhua
|
For
the period from July 1 to December 31, 2009
|
|||
|
Revenue
|
$ | 5,573 | ||
|
Gross
Profit
|
$ | 1,713 | ||
|
Gross
Margin
|
30.73 | % | ||
|
Operating
Income
|
$ | 1,098 | ||
Net
sales
Net sales
for 2009 totaled $208,490, representing a year-over-year decrease of 32.88%
compared to $$310,645 for 2008. The decrease was attributable to the closing of
101 stores in stores in 2009 as well as the negative effect of global economic
slowdown.
Percentage
of sales
21
In 2009,
the Company earned approximately 69% of its sales from its retail operations and
31% from its wholesale operations compared to 68% from retail operations and 32%
from wholesale in 2008.
Percentage
of sales from retail operations and wholesale operations for each segment is as
follows:
|
Yiwu
|
Wang
Da
|
Sanhe
|
Joy
& Harmony
|
|||||||||||||
|
Retail
|
68.67
|
%
|
69.93
|
%
|
67.57
|
%
|
69.65
|
%
|
||||||||
|
Wholesale
|
31.33
|
%
|
30.07
|
%
|
32.43
|
%
|
30.35
|
%
|
||||||||
Cost
of Sales
Cost of sales for 2009 totaled
$187,476, or 89.92% of net sales compared to $262,003, or 84.34% for 2008. The
decrease in the cost of sales was a direct result of the corresponding decrease
in sales. The cost of sales as a percentage increased during 2009 primarily due
to increased costs of electronics products as well as increase in sales rebate
paid to suppliers.
Top
Ten Suppliers of Each of Our Subsidiaries in 2009
|
Yiwu
|
Wang
Da
|
Sanhe
|
Joy
& Harmony
|
Jinhua
|
||||||
|
1
|
Fengda
Technology Company Limited
|
Shanghai
Post&Telecom Appliances Co - Hangzhou
|
Zhejiang
Zhuocheng Digital Electronics Company Limited
|
Shanghai
Ganshun Trade Company Limited
|
Zhejiang
Sheng Tong Logistic Company Limited
|
|||||
|
2
|
Hangzhou
Shenruida Trade Company Limited
|
Shenzhen
Tianyin Telecommunication Company Limited
|
Hangzhou
Xietong Trade Co., Limited
|
Huaqi
Information Digital Technology Company Limited (aigo) –
Shanghai
|
Shanghai
Hong Wei Transportation Company Limited
|
|||||
|
3
|
Shanghai
Zhongfang Electronics Company Limited
|
Hangzhou
Tianchen Digital Telecommunication Company Limited
|
Shanghai
Haier Industrial and Trade Company
|
SONY-Shanghai
Company Limited
|
Hangzhou
Shenzhou Transportation Company
Limited
|
|
4
|
Wenzhou
Jingwei Company
|
Hangzhou
Qiuxin Internet Equipment Company Limited
|
Zhejiang
Saixin Technology Limited
|
Shanghai
Jingming Technology Company Limited
|
Jiaxingshi
Guohong Vehicle Transportation Company Limited
|
|||||
|
5
|
Ninbo
Zhongxun Electronics Company Limited
|
Hangzhou
Weihua Telecommunication Company Limited
|
Shenzhen
Chuangwei-RGB Electronics Company
|
Shanghai
China-tex Electronic System Company Limited
|
Shanghai
Sheng Hui Transportation Company Limited
|
|||||
|
6
|
Shanghai
Hongyi Office Supplies Company Limited
|
Hangzhou
Chaoyue Telecommunication Company Limited
|
TCL
Electronics Company Limited
|
Shanghai
Caitong Digital Technology Company Limited
|
Guangzhou
Shuntong Transportation Company Limited
|
|||||
|
7
|
Shanghai
Guangdian Equipment Company Limited
|
Shenzhen
Liansheng Technology Company Limited
|
Qingdao
Haixin Electronics Limited Hangzhou branch
|
Beijing
Broadcom Information Technology Company Limited
|
Shanghai
Shenghui Transportation Company Limited
|
|||||
|
8
|
Yiwu
Wantong Telecom Equipment Company Limited
|
Hangzhou
Huayu Telecommunication Appliances Company Limited
|
Dongguang
Lebang Electronics Limited
|
Chongqing
Zhaohua Digital Technology Company Limited
|
Hefei
Yuan Shun Da Transportation Company Limited
|
|||||
|
9
|
Shanghai
Rongduo Business Company Limited
|
Shenzhen
Jinfeng Datong Technology Company Limited
|
Zhongshan
Longdi Electronics Limited
|
Shanghai
Jinling Network Equipment Company Limited
|
Zhuhai
Zhijie Transportation Company Limited
|
|||||
|
10
|
Shanghai
Huoke Electronics Company Limited
|
Shenzhen
Jiepulin Company Limited
|
Shenzhen
Aosike Electronics Company Limited
|
Shenzhen
Dejing Electronics Company Limited
|
Sanming
Yunlin Vehicle Transportation Company
Limited
|
22
Gross
Profit Margin
Gross
profit margin in 2009 decreased to 10.08% compared to 15.66% in 2008. The gross
profit margin decrease was mainly attributed to the fact that many small
manufacturers of computers, communication and consumer products exited
the market and current manufacturers raised the cost of goods due to the global
economic slowdown. The decrease in gross margin was also due to the increase in
sales rebate paid to suppliers.
Because
the Company does not include the costs related to its distribution network in
cost of sales, its gross profit and gross profit as a percentage of net sales
(“gross profit margin”) may not be comparable to those of other retailers that
may include all costs related to their distribution network in cost of sales and
in the calculation of gross profit and gross margin.
General
and Administrative Expenses
General
and administrative expenses for 2009 totaled $21,621, or 10.37% of net sales,
compared to $14,132, or 4.55% of net sales for 2008. General and administration
expense as a percentage of net sales increased 7.32% due to salary increase of
$4,600 in 2009 compared to 2008, additional $1,116 general and administration
expense due to acquisition of Jinhua, increase in management fee and additional
expenses in relation to the new direct stores and franchise
stores. .
Income
(Loss) from Operations
Operating
loss for 2009 was $608, or (0.29)% of net sales compared to Operating income of
$34,509, or 11.11% of net sales for 2008, a decrease of 101.76%. Declined sales
and gross margin and increased general and administration expenses led to the
decline in income from operations.
Provision
for income taxes
Provision
for income taxes for 2009 was $714, representing year-over-year decrease of
91.71% compared to $8,611 for 2008. The significant decrease in income tax
expenses was due to Yiwu, Wang Da and Sanhe having net losses in 2009 and
therefore not having income tax expenses. In addition, Joy & Harmony’s
income from operations also declined in 2009 compared to 2008, therefore, had a
lesser income tax expense. Although we added one subsidiary - Jinhua in 2009,
Jinhua’s income tax expense was not significant.
Net
Income (loss)
Net loss
was $1,213 or (0.58) % of net sales for 2009 compared to $26,834 net income or
8.64% of net sales for 2008. Net income decreased primarily due to sales decline
and increase in general administration expenses.
Year
Ended December 31, 2008 compared to Year Ended December 31,
2007
Reportable
Operating Segments
The
Company reports financial and operating information in the following four
segments:
|
a)
|
Yiwu
Yong Xin Telecommunication Company, Limited or
“Yiwu”
|
23
|
b)
|
Hangzhou
Wang Da Electronics Company, Limited or “Wang
Da”
|
|
c)
|
Hangzhou
Sanhe Electronic Technology Limited or
“Sanhe”
|
|
d)
|
Shanghai
Joy & Harmony Electronics Company Limited or “Joy &
Harmony”
|
Yiwu
focuses on the selling, circulation and modern logistics of fax machines and
cord phone products.
All
amounts, except percentage of revenues, in thousands of U.S.
dollars.
|
|
Year ended December 31,
|
Percentage
|
||||||||||
|
Yiwu
|
2008
|
2007
|
Change
|
|||||||||
|
Revenue
|
$
|
63,370
|
$
|
61,385
|
3.23
|
%
|
||||||
|
Gross
Profit
|
$
|
9,978
|
$
|
9,205
|
8.40
|
%
|
||||||
|
Gross
Margin
|
15.75
|
%
|
15.00
|
%
|
0.75
|
%
|
||||||
|
Operating
Income
|
$
|
7,615
|
$
|
7,378
|
3.21
|
%
|
||||||
For the
year ended December 31, 2008, Yiwu generated revenue of $63,370, an increase of
$1,985 or 3.23% compared to $61,385 for the year ended December 31, 2007. Gross
profit increased $773 or 8.40% from $9,205 for the year ended 2007 to $9,978 for
the year ended 2008. Operating income was $7,615 in 2008, an increase of $237 or
3.21% compared to $7,378 in 2007. Such increases in revenue, gross profit and
operation income were primarily due to the expansion of the Company’s
distribution networks as well as opening of new stores.
Gross
profit margin increased from 15% in 2007 to 15.75% in 2008, an increase of
0.75%. Such increase is primarily due to our strong bargaining power in purchase
of fax machines. Fax machines are China 3C’s most established product line. We
have long term relationships with our suppliers which gives us competitive
advantage in purchase cost.
b) Hangzhou
Wang Da Electronics Company, Limited or “Wang Da”
Wang Da
focuses on the selling, circulation and modern logistics of cell phones, cell
phones products, and digital products, including digital cameras, digital
camcorders, PDAs, flash disks, and removable hard disks.
All
amounts, except percentage of revenues, in thousands of U.S.
dollars.
|
|
Year ended December 31,
|
Percentage
|
||||||||||
|
Wang
Da
|
2008
|
2007
|
Change
|
|||||||||
|
Revenue
|
$
|
102,935
|
$
|
83,496
|
23.28
|
%
|
||||||
|
Gross
Profit
|
$
|
16,313
|
$
|
13,633
|
19.66
|
%
|
||||||
|
Gross
Margin
|
15.85
|
%
|
16.33
|
%
|
(0.48
|
)%
|
||||||
|
Operating
Income
|
$
|
11,527
|
$
|
11,259
|
2.38
|
%
|
||||||
For the
year ended December 31, 2008, Wang Da generated revenue of $102,935, an increase
of $19,439 or 23.28% compared to $83,496 for the year ended December 31, 2007.
Gross profit increased $2,680 or 19.66% from $13,633 for the year ended 2007 to
$16,313 for the year ended 2008. Operating income was $11,527 in 2008, an
increase of $268 or 2.38% compared to $11,259 in 2007. The increase in revenue,
gross profit and operating income were due to the expansion of Wang Da’s
distribution networks, as well as opening of new stores.
Gross
profit margin decreased from 16.33% in 2007 to 15.85% in 2008. The decrease was
a result of a slight increase in promotional sales on cell phones within the
Wang Da's store in store locations. The unit sales price of cell phones
decreased in 2008 compared to the unit price in 2007, which caused the gross
margin to decrease. However, Wang Da has been continuously introducing new cell
phone models in an effort to maintain the gross margin.
24
c) Hangzhou
Sanhe Electronic Technology Limited or “Sanhe”
Sanhe
focuses on the selling, circulation and modern logistics of home electronics,
including DVD players, audio systems, speakers, televisions and air
conditioners.
All
amounts, except percentage of revenues, in thousands of U.S.
dollars.
|
|
Year ended December 31,
|
Percentage
|
||||||||||
|
Sanhe
|
2008
|
2007
|
Change
|
|||||||||
|
Revenue
|
$
|
70,243
|
$
|
67,157
|
4.60
|
%
|
||||||
|
Gross
Profit
|
$
|
12,444
|
$
|
16,234
|
(23.35
|
)%
|
||||||
|
Gross
Margin
|
17.72
|
%
|
24.17
|
%
|
(6.45
|
)%
|
||||||
|
Operating
Income
|
$
|
7,509
|
$
|
11,504
|
(34.73
|
)%
|
||||||
For the
year ended December 31, 2008, Sanhe generated revenue of $70,243, an increase of
$3,086 or 4.60% compared to $67,157 for the year ended December 31, 2007. Gross
profit decreased $3,790 or 23.35% from $16,234 for the year ended 2007 to
$12,444 for the year ended 2008. Operating income was $7,509 in 2008, a decrease
of $3,995 or 34.73% compared to $11,504 in 2007. The increase in revenue was
primarily due to opening of 24 new stores in 2008. The decreases in gross profit
and operation income were primarily due to a more competitive sales environment
on home electronics.
Gross
profit margin decreased from 24.17% in 2007 to 17.72% in 2008. The decrease was
due to a more competitive sales environment on home electronics, which led to a
lower gross margin.
d) Shanghai
Joy & Harmony Electronics Company Limited or “Joy &
Harmony”
Joy &
Harmony focuses on the selling, circulation and modern logistics of consumer
electronics, including MP3 players, MP4 players, iPod, electronic dictionary,
radios, and Walkman.
All
amounts, except percentage of revenues, in thousands of U.S.
dollars.
|
|
Year ended December 31,
|
Percentage
|
||||||||||
|
Joy
& Harmony
|
2008
|
2007
|
Change
|
|||||||||
|
Revenue
|
$
|
74,096
|
$
|
63,988
|
15.80
|
%
|
||||||
|
Gross
Profit
|
$
|
9,906
|
$
|
10,298
|
(3.81
|
)%
|
||||||
|
Gross
Margin
|
13.37
|
%
|
16.09
|
%
|
(2.72
|
)%
|
||||||
|
Operating
Income
|
$
|
7,406
|
$
|
8,755
|
(15.41
|
)%
|
||||||
For the
year ended December 31, 2008, Joy & Harmony generated revenue of $74,096, an
increase of $10,108 or 15.80% compared to $63,988 for the year ended December
31, 2007. Gross profit decreased $392 or 3.81% from $10,298 for the year ended
2007 to $9,906 for the year ended 2008. Operating income was $7,406 in 2008, a
decrease of $1,349 or 15.41% compared to $8,755 in 2007. The increase in revenue
was due to opening of 43 new stores in 2008 and expansion of distribution
networks. Gross profit and operation income decreased as a result of a slight
increase in promotional sales.
Gross
profit margin decreased from 16.09% in 2007 to 13.37% in 2008. The decrease was
a result of a slight increase in promotional sales.
Net
sales
25
Net sales
for 2008 totaled $310,645, representing a year-over-year increase of 12.54% as
compared to $276,027 for 2007. The increase was attributable to the introduction
of new consumer electronic products, increased marketing initiatives within the
Company's store in store locations, as well as opening new stores in
2008.
Percentage
of sales
In 2008,
the Company earned approximately 68% of its sales from its retail operations and
32% of its sales from its wholesale operations compared to 65% from retail
operations and 35% from wholesale operations in 2007.
Percentage
of sales from retail operations and wholesale operations for each segment is as
follows:
|
Yiwu
|
Wang
Da
|
Sanhe
|
SH&J
|
|||||||||||||
|
Retail
|
66
|
%
|
65
|
%
|
69
|
%
|
70
|
%
|
||||||||
|
Wholesale
|
34
|
%
|
35
|
%
|
31
|
%
|
30
|
%
|
||||||||
Cost
of Sales
Cost of
sales for 2008 totaled $262,003, or approximately 84.34% of net sales compared
to $226,656, or approximately 82.11% for 2007. The increase in the cost of sales
was a direct result of the corresponding increase in sales. The cost of sales as
a percentage increased slightly during 2008 primarily due to increased costs of
home electronics products.
Top
Ten Suppliers of Each of Our Subsidiaries in 2008
|
Yiwu
|
Wang
Da
|
Sanhe
|
SH&J
|
|||||
|
1
|
Fengda
Technology Company Limited
|
Shanghai
Post&Telecom Appliances Co - Hangzhou
|
Zhejiang
Shaixinke Company Limited
|
Shanghai
Ganshun Trade Company Limited
|
||||
|
2
|
Hangzhou
Shenruida Trade Company Limited
|
Shenzhen
Tianyin Telecommunication Company Limited
|
Zhongshan
Longde Home Electronics Company Limited
|
Huaqi
Information Digital Technology Company Limited (aigo) –
Shanghai
|
||||
|
3
|
Shanghai
Zhongfang Electronics Company Limited
|
Hangzhou
Tianchen Digital Telecommunication Company Limited
|
Zhejiang
Zhuocheng Digital Electronics Company Limited
|
SONY-Shanghai
Company Limited
|
|
4
|
Wenzhou
Jingwei Company
|
Hangzhou
Qiuxin Internet Equipment Company Limited
|
Shenzhen
Chuangwei-RGB Electronics Company Limited
|
Shanghai
Jingming Technology Company Limited
|
||||
|
5
|
Ninbo
Zhongxun Electronics Company Limited
|
Hangzhou
Weihua Telecommunication Company Limited
|
Shenzhen
Aosike Electronics Company Limited
|
Shanghai
China-tex Electronic System Company Limited
|
||||
|
6
|
Shanghai
Hongyi Office Supplies Company Limited
|
Hangzhou
Chaoyue Telecommunication Company Limited
|
Shanghai
Haier Industrial and Trade Company
|
Shanghai
Caitong Digital Technology Company Limited
|
||||
|
7
|
Shanghai
Guangdian Equipment Company Limited
|
Shenzhen
Liansheng Technology Company Limited
|
TCL
Electronics Company Limited
|
Beijing
Broadcom Information Technology Company Limited
|
||||
|
8
|
Yiwu
Wantong Telecom Equipment Company Limited
|
Hangzhou
Huayu Telecommunication Appliances Company Limited
|
Shenzhen
Deheyuan Electronics Company
|
Chongqing
Zhaohua Digital Technology Company Limited
|
||||
|
9
|
Shanghai
Rongduo Business Company Limited
|
Shenzhen
Jinfeng Datong Technology Company Limited
|
Shenzhen
Angel Drinking Water Industrial Group
|
Shanghai
Jinling Network Equipment Company Limited
|
||||
|
10
|
Shanghai
Huoke Electronics Company Limited
|
Shenzhen
Jiepulin Company Limited
|
Guangzhou
Shengshida Electronics Company Limited
|
Shenzhen
Dejing Electronics Company Limited
|
26
Gross
Profit Margin
Gross
profit margin in 2008 decreased to 15.66% compared to 17.89% in 2007. The gross
profit margin decrease was mainly due to the decrease of 6.45% of gross profit
margin of Sanhe and the decrease of 2.72% of gross profit margin of Joy &
Harmony in 2008. The decrease in gross profit margin was a result of a slight
increase in promotional sales in 2008.
Because
the Company does not include the costs related to its distribution network in
cost of sales, its gross profit and gross profit as a percentage of net sales
(“gross profit margin”) may not be comparable to those of other retailers that
may include all costs related to their distribution network in cost of sales and
in the calculation of gross profit and gross margin.
General
and Administrative Expenses
General
and administrative expenses for 2008 totaled $14,132, or approximately 4.55% of
net sales, compared to $13,615, or approximately 4.93% of net sales for 2007.
General and administration expense as a percentage of net sales decreased 0.38%
as a result of strict cost controls implemented by the Company.
Income
from Operations
Income
from operations for 2008 was $34,509, or 11.11% of net sales as compared to
income from operations of $35,756, or 12.95% of net sales for 2007, a decrease
of 3.49%. Competitive pricing led to the slight decline in income from
operations.
Provision
for income taxes
Provision
for income taxes for 2008 was $8,611, representing year-over-year decrease of
32.99% as compared to $12,850 for 2007. The effective income tax rate for 2008
and 2007 was 25% and 33%, respectively. The decrease in provision for income
taxes was because a lower Enterprise Income Tax rate of 25% became effective
January 1, 2008 for both domestic enterprises and FIEs pursuant to China’s new
Enterprise Income Tax Law.
Net
Income
Net
income was $26,834 or 8.64% of net sales for 2008 compared to $22,920 or 8.30%
of net sales for 2007. Net income increased primarily due to the decrease in
income tax expenses using the new EIT tax rate of 25% pursuant to China’s new
Enterprise Income Tax Law. The increase of new income was also a result of
additional income generated from value-added services such as after-sales
support services compared to 2007.
Retail
locations
The
following table reflects a roll forward during the fiscal year ended December
31, 2007, 2008 and 2009 of our retail locations
during each year (i.e. number of stores opened, number of stores closed and
number of stores open at the end of the period). “Store in store” refers to
the sales counter where the Company’s products are displayed for sale within
large-scale supermarket stores, department stores and other operation sites for
the Company. At present, we have “store in stores” in four main areas, Shanghai,
Zhejiang, Jiangsu and Anhui. The Company’s retail locations are all “store
in store” locations in 2007, 2008 and 2009.
27
|
Wang
Da
|
Yiwu
|
Sanhe
|
Joy
& Harmony
|
Total
|
||||||||||||||||
|
Locations
at Jan. 1, 2007
|
214
|
288
|
165
|
159
|
826
|
|||||||||||||||
|
Opened
during year 2007
|
30
|
37
|
55
|
34
|
156
|
|||||||||||||||
|
Closed
during year 2007
|
(7
|
)
|
(51
|
)
|
(9
|
)
|
(7
|
)
|
(74
|
)
|
||||||||||
|
Locations
at Dec. 31, 2007
|
237
|
274
|
211
|
186
|
908
|
|||||||||||||||
|
Opened
during year 2008
|
37
|
34
|
24
|
43
|
138
|
|||||||||||||||
|
Closed
during year 2008
|
(18
|
)
|
(13
|
)
|
(1
|
)
|
-
|
(32
|
)
|
|||||||||||
|
Locations
at Dec. 31, 2008
|
256
|
295
|
234
|
229
|
1014
|
|||||||||||||||
|
Opened
during year 2009
|
-
|
1
|
-
|
1
|
2
|
|||||||||||||||
|
Closed
during year 2009
|
(23
|
)
|
(42
|
)
|
(24
|
)
|
(12
|
)
|
(101
|
)
|
||||||||||
|
Locations
at Dec. 31, 2009
|
273
|
214
|
210
|
218
|
915
|
|||||||||||||||
The
following table reflects the square footage of each store space during the
fiscal year ended December 31, 2007, 2008 and 2009.
|
(
In square feet)
|
Wang
Da
|
Yiwu
|
Sanhe
|
Joy
& Harmony
|
Total
|
|||||||||||||||
|
Areas
at Jan. 1, 2007
|
24,371
|
42,780
|
23,099
|
18,056
|
108,306
|
|||||||||||||||
|
Opened
during year 2007
|
3,335
|
5,475
|
7,408
|
3,709
|
19,927
|
|||||||||||||||
|
Closed
during year 2007
|
(778
|
)
|
(7,547
|
)
|
(1,212
|
)
|
(764
|
)
|
(10,301
|
)
|
||||||||||
|
Areas
at Dec 31, 2007
|
26,928
|
40,708
|
29,295
|
21,001
|
117,932
|
|||||||||||||||
|
Opened
during year 2008
|
5,698
|
5,270
|
3,888
|
6,020
|
20,876
|
|||||||||||||||
|
Closed
during year 2008
|
(1,890
|
)
|
(1,724
|
)
|
(112
|
)
|
-
|
(3,726
|
)
|
|||||||||||
|
Areas
at Dec. 31, 2008
|
30,736
|
44,254
|
33,071
|
27,021
|
135,082
|
|||||||||||||||
|
Opened
during year 2009
|
-
|
210
|
-
|
142
|
352
|
|||||||||||||||
|
Closed
during year 2009
|
(3,105
|
)
|
(4,704
|
)
|
(2,832
|
)
|
(1,368
|
)
|
(12,009
|
)
|
||||||||||
|
Areas
at Dec. 31, 2009
|
27,631
|
39,760
|
30,239
|
25,795
|
123,425
|
|||||||||||||||
The
following table reflects net sales per square foot for the fiscal year ended
December 31, 2007, 2008 and 2009.
|
(In
US dollars)
|
Wang
Da
|
Yiwu
|
Sanhe
|
Joy
& Harmony
|
Average
|
|||||||||||||||
|
2007
|
1,666
|
703
|
1,617
|
2,244
|
1,420
|
|||||||||||||||
|
2008
|
1,910
|
812
|
1,301
|
1,802
|
1,467
|
|||||||||||||||
|
2009
|
2,079
|
1,058
|
1,709
|
1,996
|
1,710
|
|||||||||||||||
The
following table reflects the amount of comparable or same store sales for each
period (i.e. the change in sales from stores that were open for each of the
fiscal years presented). A “comparable store” is defined as the same
“store in store,” for which sales of that “store in store” is compared in the
same month or same quarter of different years, such as the comparison of the
sales occurring during March 2008 and March 2009 in the same “store in
store.”
|
(In
US dollars)
|
Wang
Da
|
Yiwu
|
Sanhe
|
Joy
& Harmony
|
Average
|
|||||||||||||||
|
2007
|
15,300
|
8,500
|
18,000
|
20,200
|
17,900
|
|||||||||||||||
|
2008
|
21,700
|
11,900
|
17,300
|
20,400
|
18,900
|
|||||||||||||||
|
2009
|
14,878
|
9,464
|
13,880
|
15,221
|
13,122
|
|||||||||||||||
28
In
assessing whether stores are “comparable”, it is based on whether:
(1) stores
are in the same address;
(2) relatively
same business area (e.g. if the business area of a store has changed in no more
than 30%, it is regarded as having same business area; if the change in business
area is more than 30%, the change in business area will be regarded as too
significant as to be comparable;
(3) relatively
same business layout (e.g. if the layout of sales counter in a store remains
unchanged over time, then that store would be regarded as a comparable store; if
there is significant change in layout of a sales counter in a store, that store
will not be regarded as a comparable store);
(4) stores
with same product mix would be regarded as comparable; if there is significant
change in product mix in a store, that store will not be regarded as a
comparable store;
(5) with
respect to net sales per square foot each year and how we treat changes in
square footage, this depends on the materiality of the impact on sales per
square foot as a result of an increase or decrease in square footage. By way of
example only, if a store with an area of 130 square feet had sales of $14,000
per month in 2006, which results in approximately $108 in sales per square foot.
In 2007, if the same store increased the area of operation to 140 square feet
and had sales of $16,000 per month that would result in approximately $114 in
sales per square foot. We would deem the $6 increase in sales per square foot to
be immaterial. Accordingly, in this case, we will use the area of 130
square feet to compare same store sales, and the additional 10 square feet will
be ignored in the calculation of same store sales.
We
consider changes in store square footage of more than 30% to be material. Stores
that undergo such changes will not be accounted for as “comparable stores”
because the change is too significant.
(6) with
respect to net sales per square foot each year and how we treat relocated
stores, if a “store in store” is relocated to a different retail location, which
we would refer to as a different operating environment, during the period, then
that “store in store” will not be used in the same store
comparison. However, if the “store in store” is relocated to another
location within the same retail location (or same operating environment) then
the “store in store” sales will be used in the calculation of the same store
comparison; and
(7) with
respect to net sales per square foot each year and how we treat closed stores,
we treat a closed “store in store” the same way we treat a “store in store”
relocated to different retail location. A closed “store in store” is not used in
the same store comparison.
Opened
and closed “stores in stores” are primarily recognized based on the duration of
the agreements with the shopping centers, as well as the sale and profits of a
“store in store.” Prior to opening a new “store in store” we are usually
approached by a large-scale department store or supermarket that offers us the
opportunity to open a “store in store.” Our decision is based on our study of
the population traffic flow, the department store and supermarkets themselves,
and the level of expected profitability of a potential “store in store.”
Following our inspection, we sign contracts with the department store and
supermarkets, which specifically address the terms and conditions of opening,
closing and relocating the “stores in stores.”
QUARTERLY
RESULTS OF OPERATIONS
Our
businesses experience fluctuations in quarterly performance. Traditionally, the
first quarter from January to March has a higher number of sales reflected by
our electronics business due to the New Year holidays in China occurring during
that period. Nevertheless, at times, China can experience particularly inclement
weather in January and February which can serious disrupt the Company’s supply
chain management systems. As our business model is to operate only on several
days of inventory, the effects of such weather disruptions may be severe in
certain years.
29
The following table sets forth, for the
periods presented, our unaudited quarterly results of operations for the eight
quarters ended December 31, 2009. The data has been derived from our
consolidated financial statements and, in our management’s opinion, they have
been prepared on substantially the same basis as the audited consolidated
financial statements and include all adjustments, consisting only of normal
recurring adjustments, necessary for a fair statement of the financial results
for the periods presented. This information should be read in conjunction with
the annual consolidated financial statements included elsewhere in this Form
10-K. The operating results in any quarter are not necessarily indicative of the
results that may be expected for any future period.
(amounts in thousand of US
dollars)
|
Three
Months Ended
|
||||||||||||||||||||||||||||||||
|
12/31/2009
|
9/30/2009
|
6/30/2009
|
3/31/2009
|
12/31/2008
|
9/30/2008
|
6/30/2008
|
3/31/2008
|
|||||||||||||||||||||||||
|
Sales,
net
|
$ | 35,997 | $ | 43,955 | $ | 51,126 | $ | 77,412 | $ | 84,919 | $ | 79,057 | $ | 78,515 | $ | 68,153 | ||||||||||||||||
|
Cost
of sales
|
35,075 | 39,942 | 45,106 | 67,353 | 71,546 | 67,211 | 65,639 | 57,607 | ||||||||||||||||||||||||
|
Gross
profit
|
922 | 4,013 | 6,020 | 10,059 | 13,373 | 11,846 | 12,876 | 10,546 | ||||||||||||||||||||||||
|
General
and administrative expenses
|
5,765 | 5,621 | 4,749 | 5,486 | 4,089 | 3,731 | 3,326 | 2,986 | ||||||||||||||||||||||||
|
Income
from operations
|
(4,843 | ) | (1,608 | ) | 1,271 | 4,573 | 9,284 | 8,115 | 9,550 | 7,560 | ||||||||||||||||||||||
|
Other
Income (Expense)
|
||||||||||||||||||||||||||||||||
|
Interest
income
|
26 | 29 | 25 | 29 | 43 | 38 | 29 | 36 | ||||||||||||||||||||||||
|
Other
income (expense)
|
(20 | ) | (27 | ) | 10 | 37 | 97 | 379 | 327 | (13 | ) | |||||||||||||||||||||
|
Total
Other Income (Expense)
|
6 | 2 | 35 | 66 | 140 | 417 | 356 | 23 | ||||||||||||||||||||||||
|
Income
before income taxes
|
(4,837 | ) | (1,606 | ) | 1,306 | 4,639 | 9,424 | 8,532 | 9,906 | 7,583 | ||||||||||||||||||||||
|
Provision
for income taxes
|
(1,020 | ) | 144 | 392 | 1,199 | 2,278 | 2,169 | 2,354 | 1,810 | |||||||||||||||||||||||
|
Net
income
|
$ | (3,817 | ) | $ | (1,750 | ) | $ | 914 | $ | 3,440 | $ | 7,146 | $ | 6,363 | $ | 7,552 | $ | 5,773 | ||||||||||||||
|
Net
income per share:
|
||||||||||||||||||||||||||||||||
|
Basic
& diluted
|
$ | (0.07 | ) | $ | (0.03 | ) | $ | 0.02 | $ | 0.07 | $ | 0.14 | $ | 0.12 | $ | 0.14 | $ | 0.11 | ||||||||||||||
|
Weighted
average number of shares outstanding:
|
||||||||||||||||||||||||||||||||
|
Basic
|
54,831 | 53,931 | 53,931 | 52,834 | 52,674 | 52,674 | 52,674 | 52,674 | ||||||||||||||||||||||||
|
Diluted
|
54,831 | 53,931 | 53,931 | 52,834 | 53,074 | 53,074 | 53,074 | 53,074 | ||||||||||||||||||||||||
Liquidity
and Capital Resources (amounts in thousand of US dollars)
Cash has
historically been generated from operations. Operations and liquidity needs are
funded primarily through cash flows from operations and short-term
borrowings.
Cash and
cash equivalents were $29,908 at December 31, 2009 and current assets totaled
$57,567 at December 31, 2009. The Company’s total current liabilities were
$7,776 at December 31, 2009. Working capital at December 31, 2009 was $49,791.
During 2009, net cash provided by operating activities was $7,113.
30
Cash and
cash equivalents were $32,158 at December 31, 2008 and current assets totaled
$67,433 at December 31, 2008. The Company’s total current liabilities were
$7,558 at December 31, 2008. Working capital at December 31, 2008 was $59,875.
During 2008, net cash provided by operating activities was $12,690.
The
Company does not have any debt as of December 31, 2009.
The
Wholly Foreign Owned Enterprise Law (1986), as amended and The Wholly Foreign
Owned Enterprise Law Implementing Rules (1990), as amended, contain the
principal regulations governing dividend distributions by wholly foreign owned
enterprises. Under these regulations, wholly foreign owned enterprises, such as
Zhejiang, Yiwu, Wang Da, Sanhe and Joy & Harmony may pay dividends only out
of their accumulated profits, if any, determined in accordance with PRC
accounting standards and regulations. Additionally, Zhejiang, Yiwu,
Wang Da, Sanhe and Joy & Harmony are required to set aside a certain amount
of any accumulated profits each year (a minimum of 10%, and up to an aggregate
amount equal to half of its registered capital), to fund certain reserve funds.
These reserves are not distributable as cash dividends except in the event of
liquidation and cannot be used for working capital purposes. The PRC government
also imposes controls on the conversion of RMB into foreign currencies and the
remittance of currencies out of the PRC. The Company’s two operating
subsidiaries in China paid $525,460 in dividends during 2005, however, we do not
intend to pay dividends on our common stock in the foreseeable future. If we
ever determine to pay a dividend, we may experience difficulties in completing
the administrative procedures necessary to obtain and remit foreign currency for
the payment of such dividends from the profits of Zhejiang, Yiwu,
Wang Da, Sanhe and Joy & Harmony and Jinhua.
In
summary, our cash flows were (in thousands):
|
Year
Ended December 31,
|
||||||||||||
|
2009
|
2008
|
2007
|
||||||||||
|
Net
cash provided by operating activities
|
$
|
7,112
|
$
|
12,690
|
$
|
21,574
|
||||||
|
Net
cash used in investing activities
|
(8,590
|
)
|
(7,327
|
)
|
(64
|
)
|
||||||
|
Net
cash (used in) provided by financing
activities
|
-
|
-
|
(4,500
|
)
|
||||||||
|
Effect
of exchange rate change on cash and cash
equivalents
|
(772
|
)
|
1,842
|
1,445
|
||||||||
|
Net
increase in cash and cash equivalents
|
(2,250
|
)
|
7,205
|
18,455
|
||||||||
|
Cash
and cash equivalents at beginning of year
|
32,158
|
24,953
|
6,498
|
|||||||||
|
Cash
and cash equivalents at end of year
|
$
|
29,908
|
$
|
32,158
|
$
|
24,953
|
||||||
In light
of the three components of cash flows i.e. operating, investing and financing
activities for the years ended December 31, 2007, 2008 and 2009.
Operating
Activities
Net cash
generated from operating activities decreased to $7,113 thousand in 2009
from $12,690 thousand in 2008. This decrease was mainly attributable to the
$2,369 thousand net losses incurred in 2009 compared to $26,834 net income in
2008.
Net cash
generated from operating activities decreased to $11,133 thousand in 2008
from $21,574 thousand in 2007. This decrease was mainly attributable to
several factors, including (i) the increase of accounts receivable of
$15,909 thousand resulting from the extension of repayment terms from 15 days to
30 days for retail customers; (ii) the increase of $2,246 thousand in
inventories as a result of increased level of inventories in 2008 to maintain an
adequate level for all stores as a precaution for possible incidents such as the
snow storm in early 2008 ; (iii) the decrease in income taxes payable of
$544 thousand, offset by an increase of $2,309 thousand in accounts payable and
accrued expenses and an the increase in add-back of non-cash expenses, mainly
consisting of share-based compensation of $337 thousand in 2008.
|
2009
|
2008
|
2007
|
||||||||||
|
(in
thousands)
|
(in
thousands)
|
(in
thousands)
|
||||||||||
|
Net
cash provided by operating activities
|
$
|
7,118
|
$
|
12,690
|
$
|
21,574
|
||||||
|
-67.01
|
%
|
-41.18
|
%
|
|||||||||
31
|
2009
|
2008
|
2007
|
||||||||||
|
(in
thousands)
|
(in
thousands)
|
(in
thousands)
|
||||||||||
|
Sales
Net
|
$
|
208,489
|
$
|
310,644
|
$
|
276,027
|
||||||
|
-24.46
|
%
|
+12.54
|
%
|
|||||||||
Using
2007 as base year, there was a decrease in net cash generated from the operating
activities in 2009, a decrease of 67.01%. The significant decrease in net cash
generated by operating activities in 2009 was in line with the decrease in net
sales.
Using
2007 as base year, there was a decrease in net cash generated from the operating
activities in 2008, a decrease of 41.18%, while net sales increased 12.54%. The
significant decrease in net cash generated by operating activities in 2008 was
primarily due to the increase in accounts receivable attributed to the extension
of terms with retail customers from 15 days to 30 days. The increase in accounts
receivable in 2008 was due to the extension of payment terms from all the
Company's retail partners from 15 days to 30 days. Although the amount of
accounts receivable increased during 2008, the Company still maintain a healthy
accounts receivable turnover. The collection of debt is based on the terms of
legal binding documents. The Company has not changed its policy on reserving for
bad debt and has not found any abnormal increases in bad debt.
Investing
activities
|
2009
|
2008
|
2007
|
||||||||||
|
(in
thousands)
|
(in
thousands)
|
(in
thousands)
|
||||||||||
|
Net
cash used investment activities
|
$
|
(8,590
|
)
|
$
|
(7,327
|
)
|
$
|
(64
|
)
|
|||
Net cash
used in investing activities increased to $8,590 in 2009 and $7,327 in 2008 from
$64 in 2007 as a result of the acquisition of Jinhua. On December 19,
2008, Zhejiang and Yiwu entered into an agreement to acquire Jinhua. Pursuant to
the acquisition agreement, Zhejiang and Yiwu were required to pay RMB 50,000
thousand within 10 business days after the execution of the agreement to
Jinhua’s shareholders. Therefore, China 3C made a purchase deposit of $7,319
thousand to the shareholders of Jinhua in 2008. In July 2009, China 3C completed
the acquisition of Jinhua and therefore paid $7,784,494 to Jinhua. In 2009,
China 3C also made $805,992 investment in fixed assets to open new direct
stores.
Financing
Activities
There was
no cash used in financing activities in 2009 and 2008. Net cash used in
financing activities was $4,500 thousand in 2007 due to payment of notes of
$4,500 thousand for the acquisition of Joy & Harmony in 2007.
|
Financial
activities
|
2009
|
2008
|
2007
|
|||||||||
|
(in
thousands)
|
(in
thousands)
|
(in
thousands)
|
||||||||||
|
Net
cash (used) in financing activities
|
$
|
-
|
$
|
-
|
$
|
(4,500
|
)
|
|||||
|
|
(100
|
)%
|
(100
|
)
%
|
||||||||
32
All the
above components adding up or compensate each other giving cash contributions to
the Company.
Net
change in cash and cash equivalents
|
2009
|
2008
|
2007
|
||||||||||
|
(in
thousands)
|
(in
thousands)
|
(in
thousands)
|
||||||||||
|
Net
change in cash and cash
equivalents
|
$
|
(2,250
|
)
|
$
|
7,205
|
$
|
18,455
|
|||||
|
(112.19)
|
%
|
(60.96)
|
%
|
|||||||||
Cash
and cash equivalent
|
2009
|
2008
|
2007
|
||||||||||
|
(in
thousands)
|
(in
thousands)
|
(in
thousands)
|
||||||||||
|
Cash
and cash equivalent
|
$
|
29,908
|
$
|
32,158
|
$
|
24,953
|
||||||
|
+19.86
|
%
|
+28.88
|
%
|
|||||||||
Capital
Expenditures
Total
capital expenditures for purchase of fixed assets during 2009, 2008 and 2007
were $805,992, $11,088 and $64,325, respectively. The low level of capital
expenditures in 2008 and 2007 were due to the low capital requirements needed to
open additional “stores in stores” the Company believes its funds are sufficient
to support its organic growth. In 2009, capital expenditure significantly
increased due to the new business plan of opening new direct stores and
franchise stores. Direct stores and franchise stores have higher capital
requirements than “stores in stores”.
Working Capital Requirements
Historically
operations and short term financing have been sufficient to meet our cash needs.
We believe that we will be able to generate revenues from sales and raise
capital through private placement offerings of our equity securities to provide
the necessary cash flow to meet anticipated working capital requirements.
However, our actual working capital needs for the long and short term will
depend upon numerous factors, including operating results, competition, and the
availability of credit facilities, none of which can be predicted with
certainty. Future expansion will be limited by the availability of financing
products and raising capital.
Off-Balance
Sheet Arrangements
We have
never entered into any off-balance sheet financing arrangements and have never
established any special purpose entities. We have not guaranteed any debt or
commitments of other entities or entered into any options on non-financial
assets.
Critical
Accounting Policies
Our
discussion and analysis of our financial condition and results of operations is
based upon our consolidated financial statements, which have been prepared in
accordance with accounting principles generally accepted in the United States.
The preparation of these consolidated financial statements requires us to make
estimates, judgments and assumptions that affect the reported amounts of assets,
liabilities, revenues and expenses, and the related disclosure of contingent
assets and liabilities. We base our estimates on historical experience and on
various other assumptions that we believe are reasonable under the
circumstances, the results of which form the basis for making judgments about
the carrying values of assets and liabilities that are not readily apparent from
other sources. Actual results may differ from these estimates.
33
An
accounting policy is considered to be critical if it requires an accounting
estimate to be made based on assumptions about matters that are highly uncertain
at the time the estimates are made, and if different estimates that reasonably
could have been used, or changes in the accounting estimates that are reasonably
likely to occur, could materially impact the consolidated financial statements.
We believe the following critical accounting policies reflect the more
significant estimates and assumptions used in the preparation of the
consolidated financial statements.
Revenue
Recognition
Our
revenues are generated from sales of electronics products. All of our revenue
transactions contain standard business terms and conditions. We determine the
appropriate accounting for these transactions after considering (1) whether a
contract exists; (2) when to recognize revenue on the deliverables; and (3)
whether all elements of the contract have been fulfilled and delivered. In
addition, our revenue recognition policy requires an assessment as to whether
collection is reasonably assured, which inherently requires us to evaluate the
creditworthiness of our customers. Changes in judgments on these assumptions and
estimates could materially impact the timing or amount of revenue
recognition.
Please
refer to Note 2 in the footnotes to the financial statements for detailed
description of our revenue recognition policy.
After
Sales Service
The
after-sales services that we provide to our customers are primarily repair and
maintenance. If a customer buys a product from us and needs repairs, we can
usually arrange to have the manufacturer repair the product. In certain cases,
clerks in our stores are able to make the repairs directly.
Tabular
Disclosure of Contractual Obligations
The
following table sets forth our contractual obligations as of December 31,
2009.
(amounts
in thousand of US dollars):
|
Payment
Due by Period
|
||||||||||||||||||||
|
Less than 1
|
More than
|
|||||||||||||||||||
|
Contractual
Obligations
|
Total
|
year
|
1-3 years
|
3-5 years
|
5
years
|
|||||||||||||||
|
Operating
lease obligations
|
$
|
454
|
$
|
338
|
$
|
102
|
$
|
16
|
$
|
-
|
||||||||||
|
Advertising
obligations
|
104
|
101
|
1
|
-
|
-
|
|||||||||||||||
|
Total
contractual obligations
|
$
|
558
|
$
|
439
|
$
|
103
|
$
|
16
|
$
|
-
|
||||||||||
ITEM 7A. QUANTITATIVE AND QUALITATIVE
DISCLOSURE ABOUT MARKET RISK
Foreign
Currency Exchange Rate Risk
Fluctuations
in the rate of exchange between the U.S. dollar and foreign currencies,
primarily the Chinese Renminbi, could adversely affect our financial results.
During the fiscal year ended December 31, 2009, all of our sales were
denominated in foreign currencies. We expect that foreign currencies will
continue to represent a similarly significant percentage of our sales in the
future. Selling, marketing and administrative costs related to these sales are
largely denominated in the same respective currency, thereby mitigating our
transaction risk exposure. We therefore believe that the risk of a significant
impact on our operating income from foreign currency fluctuations is not
substantial. However, for sales not denominated in U.S. dollars, if there is an
increase in the rate at which a foreign currency is exchanged for U.S. dollars,
it will require more of the foreign currency to equal a specified amount of U.S.
dollars than before the rate increase. In such cases and if we price our
products in the foreign currency, we will receive less in US. dollars than we
did before the rate increase went into effect. If we price our products in U.S.
dollars and competitors price their products in local currency, an increase in
the relative strength of the U.S. dollar could result in our price not being
competitive in a market where business is transacted in the local
currency.
34
All of
our sales denominated in foreign currencies are denominated in the Chinese
Renminbi. Our principal exchange rate risk therefore exists between the U.S.
dollar and this currency. Fluctuations from the beginning to the end of any
given reporting period result in the re-measurement of our foreign
currency-denominated receivables and payables, generating currency transaction
gains or losses that impact our non-operating income/expense levels in the
respective period and are reported in other (income) expense, net in our
combined consolidated financial statements. We do not currently hedge our
exposure to foreign currency exchange rate fluctuations. We may, however, hedge
such exposure to foreign currency exchange rate fluctuations in the
future.
Interest
Rate Risk
Changes
in interest rates may affect the interest paid (or earned) and therefore affect
our cash flows and results of operations. However, we do not believe that this
interest rate change risk is significant.
Inflation
Inflation
has not had a material impact on the Company’s business in recent
years.
Currency
Exchange Fluctuations
All of
the Company’s revenues are denominated in Chinese Renminbi, while its expenses
are denominated primarily in Chinese Renminbi (“RMB”). The value of the
RMB-to-U.S. dollar and other currencies may fluctuate and is affected by, among
other things, changes in political and economic conditions. Since 1994, the
conversion of Renminbi into foreign currencies, including U.S. dollars, has been
based on rates set by the People’s Bank of China (“PBOC”), which are set daily
based on the previous day’s inter-bank foreign exchange market rates and current
exchange rates on the world financial markets. Since 1994, the official exchange
rate for the conversion of Renminbi to U.S. dollars had generally been stable
and the Renminbi had appreciated slightly against the U.S. dollar. However, on
July 21, 2005, the Chinese government changed its policy of pegging the value of
Chinese Renminbi to the U.S. dollar. Under the new policy, Chinese Renminbi may
fluctuate within a narrow and managed band against a basket of certain foreign
currencies. Recently there has been increased political pressure on the Chinese
government to decouple the Renminbi from the United States dollar. At the recent
quarterly regular meeting of PBOC, its Currency Policy Committee affirmed the
effects of the reform on Chinese Renminbi exchange rate. Since February 2006,
the new currency rate system has been operated; the currency rate of Renminbi
has become more flexible while basically maintaining stable and the expectation
for a larger appreciation range is shrinking. The Company has never engaged in
currency hedging operations and has no present intention to do so.
Concentration
of Credit Risk
Credit
risk represents the accounting loss that would be recognized at the reporting
date if counterparties failed completely to perform as contracted.
Concentrations of credit risk (whether on or off balance sheet) that arise from
financial instruments exist for groups of customers or counterparties when they
have similar economic characteristics that would cause their ability to meet
contractual obligations to be similarly affected by changes in economic or other
conditions as described below:
|
o
|
The
Company’s business is characterized by rapid technological change, new
product and service development, and evolving industry standards and
regulations. Inherent in the Company’s business are various risks and
uncertainties, including the impact from the volatility of the stock
market, limited operating history, uncertain profitability and the ability
to raise additional capital.
|
|
o
|
All
of the Company’s revenue is derived from Asia and Greater China. Changes
in laws and regulations, or their interpretation, or the imposition of
confiscatory taxation, restrictions on currency conversion, devaluations
of currency or the nationalization or other expropriation of private
enterprises could have a material adverse effect on our business, results
of operations and financial
condition.
|
35
|
o
|
If
the Company is unable to derive any revenues from Greater China, it would
have a significant, financially disruptive effect on the normal operations
of the Company.
|
ITEM 8. FINANCIAL STATEMENTS AND
SUPPLEMENTARY DATA
The
financial statements of the Company are included following the signature page to
this Form 10-K.
ITEM 9. CHANGES IN AND DISAGREEMENTS WITH
ACCOUNTANTS ON ACCOUNTING AND FINANCIAL DISCLOSURE
None.
ITEM
9A(T). CONTROLS AND PROCEDURES
Evaluation
of Disclosure Controls and Procedures
Under the
supervision and with the participation of our management, including our
principal executive officer and principal financial officer, we conducted an
evaluation of our disclosure controls and procedures as of December 31, 2009, as
such term is defined in Rules 13a-15(e) and 15d-15(e) under the Exchange Act.
Based on this evaluation, our principal executive officer and principal
financial officer have concluded that during the period covered by this report,
the Company’s disclosure controls and procedures were effective.
Management’s
Report on Internal Control over Financial Reporting
Our
management is responsible for establishing and maintaining adequate internal
control over financial reporting, as such term is defined in Exchange Act Rules
13a-15(f) and 15d-15(f). Internal control over financial reporting refers to the
process designed by, or under the supervision of, our principal executive and
principal financial officers, and effected by the Board of Directors, management
and other personnel, to provide reasonable assurance regarding the reliability
of financial reporting and the preparation of financial statements for external
purposes in accordance with generally accepted accounting principles and
includes those policies and procedures that:
1. Pertain
to the maintenance of records that in reasonable detail accurately and fairly
reflect the transactions and dispositions of our assets;
2.
Provide reasonable assurance that transactions are recorded as necessary to
permit preparation of financial statements in accordance with generally accepted
accounting principles, and that our receipts and expenditures are being made
only in accordance with authorization of our management and directors;
and
3.
Provide reasonable assurance regarding prevention or timely detection of
unauthorized acquisitions, use or disposition of our assets that could have a
material effect on the financial statements.
36
All
internal control systems, no matter how well designed, have inherent
limitations. Therefore, even those systems determined to be effective can
provide only reasonable assurance with respect to financial statement
preparation and presentation. Because of its inherent limitations, internal
control over financial reporting may not prevent or detect misstatements.
Projections of any evaluation of effectiveness to future periods are subject to
the risk that controls may become inadequate because of changes in conditions or
that the degree of compliance with the policies or procedures may
deteriorate.
Under the
supervision and with the participation of our management, including our
principal executive officer and principal financial officer, we conducted an
evaluation of the effectiveness of our internal control over financial reporting
based on the framework in Internal Control - Integrated Framework issued by the
Committee of Sponsoring Organizations of the Treadway Commission. Based on our
evaluation, our principal executive officer and principal financial officer have
concluded that during the period covered by this report, our internal controls
over financial reporting were effective.
This
Annual Report on Form 10-K does not include an attestation report of our
registered public accounting firm, Goldman Parks Kurland Mohidin LLP, regarding
internal control over financial reporting because we are a non-accelerated
filer. Our management’s report was not subject to attestation by our registered
public accounting firm pursuant to temporary rules of the Securities and
Exchange Commission that permit us to provide only our management’s report in
this Annual Report.
Changes
in Internal Control over Financial Reporting
There was
no change in our internal control over financial reporting that occurred during
the fourth fiscal quarter of the fiscal year covered by this Annual Report on
Form 10-K that has materially affected, or is reasonably likely to materially
affect, our internal control over financial reporting.
ITEM
9B. OTHER INFORMATION
None.
PART
III
ITEM 10. DIRECTORS, EXECUTIVE OFFICERS AND
CORPORATE GOVERNANCE
The
following table sets forth the name, age and position of each of our officers
and directors as of April 15, 2010.
|
Name
|
Age
|
Position
|
||
|
Zhenggang
Wang
|
41
|
Chief
Executive Officer and Chairman of the Board
|
||
|
Jian
Zhang
|
39
|
Chief
Financial Officer
|
||
|
Xiang
Ma
|
35
|
President
|
||
|
Chenghua
Zhu
|
34
|
Director
|
||
|
Mingjun
Zhu
|
41
|
Director
|
||
|
Rongjin
Weng
|
46
|
Director
|
||
|
Wei
Kang Gu
|
71
|
Director
|
||
|
Kenneth
T. Berents
|
62
|
Director,
Chairman Audit Committee
|
There are
no family relationships between or among any of the executive officers or
directors of the Company. Below are brief descriptions of the backgrounds and
experiences of the officers and directors:
Zhenggang
Wang, Chief Executive Office and Chairman of the Board
Mr. Wang,
has been the Company’s chief executive officer and chairman of its BOD since
December 2005. He is also the founder, chairman and chief executive officer of
Zhejiang Yong Xin Digital Technology Company Limited, a holding company for the
purpose of holding interests in Hangzhou Wang Da Electronics Company, Limited
and Yiwu Yong Xin Telecommunication Company, Limited, both of which are based in
China. Mr. Wang established Yiwu Yong Xin Telecommunication Company,
Limited in 1997, and he serves as its chairman and chief executive officer. In
1998, Mr. Wang established Hangzhou Wang Da Electronics Company, Limited,
which is in the business of distributing cellular telephone phones.
Mr. Wang is the chairman and chief executive officer of Hangzhou Wang Da
Electronics Company, Limited. Mr. Wang does not hold any other
directorships with reporting companies in the United States.
37
Jian Zhang, Chief
Financial Officer
Mr. Zhang
has been the Company’s chief financial officer since June 2009. Mr. Zhang has
over ten years of experience in financial accounting and reporting. From October
2006 to June 2009, he served as Chief Accounting Officer of Zhejiang Yong Xin
Digital Technology Company Limited, a subsidiary of China 3C where he was
responsible for the coordination of audits and proper filing of the Company's
quarterly and annual reports. He also played a role in the oversight of the
accounting department to ensure the proper maintenance of all accounting systems
and functions. From October 2006 to October 1999, Mr. Zhang served as Deputy
Chief of Accounting with Guangdong Xidea Technology Group, a large-scale
diversified manufacturer and investment company. From October 1998 to October
1999, Mr. Zhang served as Deputy Chief of Accounting with Guangdong Shunde
Hongji Group, a furniture manufacturer with more than 200 employees. Mr. Zhang
holds a Bachelor's Degree in Accounting from Renmin University of
China.
Xiang
Ma, President
Mr. Ma
has been president of the Company since December 2005. Mr. Ma was
President of Yiwu Yong Xin Telecommunication Company Limited, China 3C’s largest
subsidiary, from 1999 to the present. During the past six years, Mr. Ma’s
expertise in marketing and management have contributed significantly to the
Company’s rapid growth, where it has gone from a small business in the
distribution of 3C products, particularly fax machines, in Eastern China to
being a major presence in that market. Prior to that, from 1996 to 1999, Mr. Ma
was the manager of Zhejiang Transfer Company Limited, a high-tech publicly
traded company in China. During his time at Zhejiang Transfer Company Limited,
Mr. Ma was also responsible for the company’s corporate communications. Mr. Ma
received his Bachelor degree from Zhejiang University with a concentration in
business management. Mr. Ma does not hold any other directorships with reporting
companies in the United States.
Chenghua
Zhu, Director
Ms. Zhu
has been a director of the Company since June 2006. Ms. Zhu is a
senior project manager of Shanghai Shengzhang, a certified public accounting
firm. She was project manager at two CPA firms prior to joining Shanghai
Shengzhang, Shanghai Jiarui and Hubei Dahua. Ms. Zhu does not hold
any other directorships with reporting companies in the United
States.
Mingjun
Zhu, Director
Mr. Zhu
has been a director of the Company since June 2006. Mr. Zhu is General Manager
of Zhejiang Mingda, a certified public accounting firm. He was General Manager
of Zhejiang Mingda Management Consulting Company. From 1993 to 2004, he was
Deputy Director of Yiwu Zhicheng, a CPA firm. Mr. Zhu does not hold
any other directorships with reporting companies in the United
States.
Rongjin
Weng, Director
Mr. Weng
has been a director of the Company since December 2005. Mr. Weng is
Chairman of Langsha Group, which is the largest sock manufacturer in China with
an annual revenue of $100 million. Mr. Weng established Langsha Knitting Company
Limited in 1995, and has served as its chairman and chief executive officer
since that time. Mr. Weng holds a master degree in Business Administration from
Shanghai Jiao Tong University. Mr. Weng does not hold any other directorships
with reporting companies in the United States.
Wei
Kang Gu, Director
Mr. Gu
has been a director of the Company since December 2005. Mr. Gu is a Professor of
Electronic Engineering at Zhejiang University. Founded in 1897, the University
has always been ranked among the few top universities in China and is today the
third most recognized university in China. It is a major research university
comprised of 22 colleges. Mr. Gu also serves on the Board of Bird Ningbo
Company. Founded in 1992, Bird Ningbo has grown to be China’s leading domestic
manufacturer of mobile phones. He is also Vice Chairman of Zhejiang Electronic
Association. Mr. Gu received a bachelors’ degree from Zhejiang
University. Mr. Gu does not hold any other directorships with
reporting companies in the United States.
38
Kenneth
T. Berents, Director, Chairman Audit Committee
Mr.
Berents has been a director of the Company since December 2006. Mr. Berents is a
former managing director and senior portfolio manager for Goldman Sachs Asset
Management in Tampa, Fla., which manages $30 billion in growth stocks. Before
joining Goldman Sachs, he was the managing director and director of equity
research for First Union Securities, now Wachovia Securities, from 1993 to 2000.
He holds a bachelor’s in history from Villanova University and a master’s degree
in journalism from the University of Missouri-Columbia. He also was an Alfred P.
Sloan Fellow in economics at Princeton University. He has appeared on ABC’s
Nightline, CNN, CNBC and is widely quoted in national and trade
publications. Mr. Berents does not hold any other directorships with
reporting companies in the United States.
Weidong
Huang
On June
15, 2009, Weidong Huang who has served as our Chief Financial Officer since
October 2007 advised the Company that effective immediately, he resigned from
his position. There were no disagreements between Mr. Huang and the Company on
any matter relating to the Company’s operations, policies or practices, which
resulted in his resignation.
Joseph
J. Levinson
Joseph J.
Levinson served as a member of the Board of Directors from May 2007 until his
resignation in January 2009.
Term
Each
director serves for a one year term after which they may stand for re-election
at the Company’s annual meeting of stockholders.
Director
Qualifications
We seek
directors with established strong professional reputations and experience in
areas relevant to the strategy and operations of our businesses. We also seek
directors who possess the qualities of integrity and candor, who have strong
analytical skills and who are willing to engage management and each other in a
constructive and collaborative fashion. We also seek directors who have the
ability and commitment to devote significant time and energy to service on the
Board and its committees. We believe that all of our directors meet the
foregoing qualifications.
Our
directors have backgrounds in a variety of different areas including electronics
business, marketing, strategic business development, finance, investor relations
and management. We believe the backgrounds and skills of our directors bring a
diverse range of perspectives to the Board.
Board
Leadership Structure
The BOD
believes that Mr. Wang’s service as both Chairman of the Board and Chief
Executive Officer is in the best interest of the Company and its stockholders.
Mr. Wang possesses detailed and in-depth knowledge of the issues, opportunities
and challenges facing the Company and its business and is thus best positioned
to develop agendas that ensure the Board’s time and attention are focused on the
most critical matters. His combined role enables decisive leadership, ensures
clear accountability, and enhances the Company’s ability to communicate its
message and strategy clearly and consistently to the Company’s shareholders,
employees and customers.
Section
16(a) Beneficial Ownership Reporting Compliance
Section
16(a) of the Securities Exchange Act of 1934, as amended (the “Exchange Act”),
requires the executive officers and directors of the Company and every person
who is directly or indirectly the beneficial owner of more than 10% of any class
of security of the Company to file reports of ownership and changes in ownership
with the Securities and Exchange Commission. Such persons also are required to
furnish our company with copies of all Section 16(a) forms they file. Based
solely on our review of copies of such forms received by us, we believe that
during the fiscal year 2009, the executive officers and directors of the Company
and every person who is directly or indirectly the beneficial owner of more than
10% of any class of security of the Company complied with the filing
requirements of Section 16(a) of the Exchange Act.
39
Code
of Ethics
In 2007
we adopted a corporate code of ethics. We believe our code of ethics is
reasonably designed to deter wrongdoing and promote honest and ethical conduct;
provide full, fair, accurate, timely and understandable disclosure in public
reports; comply with applicable laws; ensure prompt internal reporting of code
violations; and provide accountability for adherence to the code of ethics. The
code of ethics was filed as Exhibit 14 to our Annual Report on Form 10-K for the
fiscal year ended December 31, 2007. A written copy of the code of ethics will
be provided upon request at no charge by writing to our Chief Financial Officer,
China 3C Group, 368 HuShu Nan Road, HangZhou City, Zhejiang Province, China
310014.
Board
Committees and Designated Directors
The BOD
has a Compensation Committee, a Nominating and Corporate Governance Committee
and an Audit Committee.
Audit
Committee
The BOD
has established an audit committee in accordance with Section 3(a)(58)(A) of the
Exchange Act. The Audit Committee consists of Kenneth T. Berents,
Chairman and members Rongjin Weng and Chenghua Zhu. The Board of Directors of
the Company has determined that Mr. Berents is an “audit committee financial
expert” under Item 407(d) of Regulation S-K.
Compensation
Committee
Our
Compensation Committee consists of Wei Kang Gu, Chairman and member Rongjin
Weng. The Compensation Committee makes recommendations to the BOD concerning
salaries and incentive compensation for our officers, including our Chief
Executive Officer, and employees and administers our stock option plans. Each of
the members of the Committee is independent and none have served as an officer
or employee of the Company.
Nominating
and Corporate Governance Committee
Our
Nominating and Corporate Governance Committee consists of Mingjun Zhu, Chairman
and member Wei Kang Gu. The Nominating and Corporate Governance Committee
assists the BOD in identifying qualified individuals to become board members, in
determining the composition of the Board and in monitoring a process established
to assess Board effectiveness. Each of the members of the Committee is
independent and none have served as an officer or employee of the
Company.
Changes
in Director Nomination Process for Stockholders
There
have been no material changes to the procedures by which security holders may
recommend nominees to the Company’s BOD since the filing of the Company’s Annual
Report on Form 10-K for the fiscal year ended December 31, 2008.
ITEM
11. EXECUTIVE COMPENSATION
Compensation
Discussion And Analysis
The
Compensation Committee of our BOD and our Chief Executive Officer, Chief
Financial Officer and head of Human Resources are collectively responsible for
implementing and administering all aspects of our benefit and compensation plans
and programs, as well as developing specific policies regarding compensation of
our executive officers. The members of our Compensation Committee, Mingjun Zhu
and Wei Kang Gu, are independent directors.
40
Compensation
Objectives
Our
primary goal with respect to executive compensation has been to set compensation
at levels that attract and retain the most talented and dedicated executives
possible. Individual executive compensation is set at levels believed to be
comparable with executives in other companies of similar size and stage of
development operating in China. We also link long-term stock-based incentives to
the achievement of specified performance objectives and to align executives’
incentives with stockholder value creation.
Elements
of Compensation
Base
Salary. All full time executives are paid a base salary. Executives who
are Chinese nationals, including our Chief Executive Officer and Chairman, do
not have employment agreements. Base salaries for our executives are established
based on the scope of their responsibilities, taking into account competitive
market compensation paid by other companies in our industry for similar
positions, professional qualifications, academic background, and the other
elements of the executive’s compensation, including stock-based compensation.
Our intent is to set executives’ base salaries near the median of the range of
salaries for executives in similar positions with similar responsibilities at
comparable companies, in line with our compensation philosophy. Base salaries
are reviewed annually, and may be increased to align salaries with market levels
after taking into account the subjective evaluation described
previously.
The
Company currently has no foreign employees and the amount of salary is primarily
determined by job requirements and each employee’s level in the corporate
hierarchy. The Company’s personnel department then makes salary decisions based
on these factors along with and job performance and market
conditions.
Equity Incentive
Compensation. We believe that long-term performance is achieved through
an ownership culture participated in by our executive officers through the use
of stock-based awards. Currently, we do not maintain any incentive compensation
plans based on pre-defined performance criteria. The Compensation Committee has
the general authority, however, to award equity incentive compensation, i.e.
stock options, to our executive officers in such amounts and on such terms as
the committee determines in its sole discretion. The Committee does not have a
determined formula for determining the number of options available to be
granted. Incentive compensation is intended to compensate officers for
accomplishing strategic goals such as mergers and acquisitions and fund raising.
The Compensation Committee will review each executive’s individual performance
and his or her contribution to our strategic goals periodically and determine
the amount of incentive compensation towards the end of the fiscal year. Our
Compensation Committee grants equity incentive compensation at times when we do
not have material non-public information to avoid timing issues and the
appearance that such awards are made based on any such information.
Determination
of Compensation
Our Chief
Executive Officer, Chief Financial Officer and head of Human Resources meet
frequently during the last several weeks of our fiscal year to evaluate each
non-executive employee’s performance and determine his or her compensation for
the following year.
The
following table sets forth the cash and other compensation paid by us in 2009 to
all individuals who served as our Chief Executive Officer and Chief Financial
Officer, who we collectively refer to as the named executive officers (“NEOs”).
No executive received total compensation greater than $100,000 in
2009.
SUMMARY COMPENSATION TABLE
|
Name
and
Principal
Position
|
Year
|
Salary
($)
|
Bonus
($)
|
Stock
Awards
($)
|
Option
Awards
($)
|
Total
($)
|
||||||||||||||||
|
Zhenggang
Wang, CEO
|
2009
|
$
|
73,820
|
-
|
-
|
-
|
$
|
73,820
|
||||||||||||||
|
2008
|
$
|
27,800
|
-
|
-
|
-
|
$
|
27,800
|
|||||||||||||||
|
2007
|
$
|
59,600
|
-
|
-
|
-
|
$
|
59,600
|
|||||||||||||||
|
Jian
Zhang, CFO (1)
|
2009
|
$
|
58,320
|
-
|
-
|
18,380
|
$
|
76,700
|
||||||||||||||
|
Weidong
Huang, Former CFO (2)
|
2009
|
$ |
11,150
|
-
|
-
|
-
|
$ |
11,150
|
||||||||||||||
|
2008
|
$
|
22,300
|
-
|
-
|
-
|
$
|
22,300
|
|||||||||||||||
|
2007
|
$
|
5,000
|
-
|
-
|
-
|
$
|
5,000
|
|||||||||||||||
41
(1) Jian
Zhang was appointed as Chief Financial Officer of the Company effective June 16,
2009. Valuation based on the dollar amount of option grants recognized for
financial statement reporting purposes pursuant to ASC 718.
(2) Weidong
Huang was appointed as Chief Financial Officer of the Company effective October
8, 2007 and resigned as our Chief Financial Officer and Director on June 15,
2009.
Grants
of Plan-Based Awards
No plan
based award was granted to any of the Company’s NEOs during the year ended
December 31, 2009, except for the grant of 100,000 options to purchase common
stock made to Jian Zhang on June 16, 2009.
Outstanding
Equity Awards At Fiscal Year-End
There
were no outstanding unexercised options, unvested stock or other equity
incentive plan awards held by any of the Company’s NEOs as of December 31, 2009,
except for the grant of 100,000 options to purchase common stock held by Jian
Zhang.
Option
Exercises And Stock Vested
There
were no exercises of stock options, stock appreciation rights and/or similar
investment nor was there any vesting of stock, restricted stock, restricted
stock units or similar instruments during the year ended December 31, 2009 for
any of the Company’s NEOs.
Pension
Benefits
We do not
sponsor any pension benefit plans.
Nonqualified
Deferred Compensation
We do not
maintain any non-qualified defined contribution or deferred compensation plans.
Our Compensation Committee, which is comprised solely of “outside directors” as
defined for purposes of Section 162(m) of the Internal Revenue Code, may elect
to provide our officers and other employees with non-qualified defined
contribution or deferred compensation benefits if the Compensation Committee
determines that doing so is in our best interests.
Potential
Payments Upon Termination or Change in Control
None.
Employment
Agreements
On June 16, 2009, the Company entered
into a letter agreement with Jian Zhang, our Chief Financial
Officer. The agreement provides for a monthly salary of $6,000. The
term of Mr. Zhang’s employment shall continue until terminated by either party
in accordance with the terms of the agreement. Mr. Zhang received an option
grant to purchase 100,000 shares of common stock of the Company upon execution
of the agreement and shall be entitled to receive option grants for 100,000
shares of common stock of the Company on each anniversary of the date of the
agreement provided that Mr. Zhang continues to serve as the Company’s Chief
Financial Officer on such date. The exercise price of the initial grant of
100,000 shares is $1.11, the closing price of the common stock of the Company on
June 16, 2009, and for each future option grant the exercise price will be the
closing price of the Company’s common stock on the anniversary of such date. All
option grants vest upon issuance and will have an exercise period of ten years
from the date of issuance so long as Mr. Zhang serves as the Company’s Chief
Financial Officer at such time. In the event Mr. Zhang no longer serves as the
Company’s Chief Financial Officer, the exercise period for all vested options
will be twenty-four months from his departure. Under the agreement, Mr. Zhang
will receive 14 vacation days per year. The agreement can be terminated by
either party on one month’s notice or one month’s salary in lieu of
notice.
42
On May 7,
2007, the BOD appointed Joseph J. Levinson to serve as a member of the BOD of
the Company and to be in charge of the Company’s investor relations. As
compensation for his services, Mr. Levinson received: (1) $60,000 per year,
payable in equal quarterly installments; (2) a monthly grant during his term of
service of 1,000 shares of the Company’s common stock; (3) an initial annual
grant of a stock option to purchase 300,000 shares of the Company’s common
stock, with an exercise price of $6.15 per share (the “2007 Stock Option”) under
the China 3C Group 2005 Equity Incentive Plan; and (4) a subsequent annual grant
of a stock option to purchase an additional 300,000 shares of the Company’s
common stock, with an exercise price of $1.82 (the “2008 Stock Option”) under
the China 3C Group 2005 Equity Incentive Plan. In addition, the Company agreed
that Mr. Levinson would receive (1) $2,500 for each Board meeting he attends,
(2) $2,000 for each meeting of a committee of the Board he attends, (3) $5,000
upon being named the chairman of any Board committee, and (4) $4,500 as a one
time bonus upon joining the Board. It was later determined that due
to the expiration of the China 3C Group 2005 Equity Incentive Plan on December
31, 2006, the 2007 Stock Option and the 2008 Stock Option were not validly
granted. Pursuant to the terms of the Compensation Agreement dated as of
November 27, 2008 between Mr. Levinson and the Company, Mr. Levinson
acknowledged that the 2007 Stock Option and the 2008 Stock Option were not and
will not be granted and in consideration for his services as a Director accepted
the issuance of 125,000 shares of the Company’s common stock. The
125,000 shares of the Company’s common stock were issued to Mr. Levinson on
January 7, 2009.
Compensation
of Directors
Messrs.
Berents and Levinson, prior to his resignation in January 2009, receive $2,500
per Board meeting they attend, $2,000 per meeting of a committee of the Board
they attend, and an annual fee of $5,000 for serving as a chairman of a Board
committee.
Upon
joining the BOD on December 8, 2006, Ken Berents entered into a BOD Agreement
with the Company, pursuant to which he receives an annual salary of $75,000
payable in monthly installments at the beginning of each month that Mr. Berents
is a member of the BOD. In addition, Mr. Berents receives an annual fee of
$5,000 for being named Chairman of the Audit Committee. Mr. Berents received an
option grant to purchase 50,000 shares of common stock of the Company upon
execution of his BOD Agreement and is entitled to receive 30,000 shares on each
anniversary of such date thereafter, provided Mr. Berents is a member of the BOD
at such time. The exercise price of the initial grant of 50,000 shares shall be
based on the closing price of the common stock of the Company on December 7,
2006 and for each future option grant the closing price of the Company common
stock on the anniversary of such date. All option grants will vest upon issuance
and will have an exercise period of ten years from date of issuance so long as
Mr. Berents is a member of the BOD at such time. In the event that Mr. Berents
is no longer a member of the BOD, his exercise period for all vested options
will be twenty-four months from the anniversary date of his departure from the
BOD.
The
following table summarizes compensation that our directors earned during 2009
for services as members of the Company’s Board.
DIRECTOR
COMPENSATION
|
Name
|
Fees
Earned or
Paid in
Cash
|
Stock
Awards
($)
|
Option
Awards
($) (1)
|
Non-Equity
Incentive
Plan
Compensation
($)
|
Change in
Pension
Value
and
Nonqualified
Deferred
Compensation
Earnings ($)
|
All
Other
Compensation
($)
|
Total
($)
|
|||||||||||||||||||||
|
Kenneth
T. Berents
|
$
|
73,750
|
-
|
$
|
3,675
|
(2)
|
-
|
-
|
-
|
$ |
77,425
|
|||||||||||||||||
|
Wei
Kang Gu
|
$
|
-
|
-
|
-
|
-
|
-
|
-
|
-
|
||||||||||||||||||||
|
Chenghua
Zhu
|
$
|
-
|
-
|
-
|
-
|
-
|
-
|
-
|
||||||||||||||||||||
|
Mingjun
Zhu
|
$
|
-
|
-
|
-
|
-
|
-
|
-
|
-
|
||||||||||||||||||||
|
Rongjin
Weng
|
$
|
-
|
-
|
-
|
-
|
-
|
-
|
-
|
||||||||||||||||||||
|
Joseph
J. Levinson (3)
|
$ |
-
|
-
|
-
|
-
|
-
|
-
|
-
|
||||||||||||||||||||
|
Total
|
$
|
73,750
|
$ |
3,675
|
-
|
-
|
-
|
$ |
77,425
|
|||||||||||||||||||
43
(1)
Valuation based on the dollar amount of option grants recognized for financial
statement reporting purposes pursuant to ASC 718.
(2) The
BOD Agreement dated December 8, 2006 between the Company and Mr. Berents,
provides for a stock option grant of 30,000 shares to be made to Mr. Berents in
December 2009 at an exercise price equivalent to the prevailing market price of
the stock on December 8, 2009, all of which options shall be vested and
exercisable as of December 8, 2009.
(3)
Joseph J. Levinson served as a member of the BOD from May 2007 until his
resignation in January 2009.
Compensation
Committee Interlocks and Insider Participation
During
2009 members of our Compensation Committee of the BOD were Mingjun Zhu and Wei
Kang Gu. No member of our Compensation Committee was, or has been, an officer or
employee of the Company or any of our subsidiaries.
No member
of the Compensation Committee has a relationship that would constitute an
interlocking relationship with executive officers or directors of the Company or
another entity.
Compensation
Committee Report (1)
The goal
of the Company’s executive compensation policy is to ensure that an appropriate
relationship exists between executive compensation and the creation of
stockholder value, while at the same time attracting, motivating and retaining
experienced executive officers.
The
Compensation Committee has reviewed and discussed the discussion and analysis of
the Company’s compensation which appears above with management, and, based on
such review and discussion, the Compensation Committee recommended to the
Company’s BOD that the above disclosure be included in this Annual Report on
Form 10-K.
The
members of the Compensation Committee are:
Mingjun
Zhu, Chairman
Wei Kang
Gu
(1)
The material in the above Compensation Committee reports is not
soliciting material, is not deemed filed with the SEC and is not incorporated by
reference in any filing of the Company under the Securities Act of 1933, or the
Securities Exchange Act of 1934, whether made before or after the date of this
Form 10-K and irrespective of any general incorporation language in such
filing.
ITEM 12. SECURITY OWNERSHIP OF CERTAIN
BENEFICIAL OWNERS AND MANAGEMENT AND RELATED STOCKHOLDER
MATTERS
44
The
following table sets forth certain information, as of April 15, 2010, concerning
shares of common stock of the Company, the only class of its securities that are
issued and outstanding, held by (1) each shareholder known by the Company
to own beneficially more than five percent of the common stock, (2) each
director of the Company, (3) each executive officer of the Company, and
(4) all directors and executive officers of the Company as a
group:
|
Amount and Nature
|
Percentage of
|
|||||||
|
of Beneficial
|
Common Stock
|
|||||||
|
Name and Address of Beneficial
Owner (1)
|
Ownership
|
(2)
|
||||||
|
Zhenggang
Wang
|
9,725,000
|
17.74
|
%
|
|||||
|
Jian
Zhang
|
100,000
|
*
|
||||||
|
Xiang
Ma
|
-
|
-
|
||||||
|
Chenghua
Zhu
|
-
|
-
|
||||||
|
Mingjun
Zhu
|
-
|
-
|
||||||
|
Rongjin
Weng
|
-
|
-
|
||||||
|
Wei
Kang Gu
|
-
|
-
|
||||||
|
Kenneth
T. Berents
|
145,000
|
(3)
|
*
|
|||||
|
All
directors and executive officers as a group (8 persons)
|
9,970,000
|
18.18
|
%
|
|||||
* Less
than One Percent.
|
(1)
|
Unless
otherwise indicated in the footnotes to the table, each shareholder shown
on the table has sole voting and investment power with respect to the
shares beneficially owned by him, her or it. Unless otherwise indicated in
the footnotes to the table, the address for each shareholder is c/o China
3C Group, 368 HuShu Nan Road, HangZhou City, Zhejiang Province, China
310014. Percentages of less than one percent have been omitted from the
table.
|
|
(2)
|
Calculated
on the basis of 54,831,327 shares of common stock issued and
outstanding as of April 15, 2010 except that shares of common stock
underlying options and warrants exercisable within 60 days of the date
hereof are deemed to be outstanding for purposes of calculating the
beneficial ownership of securities of the holder of such options or
warrants.
|
|
(3)
|
Represents
5,000 shares of common stock and 140,000 shares of common stock
issuable upon exercise of outstanding stock options (as described
above).
|
ITEM 13. CERTAIN RELATIONSHIPS AND RELATED
TRANSACTIONS, AND DIRECTOR INDEPENDENCE
Transactions
with Related Parties
There
have not been any transactions, or proposed transactions, during the last two
years, to which the Company was or is to be a party and the amount involved
exceeds $120,000, and in which any director or executive officer of the Company,
any nominee for election as a director, any security holder owning beneficially
more than five percent of the common stock of the Company, or any member of the
immediate family of the aforementioned persons had or is to have a direct or
indirect material interest.
Director
Independence
The
following members of the Company’s Board of Directors are “independent” under
Rule 4200(15) of the Nasdaq Stock Market listing standards: Rongjin Weng,
Weikang Gu, Mingjun Zhu, Chenghua Zhu and Kenneth Berents.
ITEM 14.
PRINCIPAL ACCOUNTANT FEES AND SERVICES
45
On
January 5, 2009, the Company, on the recommendation of the Audit Committee of
its Board of Directors, engaged Goldman Parks Kurland Mohidin LLP (“GPKM”) as
its independent registered public accounting firm. From April 20,
2006 to January 5, 2009 Morgenstern, Svoboda & Baer CPA’s P.C. (Morgenstern)
served as the Company’s independent registered public accounting
firm.
The
following represents fees for professional audit services rendered by GPKM and
Morgenstern for the fiscal years ended December 31, 2009 and 2008.
Audit
Fees
The
aggregate fees billed by our current auditors, GPKM, for professional services
rendered for the audit of our annual financial statements for the years ended
December 31, 2009 and 2008 was $218,000 and $150,000, respectively.
The
aggregate fees billed by Morgenstern for professional services rendered for the
audit of the Company’s annual and quarterly financial statements for the years
ended December 31, 2008 was $237,278.
Audit
Related Fees
We
incurred no audit related fees to GPKM during the years ended December 31, 2009
and 2008.
Tax
Fees
GPKM did
not render any services for tax compliance, tax advice and tax planning during
the years ended December 31, 2009 and 2008.
We incurred $3,500 tax fees to
Morgenstern during the year ended December 31, 2008.
All
Other Fees
GPKM and
Morgenstern did not bill us any additional fees that are not disclosed under
audit fees, audit related fees or tax fees during the years ended December 31,
2009 and 2008.
Audit
Committee Pre-Approval Process, Policies and Procedures
The Audit
Committee has adopted pre-approval policies for all services, including both
audit and non-audit services, provided by our independent
auditors. For audit services, each year the independent auditor
provides the Audit Committee with an engagement letter outlining the scope of
the audit services proposed to be performed during the year, which must be
formally accepted by the Audit Committee before the audit
commences. The independent auditor also submits an audit services fee
proposal, which also must be approved by the Committee before the audit
commences. The audit, tax, and all other fees and services described
above were pre-approved for 2008 and 2009.
PART
IV
ITEM 15. EXHIBITS, FINANCIAL STATEMENT
SCHEDULES
(a) The
following are filed with this Annual Report:
(1) The
financial statements listed on the Financial Statements Table of
Contents.
(2) Not
applicable.
(3) The
exhibits referred to below, which include the following managerial contracts or
compensatory plans or arrangements:
|
·
|
Compensation
Agreement, dated November 27, 2008, between China 3C Group and Joseph
Levinson.
|
46
|
·
|
Board
of Directors Agreement, dated December 8, 2006, among China 3C Group and
Kenneth T. Berents.
|
|
·
|
China
3C Group 2008 Omnibus Securities and Incentive
Plan.
|
|
·
|
Stock
Option Agreement Director Non-Qualified Stock Option, dated December 1,
2008 and effective as of January 15, 2009, between China 3C Group and
Kenneth Berents.
|
|
·
|
Stock
Option Agreement Director Non-Qualified Stock Option, dated December 1,
2008 and effective as of January 15, 2009, between China 3C Group and
Kenneth Berents.
|
|
·
|
Stock
Option Agreement Director Non-Qualified Stock Option, dated December 1,
2008 and effective as of January 15, 2009, between China 3C Group and
Kenneth Berents.
|
|
·
|
Stock
Option Agreement with Todd L. Mavis, dated April 21, 2009, between China
3C Group and Todd L. Mavis.
|
|
·
|
Agreement
dated May 3, 2007 between China 3C Group and Joseph
Levinson.
|
|
·
|
Letter
Agreement dated June 16, 2009 between China 3C Group and Jian
Zhang.
|
(b) The
exhibits listed on the Exhibit Index are filed as part of this Annual
Report.
(c) Not
applicable.
EXHIBIT
INDEX
|
Exhibit
No
|
Document
Description
|
||
|
3.1
|
Amended
and Restated Articles of Incorporation of the Registrant
(11)
|
||
|
3.2
|
By-laws
of the Registrant (1 )
|
||
|
4.1
|
China
3C Group Amended 2005 Equity Incentive Plan. (2 )
|
||
|
10.1
|
Stock
Purchase Agreement, dated as of October 17, 2005, by and among Sun Oil
& Gas, Inc., EH&P Investments, John D. Swain, Fred Holcapek, PH
Holding Group, Ma Cheng Ji, Zhou Wei, Zeng Xiu Lan, Gu Xiao Dong,
Jacksonville Management Limited, Colin Wilson, Alliance Capital
Management, Inc., Hanzhong Fang and China U.S. Bridge Capital, Limited
(3)
|
||
|
10.2
|
Consulting
Services Agreement dated as of November 1, 2005 between Capital
Development Limited and Zhejiang Yong Xing Digital Technology Company
Limited (4 )
|
||
|
10.3
|
Operating
Agreement dated as of November 1, 2005 between Capital Development Limited
and Zhejiang Yong Xing Digital Technology Company Limited (4
)
|
||
|
10.4
|
Proxy
and Voting Agreement dated as of November 1, 2005 between Capital
Development Limited and Zhejiang Yong Xing Digital Technology Company
Limited (4 )
|
||
|
10.5
|
Option
Agreement dated as of November 1, 2005 between Capital Development Limited
and Zhejiang Yong Xing Digital Technology Company Limited (4
)
|
||
|
10.6
|
Equity
Pledge Agreement dated as of November 1, 2005 between Capital Development
Limited and Zhejiang Yong Xing Digital Technology Company Limited (4
)
|
||
|
10.7
|
Subscription
Agreement, dated as of December 20, 2005, between the Registrant and Huiqi
Xu. (5 )
|
||
|
10.8
|
Consulting
Agreement, dated as of December 20, 2005, among the Registrant, Wen-An
Chen and Huoqing Yang. (5 )
|
||
|
10.9
|
Guarantee
Contract between the Registrant and Shenzhen Shiji Ruicheng Guaranty and
Investment Company Limited, dated as of December 21, 2005. (6
)
|
||
|
10.10
|
Agreement
and Plan of Merger, dated as of December 21, 2005, among the Registrant,
YX Acquisition Corporation, Capital Future Development Limited, Zhenggang
Wang, Yimin Zhang, Weiyi Lv, Xiaochun Wang, Zhongsheng Bao, Simple
(Hongkong) Investment & Management Company Limited, First Capital
Limited, Shenzhen Dingyi Investment & Consulting Limited and China US
Bridge Capital Limited. (6 )
|
||
|
10.11
|
Form
of Promissory Note dated December 21, 2005. (6 )
|
|
10.12
|
Share
Exchange Agreement, dated as of November 28, 2006, among China 3C Group,
Capital Future Development Limited (“CFDL”), Shanghai Joy & Harmony
Electronics Company Limited, and the shareholders of CFDL. (7
)
|
47
|
10.13
|
Form
of Securities Purchase Agreement, dated July 13, 2007, by and among the
Registrant and certain subscribers (8 )
|
||
|
10.14
|
Letter
of Intent for Strategic Partnership, dated November 22, 2007, between the
Registrant’s subsidiary Zhejiang Yongxin Technology Limited and Hangzhou
Xituo Network Technology Company (9 )
|
||
|
10.15
|
Consignment
Agreement, dated January 2, 2008, between the Registrant’s subsidiary
Hangzhou Shan He Electric Company Limited and Hangzhou Lotour Digital
Products Business Company Limited (10 )
|
||
|
16
|
Consignment
Agreement, dated January 3, 2008, between the Registrant’s subsidiary
Hangzhou Wang Da Electric Company Limited and Hangzhou Lotour Digital
Products Business Company Limited (10 )
|
||
|
10.17
|
Acquisition
Agreement dated December 19, 2008 by and among Zhejiang Yong Xing Digital
Technology Company Limited, Yiwu Yong Xin Communication Limited Jinhua
Baofa Logistic Limited and the shareholders of Jinhua Baofa Logistic
Limited (12)
|
||
|
10.18
|
Amendment
to Acquisition Agreement dated April 4, 2009 by and among Zhejiang Yong
Xing Digital Technology Company Limited, Yiwu Yong Xin Communication
Limited and the shareholders of Jinhua Baofa Logistic Limited
(13)
|
||
|
10.19
|
Compensation
Agreement, dated November 27, 2009, between China 3C Group and Joseph
Levinson (14)
|
||
|
10.20
|
Board
of Directors Agreement, dated December 8, 2006, among China 3C Group and
Kenneth T. Berents (15)
|
||
|
10.21
|
China
3C Group 2008 Omnibus Securities and Incentive Plan (16)
|
||
|
10.22
|
Stock
Option Agreement Director Non-Qualified Stock Option, dated December 1,
2008 and effective as of January 15, 2009, between China 3C Group and
Kenneth Berents (16)
|
||
|
10.23
|
Stock
Option Agreement Director Non-Qualified Stock Option, dated December 1,
2008 and effective as of January 15, 2009, between China 3C Group and
Kenneth Berents (16)
|
||
|
10.24
|
Stock
Option Agreement Director Non-Qualified Stock Option, dated December 1,
2008 and effective as of January 15, 2009, between China 3C Group and
Kenneth Berents (16)
|
||
|
10.25
|
Stock
Option Agreement with Todd L. Mavis, dated April 21, 2009, between China
3C Group and Todd L. Mavis (16)
|
||
|
10.26
|
Agreement
dated May 3, 2007 between China 3C Group and Joseph Levinson
(16)
|
||
|
10.27
|
Letter
Agreement dated June 16, 2009 between China 3C Group and Jian Zhang
(17)
|
||
|
14.1
|
Code
of Business Conduct and Ethics (11)
|
||
|
21.1
|
List
of Subsidiaries, filed herewith
|
||
| 23.1 |
Consent
of Goldman Parks Kurland Mohidin LLP, an independent registered public
accounting firm, filed herewith.
|
||
|
31.1
|
Certification
of Principal Executive Officer pursuant to Rule 13A-14(A)/15D-14(A) of the
Securities Exchange Act of 1934, as adopted pursuant to Section 302 of the
Sarbanes-Oxley Act of 2002, filed herewith.
|
||
|
31.2
|
Certification
of the Principal Accounting and Financial Officer pursuant to Rule
13A-14(A)/15D-14(A) of the Securities Exchange Act of 1934, as adopted
pursuant to Section 302 of the Sarbanes-Oxley Act of 2002, filed
herewith.
|
||
|
32.1
|
Certification
of Principal Executive Officer Pursuant to 18 U.S.C. 1350 (Section 906 of
the Sarbanes-Oxley Act of 2002), filed herewith.
|
||
|
32.2
|
Certification
of Principal Accounting and Financial Officer Pursuant to 18 U.S.C. 1350
(Section 906 of the Sarbanes-Oxley Act of 2002), filed
herewith.
|
|
(1)
|
Incorporated
by reference from the Registrant’s Current Report filed with the SEC on
Form 8-K on January 3, 2007.
|
|
(2)
|
Incorporated
by reference from the Registrant’s Registration Statement on Form S-8
(File No. 333-141173) dated March 9,
2007.
|
|
(3)
|
Incorporated
by reference from the Registrant’s Current Report filed with the SEC on
Form 8-K on October 21, 2005.
|
|
(4)
|
Incorporated
by reference from the Registrant’s Current Report filed with the SEC on
Form 8-K on September 11, 2007.
|
|
(5)
|
Incorporated
by reference from the Registrant’s Current Report filed with the SEC on
Form 8-K on December 20, 2005.
|
|
(6)
|
Incorporated
by reference from the Registrant’s Current Report filed with the SEC on
Form 8-K on December 22, 2005.
|
|
(7)
|
Incorporated
by reference from the Registrant’s Current Report filed with the SEC on
Form 8-K on December 11, 2006.
|
48
|
(8)
|
Incorporated
by reference from the Registrant’s Current Report filed with the SEC on
Form 8-K on July 17, 2007.
|
|
(9)
|
Incorporated
by reference from the Registrant’s Current Report filed with the SEC on
Form 8-K on November 28, 2007.
|
|
(10)
|
Incorporated
by reference from the Registrant’s Current Report filed with the SEC on
Form 8-K on January 17, 2008.
|
|
(11)
|
Incorporated
by reference from the Registrant’s Annual Report filed with the SEC on
Form 10-K on March 27, 2008.
|
|
(12)
|
Incorporated
by reference from the Registrant’s Current Report filed with the SEC on
Form 8-K on December 29, 2008.
|
|
(13)
|
Incorporated
by reference from the Registrant’s Current Report filed with the SEC on
Form 8-K on April 9, 2009.
|
|
(14)
|
Incorporated
by reference from the Registrant’s Annual Report filed with the SEC on
Form 10-K on April 16, 2009.
|
|
(15)
|
Incorporated
by reference from the Registrant’s Current Report filed with the SEC on
Form 8-K on December 14, 2006.
|
|
(16)
|
Incorporated
by reference from the Registrant’s Registration Statement on Form S-8
(File No. 333-159200) dated May 13,
2009.
|
|
(17)
|
Incorporated
by reference from the Registrant’s Current Report filed with the SEC on
Form 8-K on June 22, 2009.
|
Pursuant
to the requirements of Section 13 or 15(d) of the Securities and Exchange Act of
1934, the Company has duly caused this report to be signed on its behalf by the
undersigned, thereunto duly authorized, on this 15th day of
April 2010.
|
CHINA
3C GROUP
|
|||
|
/s/
Zhenggang Wang
|
|||
|
Zhenggang
Wang
|
|||
|
Chief
Executive Officer and Chairman
(Principal
Executive Officer)
|
|||
Pursuant
to the requirements of the Securities Exchange Act of 1934, this amended report
has been signed below by the following persons on behalf of the Company and in
the capacities indicated below and on the dates indicated.
|
Signatures
|
Title
|
Date
|
||
|
/s/
Zhenggang Wang
|
April
15, 2010
|
|||
|
Zhenggang
Wang
|
Chief
Executive Officer and
|
|||
|
Chairman
(Principal Executive
|
||||
|
Officer)
|
||||
|
/s/
Xiang Ma
|
||||
|
Xiang
Ma
|
President
|
April
15, 2010
|
||
|
/s/
Jian Zhang
|
||||
|
Jian
Zhang
|
Chief
Financial Officer (Principal
|
April
15, 2010
|
||
|
Accounting
and Financial Officer)
|
||||
|
/s/
Chenghua Zhu
|
||||
|
Chenghua
Zhu
|
Director
|
April
15, 2010
|
||
|
/s/
Mingjun Zhu
|
||||
|
Mingjun
Zhu
|
Director
|
April
15, 2010
|
||
|
/s/
Rongjin Weng
|
||||
|
Rongjin
Weng
|
Director
|
April
15, 2010
|
||
|
/s/
Wei Kang Gu
|
||||
|
Wei
Kang Gu
|
Director
|
April
15, 2010
|
||
|
/s/
Kenneth T. Berents
|
||||
|
Kenneth
T. Berents
|
Director
|
April
15, 2010
|
CHINA
3C GROUP AND SUBSIDIARIES
CONSOLIDATED
FINANCIAL STATEMENTS
DECEMBER
31, 2009
|
Report
of Independent Registered Public Accounting Firm
|
F-1
|
||
|
Report
of Independent Registered Public Accounting Firm
|
F-2
|
||
|
Consolidated
Balance Sheets
|
F-3
|
||
|
Consolidated
Statements of Income
|
F-4
|
||
|
Consolidated
Statements of Stockholders’ Equity
|
F-5
|
||
|
Consolidated
Statements of Cash Flows
|
F-6
|
||
|
Notes
to Consolidated Financial Statements
|
F-7
- F-19
|
Report
of Independent Registered Public Accounting Firm
Board of
Directors and Shareholders of China 3C Group:
We have
audited the accompanying consolidated balance sheets of China 3C Group (the
“Company” ) and subsidiaries as of December 31, 2009 and 2008 and the related
consolidated statements of income and other comprehensive income, shareholders’
equity, and cash flows for the years ended December 31, 2009 and 2008. These
consolidated financial statements are the responsibility of the Company’s
management. Our responsibility is to express an opinion on these consolidated
financial statements based on our audits.
We
conducted our audits in accordance with the standards of the Public Company
Accounting Oversight Board (United States). Those standards require that we plan
and perform the audits to obtain reasonable assurance about whether the
consolidated financial statements are free of material misstatement. The Company
is not required to have an audit of internal control over financial reporting.
Our audit included consideration of internal control over financial reporting as
a basis for designing audit procedures that are appropriate in the
circumstances, but not for the purpose of expressing an opinion on the
effectiveness of the Company’s internal control over financial reporting.
Accordingly, we express no such opinion. An audit includes examining, on a test
basis, evidence supporting the amounts and disclosures in the financial
statements. An audit also includes assessing the accounting principles used and
significant estimates made by management, as well as evaluating the overall
consolidated financial statement presentation. We believe that our audits
provides a reasonable basis for our opinion.
In our
opinion, the consolidated financial statements referred to above present fairly,
in all material respects, the consolidated financial position of China 3C Group
and Subsidiaries as of December 31, 2009 and 2008 and the consolidated results
of their operations and their consolidated cash flows for the years ended
December 31, 2009 and 2008, in conformity with U.S. generally accepted
accounting principles.
Goldman
Park Kurland Mohidin
Encino,
California
April 13,
2010
F-1
|
CHINA
3C GROUP
|
|
CONSOLIDATED
BALANCE SHEETS
|
|
(in
thousands)
|
|
December
31,
|
December
31,
|
|||||||
|
2009
|
2008
|
|||||||
|
ASSETS
|
||||||||
|
Current
assets:
|
||||||||
|
Cash
and equivalents
|
$ | 29,908 | $ | 32,158 | ||||
|
Accounts
receivable, net
|
18,232 | 23,725 | ||||||
|
Inventories
|
6,764 | 8,971 | ||||||
|
Advances
to suppliers
|
2,370 | 2,491 | ||||||
|
Tax
receivale
|
1,157 | - | ||||||
|
Prepaid
expenses and other current assets
|
294 | 88 | ||||||
|
Total
current assets
|
58,725 | 67,433 | ||||||
|
Property,
plant and equipment, net
|
279 | 64 | ||||||
|
Goodwill
|
20,820 | 20,348 | ||||||
|
Intangible
asset, net
|
14,557 | - | ||||||
|
Deposit
for acquisition of subsidiary
|
- | 7,319 | ||||||
|
Refundable
deposits
|
15 | 32 | ||||||
|
Total
assets
|
$ | 94,396 | $ | 95,196 | ||||
|
LIABILITIES
AND STOCKHOLDERS' EQUITY
|
||||||||
|
Current
liabilities:
|
||||||||
|
Accounts
payable and accrued expenses
|
$ | 6,838 | $ | 5,417 | ||||
|
Income
tax payable
|
938 | 2,141 | ||||||
|
Total
liabilities
|
7,776 | 7,558 | ||||||
|
Stockholders'
equity
|
||||||||
|
Common
stock, $0.001 par value, 100,000,000 million shares authorized, 54,831,327
and 52,696,327 issued and outstanding as of December 31, 2009 and 2008,
respectively
|
55 | 53 | ||||||
|
Additional
paid-in capital
|
19,751 | 19,466 | ||||||
|
Subscription
receivable
|
(50 | ) | (50 | ) | ||||
|
Statutory
reserve
|
11,535 | 11,109 | ||||||
|
Other
comprehensive income
|
5,180 | 5,272 | ||||||
|
Retained
earnings
|
50,149 | 51,788 | ||||||
|
Total
stockholders' equity
|
86,620 | 87,638 | ||||||
|
Total
liabilities and stockholders' equity
|
$ | 94,396 | $ | 95,196 | ||||
|
The
accompanying notes are an integral part of these consolidated financial
statements.
|
F-2
|
CHINA
3C GROUP
|
|
CONSOLIDATED
STATEMENTS OF OPERATIONS
|
|
(in
thousands, except share
amounts)
|
|
2009
|
2008
|
2007
|
||||||||||
|
Net
sales
|
$ | 208,489 | $ | 310,644 | $ | 276,027 | ||||||
|
Cost
of sales
|
187,476 | 262,003 | 226,656 | |||||||||
|
Gross
profit
|
21,013 | 48,641 | 49,371 | |||||||||
|
Selling,
general and administrative expenses
|
21,621 | 14,132 | 13,615 | |||||||||
|
Income
from operations
|
(608 | ) | 34,509 | 35,756 | ||||||||
|
Other
(income) expense
|
||||||||||||
|
Interest
income
|
(109 | ) | (146 | ) | (88 | ) | ||||||
|
Other
income
|
(163 | ) | (1,150 | ) | - | |||||||
|
Other
expense
|
163 | 360 | 74 | |||||||||
|
Total
other (income) expense
|
(109 | ) | (936 | ) | (14 | ) | ||||||
|
Income
before income taxes
|
(499 | ) | 35,445 | 35,770 | ||||||||
|
Provision
for income taxes
|
714 | 8,611 | 12,850 | |||||||||
|
Net
income (loss)
|
$ | (1,213 | ) | $ | 26,834 | $ | 22,920 | |||||
|
Foreign
currency translation adjustments
|
92 | 3,400 | 428 | |||||||||
|
Comprehensive
income (Loss)
|
$ | (1,121 | ) | $ | 30,234 | $ | 23,348 | |||||
|
Net
income (loss) available to common shareholders per share:
|
||||||||||||
|
Basic
and Diluted
|
$ | (0.02 | ) | $ | 0.51 | $ | 0.44 | |||||
|
Weighted
average shares outstanding:
|
||||||||||||
|
Basic
and Diluted
|
53,867,890 | 52,673,938 | 52,671,438 | |||||||||
|
The
accompanying notes are an integral part of these consolidated financial
statements.
|
F-3
|
CHINA
3C GROUP AND SUBSIDIARIES
|
|
CONSOLIDATED
STATEMENTS OF STOCKHOLDERS’ EQUITY
|
|
YEARS
ENDED DECEMBER 31, 2009, 2008 and 2007
|
|
(in
thousands)
|
|
Additional
|
Other
|
|||||||||||||||||||||||||||||||
|
Common
Stock
|
Paid-In
|
Subscription
|
Statutory
|
Comprehensive
|
Retained
|
Total
Stockholders'
|
||||||||||||||||||||||||||
|
Shares
|
Amount
|
Capital
|
Receivable
|
Reserve
|
Income
|
Earnings
|
Equity
|
|||||||||||||||||||||||||
|
Balance
at December 31, 2006
|
52,489 | $ | 53 | $ | 17,353 | $ | (50 | ) | $ | 3,320 | $ | 427 | $ | 9,823 | $ | 30,926 | ||||||||||||||||
|
Stock
based compensation
|
185 | - | 2,113 | - | - | - | - | 2,113 | ||||||||||||||||||||||||
|
Foreign
currency translation adjustments
|
- | - | - | - | - | 1,445 | - | 1,445 | ||||||||||||||||||||||||
|
Transfer
to statutory reserve
|
- | - | - | - | 3,914 | (3,914 | ) | - | ||||||||||||||||||||||||
|
Net
income
|
- | - | - | - | - | - | 22,920 | 22,920 | ||||||||||||||||||||||||
|
Balance
at December 31, 2007
|
52,674 | 53 | 19,466 | (50 | ) | 7,234 | 1,872 | 28,829 | 57,404 | |||||||||||||||||||||||
|
Foreign
currency translation adjustments
|
- | - | - | - | - | 3,400 | - | 3,400 | ||||||||||||||||||||||||
|
Transfer
to statutory reserve
|
- | - | - | - | 3,875 | - | (3,875 | ) | - | |||||||||||||||||||||||
|
Net
income
|
- | - | - | - | - | - | 26,834 | 26,834 | ||||||||||||||||||||||||
|
Balance
at December 31, 2008
|
52,674 | 53 | 19,466 | (50 | ) | 11,109 | 5,272 | 51,788 | 87,638 | |||||||||||||||||||||||
|
Foreign
currency translation adjustments
|
- | - | - | - | - | (92 | ) | - | (92 | ) | ||||||||||||||||||||||
|
Issuance
of common stock for compensation
|
1,997 | 2 | 285 | - | - | - | - | 287 | ||||||||||||||||||||||||
|
Issuance
of common stock in consideration of the cancelled stock
options
|
160 | - | - | - | - | - | - | - | ||||||||||||||||||||||||
|
Transfer
to statutory reserve
|
- | - | - | - | 426 | - | (426 | ) | - | |||||||||||||||||||||||
|
Net
income
|
- | - | - | - | - | - | (1,213 | ) | (1,213 | ) | ||||||||||||||||||||||
|
Balance
at December 31, 2009
|
54,831 | $ | 55 | $ | 19,751 | $ | (50 | ) | $ | 11,535 | $ | 5,180 | $ | 50,149 | $ | 86,620 | ||||||||||||||||
|
The
accompanying notes are an integral part of these consolidated financial
statements.
|
F-4
|
CHINA
3C GROUP
|
|
CONSOLIDATED
STATEMENTS OF CASH FLOWS
|
|
(in
thousands)
|
|
2009
|
2008
|
2007
|
||||||||||
|
Operating
activities:
|
||||||||||||
|
Net
income (loss)
|
$ | (1,213 | ) | $ | 26,834 | $ | 22,920 | |||||
|
Adjustments
to reconcile net loss to net cash
|
||||||||||||
|
provided
by (used in) operating activities:
|
||||||||||||
|
Depreciation
|
614 | 36 | 41 | |||||||||
|
Amortization
of intangible assets
|
698 | - | - | |||||||||
|
Gain
on asset disposition
|
- | (2 | ) | - | ||||||||
|
Provision
for bad debts
|
- | 262 | 9 | |||||||||
|
Stock
based compensation
|
287 | 337 | 2,113 | |||||||||
|
(Increase)/decrease
in assets
|
||||||||||||
|
Accounts
receivable
|
5,472 | (14,630 | ) | (74 | ) | |||||||
|
Tax
receivable
|
(1,157 | ) | - | |||||||||
|
Other
receivable
|
(64 | ) | - | (3,946 | ) | |||||||
|
Inventories
|
2,199 | (1,732 | ) | |||||||||
|
Prepaid
expenses and other current assets
|
(142 | ) | (4 | ) | (323 | ) | ||||||
|
Advance
to supplier
|
119 | 247 | (356 | ) | ||||||||
|
Refundable
deposits
|
17 | 11 | (42 | ) | ||||||||
|
(Increase)
/ decrease in current liabilities
|
||||||||||||
|
Accounts
payable and accrued expenses
|
1,482 | 1,867 | 1,144 | |||||||||
|
Income
tax payable
|
(1,200 | ) | (536 | ) | 88 | |||||||
|
Net
cash provided by operating activities
|
7,112 | 12,690 | 21,574 | |||||||||
|
CASH
FLOW FROM INVESTING ACTIVITIES:
|
||||||||||||
|
Purchase
of property and equipment
|
(806 | ) | (11 | ) | (64 | ) | ||||||
|
Proceeds
from asset sales
|
- | 2 | - | |||||||||
|
Payments
for acquisition of subsidiary
|
(7,784 | ) | (7,318 | ) | - | |||||||
|
Net
cash (used in) investing activities
|
(8,590 | ) | (7,327 | ) | (64 | ) | ||||||
|
CASH
FLOW FROM FINANCING ACTIVITIES:
|
||||||||||||
|
Payments
of acquisition notes - net of cash acquired
|
- | - | (4,500 | ) | ||||||||
|
Net
cash used in financing activities
|
- | - | (4,500 | ) | ||||||||
|
Effect
of exchange rate changes on cash and cash equivalents
|
(772 | ) | 1,842 | 1,445 | ||||||||
|
Net
increase (decrease) in cash
|
(2,250 | ) | 7,205 | 18,455 | ||||||||
|
Cash,
beginning of year
|
32,158 | 24,953 | 6,498 | |||||||||
|
Cash,
end of year
|
$ | 29,908 | $ | 32,158 | $ | 24,953 | ||||||
|
Supplemental
disclosure of cash flow information:
|
||||||||||||
|
Interest
paid
|
$ | - | $ | - | $ | - | ||||||
|
Income
taxes paid
|
$ | 3,073 | $ | 9,155 | $ | 12,762 | ||||||
|
The
accompanying notes are an integral part of these consolidated financial
statements.
|
F-5
CHINA
3C GROUP AND SUBSIDIARIES
NOTES
TO CONSOLIDATED FINANCIAL STATEMENTS
DECEMBER
31, 2009 AND 2008
Note
1 - ORGANIZATION
China 3C
Group (the “Company” or “China 3C”) was incorporated on August 20, 1998 under
the laws of the State of Nevada. Capital Future Developments Limited - BVI
(“Capital”) was incorporated on July 22, 2004 under the laws of the British
Virgin Islands. Zhejiang Yong Xin Digital Technology Company Limited
(“Zhejiang”), Yiwu Yong Xin Communication Limited (“Yiwu”), Hangzhou Wang Da
Electronics Company Limited (“Wang Da”), Hangzhou Sanhe Electronic Technology
Limited (“Sanhe”), and Shanghai Joy & Harmony Electronics Company Limited
(“Joy & Harmony”) were incorporated under the laws of Peoples Republic of
China on July 11, 2005, July 18, 1997, March, 30, 1998, April 12, 2004, and
August 20, 2003, respectively.
On
December 21, 2005, Capital became a wholly owned subsidiary of China 3C Group
through a reverse merger (“Merger Transaction”). China 3C Group acquired all of
the issued and outstanding capital stock of Capital pursuant to a Merger
Agreement dated at December 21, 2005 by and among China 3C Group, XY Acquisition
Corporation, Capital and the shareholders of Capital (the “Merger Agreement”).
Pursuant to the Merger Agreement, Capital became a wholly owned subsidiary of
China 3C Group and, in exchange for the Capital shares, China 3C Group issued
35,000,000 shares of its common stock to the shareholders of Capital,
representing 93% of the issued and outstanding capital stock of China 3C Group
at that time and cash of $500,000.
On August
3, 2006, Capital completed the acquisition of a 100% interest in Sanhe for a
cash and stock transaction valued at approximately $8.75 million. The
consideration consisted of 915,751 newly issued shares of the Company’s common
stock and $5 million in cash.
On
November 28, 2006, Capital completed the acquisition of a 100% interest in Joy
& Harmony for a cash and stock transaction valued at approximately $18.5
million. The consideration consisted of 2,723,110 shares of the Company’s common
stock and $7.5 million in cash.
On August 15, 2007, the Company changed
its ownership structure. As a result, instead of Capital owning 100% of
Zhejiang, Capital entered into contractual agreements with Zhejiang whereby
Capital owns a 100% interest in the revenues of Zhejiang. Capital does not have
an equity interest in Zhejiang, but enjoys all the economic benefits. Under this
structure, Zhejiang is now a wholly foreign owned enterprise of Capital. The
contractual agreements give Capital and its equity owners an obligation, and
having ability to absorb, any losses, and rights to receive returns. Capital
will be unable to make significant decisions about the activities of Zhejiang
and cannot carry out its principal activities without financial support. These
characteristics as defined in Accounting Standards Codification (“ASC”) 810,
Consolidation of Variable Interest Entities (VIEs), qualify the business
operations of Zhejiang to be consolidated with Capital and ultimately with China
3C.
Acquisitions
On July
6, 2009, China 3C and its subsidiary Zhejiang and Yiwu purchased 100% interest
of Jinhua for RMB 120 million (approximately $17.5 million) in cash.
Zhejiang acquired 90% and Yiwu acquired 10% of the entire equity interests
in Jinhua.
Jinhua
provides transportation logistics services to businesses. Jinhua operates
primarily in Eastern China and covers many of the most developed cities in the
Eastern China such as Shanghai, Hangzhou and Nanjing.
The
purchase price and related allocation to the estimated fair values of the assets
acquired and liabilities assumed, after proportionately allocating the goodwill
resulting from the transaction in accordance with ASC 805 “Business
Combinations” is as follows:
|
Cash
paid for acquisition of Jinhua
|
$
|
17,508
|
||
|
Assets
acquired :
|
||||
|
Cash
|
$
|
2,406
|
||
|
Accounts
receivable, net
|
715
|
|||
|
Other
receivables, net
|
60
|
|||
|
Prepaid
expenses
|
133
|
|||
|
Property,
plant and equipment
|
216
|
|||
|
Intangible
asset - transportation network
|
15,182
|
|||
|
Goodwill
|
472
|
|||
|
Assets
acquired
|
19,184
|
|||
|
Liabilities
assumed:
|
||||
|
Accounts
payable
|
315
|
|||
|
Accrued
expenses and other payables
|
547
|
|||
|
Income
taxes payable
|
-
|
|||
|
Due
to shareholders
|
814
|
|||
|
Liabilities
assumed
|
1,676
|
|||
|
Net
assets acquired
|
$
|
17,508
|
F-6
UNAUDITED
PRO FORMA CONDENSED CONSOLIDATED FINANCIAL STATEMENTS
The
accompanying unaudited pro forma condensed consolidated balance sheet as of
December 31, 2009 and the accompanying unaudited pro forma condensed
consolidated statements of income for the years ended December 31, 2009 and 2008
gives effect to the acquisition as if it had been consummated
on January 1, 2008.
The
unaudited pro forma condensed consolidated financial statements should be read
in conjunction with the historical financial statements of Jinhua as well as
China 3C’s Form 10-K for the year ended December 31, 2008. The unaudited
pro forma condensed consolidated financial statements do not purport to be
indicative of the financial position or results of operations that would have
actually been obtained had such transactions been completed as of the assumed
dates and for the periods presented, or which may be obtained in the future. The
pro forma adjustments are described in the accompanying notes and are based upon
available information and certain assumptions that China 3C believes are
reasonable.
F-7
CHINA
3C GROUP AND SUBSIDIARIES
UNAUDITED
PRO FORMA CONDENSED CONSOLIDATED BALANCE SHEET
AS
OF DECEMBER 31, 2009
(IN
THOUSANDS)
|
Historical
|
Pro
Forma
|
PRO
|
|||||||||||||||
|
China
3C
|
Jinhua
|
Adjustments
|
FORMA
|
||||||||||||||
|
ASSETS
|
|||||||||||||||||
|
Current
assets:
|
|||||||||||||||||
|
Cash
and equivalents
|
$ | 26,495 | $ | 3,413 | $ | (17,508 | ) |
(a)
|
$ | 12,400 | |||||||
|
Accounts
receivable
|
17,470 | 762 | - | 18,232 | |||||||||||||
|
Inventories
|
6,764 | - | - | 6,764 | |||||||||||||
|
Advances
to suppliers
|
2,370 | - | - | 2,370 | |||||||||||||
|
Tax
receivable
|
1,157 | - | 1,157 | ||||||||||||||
|
Prepaid
expenses and other current assets
|
8 | 160 | (16 | ) |
(b)
|
152 | |||||||||||
|
Other
receivables
|
53 | 89 | - | 142 | |||||||||||||
|
Total
current assets
|
54,317 | 4,424 | (17,524 | ) | 41,217 | ||||||||||||
|
Property,
plant and equipment, net
|
256 | 155 | 23 |
(b)
|
434 | ||||||||||||
|
Intangible
asset - transportation network
|
65 | - | 13,186 |
(c)(f)
|
13,251 | ||||||||||||
|
Goodwill
|
20,527 | 179 | 318 |
(e)
|
21,024 | ||||||||||||
|
Investment
in subsidiary
|
17,508 | - | - | 17,508 | |||||||||||||
|
Refundable
deposits
|
15 | - | - | 15 | |||||||||||||
|
Total
assets
|
$ | 92,688 | $ | 4,758 | $ | (3,997 | ) | $ | 93,449 | ||||||||
|
LIABILITIES
AND STOCKHOLDERS' EQUITY
|
|||||||||||||||||
|
Current
liabilities:
|
|||||||||||||||||
|
Accounts
payable and accrued expenses
|
$ | 5,854 | $ | 984 | $ | - | $ | 6,838 | |||||||||
|
Taxes
payable
|
52 | 886 | - | 938 | |||||||||||||
|
Total
current liabilities
|
5,906 | 1,870 | - | 7,776 | |||||||||||||
|
Stockholders'
equity:
|
|||||||||||||||||
|
Common
stock
|
55 | 205 | (205 | ) |
(d)
|
55 | |||||||||||
|
Additional
paid in capital
|
19,751 | 128 | (128 | ) |
(d)
|
19,751 | |||||||||||
|
Subscription
receivable
|
(50 | ) | - | - |
(d)
|
(50 | ) | ||||||||||
|
Statutory
reserve
|
11,239 | 721 | (424 | ) |
(d)
|
11,536 | |||||||||||
|
Accumulated
other comprehensive income
|
5,252 | 54 | (51 | ) |
(d)
|
5,255 | |||||||||||
|
Retained
earnings
|
50,535 | 1,780 | (3,189 | ) |
(d)(f)
|
49,126 | |||||||||||
|
Total
stockholders' equity
|
86,782 | 2,888 | (3,997 | ) | 85,673 | ||||||||||||
|
Total
liabilities and stockholders' equity
|
$ | 92,688 | $ | 4,758 | $ | (3,997 | ) | $ | 93,449 | ||||||||
See accompanying notes to Unaudited Pro
Forma Condensed Consolidated Financial Statements.
F-8
CHINA
3C GROUP AND SUBSIDIARIES
UNAUDITED
PRO FORMA CONDENSED CONSOLIDATED STATEMENTS OF INCOME AND COMPREHENSIVE
INCOME
YEAR
ENDED DECEMBER 31, 2009
(IN
THOUSANDS)
|
Pro
Forma
|
PRO
|
||||||||||||||||
|
Historical
|
Adjustments
|
FORMA
|
|||||||||||||||
|
China
3C
|
Jinhua
|
||||||||||||||||
|
Net
sales
|
$ | 202,917 | $ | 11,332 | $ | - | $ | 214,249 | |||||||||
|
Cost
of sales
|
183,616 | 7,732 | - | 191,348 | |||||||||||||
|
Gross
profit
|
19,301 | 3,600 | - | 22,901 | |||||||||||||
|
Selling,
general and administrative expenses
|
21,006 | 1,223 | 1,465 |
(f)
|
23,694 | ||||||||||||
|
Income
from operations
|
(1,705 | ) | 2,377 | (1,465 | ) | (793 | ) | ||||||||||
|
Other
(income) expense
|
|||||||||||||||||
|
Interest
income
|
(103 | ) | (8 | ) | 35 |
(g)
|
(76 | ) | |||||||||
|
Other
income
|
(163 | ) | (1 | ) | - | (164 | ) | ||||||||||
|
Other
expense
|
147 | 22 | - | 169 | |||||||||||||
|
Total
other (income) expense
|
(119 | ) | 13 | 35 | (71 | ) | |||||||||||
|
Income
before income taxes
|
(1,586 | ) | 2,364 | (1,500 | ) | (722 | ) | ||||||||||
|
Income
tax expenses (benefit)
|
487 | 547 | (375 | ) |
(h)
|
659 | |||||||||||
|
Net
income (loss)
|
(2,073 | ) | 1,817 | (1,125 | ) | (1,381 | ) | ||||||||||
|
Foreign
currency translation adjustments
|
(117 | ) | 25 | - | (92 | ) | |||||||||||
|
Comprehensive
loss
|
$ | (2,190 | ) | $ | 1,842 | $ | (1,125 | ) | $ | (1,473 | ) | ||||||
|
Net
loss available to common shareholders per share:
|
|||||||||||||||||
|
Basic
|
$ | (0.04 | ) | $ | (0.03 | ) | |||||||||||
|
Diluted
|
$ | (0.04 | ) | $ | (0.03 | ) | |||||||||||
|
Weighted
average shares outstanding:
|
|||||||||||||||||
|
Basic
and Diluted
|
54,831 | 54,831 | |||||||||||||||
|
Basic
and Diluted
|
54,831 | 54,831 | |||||||||||||||
See
accompanying notes to Unaudited Pro Forma Condensed Consolidated Financial
Statements.
F-9
CHINA
3C GROUP AND SUBSIDIARIES
UNAUDITED
PRO FORMA CONDENSED CONSOLIDATED STATEMENTS OF INCOME AND COMPREHENSIVE
INCOME
YEAR
ENDED DECEMBER 31, 2008
(IN
THOUSANDS)
|
Historical
|
Pro
Forma
|
PRO
|
|||||||||||||||
|
China
3C
|
Jinhua
|
Adjustments
|
FORMA
|
||||||||||||||
|
Net
sales
|
$ | 310,645 | $ | 10,483 | $ | (12 | ) |
(i)
|
$ | 321,116 | |||||||
|
Cost
of sales
|
262,003 | 6,821 | - | 268,824 | |||||||||||||
|
Gross
profit
|
48,642 | 3,662 | (12 | ) | 52,292 | ||||||||||||
|
Selling,
general and administrative expenses
|
14,133 | 1,197 | 1,453 |
(f)(i)
|
16,783 | ||||||||||||
|
Income
from operations
|
34,509 | 2,465 | (1,465 | ) | 35,509 | ||||||||||||
|
Other
(income) expense
|
|||||||||||||||||
|
Interest
income
|
(146 | ) | (4 | ) | 35 |
(g)
|
(115 | ) | |||||||||
|
Other
income
|
(1,150 | ) | (9 | ) | - | (1,159 | ) | ||||||||||
|
Other
expense
|
360 | 18 | - | 378 | |||||||||||||
|
Total
other (income) expense
|
(936 | ) | 5 | 35 | (896 | ) | |||||||||||
|
Income
before income taxes
|
35,445 | 2,460 | (1,500 | ) | 36,405 | ||||||||||||
|
Income
tax expenses (benefit)
|
8,611 | 601 | (375 | ) |
(h)
|
8,837 | |||||||||||
|
Net
income
|
26,834 | 1,859 | (1,125 | ) | 27,568 | ||||||||||||
|
Foreign
currency translation adjustments
|
3,400 | 29 | 3,429 | ||||||||||||||
|
Comprehensive
income
|
$ | 30,234 | $ | 1,888 | $ | (1,125 | ) | $ | 30,997 | ||||||||
|
Net
income available to common shareholders per share:
|
|||||||||||||||||
|
Basic
|
$ | 0.51 | $ | 0.52 | |||||||||||||
|
Diluted
|
$ | 0.51 | $ | 0.52 | |||||||||||||
|
Weighted
average shares outstanding:
|
|||||||||||||||||
|
Basic
|
52,674 | 52,674 | |||||||||||||||
|
Diluted
|
52,674 | 52,674 | |||||||||||||||
See
accompanying notes to Unaudited Pro Forma Condensed Consolidated Financial
Statements.
F-10
CHINA
3C GROUP AND SUBSIDIARIES
NOTES
TO UNAUDITED PRO FORMA CONDENSED CONSOLIDATED FINANCIAL STATEMENTS
(a)
To record the cash consideration paid for acquisition of 100% of the equity of
Jinhua.
(b) To
record the step-up to fair value of assets upon acquisition.
(c) To
allocate the purchase price to intangible assets on acquisition.
(d) To
eliminate the stockholders' equity of Jinhua.
(e) To
allocate the purchase price to goodwill.
(f) To
record amortization of acquired intangible assets.
(g) To
record the estimated decrease in interest income earned on the reduced
cash.
(h) To
adjust the total tax provision to reflect the tax benefit arising from
amortization of intangible assets and the decrease in interest
income.
(i) To
eliminate intercompany transactions between China 3C and Jinhua and give effect
to the acquisition as if it had been consummated on January 1,
2008.
F-11
Following
the acquisition of Jinhua, the Company began providing logistic service to
businesses in addition to its traditional business of resale and distribution of
third party products such as mobile phones, facsimile machines, DVD players,
stereos, speakers, MP3 and MP4 players, iPods, electronic dictionaries, CD
players, radio Walkmans and audio systems.
The
Company is engaged in the business of resale and distribution of third party
products and generates approximately 100% of our revenue from resale of items
such as mobile phones, facsimile machines, DVD players, stereos, speakers, MP3
and MP4 players, iPods, electronic dictionaries, CD players, radio Walkmans and
audio systems.
Note
2 - SUMMARY OF
SIGNIFICANT ACCOUNTING POLICIES
F-12
Basis of
Presentation
The
accompanying consolidated financial statements were prepared in conformity with
accounting principles generally accepted in the United States of America (“US
GAAP”). The Company’s functional currency is the Chinese Renminbi,
however the accompanying consolidated financial statements have been translated
and presented in United States Dollars.
Principles of
Consolidation
The
consolidated financial statements include the accounts of China 3C Group and its
wholly owned subsidiaries Capital, Wang Da, Yiwu, Joy & Harmony, Sanhe and
Jinhua and variable interest entity Zhejiang, collectively referred to as the
Company. All material intercompany accounts, transactions and profits were
eliminated in consolidation.
Currency
Translation
The
accounts of Zhejiang, Wang Da, Yiwu, Sanhe, Joy & Harmony and Jinhua were
maintained, and its financial statements were expressed, in Chinese Yuan
Renminbi (“CNY”). Such financial statements were translated into U.S. Dollars
(“USD”) in accordance with Accounting Standards Codification (“ASC”) 830-10,
“Foreign Currency Translation,” with the CNY as the functional currency.
According to ASC 830-10, assets and liabilities were translated at the ending
exchange rate, stockholders’ equity is translated at the historical rates
and income statement items are translated at the average exchange rate for the
period. The resulting translation adjustments are reported as other
comprehensive income in accordance with ASC 220, “Reporting Comprehensive
Income,” as a component of shareholders’ equity. Transaction gains and losses
are reflected in the income statement.
Use of
Estimates
The
preparation of financial statements in conformity with US GAAP requires
management to make estimates and assumptions that affect the reported amounts of
assets and liabilities and disclosure of contingent assets and liabilities at
the date of the financial statements and the reported amounts of revenues and
expenses during the reporting period. Actual results could differ from those
estimates.
Risks and
Uncertainties
The
Company is subject to substantial risks from, among other things, intense
competition associated with the industry in general, other risks associated with
financing, liquidity requirements, rapidly changing customer requirements,
limited operating history, foreign currency exchange rates and the volatility of
public markets.
Contingencies
Certain
conditions may exist as of the date the financial statements are issued, which
could result in a loss to the Company but which will only be resolved when one
or more future events occur or fail to occur. The Company’s management assesses
such contingent liabilities, and such assessment inherently involves an exercise
of judgment. In assessing loss contingencies related to legal proceedings that
are pending against the Company or unasserted claims that may result in such
proceedings, the Company’s management evaluates the perceived merits of any
legal proceedings or unasserted claims as well as the perceived merits of the
amount of relief sought or expected to be sought.
If the
assessment of a contingency indicates that it is probable that a material loss
has been incurred and the amount of the liability can be estimated, then the
estimated liability is accrued in the Company’s financial statements. If the
assessment indicates that a potential material loss contingency is not probable
but is reasonably possible, or is probable but cannot be estimated, then the
nature of the contingent liability, together with an estimate of the range of
possible loss if determinable and material would be disclosed.
Loss
contingencies considered to be remote by management are generally not disclosed
unless they involve guarantees, in which case the guarantee would be
disclosed.
F-13
Accounts
Receivable
The
Company maintains reserves for potential credit losses on accounts receivable.
Management reviews the composition of accounts receivable and analyzes
historical bad debts, customer concentrations, customer credit worthiness,
current economic trends and changes in customer payment patterns to evaluate the
adequacy of these reserves. Terms of the sales vary. Reserves are recorded
primarily on a specific identification basis. Allowance for doubtful debts were
$404 and $365 as of December 31, 2009 and 2008, respectively.
|
|
Additions
|
|||||||||||||||||||
|
Description
|
(1)
Charged
to
expenses
|
(2) Charged to
other
comprehensive
loss
|
Deductions
|
Balance at end
of year
|
||||||||||||||||
|
Allowance
for doubtful receivables 2009
|
365
|
$
|
37
|
$
|
84
|
(82
|
)
|
$
|
404
|
|||||||||||
|
Allowance
for doubtful receivables 2008
|
103
|
$
|
246
|
$
|
15
|
$
|
365
|
|||||||||||||
Inventories
Inventories
are valued at the lower of cost (determined on a weighted average basis) or
market. Management compares the cost of inventories with the market
value and allowance is made for writing down their inventories to market value,
if lower. As of December 31, 2009 and 2008, inventory consisted entirely of
finished goods valued at $6,764 and $8,971, respectively.
Property, Plant &
Equipment
Property,
plant and equipment are stated at cost. Expenditures for maintenance and repairs
are charged to earnings as incurred; additions, renewals and betterments are
capitalized. When property and equipment are retired or otherwise disposed of,
the related cost and accumulated depreciation are removed from the respective
accounts, and any gain or loss is included in operations. Depreciation of
property and equipment is provided using the straight-line method for
substantially all assets with estimated lives of:
|
Automotive
|
5
years
|
|
Office
Equipment
|
5
years
|
As of
December 31, 2009 and 2008, property and equipment consisted of the
following:
|
2009
|
2008
|
|||||||
|
Automotive
|
$
|
877
|
$
|
132
|
||||
|
Office
equipment
|
132
|
117
|
||||||
|
Leasehold
improvement
|
67
|
-
|
||||||
|
Plant
and Equipment
|
3
|
-
|
||||||
|
Sub
Total
|
1,079
|
249
|
||||||
|
Less:
accumulated depreciation
|
(800
|
)
|
(185
|
)
|
||||
|
Total
|
$
|
279
|
$
|
64
|
||||
Long-Lived
Assets
The
Company periodically evaluates the carrying value of long-lived assets to be
held and used in accordance with ASC 360 “Property, Plant and Equipment”
requires impairment losses to be recorded on long-lived assets used in
operations when indicators of impairment are present and the undiscounted cash
flows estimated to be generated by those assets are less than the assets’
carrying amounts. In that event, a loss is recognized based on the amount by
which the carrying amount exceeds the fair market value of the long-lived
assets. Losses on long-lived assets to be disposed of are determined in a
similar manner, except that fair market values are reduced for the cost of
disposal. Based on its review, the Company believes that, as of December 31,
2009 and December 31, 2008, there were no significant impairments of its
long-lived assets.
F-14
Fair Value of Financial
Instruments
ASC 825
“Financial Instruments” requires that the Company disclose estimated fair values
of financial instruments. The carrying amounts reported in the statements of
financial position for current assets and current liabilities qualifying as
financial instruments are a reasonable estimate of fair value.
Revenue
Recognition
In
accordance with Securities and Exchange Commission (“SEC”) Staff Accounting
Bulletin (“SAB”) 104, the Company recognizes revenues when there is persuasive
evidence of an arrangement, product delivery and acceptance have occurred, the
sales price is fixed and determinable, and collectability of the resulting
receivable is reasonably assured.
The
Company records revenues when title and the risk of loss pass to the
customer. Generally, these conditions occur on the date the customer
takes delivery of the product. Revenue is generated from sales of
China 3C products through two main revenue streams:
|
1.
|
Retail. Approximately
69% and 68% of the Company's revenue comes from sales to individual
customers at outlets installed inside department stores etc. (i.e. store
in store model) during 2009 and 2008 , respectively and is mainly achieved
through two broad categories:
|
|
a.
|
Purchase contracts.
Sales by purchase contracts have terms of thirty days from the transfer of
goods to the customer. Under this method, the Company delivers goods to
places designated by the customers and receives confirmation of delivery.
At that time, ownership and all risks associated to the goods are
transferred to the customers and payment is made within 30 days. The
Company relieves its inventory and recognizes revenue upon receipt of
confirmation from the customer.
|
|
b.
|
Point of sale transfer of
ownership. Under this method, the Company’s products are placed in
third party stores and sold by the Company’s sales people. Upon purchase
of the item by the customer, the Company relieves its inventory and
recognizes revenue related to that
item.
|
|
2.
|
Wholesale. Approximately
31% and 32% of the Company's revenue comes from wholesale during 2009 and
2008, respectively. Recognition of income in wholesales is based on the
contract terms. In 2009, the main contract terms on wholesale agreed that
payments be paid 15 days after receipt of goods and that ownership and all
risks associated with the goods are transferred to the customers on the
date of goods received and payments will be made 15 days
therefrom.
|
Sales
revenue is therefore recognized on the following basis:
|
1.
|
Store
in store model:
|
|
a.
|
For
goods sold under sales and purchase contracts, revenue is recognized when
goods are received by customers.
|
|
b.
|
For
goods at customer outlets which the Company’s sales people operate, and
inventory of goods is under joint control by the customers and the
Company, revenue is recognized at the point of sale to the end
buyer.
|
During
public holidays or department store celebration periods, we provide certain
sales incentives to retail customers to increase sales, such as gift giving and
price reductions. These are the only temporary incentives during the specified
periods. Sales made to our retail customers as a result of incentives are
immaterial as a percentage of total sales revenue.
F-15
|
2.
|
Wholesales:
|
|
a.
|
Revenue
is recognized at the date of goods are received by wholesale customers. We
operate our wholesale business by selling large volume orders to
second-tier distributors and large department stores. Revenues from
wholesale are recognized as net sales after confirmation with
distributors. Net sales already take into account revenue dilution as they
exclude inventory credit, discount fro early payment, product obsolescence
and return of products and other allowances. Net sales also take into
account the return of products in accordance with relevant laws and
regulations in China.
|
Return
policies
Our
return policy complies with China’s laws and regulations on consumer’s rights
and product quality. In accordance with Chinese law, consumers can return or
exchange used products within seven days only if the goods do not meet safety
and health requirements, endanger a person’s property, or do not meet the
advertised performance. If the conditions and requirements as set out in the
relevant laws and regulations are met, the retail stores are entitled to accept
a return of the goods from the consumer. In such cases, the Company shall accept
the returns unconditionally. Goods returned will be redirected to the production
factory or supplier who shall bear all losses on the returns in accordance the
laws and regulations. Consumer returns or exchanges of products that have not
been used, where the packaging has not been damaged, are honored if such return
or exchange is within seven days. If a consumer returns a product, the Company
must refund the invoice price to the consumer. The Company will then be
responsible for returning the goods to the production factory or supplier. At
that time the Company can recover the price based on the purchase and sale
contract with the producer or supplier. However, when goods are returned, the
Company loses the gross margin that it records when revenue is recognized,
regardless of whether the production factory or supplier takes the product back
or not.
The
return rights granted to wholesale customers are similar to the rights granted
to retail customers. Once wholesale customers purchase the products, they follow
the same return policy as retail customers. We do not honor any return from
wholesale customers other than if the products don’t meet laws and regulations
or quality requirements. If the wholesale customers have a high inventory level
or product obsolescence caused by lower market demands or other operational
issues, the wholesale customers bear their own losses. When a wholesale customer
returns products, the Company will return the products to the suppliers or
manufacturers. A sales return and allowance is recorded at the sales price.
Meanwhile, a purchase return and allowance entry is recorded at the invoice
price because the suppliers or manufacturers bear the losses. The net effect is
that the Company derecognizes the gross profit when a return takes place, but
does not record any loss on the cost of the returned item back to the supplier
or manufacturer.
In light
of the aforesaid PRC laws and regulations and the Company's arrangements with
suppliers, we do not provide an accrual for any estimated losses on subsequent
sale of the return of products. As a result we do not engage in assessing
levels of inventory in the distribution channel, product obsolescence and/or
introductions of new products, as none of those factors have any impact on us
with respect to estimating losses on subsequent sale of returned goods.
Third party market research report and consumer demand study is not used to make
estimates of goods returned.
Cost of
Sales
Cost of
sales consists of actual product cost, which is the purchase price of the
product less any discounts. Cost of sales excludes freight charges,
purchase and delivery costs, internal transfer, freight charges and the other
costs of the Company’s distribution network, which are identified in general and
administrative expenses.
General and Administrative
Expenses
General
and administrative expenses are comprised principally of payroll and benefits
costs for retail and corporate employees, occupancy costs of corporate
facilities, lease expenses, management fees, traveling expenses and other
operating and administrative expenses, including freight charges, purchase and
delivery costs, internal transfer freight charges and other distribution
costs.
F-16
Shipping and handling
fees
The
Company follows ASC 605-45, “Handling Costs, Shipping Costs”. The
Company does not charge its customers for shipping and handling. The Company
classifies shipping and handling fees as part of General and administrative
expenses which were $226 and $244 for 2009 and 2008, respectively.
Vendor
Discounts
The
Company has negotiated preferred pricing arrangements with certain vendors on
certain products. These arrangements are not contingent on any levels of volume
and are considered vendor discounts as opposed to rebates. The Company records
these discounts along with the purchase of the discounted items, resulting in
lower inventory cost and a corresponding lower cost of sales as the products are
sold.
Management fees paid to the
department stores under “store in store” model
Under the
“store in store” business operation model, the Company may pay management fees
to the department stores, which are in the form of service charges or “selling
at an allowance (discount)”. The management fees are accounted for (1) in the
form of service charges which are reflected in general and administrative
expenses, or (2) in the form of “selling at an allowance (discount)”, as a
deduction of sales, which means, the expenses are directly deducted at a certain
percentage on sales. Such management fees were $1,118,and $3,824 in general and
administrative expenses and deductions of $10,505 and $12,687 in sales for 2009
and 2008, respectively.
Share Based
Payment
The
Company adopted ASC 718-10, “Stock Compensation”, which addresses the accounting
for transactions in which an entity exchanges its equity instruments for goods
or services, with a primary focus on transactions in which an entity obtains
employee services in share-based payment transactions. ASC 718-10 is a revision
to SFAS No. 123, “Accounting for Stock-Based Compensation,” ASC 718-10 requires
measurement of the cost of employee services received in exchange for an award
of equity instruments based on the grant-date fair value of the award (with
limited exceptions). Incremental compensation costs arising from subsequent
modifications of awards after the grant date must be recognized.
Advertising
Advertising
expenses consist primarily of costs of promotion for corporate image and product
marketing and costs of direct advertising. The Company expenses all advertising
costs as incurred. Advertising expense was $405 and $360 for 2009 and 2008,
respectively.
Other
Income
Other
income was $163 and $1,150 for the years ended December 31, 2009 and 2008. Other
income consists of the following:
|
2009
|
2008
|
|||||||
|
Advertising
service income
|
$
|
103
|
$
|
649
|
||||
|
Repair
service income
|
30
|
29
|
||||||
|
Commission
income from China Unicom
|
30
|
470
|
||||||
|
Gain
on disposal of PPE
|
-
|
2
|
||||||
|
Total
other income
|
$
|
163
|
$
|
1,150
|
||||
Advertising
service income is the service fee we received from electronic product
manufacturers when we advertise their products in our retail locations.
Commission income from China Unicom is related to the sales of China Unicom’s
wireless service and products, i.e. rechargeable mobile phone
cards.
F-17
Income
Taxes
The
Company utilizes ASC 740 “Income Taxes”. Deferred income taxes are recognized
for the tax consequences in future years of differences between the tax bases of
assets and liabilities and their financial reporting amounts at each period end
based on enacted tax laws and statutory tax rates applicable to the periods in
which the differences are expected to affect taxable income. Valuation
allowances are established, when necessary, to reduce deferred tax assets to the
amount expected to be realized.
Basic and Diluted Earnings
per Share
Earnings
(loss) per share are calculated in accordance with ASC 260, “Earnings per
Share”. Basic earnings (loss) per share is based upon the weighted average
number of common shares outstanding. Diluted earnings (losses) per share is
based on the assumption that all dilutive convertible shares and stock options
were converted or exercised. Dilution is computed by applying the treasury stock
method. Under this method, options and warrants are assumed to be exercised at
the beginning of the period (or at the time of issuance, if later), and as if
funds obtained thereby were used to purchase common stock at the average market
price during the period. If convertible shares and stock options are
anti-dilutive, the impact of conversion is not included in the diluted net
income per share. Excluded from the calculation of diluted earnings per share
for 2009 and 2008 were 100,000 and 430,000 options, respectively, as they were
not dilutive.
Statement of Cash
Flows
In
accordance with ASC 230 “Statement of Cash Flows”, cash flows from the Company’s
operations are calculated based upon the functional currency, in our case the
CNY. As a result, amounts related to changes in assets and liabilities reported
on the statement of cash flows will not necessarily agree with the changes in
the corresponding balances on the balance sheet.
Supplemental Cash Flow
Disclosure
Cash from
operating, investing and financing activities exclude the effect of the
acquisition of Jinhua Baofa Logistics Limited (See Note 2).
Concentration of Credit
Risk
Financial
instruments that potentially subject the Company to concentrations of credit
risk are cash, accounts receivable and other receivables arising from its normal
business activities. The Company places its cash in what it believes to be
credit-worthy financial institutions. The Company has a diversified customer
base, most of which are in China. The Company controls credit risk related to
accounts receivable through credit approvals, credit limits and monitoring
procedures. The Company routinely assesses the financial strength of its
customers and, based upon factors surrounding the credit risk, establishes an
allowance, if required, for uncollectible accounts and, as a consequence,
believes that its accounts receivable credit risk exposure beyond such allowance
is limited.
Segment
Reporting
ASC 280,
“Segment Reporting” requires use of the “management approach” model for segment
reporting. The management approach model is based on the way a company’s
management organizes segments within the company for making operating decisions
and assessing performance. Reportable segments are based on products and
services, geography, legal structure, management structure, or any other manner
in which management disaggregates a company. The Company operates in five
segments (see Note 13).
Recent Accounting
Pronouncements
ASC 805 “Business Combinations”,
previously SFAS No. 141(R) “Business Combinations”. SFAS No. 141(R)
changes how a reporting enterprise accounts for the acquisition of a business.
SFAS 141(R) requires an acquiring entity to recognize all the assets
acquired and liabilities assumed in a transaction at the acquisition-date fair
value, with limited exceptions, and applies to a wider range of transactions or
events. SFAS 141(R) is effective for fiscal years beginning on or after
December 15, 2008 and early adoption and retrospective application is
prohibited. Effective January 1, 2009. ASC 805 revised SFAS No. 141, “Business
Combinations” and addresses the accounting and disclosure for identifiable
assets acquired, liabilities assumed, and noncontrolling interests in a business
combination. The Company adopted ASC 805. The Company accounted for the
acquisition of Jinhua in accordance with these standards.
ASC 810 “Consolidation”, previously
SFAS No. 160 “Noncontrolling Interests in Consolidated Financial
Statement”. This Statement amends ARB 51 to establish
accounting and reporting standards for the non-controlling (minority) interest
in a subsidiary and for the deconsolidation of a subsidiary. It clarifies that a
non-controlling interest in a subsidiary is an ownership interest in the
consolidated entity that should be reported as equity in the consolidated
financial statements. The Company adopted SFAS 160 on January 1, 2009. The
adoption of this statement had no effect on the Company’s consolidated financial
statements.
F-18
ASC 815 “Derivatives and Hedging”,
previously SFAS No. 161 “Disclosures about Derivative Instruments and Hedging
Activities”. SFAS No. 161 is intended to improve financial reporting
about derivative instruments and hedging activities by requiring enhanced
disclosures to enable investors to better understand their effects on an
entity’s financial position, financial performance, and cash flows. It is
effective for financial statements issued for fiscal years and interim periods
beginning after November 15, 2008, with early application encouraged. The
Standard also improves transparency about the location and amounts of derivative
instruments in an entity’s financial statements; how derivative instruments and
related hedged items are accounted for under Statement 133; and how derivative
instruments and related hedged items affect its financial position, financial
performance, and cash flows. The Company adopted SFAS 161 on January 1, 2009.
The adoption of this statement had no effect on the Company’s consolidated
financial statements.
ASC 825 “Financial Instruments”,
previously FSP SFAS No. 107-1 “Interim Disclosures about Fair Value of
Financial Instruments”. The guidance requires
that the fair value disclosures required for all financial instruments within
the scope of SFAS 107, “Disclosures about Fair Value of Financial Instruments”,
be included in interim financial statements. This FSP also requires entities to
disclose the method and significant assumptions used to estimate the fair value
of financial instruments on an interim and annual basis and to highlight any
changes from prior periods. FSP 107-1 was effective for interim periods ending
after June 15, 2009. The adoption of FSP 107-1 did not have a material
effect on the Company’s consolidated financial statements.
ASC 860 “Transfers and servicing”,
previously SFAS No. 166 “Accounting for Transfers of Financial Assets”.
SFAS No. 166 requires more information about transfers of financial assets and
where companies have continuing exposure to the risks related to transferred
financial assets. SFAS 166 is effective at the start of a company’s first fiscal
year beginning after November 15, 2009, or January 1, 2010 for companies
reporting earnings on a calendar-year basis. The adoption of this statement is
not expected to have a material effect on the Company’s financial
statements.
ASC 810 “Consolidation”, previously
SFAS NO. 167 “Amendments to FASB Interpretation No. 46(R)”. SFAS No. 167
will change how a company determines when an entity that is insufficiently
capitalized or is not controlled through voting (or similar rights) should be
consolidated. Under SFAS 167, determining whether a company is required to
consolidate an entity will be based on, among other things, an entity’s purpose
and design and a company’s ability to direct the activities of the entity that
most significantly impact the entity’s economic performance. SFAS 167 is
effective at the start of a company’s first fiscal year beginning after November
15, 2009, or January 1, 2010 for companies reporting earnings on a calendar-year
basis. The adoption of SFAS No. 167 will not have any impact on our financial
statements.
FASB Accounting Standards
Codification (Accounting Standards Update “ASU” 2009-1). In June 2009,
the FASB approved its Accounting Standards Codification
(“Codification”) as the single source of authoritative United States accounting
and reporting standards applicable for all non-governmental entities, with the
exception of the SEC and its staff. The Codification is effective for interim or
annual financial periods ending after September 15, 2009 and impacts our
financial statements as all future references to authoritative accounting
literature will be referenced in accordance with the Codification. There have
been no changes to the content of our financial statements or disclosures as a
result of implementing the Codification.
Note 3 – ADVANCES
TO SUPPLIERS
Advances
to suppliers represent advance payments to suppliers for the purchase of
inventory. As of December 31, 2009 and 2008, the Company had paid $2,370 and
$2,492, respectively, as advances to suppliers.
Note 4 - COMMON
STOCK
Joseph
Levinson joined the Board of Directors of the Company and became in charge of
Investor Relations for the Company in May 2007. As compensation for his
services, the Company agreed to pay Mr. Levinson a monthly grant during his term
of his services of 1,000 shares of the Company’s common stock. As of December
31, 2008, Mr. Levinson has received 20,000 shares of common stock. Mr. Levinson
resigned in January 2009.
F-19
Pursuant
to the terms of the Compensation Agreement dated as of November 27, 2008 between
Mr. Levinson and the Company, Mr. Levinson acknowledged that (1) the initial
annual grant of a stock option to purchase 300,000 shares of the Company’s
common stock, with an exercise price of $6.15 per share under the China 3C Group
2005 Plan, and (2) a subsequent annual grant of a stock option to purchase an
additional 300,000 shares of the Company's common stock, with an exercise price
of $1.82 under the China 3C Group 2005 Plan were not and will not be granted and
in consideration for his services as a Director accepted the issuance of 125,000
shares of the Company’s common stock.
On
January 15, 2009, the Company’s Board adopted the China 3C Group, Inc. 2008
Omnibus Securities and Incentive Plan (the “2008 Plan”). The 2008
Plan provides for the granting of distribution equivalent rights, incentive
stock options, non-qualified stock options, performance share awards,
performance unit awards, restricted stock awards, stock appreciation rights,
tandem stock appreciation rights, unrestricted stock awards or any combination
of the foregoing, as may be best suited to the circumstances of the particular
employee, director or consultant. Under the 2008 Plan 2,000,000
shares of the Company’s common stock are available for issuance for
awards. Each award shall remain exercisable for a term of ten (10)
years from the date of its grant. The price at which a share of common stock may
be purchased upon exercise of an option shall not be less than the closing sales
price of the common stock on the date such option is granted. The
2008 Plan shall continue in effect, unless sooner terminated, until the tenth
anniversary of the date on which it is adopted by the of Directors.
In April
and October 2009, the Company issued 1,997,272 shares of common stock under the
2008 Plan. The Company recognized $287,452 compensation expenses and there was
$1,216,060 of unrecognized compensation expense related to the nonvested stocks
as of December 31, 2009. The cost is expected to be recognized over a three year
period.
Note
5 - STOCK WARRANTS,
OPTIONS, AND COMPENSATION
Stock options— Options issued have a
ten-year life and were fully vested upon issuance. The option holder has no
voting or dividend rights. The grant price was equal the market price at the
date of grant. The Company records the expense of the stock options over the
related vesting period. The options were valued using the Black-Scholes
option-pricing model at the date of grant stock option pricing.
The
expected term represents the estimated average period of time that the options
remain outstanding. The expected volatility is based on the historical
volatility of the Company’s stock price. No dividend payouts were assumed, as
the Company has no plans to declare dividends during the expected term of the
stock options. The risk-free rate of return reflects the weighted average
interest rate offered for zero coupon treasury bonds over the expected term of
the options. Based upon this calculation and pursuant to ASC 718, the Company
recorded expenses of $337 for 2008 and none for 2009.
The
following summarizes the option activity for the year ended 2009.
|
Options
|
Weighted-Average
Exercise
Price
|
Weighted-
Average
Remaining
Contractual
Life
(Years)
|
Aggregate
Intrinsic
Value
|
|||||||||||||
|
Outstanding
at December 31, 2008
|
400,000
|
$
|
5.61
|
7.13
|
$
|
-
|
||||||||||
|
Granted
|
-
|
-
|
-
|
-
|
||||||||||||
|
Exercised
|
-
|
-
|
-
|
-
|
||||||||||||
|
Forfeited
|
(300,000)
|
6.15
|
6
|
-
|
||||||||||||
|
Outstanding
at December 31, 2009
|
100,000
|
5.61
|
7.13
|
-
|
||||||||||||
F-20
Outstanding
options by exercise price consisted of the following as of December 31,
2009.
|
Options
Outstanding
|
Options
Exercisable
|
|||||||||||||||||||||
|
Exercise
Price
|
Number
of
Shares
|
Weighted
Average
Remaining
Life
(Years)
|
Weighted
Average
Exercise
Price
|
Number
of
Shares
|
Weighted
Average
Exercise
Price
|
|||||||||||||||||
|
$
|
3.80
|
50,000
|
1.0
|
$
|
3.80
|
50,000
|
$
|
3.80
|
||||||||||||||
|
4.16
|
50,000
|
8.0
|
4.16
|
50,000
|
4.16
|
|||||||||||||||||
Note
6 - COMPENSATED
ABSENCES
Regulation
45 of the labor laws in the People’s Republic of China (PRC) entitles employees
to annual vacation leave after 1 year of service. In general all leave must be
utilized annually, with proper notification, any unutilized leave is
cancelled.
Note
7 - INCOME
TAXES
The
Company, through its subsidiaries, Zhejiang, Yiwu, Wang Da, Sanhe, Joy &
Harmony and Jinhua, is governed by the Income Tax Laws of the PRC.
The US
entity, China 3C Group, Inc is subject to the United States federal income tax
at a tax rate of 34%. The US entity has incurred net accumulated operating
losses of approximately $3,107 as of December 31, 2009 for income tax purposes.
The US entity does not conduct any operations and only incurs public company
expenses every year, such as legal fees, accounting fees, investor relations
expenses and filing fees. Therefore, it is more likely than not that all of the
Company’s deferred tax assets will not be realized. A 100% allowance was
recorded on the deferred tax asset for approximately $1,056.
The
Company’s policy is to recognize interest and penalties accrued on any
unrecognized tax benefits as a component of income tax expense. The Company did
not have any accrued interest or penalties associated with any unrecognized tax
benefits, nor were any interest expense recognized during 2009 and
2008.
Pursuant
to the PRC Income Tax Laws, from January 1, 2008, the Enterprise Income Tax
(“EIT) is calculated against the net income in a fiscal year at a statutory rate
of 25%.
During
the first two quarters of 2009, Yiwu, Wang Da, Sanhe and Joy & Harmony all
had net income and prepaid income taxes quarterly. During third and fourth
quarter 2009, the four subsidiary each incurred net loss and the amount of loss
of Yiwu, Wang Da , Sanhe exceeded the income recognized in the first two
quarters. Therefore, Yiwu, Wang Da and Sanhe each had a net loss for year 2009.
Pursuant to the PRC Income Tax Laws, EIT is settled on an annual basis but is
paid quarterly with adjustments either refunded or carried forward for five
years. Therefore, the prepaid income tax of $1,157 was recorded as tax
receivable in the consolidated balance sheet to offset future year’s tax
liabilities.
Income
tax expense consisted of the following for 2009 and 2008.
|
December
31, 2009
|
U.S.
|
State
|
International
|
Total
|
||||||||||||
|
Current
|
$
|
-
|
$
|
1
|
$
|
713
|
$
|
713
|
||||||||
|
Deferred
|
-
|
-
|
-
|
-
|
||||||||||||
|
Total
|
$
|
-
|
$
|
1
|
$
|
713
|
$
|
713
|
||||||||
|
December
31, 2008
|
U.S.
|
State
|
International
|
Total
|
||||||||||||
|
Current
|
$
|
-
|
$
|
1
|
$
|
8,610
|
$
|
8,611
|
||||||||
|
Deferred
|
-
|
-
|
-
|
-
|
||||||||||||
|
Total
|
$
|
-
|
$
|
1
|
$
|
8,610
|
$
|
8,611
|
||||||||
F-21
Reconciliation
of the differences between the statutory U.S. Federal income tax rate and the
effective rate is as follows for 2009 and 2008.
|
2009
|
2008
|
|||||||
|
US
statutory rate
|
34
|
%
|
34
|
%
|
||||
|
Tax
rate difference
|
(9
|
)%
|
(9
|
)%
|
||||
|
Increase
in valuation allowance
|
(3
|
)%
|
(1
|
)%
|
||||
|
Effective
rate
|
22
|
%
|
24
|
%
|
||||
Note
8 - COMMITMENTS
The
Company leases various office facilities under operating leases that terminate
through 2011. Rent expense for 2009 and 2008 was $518 and $274, respectively.
The future minimum obligations under these agreements are as follows as of
December 31, 2009:
|
2010
|
$
|
338
|
||
|
2011
|
$
|
80
|
||
|
2012
|
$
|
13
|
In
addition, as of December 31, 2009, the Company is committed to pay $101 under
various advertising agreements expiring within one year.
Note
9 - STATUTORY
RESERVE
In
accordance with the laws and regulations of the PRC, a wholly-owned Foreign
Invested Enterprise’s income, after the payment of the PRC income taxes, shall
be allocated to the statutory surplus reserves and statutory public welfare
fund. Prior to January 1, 2006, the proportion of allocation for reserve was 10
percent of the profit after tax to the surplus reserve fund and additional 5-10
percent to the public affair fund. The public welfare fund reserve was limited
to 50 percent of the registered capital. Effective January 1, 2006, there is now
only one fund requirement. The reserve is 10 percent of income after tax, not to
exceed 50 percent of registered capital.
Statutory
reserve funds are restricted for set off against losses, expansion of production
and operation or increase in register capital of the respective company.
Statutory public welfare fund is restricted to the capital expenditures for the
collective welfare of employees. These reserves are not transferable to the
Company in the form of cash dividends, loans or advances. These reserves are
therefore not available for distribution except in liquidation. As of December
31, 2009 and 2008, the Company had allocated $11,535 and $11,109, respectively,
to these non-distributable reserve funds.
Note
10 - OTHER
COMPREHENSIVE INCOME
The
detail of other comprehensive income as included in stockholders’ equity for
2009 and 2008 is as follows:
|
Foreign Currency
Translation
Adjustment
|
Total
Accumulated
Other
Comprehensive
Income
|
|||||||
|
Balance
at January 1, 2008
|
$
|
1,872
|
$
|
1,872
|
||||
|
Change
for 2008
|
3,400
|
3,400
|
||||||
|
Balance
at December 31, 2008
|
$
|
5,272
|
$
|
5,272
|
||||
|
Change
for 2009
|
(92)
|
(92)
|
||||||
|
Balance
at December 31, 2009
|
$
|
5,180
|
$
|
5,180
|
||||
F-22
Note 11 - CURRENT
VULNERABILITY DUE TO CERTAIN RISK FACTORS
The
Company’s operations are carried out in the PRC. Accordingly, the Company’s
business, financial condition and results of operations may be influenced by the
political, economic and legal environments in the PRC, by the general state of
the PRC’s economy. The Company’s business may be influenced by changes in
governmental policies with respect to laws and regulations, anti-inflationary
measures, currency conversion and remittance abroad, and rates and methods of
taxation, among other things.
Note
12 - MAJOR CUSTOMERS
AND CREDIT RISK
During
2009 and 2008, no customer accounted for more than 10% of the Company’s
sales. As of December 31, 2009 and 2008, the Company had no
individual customers or vendors that comprised more than 10% of the Company’s
accounts receivable or accounts payable.
Note
13 - SEGMENT
INFORMATION
We
separately operate and prepare accounting and other financial reports to
management for five major business organizations (Wang Da, Sanhe, Yiwu ,Joy
& Harmony and Jinhua). Each of the individual operating companies
corresponds to different product groups. Wang Da is mainly operating
mobile phones, Sanhe is mainly operating home appliances, Yiwu is mainly
operating office communication products, and Joy & Harmony is mainly
operating consumer electronics. Jinhua provides logistics to businesses in
Eastern China. All segments are accounted for using the same principals as
described in Note 2.
We have
identified four reportable segments required by ASC 280: (1) mobile phone, (2)
home electronics, (3) office communication product, (4) consumer electronics and
(5) Logistics.
The
following tables present summarized information by segment (in
thousands):
|
Year
Ended December 31, 2009
|
||||||||||||||||||||||||||||
|
Mobile
|
Home
|
Communication
|
Consumer
|
|||||||||||||||||||||||||
|
Phones
|
Electronics
|
Products
|
Electronics
|
Logistics
|
Other
|
Total
|
||||||||||||||||||||||
|
Sales,
net
|
$
|
57,432
|
$
|
51,674
|
$
|
42,064
|
$
|
51,489
|
$
|
5,573
|
$
|
258
|
$
|
208,490
|
||||||||||||||
|
Cost
of sales
|
52,144
|
44,758
|
39,246
|
47,239
|
3,860
|
229
|
187,476
|
|||||||||||||||||||||
|
Gross
profit
|
$
|
5,288
|
$
|
6,916
|
$
|
2,818
|
$
|
4,250
|
$
|
1,713
|
$
|
29
|
$
|
21,014
|
||||||||||||||
|
Income
from operations
|
(262
|
)
|
(741
|
)
|
(612
|
)
|
1,012
|
1,098
|
(1,103
|
)
|
(608
|
)
|
||||||||||||||||
|
Total
assets
|
$
|
13,761
|
$
|
11,525
|
$
|
12,353
|
$
|
15,777
|
$
|
4,776
|
$
|
36,204
|
$
|
94,396
|
||||||||||||||
|
Year
Ended December 31, 2008
|
||||||||||||||||||||||||
|
Mobile
Phone
|
Home
Electronics
|
Office
Communication
Product
|
Consumer
Electronics
|
Other
|
Total
|
|||||||||||||||||||
|
Sales,
net
|
$
|
102,935
|
$
|
70,243
|
$
|
63,370
|
$
|
74,096
|
$
|
-
|
$
|
310,644
|
||||||||||||
|
Cost
of sales
|
86,622
|
57,799
|
53,392
|
64,190
|
-
|
262,003
|
||||||||||||||||||
|
Gross
profit
|
16,313
|
12,444
|
9,978
|
9,906
|
-
|
48,641
|
||||||||||||||||||
|
Income
from operations
|
11,527
|
7,509
|
7,615
|
7,406
|
452
|
34,509
|
||||||||||||||||||
|
Total
assets
|
$
|
14,392
|
$
|
17,702
|
$
|
16,020
|
$
|
19,617
|
$
|
27,465
|
$
|
95,196
|
||||||||||||
F-23